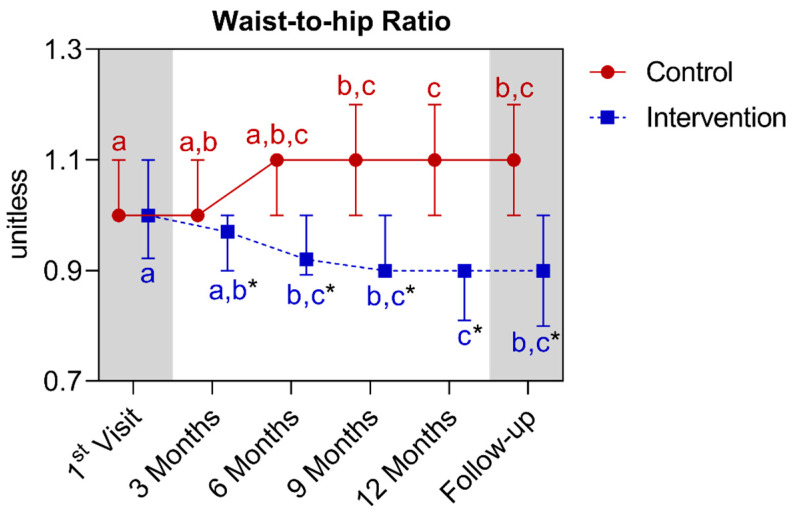
Figure 17.
The waist-to-hip ratios of participants in the control and intervention groups over the study period. Data are presented as median ± interquartile range. Within each group (same data line), values that do not share at least one superscript letter have a significant difference between them (Friedman test; Dunn’s post hoc test; p < 0.05). Within the same period, an asterisk indicates a significant difference between the values of each group (Kruskal–Wallis test; Dunn’s post hoc test; p < 0.05).

