

Abstract
Optogenetics provides precise control of cellular behavior through genetically encoded light-sensitive proteins. However, optimizing these systems to achieve the desired range of functionality often requires many design-build-test cycles, which is time-consuming and labor-intensive. To address this, we designed Lustro, a platform which integrates light stimulation with laboratory automation to enable high-throughput screening and characterization of optogenetic systems. Lustro utilizes an automation workstation equipped with an illumination device, a shaking device, and a plate reader. A robotic arm is programmed to move a microwell plate between the devices to stimulate optogenetic strains and measure their response. Here we present a protocol for using Lustro to characterize optogenetic systems for gene expression control in the budding yeast Saccharomyces cerevisiae. The protocol describes how to set up the components of Lustro, integrating an illumination device with an automation workstation, and provides instruction for programming the illumination device, plate reader, and robot.
SUMMARY:
This protocol describes how to use the automated platform Lustro for the high-throughput characterization of optogenetic systems in yeast.
INTRODUCTION:
Optogenetics is a powerful technique that uses light-sensitive proteins to control the behavior of cells with high precision1–3. However, prototyping optogenetic constructs and identifying optimal illumination conditions can be time consuming, which makes it difficult to optimize optogenetic systems4, 5. High-throughput methods to rapidly screen and characterize the activity of optogenetic systems can accelerate the design-build-test cycle for prototyping constructs and exploring their function.
We therefore developed Lustro, a laboratory automation technique designed for high-throughput screening and characterization of optogenetic systems that integrates a microplate reader, illumination device, and shaking device with an automation workstation6. Lustro combines automated culturing and light stimulation of cells in microwell plates (Figure 1), allowing for the rapid screening and comparison of different optogenetic systems. The Lustro platform is highly adapfig and can be generalized to work with other laboratory automation robots, illumination devices, plate readers, cell types, and optogenetic systems, including those responsive to different wavelengths of light.
Figure 1. Worktable layout and experimental workflow.

Screenshot of a sample worktable layout, denoting the movement of the sample plate in Lustro. The plate is moved by the robotic arm from a heater shaker (1) to the microplate reader (2), and then to the illumination device (3). Photographs are included in Supplementary Figure 1.
In this protocol, we demonstrate how to set up Lustro and use it to characterize an optogenetic system. We use optogenetic control of split transcription factors in yeast as an example system to illustrate the function and utility of the platform by probing the relationship between light inputs and the expression of a fluorescent reporter gene, mScarlet-I7. By following this protocol, researchers can streamline the optimization of optogenetic systems and accelerate the discovery of new strategies for the dynamic control of biological systems.
PROTOCOL:
1. Set up the automation workstation.
-
1.1.
Equip the automated workstation with a Robotic Gripper Arm (RGA) capable of moving microwell plates (see Figure 1).
-
1.2.
Install a microplate heater shaker into the automated workstation (Figure 1.1) with an automatic plate locking mechanism that allows access to the RGA.
-
1.3.
Secure a microplate reader adjacent to the automated workstation (Figure 1.2) that allows access to the RGA.
-
1.4.
Install a microplate illumination device (Figure 1.3) that allows easy access to the RGA, such as the optoPlate8 (as used here) or LITOS9.
2. Prepare the illumination device.
-
2.1.
Construct and calibrate the optoPlate (or other illumination device) according to established methods8, 10, 11.
-
2.2.
Use an adaptor on the illumination device that allows access to the RGA.
-
2.3.
Program the optoPlate from a spreadsheet input10 (or via a graphical interface12). Considerations for programming light stimulation programs are detailed below.
3. Design a light stimulation program.
Determine the light conditions that will be used for the sample plate and flash (load) them onto the illumination device.
-
3.1.
Enter desired light conditions (including light intensity, light start time, pulse length, pulse number, and interpulse duration) into a spreadsheet and flash onto the optoPlate (as described in the following github repository: github.com/mccleanlab/Optoplate-96). Note when programming the light conditions into the illumination device that the sample plate will not receive illumination while in the microplate reader or on the heater shaker. The duration and frequency of these events may need to be optimized for specific experimental needs.
-
3.2.
Include dark conditions for each strain for proper background measurements to be taken.
-
3.3.
Use high light intensity for initial characterization experiments to determine functionality of transformants6. Note that light intensity should be optimized for more sensitive experiments as excessive light is phototoxic to yeast13.
4. Prepare the microplate reader.
Configure the microplate reader to measure the quantity of interest prior to performing experiments. In the example presented here, we configure the microplate reader to measure the amount of fluorescence from a reporter expressed by the strain of interest. Outputs such as luminescence or optical density can also be used, depending on experimental needs.
-
4.1.
Grow the strain of interest (and a nonfluorescent control) in synthetic complete (SC) media14 (or another low fluorescence media) to the highest cell density that will be measured, pipette into a glass-bottom black-walled microwell plate, and measure to determine optimal microplate reader settings. Verify the plate dimensions are correctly entered to ensure accurate readings are taken. Measure the plate from below to ensure accuracy.
-
4.2.
Consult fpbase.org to determine approximate absorption and emission spectra of the target fluorescent protein15.
-
4.3.
Determine the z-value (the distance between the plate and reader) for the plate by performing a z-scan on wells with the fluorescent strain and well with the nonfluorescent strain. Select the z-values that yield the highest signal-to-noise ratio.
-
4.4.
Optimize absorption and emission spectra by using the absorption scan and emission scan on the fluorescent and nonfluorescent strains to determine the optimal signal-to-noise ratio.
-
4.5.
Measure the fluorescent strain with the gain set to optimal to determine the highest optical gain that can be used without returning an overflow measurement error. This optical gain should be manually set across experiments with a given strain to ensure consistency in results.
-
4.6.
Prepare a measurement script (see Figure 2) in the microplate reader software. This measurement script configures the instrument to measure the optical density of the cultures and fluorescence spectra of any fluorescent proteins to be measured. Measure optical density of strains at 600 nm unless they produce red fluorescent proteins. If the strains express a red fluorescent protein, measure optical density at 700 nm to avoid bias16.
-
4.7.
Set the script to maintain an internal incubation temperature during measurements of 30 °C.
-
4.8.
Set the measurement script to export the data into a spreadsheet (or ASCII files, if desired).
Figure 2. Plate reader measurement script.
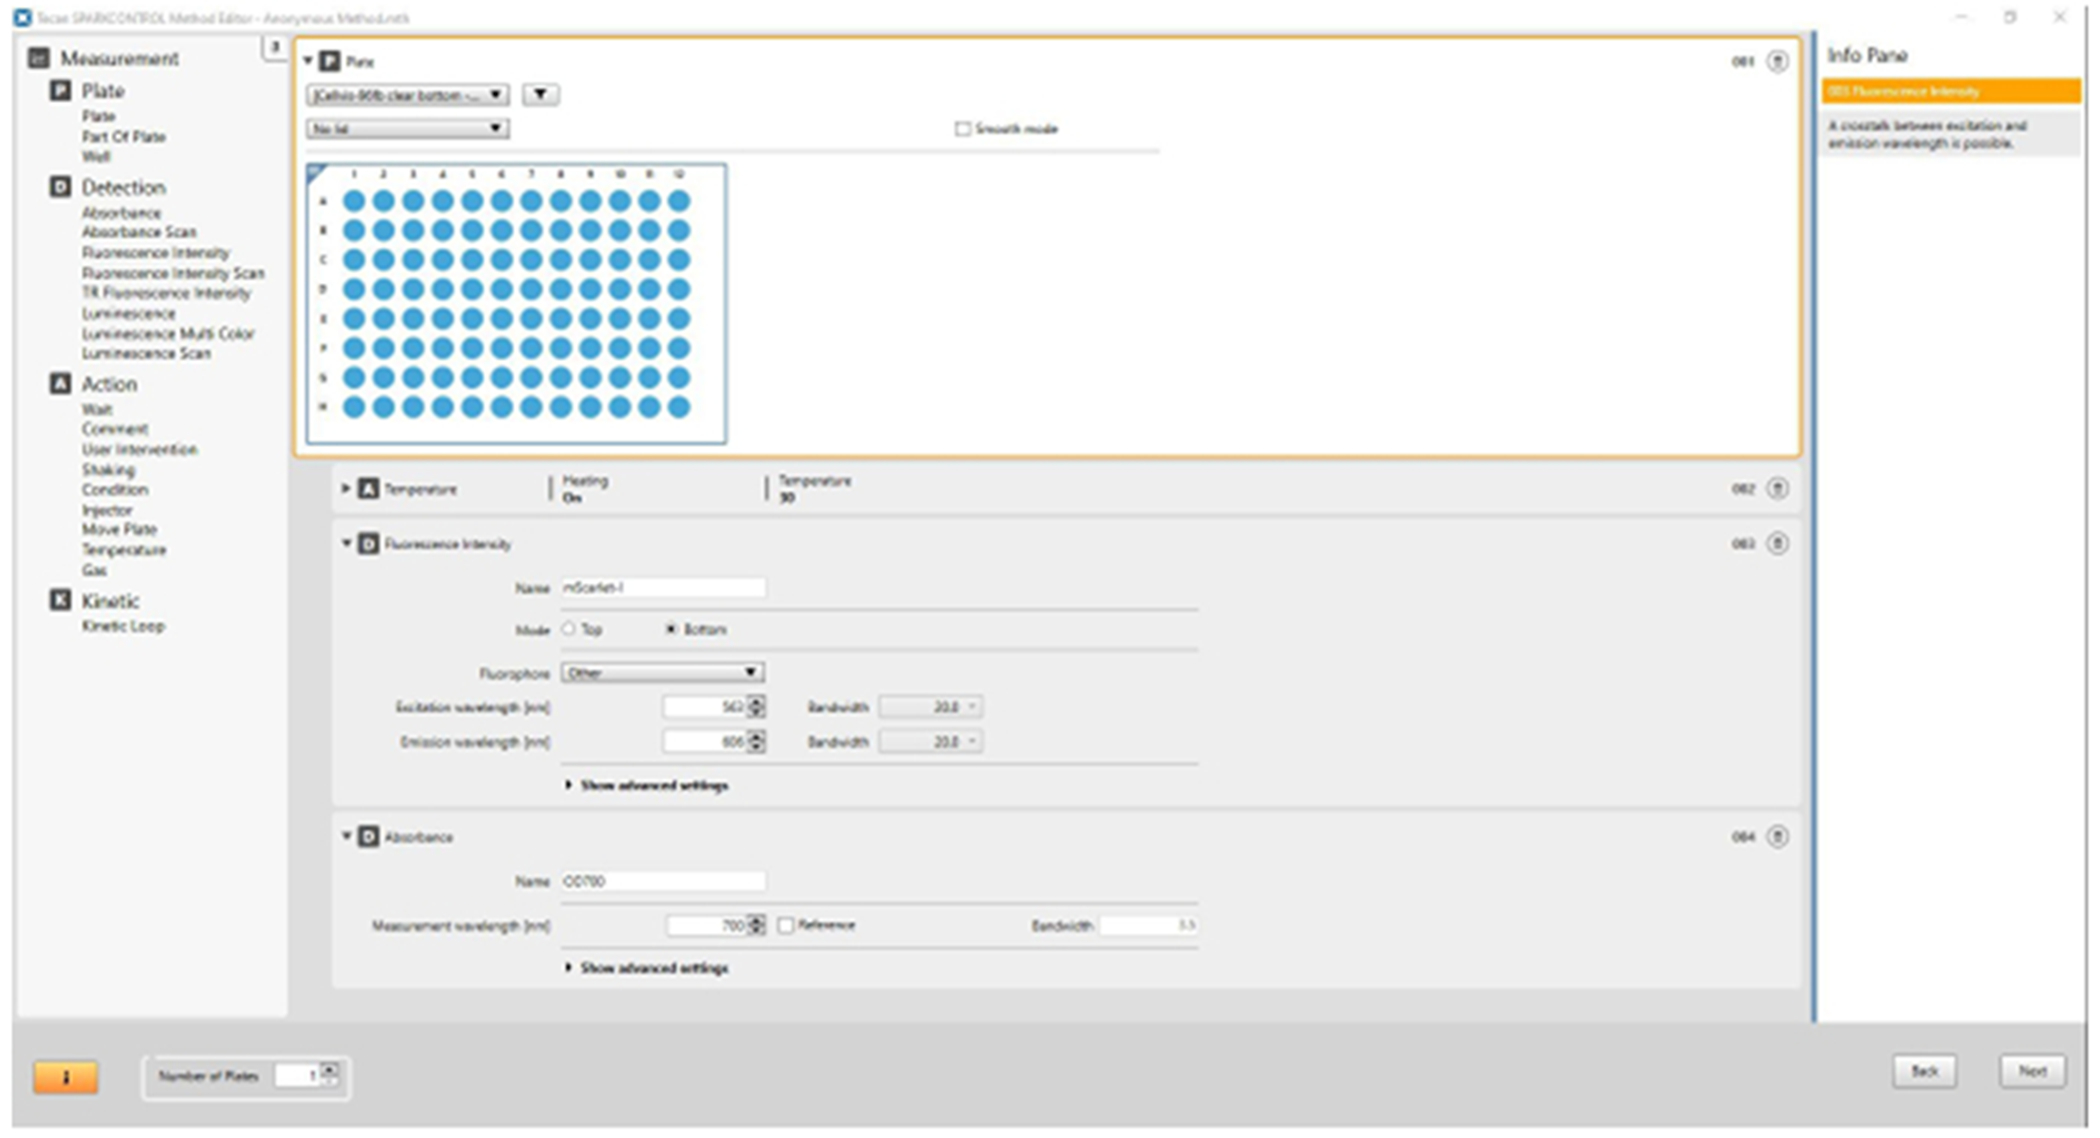
Sample screenshot of a plate reader script setting the microplate reader to incubate at 30 °C and record fluorescence and optical density measurements.
5. Program the robot.
Set up the worktable definition in the automated workstation software according to the physical layout of the carriers (e.g., heater shakers, nest platforms, illumination devices, etc.) and the labware (i.e., the 96-well plate). Prepare a script on the automation workstation software to perform light induction and measurement (see Figure 3) as follows.
Figure 3. Automated workstation script.

Sample screenshot of an automated workstation script for Lustro. The script starts a timer, ensures the interior light is turned off, sets a loop counting variable to an initial value of 0, and sets the heater shaker to incubate at 30 °C. Within each loop, the plate is locked, shaken for 1 minute, moved to the plate reader and measured, then moved to the illumination device and the robot is set to wait for the remainder of the 30-minute loop interval. At the end of this time, the loop counter variable is increased by one and the loop is repeated.
-
5.1.
Turn off any internal sources of illumination to avoid background activation of optogenetic systems.
-
5.2.
Set the heater shaker to 30 °C. The plate will be at ambient temperature (22 °C) while not on the heater shaker.
-
5.3.
Use loops, a timer, and a loop counting variable to repeat the steps of inducing and measuring the cells over regular intervals.
-
5.4.
Prior to recording any measurements, shake the sample plate to ensure all cells are suspended (60 s at 1,000 rpm with a 2 mm orbital is sufficient to resuspend S288C S. cerevisiae cells) to avoid bias in measurement.
-
5.5.
The robot arm then moves the sample plate to the microplate reader and removes the lid (to avoid bias in optical density measurement). Control software will automatically remove (and replace) the lid to the designated position if the microplate reader carrier is defined as not allowing lids.
-
5.6.
Run the microplate reader measurement script (described in step 4).
-
5.7.
The robot arm then replaces the lid to the sample plate and moves the plate to the illumination device.
-
5.8.
Set the script to wait until the timer reaches 30 min (multiplied by the loop counting variable), and then repeat the whole loop 48 times (for a 24-hour experiment).
-
5.9.
Run an empty plate through the steps of the script loop described above several times to troubleshoot potential errors and ensure that the carrier and labware definitions are set properly and that the RGA can correctly and precisely pick up and place the plate at each carrier site.
-
5.10.
Set up user alerts to notify the user in the case of any instrument state changes (such as errors).
6. Set up the sample plate.
Grow up the strains of interest and load them into a glass-bottom black-walled 96-well plate.
-
6.1.
Grow yeast strains on rich media plates, such as YPD17 agar. Include a nonfluorescent (negative) control. Yeast strains used here (see Table of Materials) grow well between 22 °C - 30 °C and in a range of standard yeast media.
-
6.2.
Pick colonies from these plates and grow them overnight in 3 mL SC14 (or another low fluorescence media, such as LFM18) at 30 °C on a roller drum. Keep cultures in the dark (or under a non-responsive wavelength of light, such as red light for blue light-responsive systems) during incubation and for downstream processing steps.
-
6.3.
Measure the optical density of the overnight cultures by diluting 200 μL of each into 1 mL (final volume) SC and measuring the optical density at 600 nm (OD600) with a spectrophotometer or microplate reader.
-
6.4.
Dilute each overnight culture to OD600=0.1 in glass culture tubes. Where higher strain-testing throughput is desired, automated dilutions can be performed in microwell plates.
-
6.5.
Pipette the diluted cultures into the 96-well plate. Perform each condition in triplicate (i.e., three identical wells with the same strain and light condition) to determine technical variation. Include blank media and nonfluorescent cells as negative controls for determining background fluorescence and optical density.
-
6.6.
Incubate the plate at 30 °C, shaking for 5 hours before beginning the light induction experiment. Dilution amounts and incubation times may need to be optimized for specific strains and experimental conditions.
| Material | Source | Catalog # |
|---|---|---|
| 96-well glass bottom plate with #1.5 cover glass | Cellvis | P96-1.5H-N |
| BioShake 3000-T elm (heater shaker) | QINSTRUMENTS | |
| Fluent Automation Workstation | Tecan | |
| LITOS (alternative illumination device) | Hohener, et al. Scientific Reports. 2022 | |
| optoPlate-96 (illumination device) | Bugaj, et al. Nature Protocols. 2019 | |
| Spark (plate reader) | Tecan | |
| Synthetic Complete media | SigmaAldrich | Y1250 |
| Tecan Connect (user alert app) | Tecan | |
| yMM1734 (BY4741 Matα ura3Δ0::5′ Ura3 homology, pRPL18B-Gal4DBD-eMagA-tENO1, pRPL18B-eMagB-Gal4AD-tENO1, pGAL1-mScarlet-I-tENO1, Ura3, Ura 3′ homology his3D1 leu2D0 lys2D0 gal80::KANMX gal4::spHIS5) | Harmer, et al. ACS Syn Bio. 2023 | |
| yMM1763 (BY4741 Matα ura3Δ0::5′ Ura3 homology, pRPL18B-Gal4DBD-CRY2(535)-tENO1, pRPL18B-Gal4AD-CIB1-tENO1, pGAL1-mScarlet-I-tENO1, Ura3, Ura 3′ homology his3D1 leu2D0 lys2D0 gal80::KANMX gal4::spHIS5) | Harmer, et al. ACS Syn Bio. 2023 | |
| yMM1765 (BY4741 Matα ura3Δ0::5′ Ura3 homology, pRPL18B-Gal4DBD-eMagA-tENO1, pRPL18B-eMagBM-Gal4AD-tENO1, pGAL1-mScarlet-I-tENO1, Ura3, Ura 3′ homology his3D1 leu2D0 lys2D0 gal80::KANMX gal4::spHIS5) | Harmer, et al. ACS Syn Bio. 2023 | |
| YPD Agar | SigmaAldrich | Y1500 |
7. Perform the experiment.
-
7.1.
Load the sample plate onto the heater shaker and start the automation script (described in step 5).
-
7.2.
Start the light stimulation program (described in step 3) once the first measurement on the plate reader has been taken.
-
7.3.
If the automation workstation isn’t located in a dark room, cover it in a blackout curtain to prevent background illumination.
8. Analyze the data.
Use Python or another programming language to process the data exported by the microplate reader during the experiment.
-
8.1.
Prepare a spreadsheet map for the experiment. This map should correspond to the 8x12 layout of the 96-well plate and include the names of the strains being measured in one grid and descriptions of the light conditions used in another grid.
-
8.2.
Use a Python script (or other preferred coding language) to analyze the data. Read the map spreadsheet into an array with the strain names and condition names for each well of the plate. Find sample code here: https://github.com/mccleanlab/Lustro. Alternatively, use an app that can parse data from a variety of plate readers19.
-
8.3.
Read the data from the experiment spreadsheet export into another array.
-
8.4.
Plot the optical density values and fluorescence values of each strain and condition versus time (as shown in Figure 4).
-
8.5.
Use the optical density plots to determine when cultures are in the exponential growth phase or reach saturation and can thus be used to select appropriate timepoints for comparing fluorescence measurements between strains or conditions (see Figure 5).
Figure 4. Induction time course.

Sample light induction time course data from a Gal4BD-eMagA/eMagB-Gal4AD split transcription factor strain with a pGAL1-mScarlet-I reporter (yMM17346). Fluorescence of mScarlet-I7 is measured at 563 nm excitation and 606 nm emission with an optical gain of 130. Light intensity is 125 μW/cm2 and error bars represent standard error of triplicate samples. Vertical red dotted line shows when cultures reach saturation. (A) Fluorescence values from the strain over time. Light patterns (as indicated) were repeated for the full duration of the experiment shown. Inset shows that light pulse times are interspersed with dark interpulse times, repeated over the course of the experiment. (B) Optical density (measured at 700 nm) values for the experiment shown in (A).
Figure 5. Comparison of different optogenetic systems.

Comparison of different light induction programs between CRY2(535)/CIB1 and eMagA/eMagBM split transcription factor strains with pGAL1-mScarlet-I reporters (yMM1763 and yMM17656, respectively). Fluorescence of mScarlet-I7 is measured at 563 nm excitation and 606 nm emission with an optical gain of 130. Light intensity used is 125 μW/cm2, except where otherwise noted. Error bars represent standard error of triplicate samples (indicated as dots). Fluorescence values shown were recorded 10 hours into induction.
REPRESENTATIVE RESULTS:
Figure 4A shows the fluorescence values recorded over time from an optogenetic strain (with the expression of a fluorescent reporter driven by a light-inducible split transcription factor) induced by different light conditions. The duty cycle (percentage of the time the light is on) of the light stimulation is proportional to the overall level of fluorescence measured. Figure 4B shows the corresponding OD700 values for the same experiment. The consistency of the optical density readings between different light conditions indicates that the experimental technique does not result in significant differences in growth rate between different light conditions. Measuring fluorescence and optical density over time can lend more insight into how optogenetic systems respond to different light stimulation programs compared to techniques that only record the output at a single time point. This time-course data can also be used to inform which time point measurements should be used for comparing different strains and conditions. Figure 5 shows a single time point (measured at 10 hours into light induction) comparing two different optogenetic strains induced by different light stimulation programs. These strains use a light-inducible split transcription factor to drive expression of a fluorescent reporter. Varying light pulse intensity, period, and duty cycle elicit different responses in the strains.
DISCUSSION:
The Lustro protocol provided here automates culturing, illumination, and measurement to allow for high-throughput screening and characterization of optogenetic systems6. This is accomplished by integrating an illumination device, microplate reader, and shaking device in an automation workstation. In this protocol we specifically demonstrate the utility of Lustro for screening different optogenetic constructs integrated into the yeast S. cerevisiae and comparing light induction programs.
This protocol emphasizes several crucial steps that are integral to the effective utilization of Lustro. It is essential to carefully design customized light programs that align with the specific kinetics of the optogenetic construct under investigation. Additionally, precise calibration of the plate reader to achieve the desired output is necessary to obtain reliable measurements. Thorough dry runs of the experiments on the robot, including adjusting the timings as necessary to ensure proper synchronization with the light programs, are critical to ensure the script runs properly.
The sample protocol detailed here describes comparing a light-inducible split transcription factor driving expression of a fluorescent reporter to a nonfluorescent control over a range of light stimulation conditions. We measure fluorescence from each well in the plate at 30-minute intervals with one minute on the heater shaker prior to measurement. As described and implemented in this protocol, Lustro is suitable for use directly with blue light-responsive optogenetic systems integrated into many non-adherent cell types, including bacteria and other yeasts. However, the protocol is easily extended to different cell types, optogenetic systems, and experimental designs with small modifications. Minor changes to the plate reader settings would allow measurement of outputs other than fluorescence, such as bioluminescence. Measurements could be taken more frequently where finer temporal resolution is needed. Incubation on the heater shaker could be repeated more frequently as needed for specific cell types where shaking and temperature control are critical. Gas and environmental control, for example through an incubated hotel, would allow incorporation of mammalian cell lines. The iteration of Lustro described here uses specific instrumentation; however, the Lustro platform can be easily adapted to work with other laboratory automation robots or microplate readers. Illumination devices, such as the LPA26 or LITOS9, could be substituted for the optoPlate to stimulate different optogenetic systems. A particularly exciting future modification of the Lustro platform would be to incorporate liquid handling to facilitate automated dilutions for continuous culture applications. This would also allow Lustro to be adapted for cybergenetic feedback control, where real-time measurements inform changes in light or culture conditions to reach or maintain a desired response5, 21, 22.
High-throughput techniques are important for optimizing and taking advantage of the dynamic nature of optogenetic systems. Lustro overcomes many of the limitations of existing protocols. For example, while bioreactor-based optogenetics techniques allow for constant readout and culturing conditions, they are limited by low throughput23–26. The optoPlateReader27 device shows great promise for performing real-time optogenetics experiments in microwell plates, but currently suffers from low throughput due to the high number of replicates needed to obtain reliable results and doesn’t provide access to continuous culturing. Lustro is able to perform high-throughput screening of optogenetic systems to characterize their dynamic activity. Nevertheless, some limitations of the Lustro protocol remain. Intermittent shaking in Lustro does cause a small lag in growth for yeast cells6, but that could be remedied by adapting an illumination device to shake. An additional limitation of the Lustro system is that the sample plate is not incubated while on the illumination device and is maintained at ambient temperature (22 °C). While the small volume of each sample allows for high-throughput screens to be performed, it is possible that additional optimization of the illumination steps would need to be undertaken when scaling to larger reaction volumes for bioproduction or other applications28, 29.
Overall, Lustro enables the rapid development and testing of optogenetic systems through high-throughput screening and precise light control. This automated approach allows for efficient characterization and comparison of different optogenetic constructs under various induction conditions, leading to faster iteration and refinement of these systems. With its adaptability to different cell types, optogenetic tools, and automation setups, Lustro paves the way for advancements in the field of optogenetics, facilitating the exploration of dynamic gene expression control and expanding possibilities for studying biological networks and engineering cellular behavior.
Supplementary Material
Supplementary Figure 1. Representative images of the devices used in Lustro. Picture of the Lustro setup and zoomed-in images of the devices used. The robotic arm moves the sample plate from the heater shaker to the plate reader, and then to the illumination device in a cycle over the course of the experiment. Components are numbered with a legend on the side.
ACKNOWLEDGMENTS:
This work was supported by National Institutes of Health grant R35GM128873 and National Science Foundation grant 2045493 (awarded to M.N.M.). Megan Nicole McClean, PhD holds a Career Award at the Scientific Interface from the Burroughs Wellcome Fund. Z.P.H. was supported by an NHGRI training grant to the Genomic Sciences Training Program 5T32HG002760. We acknowledge fruitful discussions with McClean lab members and in particular we are grateful to Kieran Sweeney for providing comments on the manuscript.
Footnotes
A complete version of this article that includes the video component is available at http://dx.doi.org/10.3791/65686.
DISCLOSURES:
The authors have nothing to disclose.
REFERENCES:
- 1.Pérez ALA et al. Optogenetic strategies for the control of gene expression in yeasts. Biotechnology Advances. 54, 107839, doi: 10.1016/j.biotechadv.2021.107839 (2022). [DOI] [PubMed] [Google Scholar]
- 2.Lan T-H, He L, Huang Y, Zhou Y Optogenetics for transcriptional programming and genetic engineering. Trends in Genetics. 38 (12), 1253–1270, doi: 10.1016/j.tig.2022.05.014 (2022). [DOI] [PMC free article] [PubMed] [Google Scholar]
- 3.Olson EJ, Tabor JJ Optogenetic characterization methods overcome key challenges in synthetic and systems biology. Nature Chemical Biology. 10 (7), 502–511, doi: 10.1038/nchembio.1559 (2014). [DOI] [PubMed] [Google Scholar]
- 4.Hallett RA, Zimmerman SP, Yumerefendi H, Bear JE, Kuhlman B Correlating in vitro and in vivo Activities of Light Inducible Dimers: a Cellular Optogenetics Guide. ACS synthetic biology. 5 (1), 53–64, doi: 10.1021/acssynbio.5b00119 (2016). [DOI] [PMC free article] [PubMed] [Google Scholar]
- 5.Scott TD, Sweeney K, McClean MN Biological signal generators: integrating synthetic biology tools and in silico control. Current Opinion in Systems Biology. 14, 58–65, doi: 10.1016/j.coisb.2019.02.007 (2019). [DOI] [PMC free article] [PubMed] [Google Scholar]
- 6.Harmer ZP, McClean MN Lustro: High-Throughput Optogenetic Experiments Enabled by Automation and a Yeast Optogenetic Toolkit. ACS Synthetic Biology. doi: 10.1021/acssynbio.3c00215 (2023). [DOI] [PMC free article] [PubMed] [Google Scholar]
- 7.Bindels DS et al. mScarlet: a bright monomeric red fluorescent protein for cellular imaging. Nature Methods. 14 (1), 53–56, doi: 10.1038/nmeth.4074 (2017). [DOI] [PubMed] [Google Scholar]
- 8.Bugaj LJ, Lim WA High-throughput multicolor optogenetics in microwell plates. Nature Protocols. 14 (7), 2205–2228, doi: 10.1038/s41596-019-0178-y (2019). [DOI] [PubMed] [Google Scholar]
- 9.Höhener TC, Landolt AE, Dessauges C, Hinderling L, Gagliardi PA, Pertz O LITOS: a versatile LED illumination tool for optogenetic stimulation. Scientific Reports. 12 (1), 13139, doi: 10.1038/s41598-022-17312-x (2022). [DOI] [PMC free article] [PubMed] [Google Scholar]
- 10.Grødem EO, Sweeney K, McClean MN Automated calibration of optoPlate LEDs to reduce light dose variation in optogenetic experiments. BioTechniques. 69 (4), 313–316, doi: 10.2144/btn-2020-0077 (2020). [DOI] [PMC free article] [PubMed] [Google Scholar]
- 11.Dunlop MJ A Supplemental Guide to Building the optoPlate-96. at <https://www.protocols.io/view/a-supplemental-guide-to-building-the-optoplate-96-b2vwqe7e> (2021). [Google Scholar]
- 12.Thomas OS, Hörner M, Weber W A graphical user interface to design high-throughput optogenetic experiments with the optoPlate-96. Nature Protocols. 15 (9), 2785–2787, doi: 10.1038/s41596-020-0349-x (2020). [DOI] [PubMed] [Google Scholar]
- 13.Robertson JB, Davis CR, Johnson CH Visible light alters yeast metabolic rhythms by inhibiting respiration. Proceedings of the National Academy of Sciences of the United States of America. 110 (52), 21130–21135, doi: 10.1073/pnas.1313369110 (2013). [DOI] [PMC free article] [PubMed] [Google Scholar]
- 14.Synthetic Complete (SC) Medium. Cold Spring Harbor Protocols. 2016 (11), pdb.rec090589, doi: 10.1101/pdb.rec090589 (2016). [DOI] [Google Scholar]
- 15.Lambert TJ FPbase: a community-editable fluorescent protein database. Nature Methods. 16 (4), 277–278, doi: 10.1038/s41592-019-0352-8 (2019). [DOI] [PubMed] [Google Scholar]
- 16.Hecht A, Endy D, Salit M, Munson MS When Wavelengths Collide: Bias in Cell Abundance Measurements Due to Expressed Fluorescent Proteins. ACS Synthetic Biology. 5 (9), 1024–1027, doi: 10.1021/acssynbio.6b00072 (2016). [DOI] [PubMed] [Google Scholar]
- 17.YPD media. Cold Spring Harbor Protocols. 2010 (9), pdb.rec12315, doi: 10.1101/pdb.rec12315 (2010). [DOI] [Google Scholar]
- 18.Low-Fluorescence Yeast Nitrogen Base without Riboflavin and Folic Acid Medium (LFM) (10×). Cold Spring Harbor Protocols. 2016 (11), pdb.rec090662, doi: 10.1101/pdb.rec090662 (2016). [DOI] [Google Scholar]
- 19.Csibra E, Stan G-B Parsley: a web app for parsing data from plate readers. doi: 10.5281/zenodo.8072500. Zenodo. (2023). [DOI] [PMC free article] [PubMed] [Google Scholar]
- 20.Gerhardt KP et al. An open-hardware platform for optogenetics and photobiology. Scientific Reports. 6 (1), 35363, doi: 10.1038/srep35363 (2016). [DOI] [PMC free article] [PubMed] [Google Scholar]
- 21.Gutiérrez Mena J, Kumar S, Khammash M Dynamic cybergenetic control of bacterial co-culture composition via optogenetic feedback. Nature Communications. 13, 4808, doi: 10.1038/s41467-022-32392-z (2022). [DOI] [PMC free article] [PubMed] [Google Scholar]
- 22.Milias-Argeitis A et al. In silico feedback for in vivo regulation of a gene expression circuit. Nature Biotechnology. 29 (12), 1114–1116, doi: 10.1038/nbt.2018 (2011). [DOI] [PMC free article] [PubMed] [Google Scholar]
- 23.Milias-Argeitis A, Rullan M, Aoki SK, Buchmann P, Khammash M Automated optogenetic feedback control for precise and robust regulation of gene expression and cell growth. Nature Communications. 7, 12546, doi: 10.1038/ncomms12546 (2016). [DOI] [PMC free article] [PubMed] [Google Scholar]
- 24.Bertaux F et al. Enhancing bioreactor arrays for automated measurements and reactive control with ReacSight. Nature Communications. 13 (1), 3363, doi: 10.1038/s41467-022-31033-9 (2022). [DOI] [PMC free article] [PubMed] [Google Scholar]
- 25.Benisch M, Benzinger D, Kumar S, Hu H, Khammash M Optogenetic closed-loop feedback control of the unfolded protein response optimizes protein production. Metabolic Engineering. doi: 10.1016/j.ymben.2023.03.001 (2023). [DOI] [PubMed] [Google Scholar]
- 26.Melendez J, Patel M, Oakes BL, Xu P, Morton P, McClean MN Real-time optogenetic control of intracellular protein concentration in microbial cell cultures. Integrative Biology. 6 (3), 366–372, doi: 10.1039/c3ib40102b (2014). [DOI] [PubMed] [Google Scholar]
- 27.Datta S et al. High-throughput feedback-enabled optogenetic stimulation and spectroscopy in microwell plates. 2022.07.13.499906, doi: 10.1101/2022.07.13.499906 (2022). [DOI] [PMC free article] [PubMed] [Google Scholar]
- 28.Pouzet S et al. Optogenetic control of beta-carotene bioproduction in yeast across multiple lab-scales. Frontiers in Bioengineering and Biotechnology. 11, 1085268, doi: 10.3389/fbioe.2023.1085268 (2023). [DOI] [PMC free article] [PubMed] [Google Scholar]
- 29.Pouzet S, Banderas A, Le Bec M, Lautier T, Truan G, Hersen P The Promise of Optogenetics for Bioproduction: Dynamic Control Strategies and Scale-Up Instruments. Bioengineering. 7 (4), 151, doi: 10.3390/bioengineering7040151 (2020). [DOI] [PMC free article] [PubMed] [Google Scholar]
Associated Data
This section collects any data citations, data availability statements, or supplementary materials included in this article.
Supplementary Materials
Supplementary Figure 1. Representative images of the devices used in Lustro. Picture of the Lustro setup and zoomed-in images of the devices used. The robotic arm moves the sample plate from the heater shaker to the plate reader, and then to the illumination device in a cycle over the course of the experiment. Components are numbered with a legend on the side.