

Significance
Hypertrophic cardiomyopathy is the most common genetic heart disease and is linked to over 200 mutations in the sarcomeric protein β-myosin heavy chain (MYH7). However, different mutations in MYH7 lead to variable penetrance and clinical severity. This necessitates a thorough systematic in vitro approach to evaluate the pathogenicity of incomplete-penetrant gene variants, such as MYH7 G256E. Using a multiscale platform, we have demonstrated that the MYH7 G256E mutation leads to hypercontractile force generation across scales, accompanied by increased mitochondrial respiration. This work underscores the effectiveness of a comprehensive multiscale approach to examine the genotype–phenotype relationship, aiding in elucidating disease mechanisms for incomplete-penetrant mutations.
Keywords: hypertrophic cardiomyopathy, induced pluripotent stem cells, biomechanics, MYH7
Abstract
Determining the pathogenicity of hypertrophic cardiomyopathy–associated mutations in the β-myosin heavy chain (MYH7) can be challenging due to its variable penetrance and clinical severity. This study investigates the early pathogenic effects of the incomplete-penetrant MYH7 G256E mutation on myosin function that may trigger pathogenic adaptations and hypertrophy. We hypothesized that the G256E mutation would alter myosin biomechanical function, leading to changes in cellular functions. We developed a collaborative pipeline to characterize myosin function across protein, myofibril, cell, and tissue levels to determine the multiscale effects on structure–function of the contractile apparatus and its implications for gene regulation and metabolic state. The G256E mutation disrupts the transducer region of the S1 head and reduces the fraction of myosin in the folded-back state by 33%, resulting in more myosin heads available for contraction. Myofibrils from gene-edited MYH7WT/G256E human induced pluripotent stem cell-derived cardiomyocytes (hiPSC-CMs) exhibited greater and faster tension development. This hypercontractile phenotype persisted in single-cell hiPSC-CMs and engineered heart tissues. We demonstrated consistent hypercontractile myosin function as a primary consequence of the MYH7 G256E mutation across scales, highlighting the pathogenicity of this gene variant. Single-cell transcriptomic and metabolic profiling demonstrated upregulated mitochondrial genes and increased mitochondrial respiration, indicating early bioenergetic alterations. This work highlights the benefit of our multiscale platform to systematically evaluate the pathogenicity of gene variants at the protein and contractile organelle level and their early consequences on cellular and tissue function. We believe this platform can help elucidate the genotype–phenotype relationships underlying other genetic cardiovascular diseases.
Hypertrophic cardiomyopathy (HCM) is the most common genetic heart disease affecting as many as 1 in 200 individuals. Complications of HCM include hypertrophy-related left ventricular outflow obstruction, heart failure, arrhythmia, and sudden cardiac death (1, 2). HCM generally manifests with cardiac hypercontractility, cardiac hypertrophy, myocyte/myofibril disarray, and interstitial fibrosis (3). Altered metabolism and mitochondrial function have also been described, even in the earlier phase of this disease (4). About 60% of HCM cases are caused by familial inheritance of a single autosomal dominant mutation within a gene encoding for a sarcomere protein. In particular, the MYH7 gene encoding for β-myosin heavy chain (MHC) is reported to contain more than 200 mutations implicated in HCM, making it the second-most common hotspot for HCM mutations (3, 5). The majority of these mutations are found in the myosin head, where adenosine triphosphate (ATP)- and actin-binding sites are located.
MYH7 mutations have variable effects at the single molecule level and cause mutation-specific perturbation in myosin biomechanical function. For example, earlier work from our group demonstrated that the H251N and D239N mutations, which are known to result in early-onset and severe HCM phenotypes in young patients (6), increase actin gliding velocity, ATPase activity, and the fraction of active open-headed myosin compared to wild-type (WT) myosin, contributing to the observed hypercontractile phenotype (7, 8) (SI Appendix, Table S1). On the other hand, the R403Q mutation, commonly known as an adult-onset disease-causing mutation, has less severe effects in vitro, and its effects on myosin function have been debated because some have shown a gain-of-function (9–11), whereas others have shown a loss-of-function (12, 13) (SI Appendix, Table S1).
This discrepancy may result in part from the different model systems used in previous studies. Indeed, reports on the effects of specific MYH7 mutations such as R403Q and P710R were not in agreement across scales [e.g. single-headed myosin (12, 14), long-tailed myosin (9, 10, 14), myofibril (13), single cells (9, 14), and tissues (15)]. Moreover, previous studies have used various species as models including human, rabbit, and mouse, and examined the effects of MYH7 mutations on myosin function at only one or two scales (7, 8, 13, 14, 16–33), perhaps leading to the observed variability in elucidating genotype–phenotype relationships. We posit that it is important to examine the effect of any mutation on myosin function across multiple scales, coupled with measures of adaptive response to altered activity, and using a human-based system to get a more complete picture of the early state of cardiomyocytes that may lead to tissue and organ level responses that drive pathogenicity.
To address this, we assembled a multidisciplinary collaborative team with expertise ranging from individual molecules to subcellular structures to whole cells to engineered microtissues to investigate the effects of HCM-specific MYH7 gene mutations. Among many MYH7 mutations, those that are rare or with insufficient or highly variable clinical data require comprehensive study using human-based multiscale models to investigate mutation-specific pathogenic mechanisms. Among these is the MYH7 G256E mutation, which requires further genotype–phenotype correlation study since there is disparity between clinical phenotype data and structural prediction of the effects of the mutation on the myosin molecule. The G256E mutation is clinically classified as a pathogenic mutation and structurally predicted to cause a severe HCM phenotype due to the charge-changing nature of the mutation in the essential functional domain of myosin. However, one large kindred study suggested a more benign nature of the G256E mutation. In this kindred (245 family members), 39 individuals (34 adults, 5 children) inherited the disease allele among 245 family members, and the G256E mutation showed incomplete penetrance in both adults (19/34, 56%) and children (3/5, 60%). Despite the presence of hypertrophy, there was only one instance of sudden cardiac death was described out of 245 family members (34). This has led the G256E mutation to be classified by some as “benign” or pathogenic but associated with a lower relative risk of sudden cardiac death. However, a rare association with sudden cardiac death does not necessarily mean that a mutation is benign, as it can still impair cardiac function and lead to adverse outcomes such as hypertrophy, outflow tract obstruction, exercise intolerance, and reduced quality of life. Indeed, recent studies suggest that patients with previously labeled benign HCM mutations can experience serious adverse clinical outcomes (35). Given the degree of uncertainty of the clinical significance of the G256E mutation, we selected this mutation to examine the genotype–phenotype correlation using our multiscale models. We hypothesize that the G256E mutation would alter myosin function, leading to downstream changes in cellular functions.
Here, we demonstrate the power of a multidisciplinary collaborative team and a human protein/cell-based multiscale system to comprehensively investigate the genotype–phenotype correlation. Using a CRISPR/Cas9 gene-edited human induced pluripotent stem cell-derived cardiomyocyte (hiPSC-CM) model system and purified protein assays, we demonstrate a systematic workflow to reveal how the MYH7 G256E mutation affects myosin function, and the pathogenesis of HCM (Fig. 1). Specifically, we 1) identified the angstrom level structural consequences of a single amino acid change using molecular dynamics (MD) simulations to study altered protein conformation (36–38), 2) characterized how these protein structural changes affect myosin/actin interactions and the function at the level of isolated myofibrils (20), 3) identified how the changes in myosin function induce biomechanical, transcriptomic and metabolic alterations in single hiPSC-CMs (39), and finally 4) characterized the resulting impact at the tissue level using human engineered heart tissues (EHTs) (40, 41).
Fig. 1.

Schematic of multilength scale examination of MYH7 mutation–driven HCM pathogenesis.
Results
Molecular Dynamics Simulations: MYH7 G256E Mutation Is Modeled to Destabilize the Myosin Transducer Region and Alter Structure near the ATP-Binding Pocket.
G256 is located in the motor domain/head region of β-cardiac myosin, in a β-bulge hairpin turn that connects strands β6 and β7 of the myosin transducer region. The mutation site borders the myosin mesa and is sandwiched between an ɑ-helix of the N-terminal domain, loop 1, and the HO linker loop (Fig. 2 A–C). To predict mutation-driven conformational changes that result in altered myosin function, we used MD simulations and modeled time-dependent structural changes of WT and G256E mutant (G256E) myosin at the atomic scale. In WT MD simulations, the β-bulge, and the transducer region in general, maintained a crystallographic-like conformation (Fig. 2C). In the G256E simulation, however, replacement of the small and flexible Gly with the bulky and charged Glu led to a series of conformational changes. First, the backbone dihedral angles of the β-bulge were altered to accommodate the Glu. Second, the Glu side chain extended toward the N-terminal domain and formed an enduring salt bridge with R169 (Fig. 2D). Formation of the E256-R169 salt bridge placed structural constraints on the transducer region, leading to statistically significant differences in side-chain to side-chain interactions among residues in this region including 4 interactions that were not sampled in the WT simulations (Fig. 2 D and E). In addition, the E256-R169 salt bridge placed increased strain on the transducer β-strands and led to statistically significant changes among backbone to backbone hydrogen bonds among β5, β6, and β7 (Fig. 2 D and F). Four of these backbone hydrogen bonds were present less often in the G256E simulations, which led to a decrease in structural stability of the transducer region. The combined structural changes among hydrogen bonds within the central β-sheet and among side-chain to side-chain interactions near the mutation site ultimately modify the structure and dynamics of the transducer, known to transmit structural information between the nucleotide-binding and actin-binding sites.
Fig. 2.
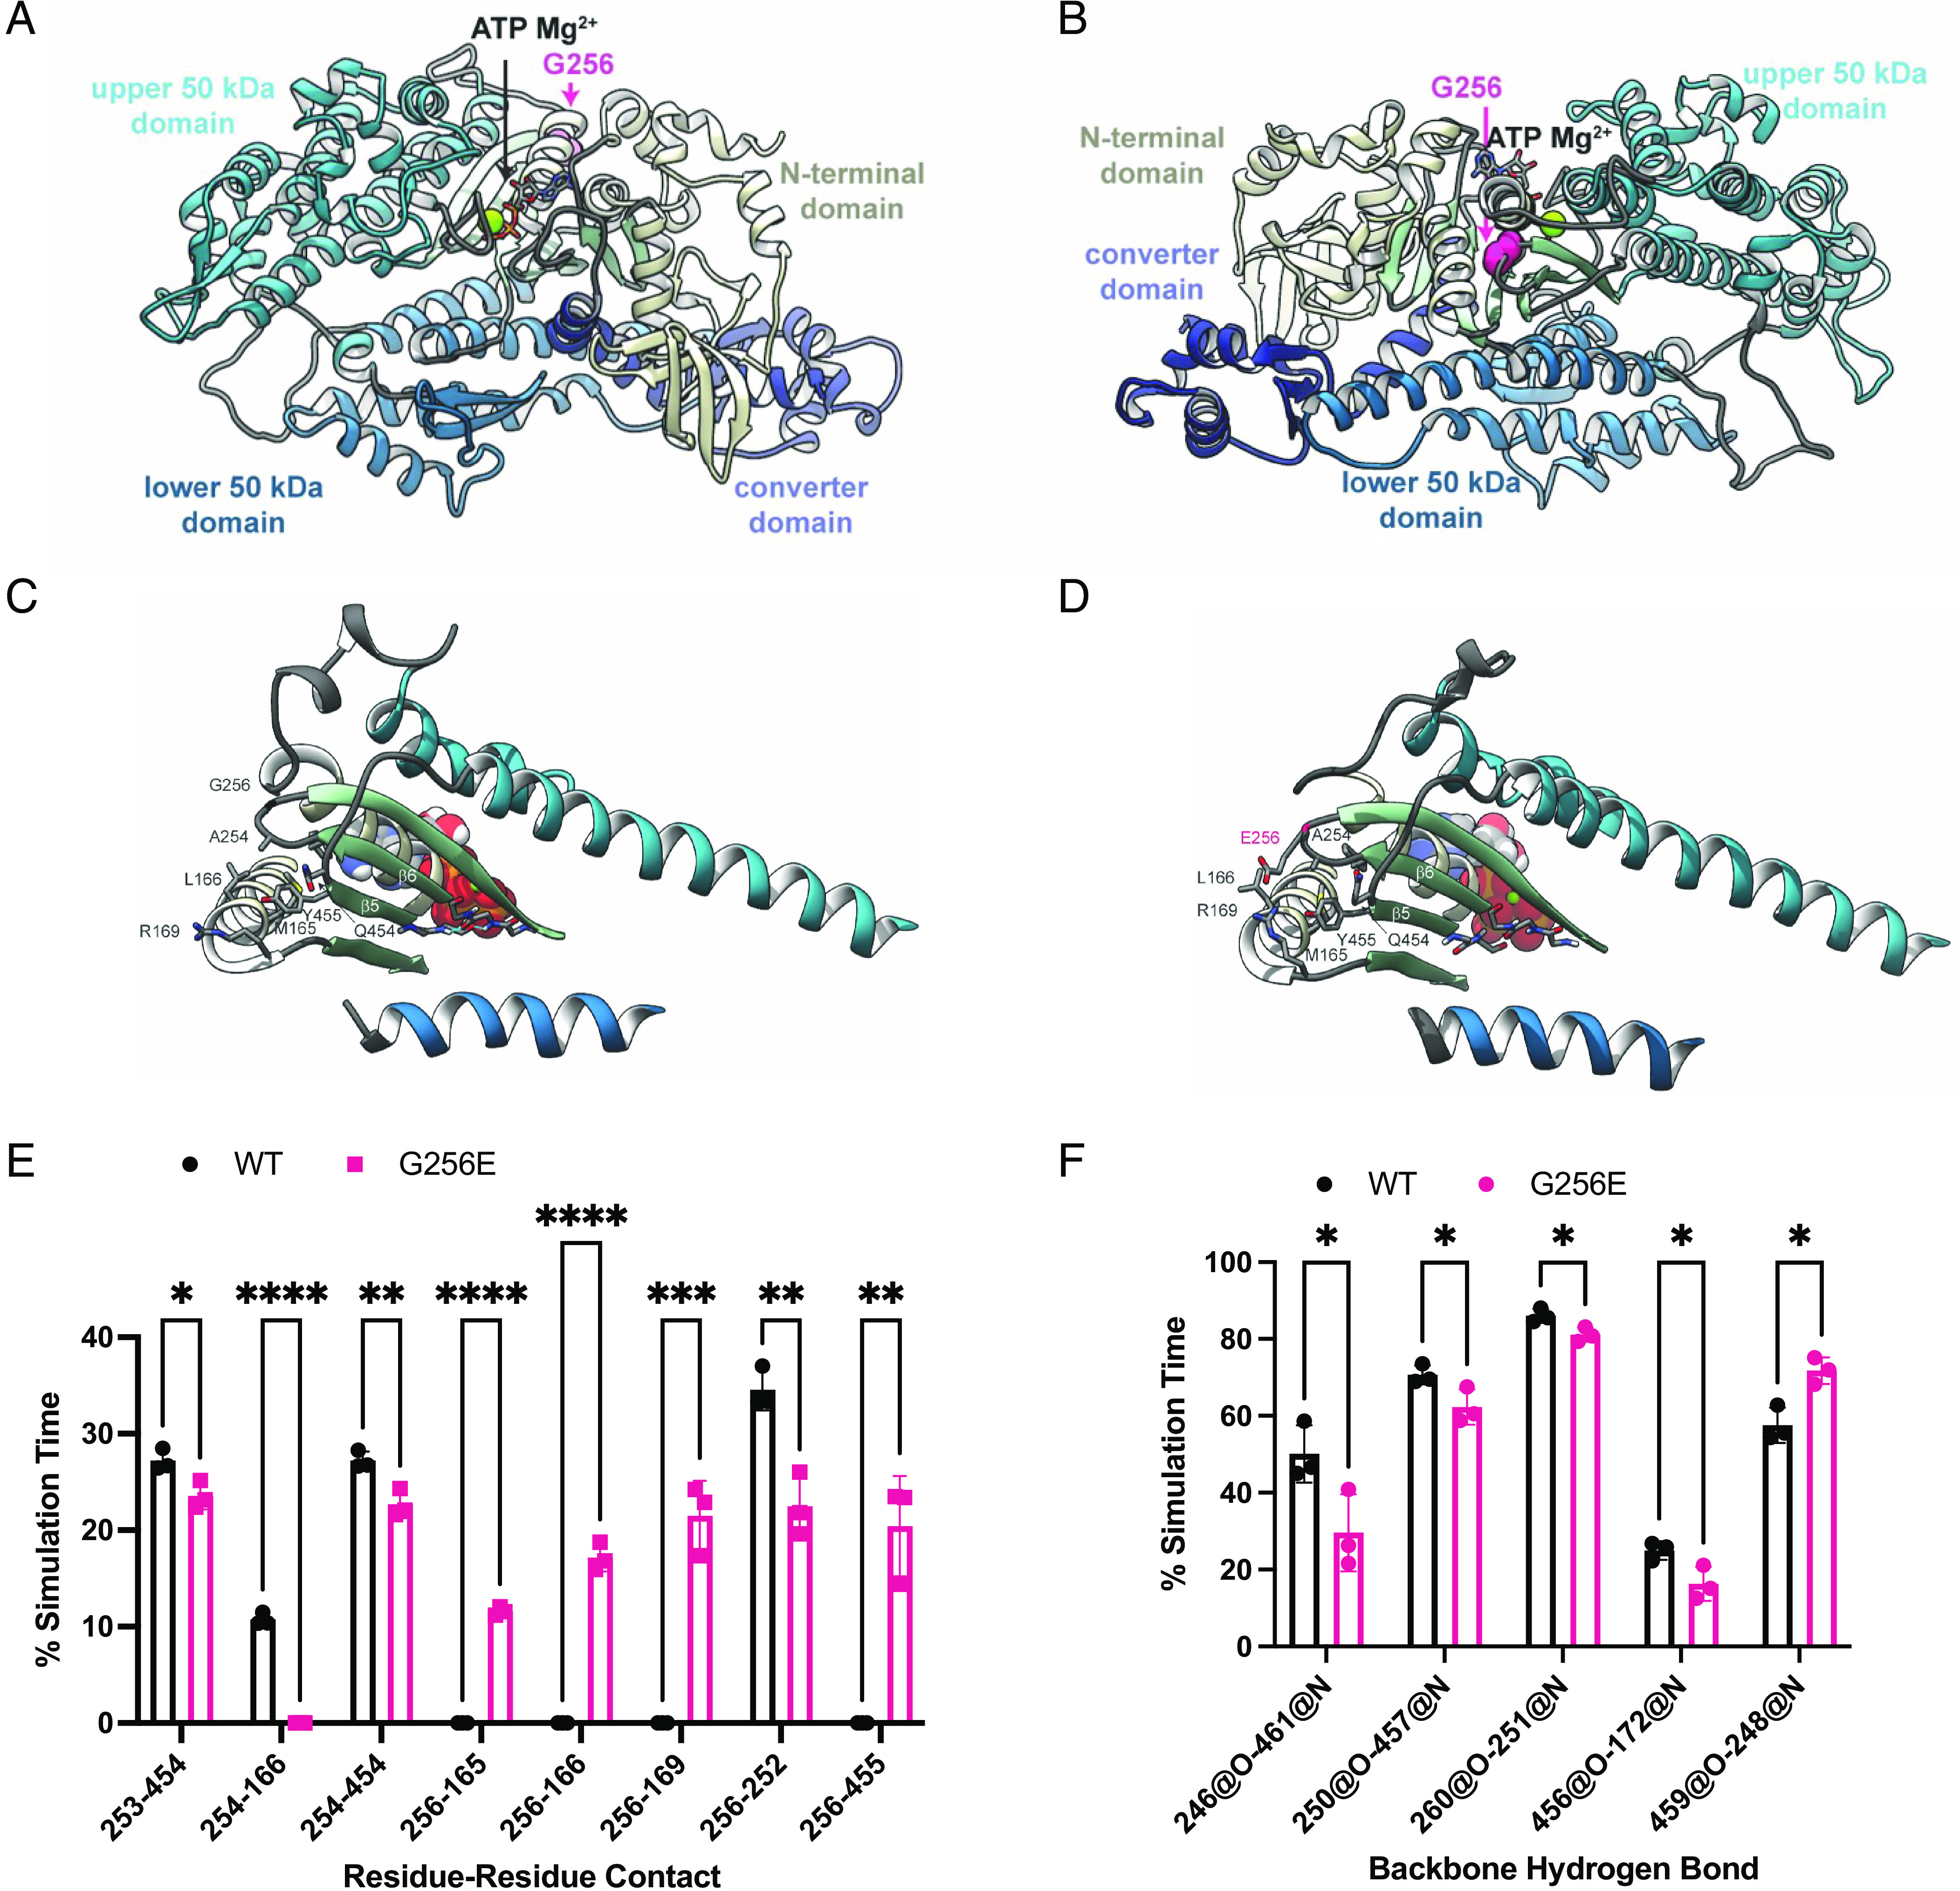
MYH7 G256E mutation disrupts the transducer region of myosin. (A and B) The starting structure used for the WT myosin+ATP.Mg2+ simulations is shown and the four major structural domains of the protein have unique colors. The ATP molecule is shown in stick representation, the Mg2+. is shown in a green space-filling representation, and the atoms for G256 are shown in a pink space-filling representation. (C and D) The G256E mutation resulted in structural rearrangement of the transducer region of myosin, depicted in structural snapshots taken from the WT (C) and G256E (D) MD simulations of M.ATP state myosin. Residues in the transducer region are represented as ribbons, ATP Mg is represented as spheres. The sidechain and backbone atoms of residues with distinct atomic interactions are shown. (E) G256E resulted in a shift in residue–residue side chain contacts within the vicinity of the mutation site. Error bars are SD. (F) G256E also resulted in a shift in backbone-backbone hydrogen bonding patterns among residues in the central β-sheet. Hydrogen bonds between strands β5 and β6 near the ATP pocket were formed less frequently in the G256E simulations. Data are presented as mean ± SD. Statistical significance was determined by a student’s t test. *P < 0.05, **P < 0.01, ****P < 0.0001.
Purified Proteins: MYH7 G256E Mutation Decreases the Population of Myosin Heads in the OFF State.
To experimentally determine the effects of the G256E mutation on myosin motor function, we performed molecular assays with purified β-cardiac myosin constructs. Actin-activated ATPase, in vitro motility, and single nucleotide turnover assays were used to evaluate the impact of the G256E mutation on myosin kinetics and its interactions with actin. β-MHC, the mechanoenzyme that drives ventricular contraction, forms a dimeric structure composed of two globular head/motor domains (S1) joined via an ɑ-helical coiled coil tail domain. Given the location of the G256E mutation in the head domain, we first used the single-headed short S1 (sS1) form of β-cardiac myosin (sS1) to examine actin–myosin interactions (42, 43). We found that the motility of actin filaments on the sS1-mutant-myosin-coated surface was reduced somewhat (20%) compared to the WT control (Fig. 3A and SI Appendix, Fig. S1), and the actin-activated ATPase rate (kcat) was not significantly altered by the G256E mutation, suggesting steady-state ATPase activity itself is not altered (Fig. 3B). Thus, as has been found for other HCM mutant constructs (7–9), these fundamental parameters in isolation cannot account for hypercontractility caused by the G256E mutation, but the hypercontractility is likely caused by an increase in the number of heads accessible for interaction with actin (Na). We demonstrate here that Na is increased with two different assays using double-headed β-cardiac myosin constructs (short-tailed form, 2 hep and long-tailed form, 25 hep).
Fig. 3.

Measurements of myosin molecular activity revealed that G256E myosin exhibits a significant reduction in actin gliding velocity and super relaxed state (SRX) fraction. (A) Mean actin gliding velocities for WT and G256E sS1 construct of β-MHC. Mean actin gliding velocity shown (MVEL20) is the mean velocity of all moving actin filaments after removing all filaments whose deviation in velocity is 20% or more than its mean velocity. [Biological replicates (N) = 4, technical replicate (n) = 14]. (B) Representative actin-activated ATPase curves for G256E and WT in single-headed sS1 construct showing similar ATPase rates. (N = 2, n = 6). (C and D) Representative actin-activated ATPase curves for WT and G256E two-headed myosin constructs. The rates presented are calculated per myosin head by normalizing to the myosin concentration used in the assay. Each data point represents the average of three technical replicates of one biological replicate (n = 3). Actin-activated curves are fitted to Michaelis–Menten kinetics, Error bars represent SD and shaded areas depict the 95% CI of the fits. The two other biological replicates can be found in SI Appendix, Fig S1. (C) Long (25 hep) tailed WT myosin has a ~40% reduction in ATPase rate whereas the long-tailed G256E myosin has a ~20% reduction in ATPase rate as compared to the corresponding short (2 hep) tailed myosin. (E) Single turnover assay depicted as percentage of myosin in SRX state. G256E significantly reduces the fraction of myosin in the SRX state, resulting in a 26.5 ± 2.82% (mean ± SEM) decrease in SRX (N = 4, n = 11 to 26). Each data point represents a single experiment, and individual fluorescence decay curves can be found in SI Appendix, Fig S2. ∗∗∗∗P < 0.0001.
The first assay is based on the findings that myosin regulates its activity by shifting the equilibrium between two conformational states (8, 10, 14, 44): 1) a so-called superrelaxed state (SRX) that has a very low basal ATP turnover rate and 2) a disordered-relaxed state (DRX) with a ~10-fold higher basal ATPase rate. These enzymatic states may correlate, under some conditions, with structural states characterized by S1 heads that are either 1) folded back onto the proximal tail and sequestered from interacting with actin (i.e. the interacting heads motif, IHM) or 2) open and capable of attaching to actin and generating force. Using the long-tailed 25 hep myosin, we first tested the effect of the G256E mutation on the distribution of heads in SRX vs. DRX using a single nucleotide turnover assay with fluorescently labeled ATP. We found that the long-tailed 25 hep construct containing the G256E mutation had a significantly lower proportion of myosin heads in the SRX state compared to WT 25 hep myosin (P < 0.0001) (Fig. 3C and SI Appendix, Fig. S2; WT 25 hep = 54 ± 8.8% (mean ± SD); G256E 25 hep= 27.5 ± 10%), suggesting that this mutation causes a significant increase in ATP utilization compared to WT myosin. The second assay involves measuring the effect of the mutation on the relative actin-activated ATPase activities of the short-tailed (2 hep) vs. the long-tailed (25 hep) myosin. In the case of WT myosin, actin-activated ATPase rates (kcat) for the long-tailed 25 hep myosin construct are ~40% lower than those of the short-tailed 2 hep myosin construct that lacks the ability to form a folded-back state (Fig. 3D and SI Appendix, Fig. S3). Since the only difference between the short- and long-tailed myosin constructs is the ability of the long-tailed construct to form a folded-back, sequestered state, the 40% drop in actin-activated ATPase likely reflects the fact that a significant proportion of the 25 hep myosin heads are folded back and unavailable to interact with actin. However, the actin-activated ATPase rate of the long-tailed G256E mutant construct drops by only ~20% compared to its short-tailed 2 hep construct (G256E 2 hep) (Fig. 3E and SI Appendix, Fig. S3). This smaller decrease in ATPase rate of the G256E mutant long-tailed myosin is likely due to disruption of the folded-back state, resulting in significantly more myosin heads in an open state available to interact with actin. Thus, the G256E mutation is likely causing hypercontractility primarily by an ~33% increase in the number of heads interacting with actin. We next investigated the effects of the mutation at a higher organizational level in human myofibrils to understand the aggregate molecular effects of ensembles of mutant and WT motors on myofibrillar contractility.
Isolated Myofibrils: Myofibrils Isolated from MYH7 G256E Mutation–Bearing hiPSC-CMs Generate Increased Tension, Demonstrating a Hypercontractile Phenotype.
To examine how dysregulated interactions of G256E mutant myosin with actin affect the contractile properties of myofibrils, we first generated a MYH7 G256E iPSC line (MYH7WT/G256E) using CRISPR/Cas9 gene editing technology. The isogenic WT counterpart (MYH7WT/WT) was obtained by selecting a clone that underwent the gene editing procedure without undergoing genetic modifications at the MYH7 G256E locus. We performed a series of standard quality control experiments to confirm the genotype and validated that the gene editing process did not introduce any adverse effects. Specifically, we validated the substitution of guanine to adenine located at nucleotide position 767 responsible for the G256E mutation (SI Appendix, Fig. S4). The gene editing process did not result in trisomy (SI Appendix, Fig. S5) or karyotype abnormalities (SI Appendix, Fig. S6). Morphological assessments demonstrated normal cell and colony morphology after gene editing (SI Appendix, Fig. S7). Furthermore, the gene editing procedure did not have any adverse effects on cardiac differentiation (SI Appendix, Fig. S8). The gene-edited clones remained sterile after gene editing (SI Appendix, Tables S2 and S3). WT myofibrils were extracted from isogenic WT hiPSC-CMs (MYH7WT/WT), while G256E mutant myofibrils were extracted from MYH7 G256E mutant hiPSC-CMs (MYH7WT/G256E), and thus contain both mutant and nonmutant forms of β-cardiac myosin, similar to the human disease.
The mechanical and kinetic properties of MYH7WT/G256E and its isogenic control MYH7WT/WT hiPSC-CM myofibrils were measured in a custom-built apparatus using a fast solution switching technique, as previously described (20). At maximal Ca2+ activation (pCa 4.0), MYH7 G256E myofibrils generated ~2× more force than isogenic controls (Fig. 4 A and B, P < 0.001). Furthermore, the rate of activation (kACT), which is dependent on cross-bridge attachment and cycling rates, was significantly increased for MYH7 G256E myofibrils (Fig. 4 C and D, P < 0.05).
Fig. 4.

Isolated hiPSC-CM-derived myofibril with G256E mutation demonstrates increased tension generation at a faster rate and delayed slow phase relaxation. (A and B) Increased tension can be seen in the activation trace of MYH7 G256E mutant myofibrils (MYH7WT/G256E, red) compared to WT isogenic controls (MYH7WT/WT, black). (C and D) Normalized force trace shows increased rate of activation (kACT) of mutant myofibrils compared to isogenic controls. (E) Fast phase of relaxation is unaffected. (F–H) Close-up of slow phase relaxation showing slower early phase relaxation (kREL, slow) of G256E mutants. Statistical significance was determined by Welch’s unpaired two-tailed t test. ns P > 0.05, *P < 0.05, ***P < 0.001. (WT N = 5, G256E N = 6).
Relaxation of myofibrils from isometric contraction includes an initial slow, linear phase (kREL,slow) that is determined by the myosin detachment rate (45) and a fast exponential phase (kREL,fast) that reflects multiple active and passive properties of the contractile elements. The kREL,slow of MYH7 G256E myofibrils was significantly slower compared to isogenic controls (Fig. 4 E and F, P < 0.05) suggesting that the MYH7 G256E mutation slows either ADP release and/or ATP binding to myosin, the chemo-mechanical steps required for cross-bridge detachment. The duration of the slow, linear phase (tREL,slow), which is determined by the rate of thin filament deactivation (46) and kREL,fast were not significantly different between MYH7 G256E myofibrils (Fig. 4 G and H). Overall, the combination of isolated myosin and myofibril mechanics data demonstrates that the MYH7 G256E mutation leads to generating greater tension at a faster rate, which in part results from increased myosin recruitment and prolonged cross-bridge cycling.
Single Cardiomyocytes: MYH7 G256E Mutation–Bearing hiPSC-CMs Display Cellular Hallmarks of HCM at the Single-Cell Level.
To examine the effect of the G256E mutation at the next scale level, hiPSC-CMs, we seeded single hiPSC-CMs at 30 d postdifferentiation on patterned surfaces with aspect ratios of 7:1 using a 10-kPa hydrogel platform (mimicking physiological morphology and stiffness), which we have shown for optimal force generation (39, 47), and performed traction force microscopy as previously described (39). Day 30 hiPSC-CMs predominantly expressed β-MHC as the major isoform of myosin regardless of genotype (SI Appendix, Fig. S9). We demonstrated successful patterning and traction force measurement of both MYH7WT/G256E hiPSC-CMs (G256E) and their isogenic controls (MYH7WT/WT, WT) (Fig. 5 A and B). Measures from traction force microscopy showed that the G256E mutation resulted in a twofold increase in peak traction force generation (***P < 0.0005) and a 1.2-fold increase in contraction velocity (WT: 1.8 µm/s, G256E: 2.2 µm/s), while the relaxation duration (time to 90% relaxation) decreased by 1.2-fold (WT: 0.38s, G256E: 0.3s) (Fig. 5 C–E). Both the WT and G256E hiPSC lines were gene-edited on a line with an EGFP tag at the ɑ-actinin locus (AICS-0075-085), allowing us to monitor sarcomere shortening in real time (48) (Fig. 5F). While initial sarcomere length at rest was slightly reduced in the G256E mutants (Fig. 5G), G256E showed greater sarcomere shortening (WT: 15%, G256E: 20%), indicating increased contraction in G256E mutants at the sarcomere level (Fig. 5H). Taken together, these data show that G256E mutant hiPSC-CMs show a hypercontractility phenotype at the single-cell level.
Fig. 5.

Single-cell contractility analysis revealed hiPSC-CMs bearing MYH7 G256E mutation show hypercontractility. (A and B) Representative images of patterned single WT isogenic control (MYH7WT/WT, WT) and MYH7 G256E mutant hiPSC-CMs (MYH7WT/G256E, G256E) and their traction force traces. (C–E) MYH7 G256E mutant (red) depicts increased (C) total peak force, (D) contraction velocity, and (E) decreased relaxation velocity compared to WT isogenic control. (F) Representative images of sarcomeric organization in single WT isogenic control and G256E mutant hiPSC-CMs. (G and H) The G256E mutant shows statistically reduced sarcomere length and increased sarcomere shortening compared to the WT isogenic control. Data are presented as mean ± SD. Statistical significance was determined by an unpaired t test. P < 0.05 is designated with *P < 0.005 is designated with **P < 0.0005 or smaller is designated with ***. (N = 30+ cells).
Since cardiac hypertrophy is a clinical hallmark of HCM, we next asked whether the G256E mutation would lead to cellular hypertrophy at the single-cell level. We examined cell spread area on 10-kPa hydrogels as well as glass coverslips and found a subtle but significant increase in cell spread area on hydrogel (WT: 800 µm2, G256E: 1,000 µm2; P < 0.005) (SI Appendix, Fig. S10). In contrast, we did not observe significant changes in cell spread area on glass coverslips of nonphysiologic stiffness (WT: 1,800 µm2, G256E: 1,800 µm2; P > 0.05) (SI Appendix, Fig. S11). In sum, G256E mutation–bearing hiPSC-CMs exhibit increased contractile force generation consistent with observations from myosin protein and myofibril data, along with less dramatic hypertrophy that is sensitive to substrate stiffness.
Multicellular EHT: The G256E Mutation Produces a Hypercontractile Phenotype in Multicellular EHT.
To examine the effect of the G256E mutation at the multicellular level, three-dimensional EHTs were generated from WT and G256E hiPSC-CMs. The EHT platform used consists of day 30 hiPSC-CMs and human stromal cells (HS27A) embedded in a fibrin hydrogel and suspended between two elastomeric posts, one flexible and one rigid for longitudinal force measurement (49). Both WT and G256E hiPSC-CMs produced EHTs that compacted around the posts and initiated synchronized contractions (Fig. 6A). Tracking the deflection of the flexible post allows for the measurement of contractile force, and G256E EHTs demonstrated an increase in twitch force, specific force, twitch power, and twitch work (Fig. 6 B–F). Specific force is defined as the force generated by EHT relative to its cross-sectional area in order to account for variations in EHT size when assessing contractile function. Analysis of contraction kinetics showed an increase in maximum contraction velocity (Fig. 6G) and shortened times to 90% relaxation in G256E EHTs (Fig. 6H). Taken together, these data demonstrate preservation of the hypercontractile phenotype observed at the protein, myofibrillar, and individual cellular levels to the multicellular level.
Fig. 6.
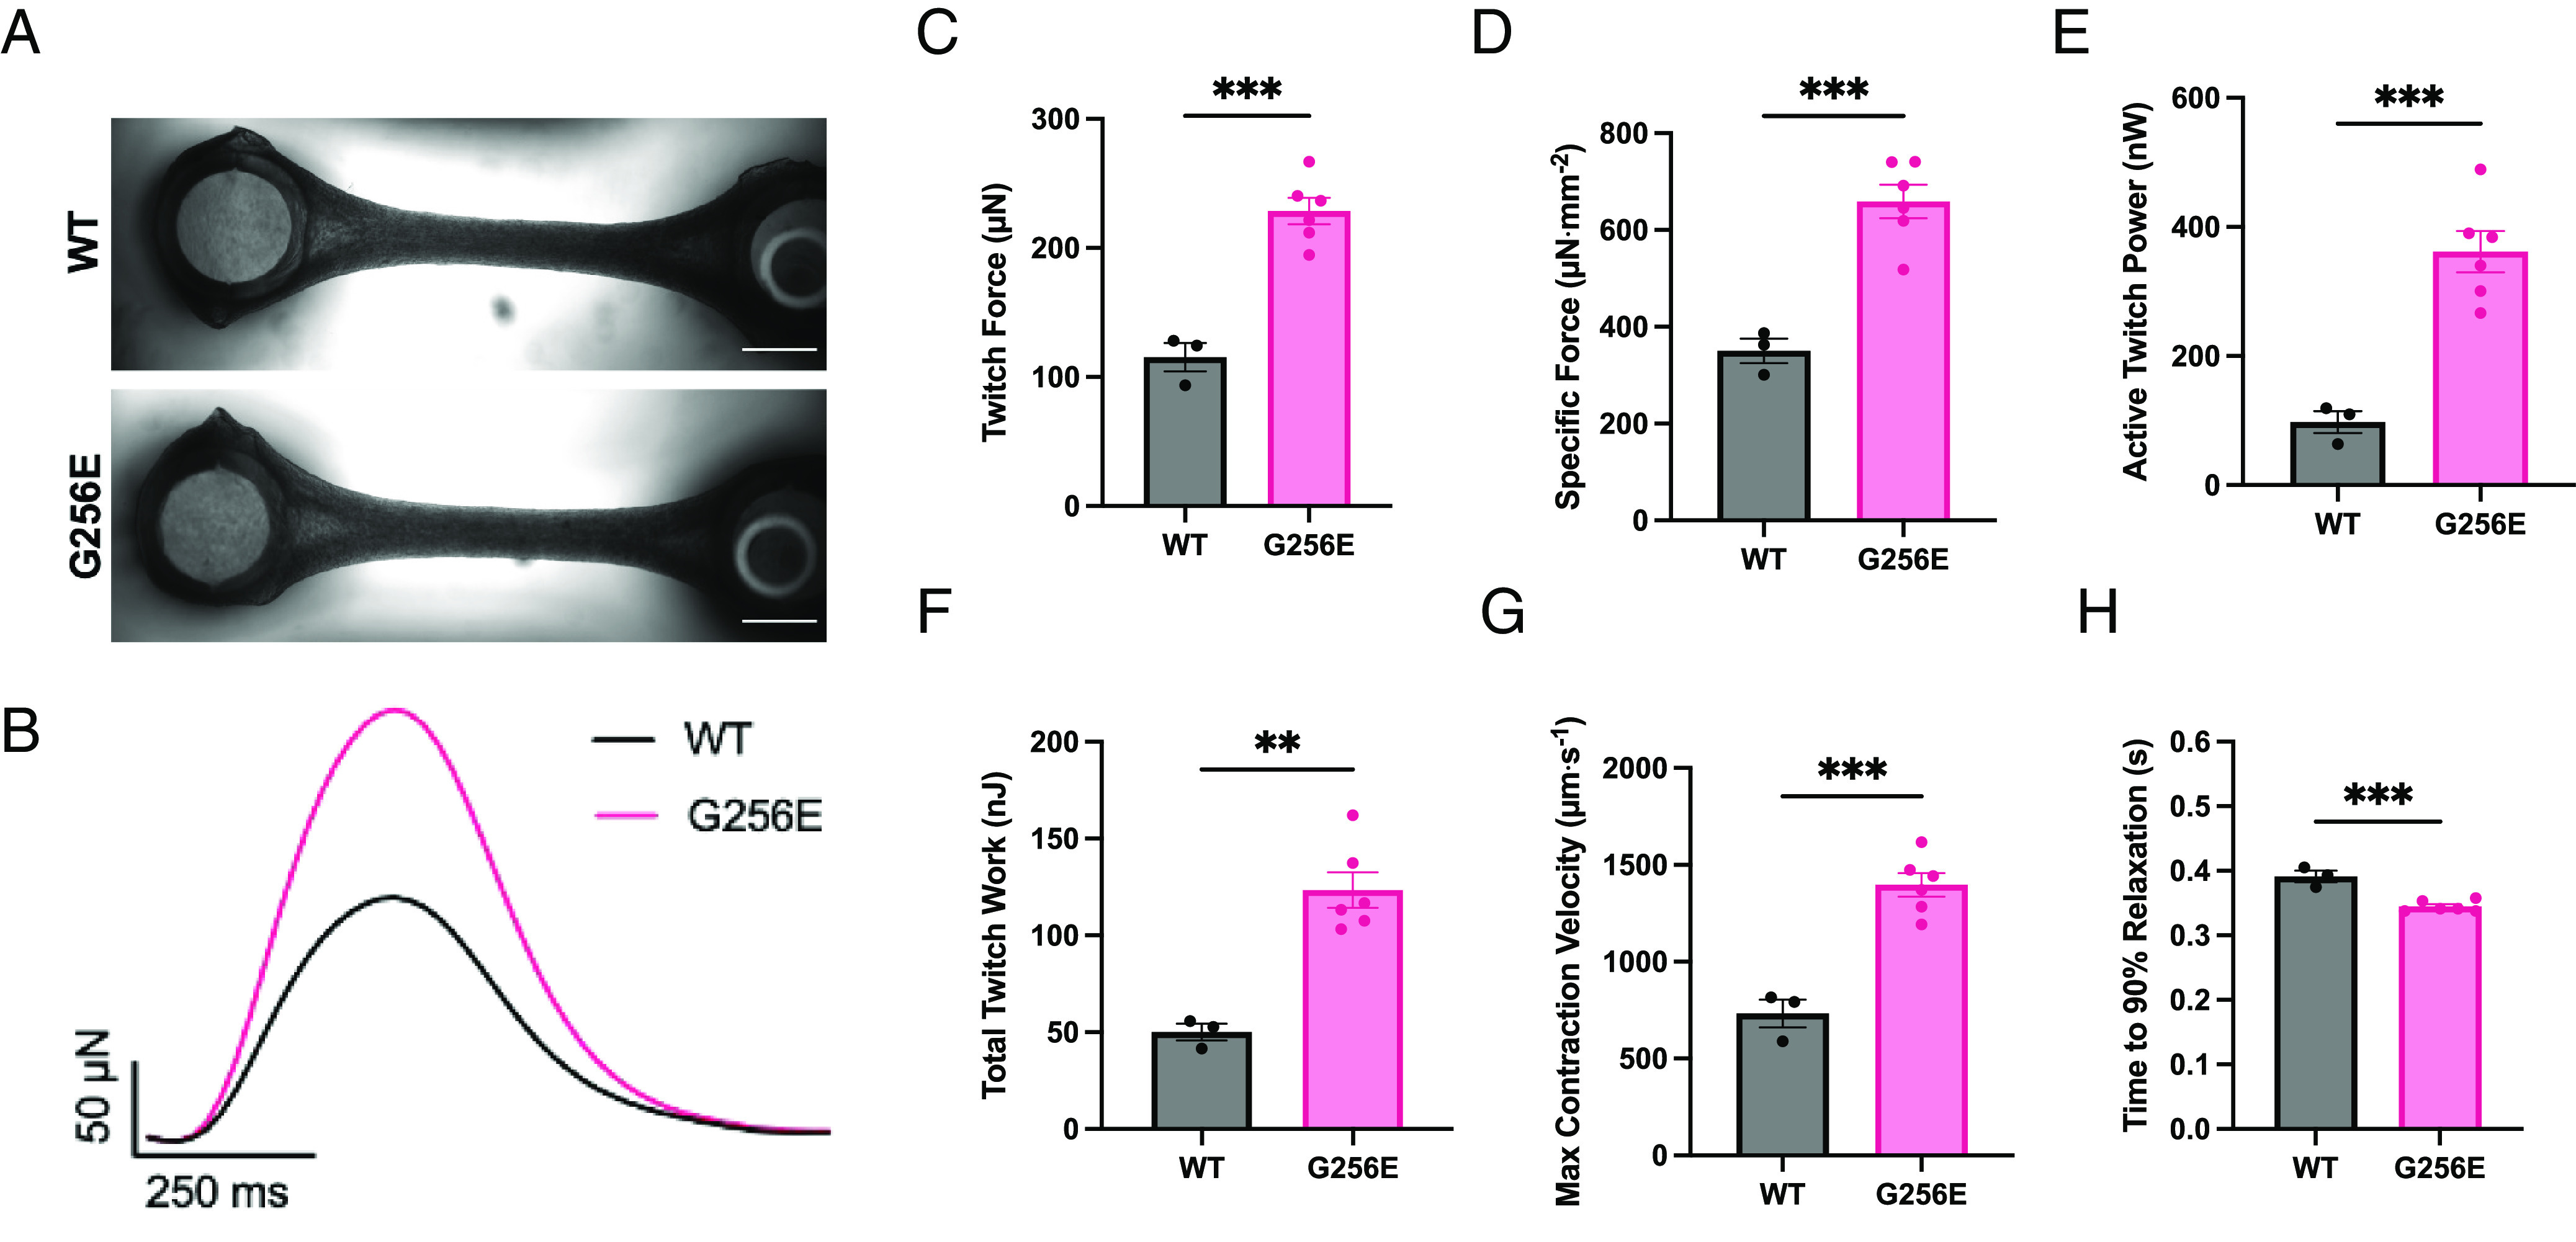
EHT model revealed hypercontractility in G256E EHTs. (A) Images of representative EHTs, shown with flexible post at the Left and rigid post at the Right (scale bar, 1 mm.) (B) Representative traces of EHT twitch force. (C–H) Measured metrics of WT and G256E EHT contractility derived from videos of EHT contraction. Each data point represents an individual EHT. ∗∗P ≤ 0.01, ∗∗∗P ≤ 0.001. (WT N = 3, G256E N = 6).
Given the central role of calcium handling in modulating both the magnitude and kinetics of cardiac contractility, and prior studies showing a role for altered calcium dynamics in HCM (23, 26), EHTs were loaded with the Ca2+ indicator dye Fluo-4 AM to examine any alterations in Ca2+ dynamics that may contribute to the observed contractile phenotype. No significant differences in Ca2+ transient kinetics or amplitude were observed between WT and G256E EHTs (SI Appendix, Fig. S12), indicating that the increased contractility was likely not caused by differences in calcium handling but rather due to direct biomechanical effects at the sarcomere level. Nevertheless, it is worth noting that the sample size might have been underpowered to detect more subtle changes in calcium handling.
To further investigate potential contributors to the altered contractile kinetics, the relative expression of α-MHC and β-MHC was assessed by immunofluorescence staining and western blot analysis. We found that regardless of EHT genotype, most hiPSC-CMs predominantly expressed β-MHC, with only a few, smaller hiPSC-CMs expressing α-MHC (SI Appendix, Fig. S13), consistent with our findings at the single-cell level (SI Appendix, Fig. S9). Subcellular sarcomere structure was assessed by immunofluorescence staining for the z-disk protein α-actinin. Both WT and G256E EHTs were shown to have aligned sarcomeres in the direction of EHT contraction, as seen by α-actinin fluorescence, and no difference was observed in either sarcomere length, width of ɑ-actinin layers, or estimated cell area (SI Appendix, Fig. S14). Taken together, these results further support that greater contractile force generation is primarily attributed to the G256E mutant myosin’s increased recruitment and altered cycling kinetics.
Altered Cellular Metabolism: Single cell RNA sequencing (scRNAseq) Suggests Metabolic Alterations in G256E Mutation–Bearing hiPSC-CMs.
To examine the effect of the G256E mutation on the global transcriptome of hiPSC-CMs, both WT and G256E hiPSC-CMs at day 30 postdifferentiation were harvested for droplet-based scRNAseq. The captured cells expressed high levels of cardiomyocyte-specific markers, TNNT2, ACTN2, TNNI1, and TNNI3 (Fig. 7 A and B). It is noteworthy that both WT and G256E hiPSC-CMs predominantly expressed MYH7 over MYH6 at both gene and protein level (Fig. 7B and SI Appendix, Figs. S9 and S13), indicating that day 30 hiPSC-CMs can address the cellular consequences of a MYH7 mutation. Unbiased clustering revealed 7 subclusters of hiPSC-CMs (Fig. 7C). Clusters 1 and 3 were predominantly composed of G256E mutant cells, 97.8% and 97.9%, respectively, while the rest were primarily composed of WT cells (Fig. 7 C and D). Next, we examined the top differentially regulated genes and the associated biological processes in response to the G256E mutation. Top upregulated genes included mitochondrial genes such as MT-ATP6, MT-CO3, and MT-ND3, and the corresponding processes they regulate were mitochondrial ATP synthesis coupled proton transport, mitochondrial electron transport, and cellular respiration (Fig. 7 E and F and SI Appendix, Figs. S15 and S16). On the other hand, traditional hypertrophy marker genes (NPPA, NPPB) and genes reported to be associated with hypertrophic remodeling [SYNPO2L, ANKRD1, CDKN1A, MEF2A (myocyte enhancer factor 2)] were downregulated (SI Appendix, Fig. S17), consistent with our finding of a minimal change in cell size.
Fig. 7.
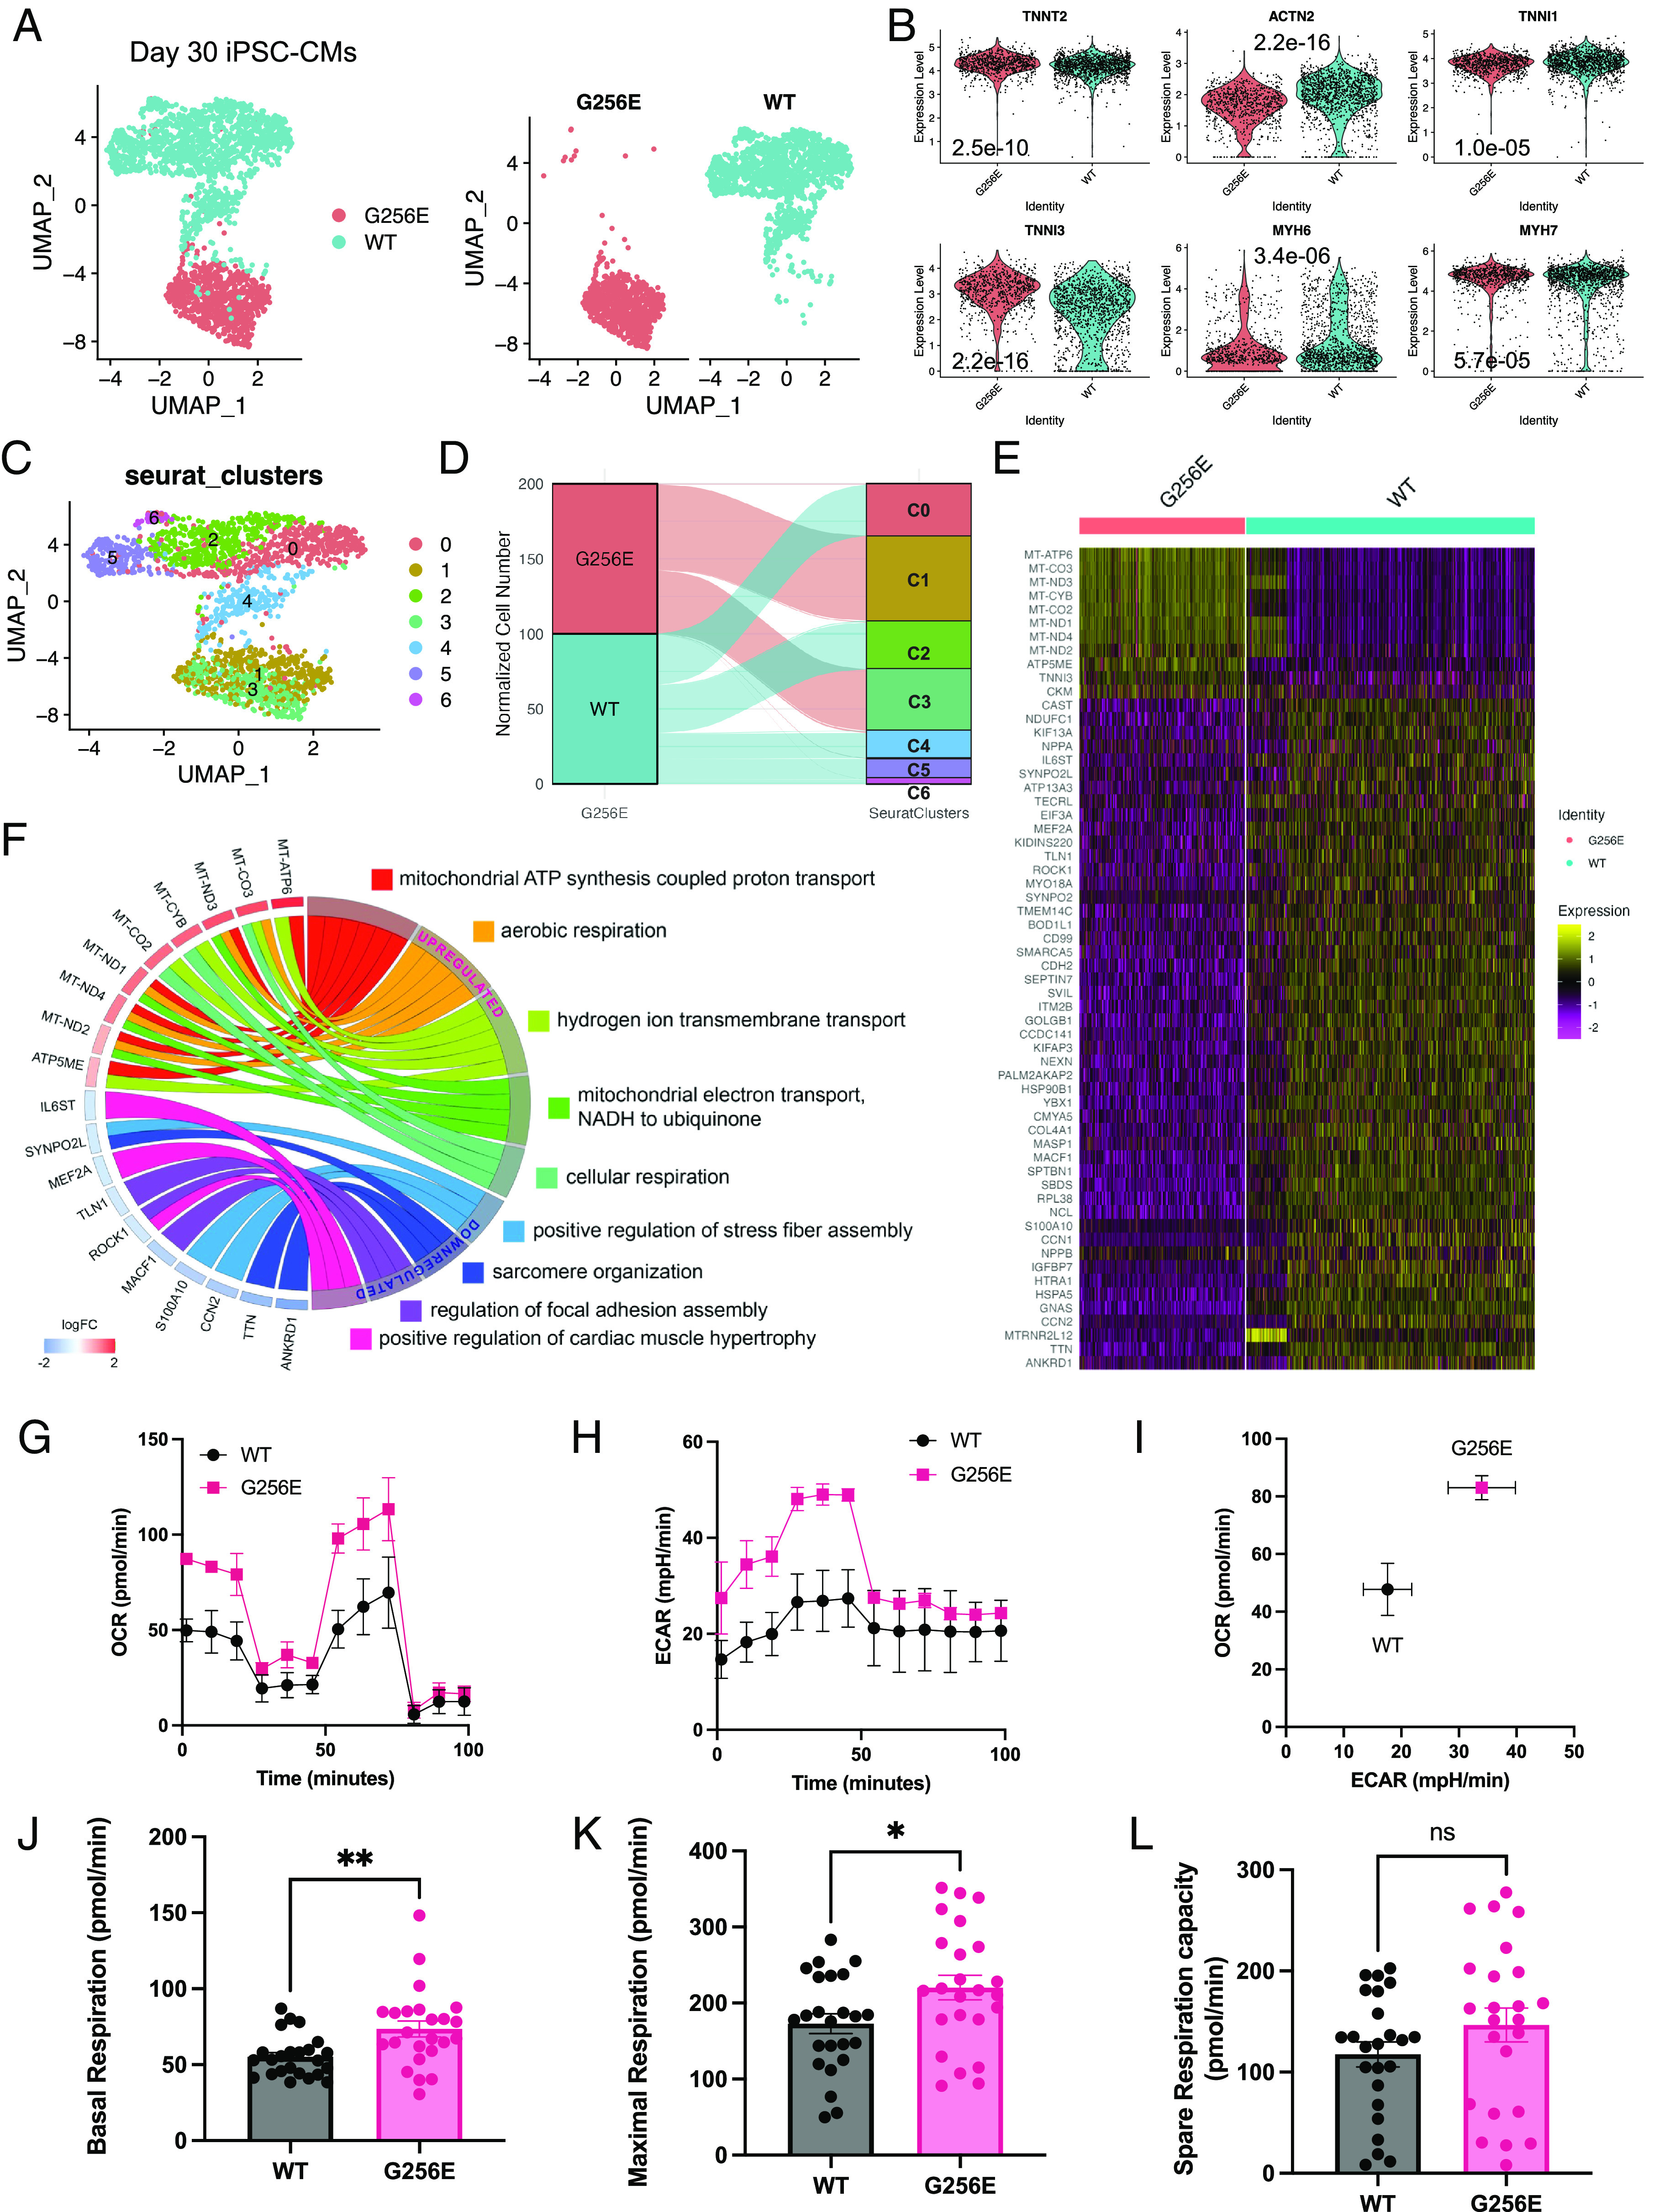
Single-cell transcriptomic profiling and Mito Stress test reveal elevated mitochondrial respiration in MYH7-G256E mutant hiPSC-CMs. (A) UMAP representation of MYH7 G256E mutant cells (MYH7WT/G256E, G256E) and the isogenic counterpart (MYH7WT/WT, WT) clustered by the presence of G256E mutation. (B) Violin plots of cardiomyocyte marker genes. P values are calculated using the Wilcoxon rank sum test. (C) Unbiased clustering of G256E and WT hiPSC-CMs. (D) Alluvial plot demonstrating the composition of Seurat clusters. (E) Heatmap of top differentially expressed genes between G256E mutant and isogenic control. (logFC > log1.8). (F) Chord plot of gene ontology biological process terms associated with top differentially expressed genes. (G–L) Results of mitochondrial respiration profiling. Representative graphs of (G) oxygen consumption rate (OCR), (H) extracellular acidification rate (ECAR), and (I) OCR-ECAR plot demonstrating metabolic shift. Bar graphs of (J) baseline, (K) maximum, and (L) spare respiration capacity. (J–L) Data are presented as mean ± SEM. Each datapoint represents a sample (N = 4, n = 24). Statistical significance was determined by an unpaired t test. *P < 0.05, **P < 0.01 ns = not significant. (A–F. N = 3; G–L. N = 4, n = 24).
To further validate the transcriptomic changes related to mitochondrial respiration, we sought to investigate the impact of the G256E mutation on mitochondrial respiratory function using the Seahorse XF Mito Stress test. We found that both baseline and maximal oxygen consumption rate (OCR) of G256E mutant hiPSC-CMs were significantly increased by ~1.3-fold over WT cells (Fig. 7 G–L), demonstrating increased mitochondrial respiration. Furthermore, we also found elevated extracellular acidification rate (ECAR) in the mutant iPSC-CMs, indicating increased glycolysis (Fig. 7H). Increase in both OCR and ECAR indicates elevation in ATP production mediated by oxidative phosphorylation and glycolysis (Fig. 7I). These findings suggest that the hypercontractile G256E mutation increases energy demand in cardiomyocytes, leading to upregulation of mitochondrial genes and increasing mitochondrial respiratory function, as an early feature of HCM.
Discussion
The multiscale approach described here allowed us to study the extent to which a specific MYH7 mutation of incomplete penetrance contributes to the primary pathology of hypercontractility and secondary effects of hypertrophy and metabolic remodeling. The MYH7 G256E mutation has been described in a large family and has an incomplete penetrance of hypertrophy of around 50% (34). This leads some to even question its pathogenicity (35), making it an ideal candidate for assessing its effects using our multiscale approach. We integrated purified protein assays with a mutation-introduced hiPSC model system on an isogenic background that enabled us to investigate the relationships between biophysical and physiologic mechanisms of HCM, downstream of the G256E mutation. Our primary finding across the multiple scales examined is that the G256E mutation causes hypercontractility at every level with alterations in mitochondrial transcriptome and function as an early adaptative response to hypercontractility, as we have previously shown in HCM patients (4).
MD simulations can provide a structural basis for the mechanisms by which the G256E mutation leads to hypercontractility. Our simulations here show that the G256E mutation causes changes in the structure of the transducer region of β-myosin, which is known to transmit information between the nucleotide- and actin-binding functional sites (50). Examining the data collected at the protein and myofilament level through the lens of the MD simulations suggests that the delays in cross-bridge detachment may be due to a disruption of structural communication passing through the transducer. Specifically, structural changes in the transducer and binding pocket of β-myosin could facilitate the opening from the folded-back state and slow the rate of one or multiple transition steps of the chemo-mechanical cross-bridge cycle (Fig. 2).
Increased contractility reflects increased power output of the sarcomere, where power depends on contraction velocity and ensemble force. An important determinant of ensemble force is Na, the number of myosin heads available to interact with actin. At the purified protein level, the most striking effect of the G256E mutation is a ~33% increase in Na as determined by the ratio of actin-activated ATPase rates of the long-tailed 25-hep myosin to that of the short-tailed 2-hep construct (ratio25 hep:2 hep) (Fig. 3). These constructs differ only in their ability to form a folded-back state, with the WT 25 hep myosin typically having a kcat that is only 60% of the WT 2hep myosin, due to the ability of the 25 hep myosin heads to fold back on the proximal tail present in that structure. This effect has been described in other pathogenic MYH7 mutations such as H251N and P710R that we have previously studied (7, 8, 14). The ratio25 hep:2 hep in the G256E mutant was higher than that in the WT myosin, indicating increased ensemble force.
Myosin in vitro motility assays demonstrated that the G256E mutation led to a 20% reduction in actin gliding velocity (Fig. 3A). Actin gliding velocity is primarily proportional to the force-dependent actin–myosin detachment rate (14, 51). A reduced velocity can result from a higher duty ratio or the reduced step size of the myosin cross-bridge. While the step size is not measured in this study, our data suggest a higher duty ratio in the G256E mutant myosin, as evidenced by the shorter actin filament length required to achieve the maximal gliding velocity (SI Appendix, Fig. S1). A higher duty ratio suggests slower detachment, which could lead to increased thin filament activation at lower calcium concentrations by maintaining tropomyosin in an open state, allowing more myosin heads to bind even at lower calcium concentrations. This sustained thin filament open state facilitates the cooperative binding of additional myosin heads, which can at least partially explain the heightened force and delayed relaxation in the myofibril assay (kREL,slow) (Fig. 4). The increase in available myosin heads (recruitment) and slower myosin detachment both increase the number of force-bearing cross-bridges during contractions and, taken together, provide a molecular explanation for the increased tension generation from G256E myofibrils, cells, and multicellular tissue constructs, providing a consistent story across structural and length scales for the G256E mutant hiPSC-CMs (Figs. 5 and 6). Interestingly, the small decrease in gliding velocity seen with the purified mutant protein was not seen in more complex and physiological settings. Cells and EHT expressing both WT and G256E mutant myosin, actually showed enhanced contraction velocities. Increased contraction velocity, along with increased force generation, firmly establish the hypercontractile nature of the G256 HCM-causing mutation.
One of the functional characteristics in HCM patients is prolonged ventricular relaxation. Our data indicate a significant slowing of the early phase of myofibril relaxation (kREL,slow), indicating a slower cross-bridge detachment (Fig. 4E). Interestingly, we found faster relaxation in single hiPSC-CMs (Fig. 5E) and EHTs (Fig. 6H). While this relaxation kinetics data may appear conflicting initially, it is important to realize that the kREL,slow only reflects the first ~10% of myofibril relaxation. The predominant portion (~90%) of relaxation is reflected in kREL,fast, which was not significantly different in our study (Fig. 4G). Moreover, relaxation in cells and tissues is affected by various factors including (but not limited to) intracellular Ca2+ dynamics, extracellular cell–matrix interactions, and other factors that can influence myofilament kinetics such as posttranslational modifications of sarcomeric proteins. It is also important to note that the Ca2+ concentration used in myofibril experiments was at saturating conditions (i.e., pCa 4.0) which are never seen in a cardiac muscle twitch. This saturating Ca2+ level was chosen to best determine the rate of cross-bridge detachment step of the chemomechanical cycle. This rate differs significantly at submaximal levels of Ca2+, especially the dynamically changing physiological intracellular Ca2+ concentration (pCa ~ 6.0 or less) (52). At the approximately much lower magnitude and transient nature of intracellular calcium dynamics in an intact cell twitch contraction, we would expect the rate of cross-bridge detachment (kREL,slow) to be faster. Another difference in experimental conditions between the different scale measurements is that myofibril contraction was isometric, while cell and EHT contractions were against a soft hydrogel matrix and compliant posts, respectively. Soft and compliant matrices may have accelerated relaxation in single cells and EHT systems. Since hearts from HCM patients often exhibit fibrosis, increased stiffness may also play an important role in slowing relaxation. Furthermore, it is well known that relaxation kinetics are regulated through the phosphorylation of multiple sarcomeric proteins, such as cardiac troponin I (53, 54), tropomyosin (55), cardiac myosin–binding protein C (56–58), and titin (59, 60). For example, protein kinase A-mediated phosphorylation of cardiac troponin I was shown to accelerate relaxation (53). Since the molecular players for changing posttranslational modifications are absent in the myofibril system, posttranslational modifications due to differing external loads during contraction would only be reflected in single-cell and EHT models. In summary, the seemingly inconsistent relaxation kinetics may be explained by the characteristics of different scale models. Without protein-, myofibril-scale examination, one may ascribe the faster relaxation kinetics of cell and EHT mechanics to faster cross-bridge cycling. On the other hand, without cell-, tissue-level examination, one might have suggested that the G256E mutation would lead to slower relaxation of tissue. The power of our multiscale platform lies in independently evaluating the pathogenic effect of MYH7 gene mutation on the contractile machinery at various levels of complexity (i.e., proteins, myofibrils, cells, and tissues). This can serve as a starting point to dissect the complexity on disease pathogenesis and help identify responsible molecular players for inducing disease phenotypes seen in patients.
Since the transcriptional program orchestrates morphological and functional phenotypic changes of cardiomyocytes, we sought to examine alterations in the transcriptome of hiPSC-CMs induced by the MYH7 G256E mutation. MYH7 G256E mutant hiPSC-CMs upregulated genes associated with oxidative phosphorylation such as MT-ATP6, MT-ND1, and MT-ND3 (Fig. 7 E and F). This was corroborated by the Seahorse Mito Stress assay, where MYH7 G256E mutant hiPSC-CMs demonstrated 1.3-fold increased basal and maximal respiration (Fig. 7 G–L). Given increased ATPase activity of myosin heads released from a low ATP-utilizing folded-back state, the increased expression of mitochondrial genes may be an adaptive response to the increased ATP demands of the mutant. Our findings agree with previous HCM studies that have shown altered energetics as proximal consequences of HCM mutations (4, 9, 61, 62). The top downregulated genes from differential gene expression analysis of scRNAseq data included sarcomeric genes such as ANKRD1 and TTN. ANKRD1 is known as a stress-response transcriptional regulatory protein that is localized at Z-disc and interacts with titin. Previously, it was shown that knockdown of ANKRD1 prevents hypertrophic growth of cardiomyocytes through reducing phosphorylation of ERK1/2 and GATA4, the known players involved in activation of the hypertrophic gene program (63). This suggests that downregulation of ANKRD1 and TTN may be an early adaptation response to prevent the onset of pathogenic hypertrophy.
Cellular hypertrophy is a hallmark of HCM and is the principal phenotype leading to clinical diagnosis by echocardiography. Hypertrophy is regularly seen in myectomy samples of HCM patients, which often represents a later progression of disease stage, since patients undergoing myectomy tend to have more severe disease. In our hiPSC model, the MYH7 G256E mutation did lead to cellular hypertrophy but only to a modest degree on soft matrix. Cell area measurement of the micropatterned single-cell on 10-kPa hydrogel did demonstrate a statistically significant increase in cell area in G256E mutant cells (SI Appendix, Fig. S10). However, this was highly sensitive to substrate stiffness, as G256E mutant cells grown on glass substrates (of nonphysiologic stiffness) showed no difference from control (SI Appendix, Fig. S11). As the heart with HCM develops fibrosis leading to an increase in myocardial stiffness, future studies are needed to examine the effect of substrate stiffness on the development of hypertrophic responses with this mutation.
In addition to cell area, signaling analysis at the gene and protein level also suggested the lack of activation of canonical hypertrophic remodeling, consistent with the minimal hypertrophic phenotype. Previous studies have identified ERK and AKT signaling as essential regulatory signaling pathways for hypertrophic remodeling (14, 64–66). In our previous study, hiPSC-CMs carrying the early-onset HCM mutation MYH7 P710R were significantly larger than the isogenic control even on glass substrate (14). This enlargement in cell size was found to be linked to enhanced activation of ERK and AKT signaling pathways. In this study, western blot analysis revealed there was no activation of ERK or AKT signaling pathways in G256E mutant cells (SI Appendix, Fig. S18). This was further supported by scRNAseq data where there were no signs of transcriptomic activation of known hypertrophic remodeling pathways (SI Appendix, Fig. S17). For example, NPPA and NPPB, well-known hypertrophic markers which have been shown to be upregulated in septal myectomy samples, (67) were downregulated in our study (SI Appendix, Fig. S17A). P53 signaling activation has been identified as an important regulatory signal that precedes morphological remodeling in HCM (67). CDKN1A, the P53 transcriptional target, and HSP90AA1, P53 signaling stress response gene, were both downregulated in G256E hiPSC-CMs (SI Appendix, Fig. S17B). Another well-known HCM transcriptional regulator that is known to mediate pathological hypertrophic remodeling is MEF2 (68, 69). scRNAseq data indicate MEF2A as one of the top downregulated genes (SI Appendix, Fig. S17C). Furthermore, Epigenetic Landscape In Silico Deletion Analysis (70) predicted MEF2A as a top transcription factor that orchestrates gene downregulation (P = 3.11 × 10⁻⁹) that was associated with cardiac muscle hypertrophy (MEF2A, ROCK1, and IL6ST), sarcomere organization (ANKRD1, TTN, and SYNPO2L), and focal adhesion assembly (MACF1 and TLN1) (SI Appendix, Fig. S17D). It is important to note that the iPSC line we used in this study is derived from a healthy individual and has been introduced with the mutation. It is possible that additional genetic factors play a role in activating canonical hypertrophic response. In sum, despite significant increases in myosin recruitment and force in both the G256E and P710R mutations, the data suggest a divergence in hypertrophic response. This indicates that alterations in the functional parameters of myosin are not the sole stimuli for triggering canonical hypertrophic response. This raises a significant clinical inquiry regarding the approach to diagnosing HCM. Our findings imply that in addition to cardiac hypertrophy, which is the current diagnostic standard, hypercontractility may also be considered. A recent study suggests the need to stratify HCM patients based on temporal clinical stages because hypertrophy is often not the first clinical manifestation of the disease and can be delayed until adolescence or young adulthood (71). The first stage is proposed by some to be “nonhypertrophic HCM” when individuals harboring HCM-causing mutations may present with subtle echocardiographic abnormalities (including increased EF, impaired relaxation) without LV hypertrophy. Our cellular data suggest that, although the G256E mutation induces clear changes in contractile function, the changes in cell size are both subtle and stiffness-dependent. Our findings imply that in addition to cardiac hypertrophy, which is the current diagnostic standard, hypercontractility (i.e., increased ejection fraction) could serve as additional criteria for diagnosis and prognosis. Future research is needed to determine whether hypercontractility can serve as a predictor for the onset and prognosis of HCM, and to establish the specific threshold for pathogenic hypercontractility.
Last, a number of limitations of this study should be addressed. The MD simulations were performed on an ATP-bound myosin state (i.e., the postrigor conformation) for 500 ns; however, myosin undergoes multiple structural transitions between chemo-mechanical states during the cross-bridge cycle, which occurs on microsecond to millisecond timescales. The knowledge of structural changes driven by the G256E mutation on the ATP-bound myosin state enabled predictions of which chemo-mechanical states and transitions will most likely be affected by the G256E mutation during the cross-bridge cycle. To overcome this limitation, future work can involve MD simulation using starting structures in different states of myosin (e.g., prepower stroke, actin-bound, etc.). ATPase and SRX/DRX state measurements used shortened myosin constructs that do not form thick filaments in vitro, so the potential destabilizing effects of the G256E mutation on SRX heads in the thick filament context were not measured. In single hiPSC-CMs and isolated protein derived from hiPSC-CMs assays, immature protein isoforms (i.e., ɑ-MHC) may still be expressed and contribute to cell-to-cell heterogeneity; however, our data indicate the β-MHC isoform is the major isoform. Still, differences in the allelic expression of myosin genotypes and mutant myosin isoforms could explain some of the heterogeneity in cell spread area and single-cell transcriptomic analysis. Regarding the substrate-dependent effect of cell spread area in response to the G256E mutation, further studies on the impact of substrate stiffness and HCM-causing MYH7 mutations are needed. Another limitation is that by their nature, EHTs contain an averaged phenotype, and heterogenous effects at the cellular level are not captured. In our model system, other tissue structures such as vascular cells and myofibroblasts that are important players in HCM are absent. Understanding the link between altered cellular mechanics and transcriptional changes in the process of cardiomyocyte maturation and adaptation to disease needs to be addressed in the future. Last, this study only focused on examining the pathogenicity of the G256E gene variant, without delving into all of the mechanisms behind its incomplete penetrance. Future study, in cells with many different genetic backgrounds, is needed to investigate the genetic and environmental factors that may contribute to developing HCM phenotypes including hypertrophy.
In summary, we demonstrate a collaborative, multidisciplinary approach to systematically assess the biomechanical effects of an HCM-causing MYH7 mutation, G256E, with incompletely defined clinical pathogenicity, at multiple scales. The use of a multiscale platform demonstrates the pathogenicity of the G256E mutation consistently across scales, even if it does not lead to dramatic hypertrophy in vitro. We believe that this unique collaborative multiscale pipeline provides enhanced insight into the complexities of HCM caused by a MYH7 mutation with uncertain clinical data and provides a paradigm platform for studying other genetic cardiovascular diseases.
Materials and Methods
Full, extended Materials and Methods can be found in SI Appendix, Extended Methods. Extended Methods include methods for 1) Molecular Dynamics Simulation (Model Preparation, Preproduction, Simulation, and Analysis), 2) Purified Protein Experiments (Protein Expression and Purification of Recombinant Human Β-Cardiac Myosin, Actin-Activated ATPase Assay, Single ATP Turnover Assay, In Vitro Motility Assay), 3) hiPSC Gene Editing Process and Assessment, 4) hiPSC Maintenance and Their Directed Cardiac Differentiation, 5) Biomechanical Measurements of Isolated hiPSC-CM Myofibrils, 6) Single-Cell Traction Force Microscopy and Sarcomere Dynamic Measurements, 7) EHT Fabrication and Contractility Assessment, 8) Droplet-Based Single-Cell RNA Sequencing of HiPSC-CMs, and 9) Analysis of Cell Metabolism.
Supplementary Material
Appendix 01 (PDF)
Acknowledgments
This work was initiated and supported by the NIH/NIGMS grant 1RM1 GM131981-03. Additional funding supports include NIH National Research Service Award (NRSA) Postdoctoral Fellowship (5F32HL142205), Basic Science Research Program through the National Research Foundation of Korea (NRF) funded by the Ministry of Education (2022R1A6A1A03054419) and Korean Fund for Regenerative Medicine funded by Ministry of Science and ICT, and Ministry of Health and Welfare (22A0302L1-01) (to S.L.); NIH award 1K99HL153679 and American Heart Association award 20POST35211011 (to A.S.V.R.); American Heart Association - Established Investigator Award, Hoffmann/Schroepfer Foundation, Additional Venture Foundation, Joan and Sanford I. Weill Scholar Fund, and the NSF RECODE grant (to S.M.W); the Translational Research Institute for Space Health (TRISH) through Cooperative Agreement NNX16AO69A (to J.W.S.J.); a Transdisciplinary Initiative Program Grant from the Stanford Child Health Research Institute (to D.B., J.A.S, and S.M.W); NIH award K99 HL150216 and American Heart Association award 20CDA35260261 (to D.T.P); Boehringer Ingelheim Fonds (to P.H.). We acknowledge Dr. Theresia Kraft for a generous gift of an α-myosin antibody. This work would not have been possible without the Allen Institute for Cell Science team who contributed with cell line generation, especially Rebecca J. Zaunbrecher. The parental WT unedited hiPSC line, WTC, was provided by the Bruce R. Conklin Laboratory at the Gladstone Institutes and UCSF. The Allen Institute for Cell Science wishes to thank the Allen Institute for Cell Science founder, Paul G. Allen, for his vision, encouragement, and support.
Author contributions
S.L., A.S.V.R., C.A.B., K.K., S.B.B., M.C.C., D. Pathak, P.H., D.L., O.C., S.E.M., J.W.J., and D.T.P. performed research and analyzed data; B.R., J.E.S., and R.N.G. contributed new reagents/analytic tools; S.L., A.S.V.R., C.A.B., K.K., S.B.B., M.C.C., D. Pathak, D.B., S.M.W., M.R., B.L.P., D.L.M., K.M.R., and J.A.S. edited the paper; and S.L., A.S.V.R., C.A.B., K.K., S.B.B., M.C.C., D. Pathak, D.B., S.M.W., M.R., B.L.P., D.L.M., K.M.R., and J.A.S. designed research and wrote the paper.
Competing interests
J.A.S. is a co-founder and consultant for Cytokinetics Inc. and owns stock in the company, which has a focus on therapeutic treatments for cardiomyopathies and other muscle diseases. D.B. is a consultant for Cytokinetics Inc.
Footnotes
Reviewers: M.J.G., Washington University in St. Louis; and S.P.H., The University of Arizona.
Contributor Information
James A. Spudich, Email: jspudich@stanford.edu.
Daniel Bernstein, Email: danb@stanford.edu.
Data, Materials, and Software Availability
All study data are included in the article and/or SI Appendix. Single cell RNA sequencing data are publicly available with GEO accession number GSE220933 (72).
Supporting Information
References
- 1.Maron B. J., Maron M. S., Hypertrophic cardiomyopathy. Lancet 381, 242–255 (2013). [DOI] [PubMed] [Google Scholar]
- 2.Semsarian C., Ingles J., Maron M. S., Maron B. J., New perspectives on the prevalence of hypertrophic cardiomyopathy. J. Am. Coll. Cardiol. 65, 1249–1254 (2015). [DOI] [PubMed] [Google Scholar]
- 3.Marian A. J., Braunwald E., Hypertrophic cardiomyopathy. Circ. Res. 121, 749–770 (2017). [DOI] [PMC free article] [PubMed] [Google Scholar]
- 4.Ranjbarvaziri S., et al. , Altered cardiac energetics and mitochondrial dysfunction in hypertrophic cardiomyopathy. Circulation 144, 1714–1731 (2021). [DOI] [PMC free article] [PubMed] [Google Scholar]
- 5.Alfares A. A., et al. , Results of clinical genetic testing of 2,912 probands with hypertrophic cardiomyopathy: Expanded panels offer limited additional sensitivity. Genet. Med. 17, 880–888 (2015). [DOI] [PubMed] [Google Scholar]
- 6.Kaski J. P., et al. , Prevalence of sarcomere protein gene mutations in preadolescent children with hypertrophic cardiomyopathy. Circ. Cardiovasc. Genet. 2, 436–441 (2009). [DOI] [PubMed] [Google Scholar]
- 7.Vera C. D., et al. , Myosin motor domains carrying mutations implicated in early or late onset hypertrophic cardiomyopathy have similar properties. J. Biol. Chem. 294, 17451–17462 (2019). [DOI] [PMC free article] [PubMed] [Google Scholar]
- 8.Adhikari A. S., et al. , β-Cardiac myosin hypertrophic cardiomyopathy mutations release sequestered heads and increase enzymatic activity. Nat. Commun. 10, 2685 (2019). [DOI] [PMC free article] [PubMed] [Google Scholar]
- 9.Toepfer C. N., et al. , Myosin sequestration regulates sarcomere function, cardiomyocyte energetics, and metabolism, informing the pathogenesis of hypertrophic cardiomyopathy. Circulation 141, 828–842 (2020). [DOI] [PMC free article] [PubMed] [Google Scholar]
- 10.Sarkar S. S., et al. , The hypertrophic cardiomyopathy mutations R403Q and R663H increase the number of myosin heads available to interact with actin. Sci. Adv. 6, eaax0069 (2020). [DOI] [PMC free article] [PubMed] [Google Scholar]
- 11.Nag S., et al. , The myosin mesa and the basis of hypercontractility caused by hypertrophic cardiomyopathy mutations. Nat. Struct. Mol. Biol. 24, 525–533 (2017). [DOI] [PMC free article] [PubMed] [Google Scholar]
- 12.Nag S., et al. , Contractility parameters of human β-cardiac myosin with the hypertrophic cardiomyopathy mutation R403Q show loss of motor function. Sci. Adv. 1, e1500511 (2015). [DOI] [PMC free article] [PubMed] [Google Scholar]
- 13.Lowey S., et al. , Hypertrophic cardiomyopathy R403Q mutation in rabbit β-myosin reduces contractile function at the molecular and myofibrillar levels. Proc. Natl. Acad. Sci. U.S.A. 115, 11238–11243 (2018). [DOI] [PMC free article] [PubMed] [Google Scholar]
- 14.Vander Roest A. S., et al. , Hypertrophic cardiomyopathy β-cardiac myosin mutation (P710R) leads to hypercontractility by disrupting super relaxed state. Proc. Natl. Acad. Sci. U.S.A. 118, e2025030118 (2021). [DOI] [PMC free article] [PubMed] [Google Scholar]
- 15.Cohn R., et al. , A contraction stress model of hypertrophic cardiomyopathy due to sarcomere mutations. Stem Cell Rep. 12, 71–83 (2018). [DOI] [PMC free article] [PubMed] [Google Scholar]
- 16.Kawana M., Sarkar S. S., Sutton S., Ruppel K. M., Spudich J. A., Biophysical properties of human β-cardiac myosin with converter mutations that cause hypertrophic cardiomyopathy. Sci. Adv. 3, e1601959 (2017). [DOI] [PMC free article] [PubMed] [Google Scholar]
- 17.Greenberg M. J., et al. , Regulatory light chain mutations associated with cardiomyopathy affect myosin mechanics and kinetics. J. Mol. Cell Cardiol. 46, 108–115 (2009). [DOI] [PMC free article] [PubMed] [Google Scholar]
- 18.Witjas-Paalberends E. R., et al. , Mutations in MYH7 reduce the force generating capacity of sarcomeres in human familial hypertrophic cardiomyopathy. Cardiovasc. Res. 99, 432–441 (2013). [DOI] [PubMed] [Google Scholar]
- 19.Witjas-Paalberends E. R., et al. , Faster cross-bridge detachment and increased tension cost in human hypertrophic cardiomyopathy with the R403Q MYH7 mutation. J. Physiol. 592, 3257–3272 (2014). [DOI] [PMC free article] [PubMed] [Google Scholar]
- 20.Pioner J. M., et al. , Isolation and mechanical measurements of myofibrils from human induced pluripotent stem cell-derived cardiomyocytes. Stem. Cell Rep. 6, 885–896 (2016). [DOI] [PMC free article] [PubMed] [Google Scholar]
- 21.Yang K.-C., et al. , Novel adult-onset systolic cardiomyopathy due to MYH7 E848G mutation in patient-derived induced pluripotent stem cells. JACC Basic Transl. Sci. 3, 728–740 (2018). [DOI] [PMC free article] [PubMed] [Google Scholar]
- 22.Green E. M., et al. , A small-molecule inhibitor of sarcomere contractility suppresses hypertrophic cardiomyopathy in mice. Science 351, 617–621 (2016). [DOI] [PMC free article] [PubMed] [Google Scholar]
- 23.Lan F., et al. , Abnormal calcium handling properties underlie familial hypertrophic cardiomyopathy pathology in patient-specific induced pluripotent stem cells. Cell Stem. Cell 12, 101–113 (2013). [DOI] [PMC free article] [PubMed] [Google Scholar]
- 24.Han L., et al. , Study familial hypertrophic cardiomyopathy using patient-specific induced pluripotent stem cells. Cardiovasc. Res. 104, 258–269 (2014). [DOI] [PMC free article] [PubMed] [Google Scholar]
- 25.Ramachandra C. J. A., et al. , Inhibiting cardiac myeloperoxidase alleviates the relaxation defect in hypertrophic cardiomyocytes. Cardiovas. Res. 118, 517–530 (2022). [DOI] [PMC free article] [PubMed] [Google Scholar]
- 26.Wu H., et al. , Modelling diastolic dysfunction in induced pluripotent stem cell-derived cardiomyocytes from hypertrophic cardiomyopathy patients. Eur. Heart. J. 40, 3685–3695 (2019). [DOI] [PMC free article] [PubMed] [Google Scholar]
- 27.Bhagwan J. R., et al. , Isogenic models of hypertrophic cardiomyopathy unveil differential phenotypes and mechanism-driven therapeutics. J. Mol. Cell. Cardiol. 145, 43–53 (2020). [DOI] [PMC free article] [PubMed] [Google Scholar]
- 28.Kittleson M. D., et al. , Familial hypertrophic cardiomyopathy in maine coon cats. Circulation 99, 3172–3180 (1999). [DOI] [PubMed] [Google Scholar]
- 29.Geisterfer-Lowrance A. A., et al. , A mouse model of familial hypertrophic cardiomyopathy. Science 272, 731–734 (1996). [DOI] [PubMed] [Google Scholar]
- 30.Vikstrom K. L., Factor S. M., Leinwand L. A., Mice expressing mutant myosin heavy chains are a model for familial hypertrophic cardiomyopathy. Mol. Med. 2, 556–567 (1996). [PMC free article] [PubMed] [Google Scholar]
- 31.Vakrou S., et al. , Differences in molecular phenotype in mouse and human hypertrophic cardiomyopathy. Sci. Rep. 11, 13163 (2021). [DOI] [PMC free article] [PubMed] [Google Scholar]
- 32.Fatkin D., et al. , Neonatal cardiomyopathy in mice homozygous for the Arg403Gln mutation in the alpha cardiac myosin heavy chain gene. J. Clin. Invest. 103, 147–153 (1999). [DOI] [PMC free article] [PubMed] [Google Scholar]
- 33.Marian A. J., et al. , A transgenic rabbit model for human hypertrophic cardiomyopathy. J. Clin. Invest. 104, 1683–1692 (1999). [DOI] [PMC free article] [PubMed] [Google Scholar]
- 34.Fananapazir L., Epstein N. D., Genotype-phenotype correlations in hypertrophic cardiomyopathy. Insights provided by comparisons of kindreds with distinct and identical beta-myosin heavy chain gene mutations. Circulation 89, 22–32 (1994). [DOI] [PubMed] [Google Scholar]
- 35.Van Driest S. L., et al. , Prevalence and severity of “benign” mutations in the beta-myosin heavy chain, cardiac troponin T, and alpha-tropomyosin genes in hypertrophic cardiomyopathy. Circulation 106, 3085–3090 (2002). [DOI] [PubMed] [Google Scholar]
- 36.Childers M. C., Daggett V., Insights from molecular dynamics simulations for computational protein design. Mol. Syst. Des. Eng. 2, 9–33 (2017). [DOI] [PMC free article] [PubMed] [Google Scholar]
- 37.Ferina J., Daggett V., Visualizing protein folding and unfolding. J. Mol. Biol. 431, 1540–1564 (2019). [DOI] [PubMed] [Google Scholar]
- 38.Childers M. C., Geeves M., Daggett V., Regnier M., Modulation of post-powerstroke dynamics in myosin II by 2′-deoxy-ADP. Arch. Biochem. Biophys. 699, 108733 (2021). [DOI] [PMC free article] [PubMed] [Google Scholar]
- 39.Ribeiro A. J. S., et al. , Multi-imaging method to assay the contractile mechanical output of micropatterned human iPSC-derived cardiac myocytes. Circ. Res. 120, 1572–1583 (2017). [DOI] [PMC free article] [PubMed] [Google Scholar]
- 40.Leonard A., et al. , Afterload promotes maturation of human induced pluripotent stem cell derived cardiomyocytes in engineered heart tissues. J. Mol. Cell Cardiol. 118, 147–158 (2018). [DOI] [PMC free article] [PubMed] [Google Scholar]
- 41.Bremner S. B., et al. , Full-length dystrophin deficiency leads to contractile and calcium transient defects in human engineered heart tissues. J. Tissue Eng. 13, 20417314221119628 (2022). [DOI] [PMC free article] [PubMed] [Google Scholar]
- 42.Cuda G., Fananapazir L., Epstein N. D., Sellers J. R., The in vitro motility activity of beta-cardiac myosin depends on the nature of the beta-myosin heavy chain gene mutation in hypertrophic cardiomyopathy. J. Muscle. Res. Cell Motil. 18, 275–283 (1997). [DOI] [PubMed] [Google Scholar]
- 43.Sommese R. F., et al. , Molecular consequences of the R453C hypertrophic cardiomyopathy mutation on human β-cardiac myosin motor function. Proc. Natl. Acad. Sci. U.S.A. 110, 12607–12612 (2013). [DOI] [PMC free article] [PubMed] [Google Scholar]
- 44.Schmid M., Toepfer C. N., Cardiac myosin super relaxation (SRX): A perspective on fundamental biology, human disease and therapeutics. Biol. Open 10, bio057646 (2021). [DOI] [PMC free article] [PubMed] [Google Scholar]
- 45.Poggesi C., Tesi C., Stehle R., Sarcomeric determinants of striated muscle relaxation kinetics. Pflugers Arch–Eur. J. Physiol. 449, 505–517 (2005). [DOI] [PubMed] [Google Scholar]
- 46.Kreutziger K. L., et al. , Calcium binding kinetics of troponin C strongly modulate cooperative activation and tension kinetics in cardiac muscle. J. Mol. Cell Cardiol. 50, 165–174 (2011). [DOI] [PMC free article] [PubMed] [Google Scholar]
- 47.Ribeiro A. J. S., et al. , Contractility of single cardiomyocytes differentiated from pluripotent stem cells depends on physiological shape and substrate stiffness. Proc. Natl. Acad. Sci. U.S.A. 112, 12705–12710 (2015). [DOI] [PMC free article] [PubMed] [Google Scholar]
- 48.Roberts B., et al. , Fluorescent gene tagging of transcriptionally silent genes in hiPSCs. Stem Cell Rep. 12, 1145–1158 (2019). [DOI] [PMC free article] [PubMed] [Google Scholar]
- 49.Bremner S., Goldstein A. J., Higashi T., Sniadecki N. J., Engineered Heart Tissues for Contractile, Structural, and Transcriptional Assessment of Human Pluripotent Stem Cell-Derived Cardiomyocytes in a Three-Dimensional, Auxotonic Environment in Cardiac Tissue Engineering: Methods and Protocols, Coulombe K. L. K., Black L. D., Eds. (Methods in Molecular Biology, Springer, US, 2022), pp. 87–97. [DOI] [PubMed] [Google Scholar]
- 50.Coureux P., Sweeney H. L., Houdusse A., Three myosin V structures delineate essential features of chemo-mechanical transduction. EMBO J. 23, 4527–4537 (2004). [DOI] [PMC free article] [PubMed] [Google Scholar]
- 51.Liu Y.-W., et al. , Human embryonic stem cell-derived cardiomyocytes restore function in infarcted hearts of non-human primates. Nat. Biotechnol. 36, 597–605 (2018). [DOI] [PMC free article] [PubMed] [Google Scholar]
- 52.Fearnley C. J., Roderick H. L., Bootman M. D., Calcium signaling in cardiac myocytes. Cold Spring Harb. Perspect. Biol. 3, a004242 (2011). [DOI] [PMC free article] [PubMed] [Google Scholar]
- 53.Rao V., et al. , PKA phosphorylation of cardiac troponin I modulates activation and relaxation kinetics of ventricular myofibrils. Biophys. J. 107, 1196–1204 (2014). [DOI] [PMC free article] [PubMed] [Google Scholar]
- 54.Kentish J. C., et al. , Phosphorylation of troponin I by protein kinase A accelerates relaxation and crossbridge cycle kinetics in mouse ventricular muscle. Circ. Res. 88, 1059–1065 (2001). [DOI] [PubMed] [Google Scholar]
- 55.Nixon B. R., et al. , Tropomyosin Ser-283 pseudo-phosphorylation slows myofibril relaxation. Arch. Biochem. Biophys. 535, 30–38 (2013). [DOI] [PMC free article] [PubMed] [Google Scholar]
- 56.McNamara J. W., Singh R. R., Sadayappan S., Cardiac myosin binding protein-C phosphorylation regulates the super-relaxed state of myosin. Proc. Natl. Acad. Sci. U.S.A. 116, 11731–11736 (2019). [DOI] [PMC free article] [PubMed] [Google Scholar]
- 57.Tong C. W., Stelzer J. E., Greaser M. L., Powers P. A., Moss R. L., Acceleration of crossbridge kinetics by protein kinase A phosphorylation of cardiac myosin binding protein C modulates cardiac function. Circ. Res. 103, 974–982 (2008). [DOI] [PMC free article] [PubMed] [Google Scholar]
- 58.Colson B. A., et al. , Protein kinase A-mediated phosphorylation of cMyBP-C increases proximity of myosin heads to actin in resting myocardium. Circ. Res. 103, 244–251 (2008). [DOI] [PMC free article] [PubMed] [Google Scholar]
- 59.Yamasaki R., et al. , Protein kinase A phosphorylates Titin’s cardiac-specific N2B domain and reduces passive tension in rat cardiac myocytes. Circ. Res. 90, 1181–1188 (2002). [DOI] [PubMed] [Google Scholar]
- 60.Krüger M., et al. , Protein kinase G modulates human myocardial passive stiffness by phosphorylation of the Titin springs. Circ. Res. 104, 87–94 (2009). [DOI] [PubMed] [Google Scholar]
- 61.Nomura S., et al. , Cardiomyocyte gene programs encoding morphological and functional signatures in cardiac hypertrophy and failure. Nat. Commun. 9, 4435 (2018). [DOI] [PMC free article] [PubMed] [Google Scholar]
- 62.Crilley J. G., et al. , Hypertrophic cardiomyopathy due to sarcomeric gene mutations is characterized by impaired energy metabolism irrespective of the degree of hypertrophy. J. Am. Coll. Cardiol. 41, 1776–1782 (2003). [DOI] [PubMed] [Google Scholar]
- 63.Zhong L., et al. , Targeted inhibition of ANKRD1 disrupts sarcomeric ERK-GATA4 signal transduction and abrogates phenylephrine-induced cardiomyocyte hypertrophy. Cardiovas. Res. 106, 261–271 (2015). [DOI] [PMC free article] [PubMed] [Google Scholar]
- 64.Patel R., et al. , Simvastatin induces regression of cardiac hypertrophy and fibrosis and improves cardiac function in a transgenic rabbit model of human hypertrophic cardiomyopathy. Circulation 104, 317–324 (2001). [DOI] [PMC free article] [PubMed] [Google Scholar]
- 65.Robinson P., et al. , Hypertrophic cardiomyopathy mutations increase myofilament Ca2+ buffering, alter intracellular Ca2+ handling, and stimulate Ca2+-dependent signaling. J. Biol. Chem. 293, 10487–10499 (2018). [DOI] [PMC free article] [PubMed] [Google Scholar]
- 66.Davis J., et al. , A tension-based model distinguishes hypertrophic versus dilated cardiomyopathy. Cell 165, 1147–1159 (2016). [DOI] [PMC free article] [PubMed] [Google Scholar]
- 67.Wehrens M., et al. , Single-cell transcriptomics provides insights into hypertrophic cardiomyopathy. Cell Rep. 39, 110809 (2022). [DOI] [PubMed] [Google Scholar]
- 68.Kolodziejczyk S. M., et al. , MEF2 is upregulated during cardiac hypertrophy and is required for normal post-natal growth of the myocardium. Curr. Biol. 9, 1203–1206 (1999). [DOI] [PubMed] [Google Scholar]
- 69.Passier R., et al. , CaM kinase signaling induces cardiac hypertrophy and activates the MEF2 transcription factor in vivo. J. Clin. Invest. 105, 1395–1406 (2000). [DOI] [PMC free article] [PubMed] [Google Scholar]
- 70.Qin Q., et al. , Lisa: Inferring transcriptional regulators through integrative modeling of public chromatin accessibility and ChIP-seq data. Genome Biol. 21, 32 (2020). [DOI] [PMC free article] [PubMed] [Google Scholar]
- 71.Olivotto I., Cecchi F., Poggesi C., Yacoub M. H., Patterns of disease progression in hypertrophic cardiomyopathy. Circulation Heart Failure 5, 535–546 (2012). [DOI] [PubMed] [Google Scholar]
- 72.Lee S., MYH7 G256E hiPSC-CM (Day 30). NCBI GEO. https://www.ncbi.nlm.nih.gov/geo/query/acc.cgi?acc=GSE220933. Deposited 14 December 2022. [Google Scholar]
Associated Data
This section collects any data citations, data availability statements, or supplementary materials included in this article.
Supplementary Materials
Appendix 01 (PDF)
Data Availability Statement
All study data are included in the article and/or SI Appendix. Single cell RNA sequencing data are publicly available with GEO accession number GSE220933 (72).