

Abstract
Cryo-electron microscopy has delivered a resolution revolution for biological self-assemblies, yet only a handful of structures have been solved for synthetic supramolecular materials. Particularly for chromophore supramolecular aggregates, high-resolution structures are necessary for understanding and modulating the long-range excitonic coupling. Here, we present a 3.3 Å structure of prototypical biomimetic light-harvesting nanotubes derived from an amphiphilic cyanine dye (C8S3-Cl). Helical 3D reconstruction directly visualizes the chromophore packing that controls the excitonic properties. Our structure clearly shows a brick layer arrangement, revising the previously hypothesized herringbone arrangement. Furthermore, we identify a new non-biological supramolecular motif—interlocking sulfonates—that may be responsible for the slip-stacked packing and J-aggregate nature of the light-harvesting nanotubes. This work shows how independently obtained native-state structures complement photophysical measurements and will enable accurate understanding of (excitonic) structure–function properties, informing materials design for light-harvesting chromophore aggregates.
Pi-conjugated chromophores form supramolecular polymeric architectures (nanotubes, sheets or bundles) that display drastic changes in photophysical properties (absorption and emission shifts by 2,000–3,000 cm−1, extremely narrow linewidths and enhanced quantum yields) relative to the monomeric counterparts1–3. These drastic changes arise from long-range excitonic coupling—transition dipole moments (TDMs) of individual molecules coherently interacting over long distances to form delocalized Frenkel excitons. The delocalization of excitons in chromophore assemblies can be leveraged to achieve emergent behaviours such as wide spectral tunability (spanning the visible through shortwave infrared wavelengths), efficient ultrafast excitonic energy transport, high photochemical stability and excitonic superradiance, which provide a compelling basis for modern optoelectronic and energy-harvesting technologies4–6.
The classic signatures of excitonic coupling are shifts and narrowing in optical absorption of chromophores upon concentration or in poor solvents. Jelley and Scheibe concurrently observed this phenomenon in 1936, where absorption of a pseudoisocyanine dye red-shifted and narrowed upon concentration (later named ‘J-aggregation’)7,8. Subsequently, a theoretical description of this behavior was developed invoking how direction-dependent TDM coupling among close-packed chromophores creates extended excitonic states, which interact collectively with light9–11. As a result, the excitonic shifts are sensitive to the molecular-scale geometric arrangements. Kasha’s model relates observed spectral shifts to the underlying molecular arrangements in 1D systems—H-aggregates with co-facial packings of molecules have blue-shifted optical spectra, whereas J-aggregates with head-to-tail arrangements have red-shifted spectra10. Recent work has shown several extensions of this theory, illustrating that excitonic couplings are also sensitive to the nature of various intermolecular interactions, structural and/or energetic disorder, as well as the overall aggregate topology (linear, 2D sheets, tubes and so on)12–14.
Natural photosynthetic antennae employ similar excitonic coupling to efficiently channel incoherent solar energy to a reaction centre for charge separation2. Fenna, Mathews and Olson solved the structure of the light-harvesting complex from green sulfur bacteria, uncovering the 3D chromophore arrangement within the protein encapsulated complex15. This structure was instrumental for the host of spectroscopic and theoretical studies that followed, revealing the complex nature of ultrafast energy transfer pathways within the (now named) Fenna–Mathews–Olson (FMO) complex16–20. Inspired by the naturally evolved efficient light harvesters, many scientists have sought to engineer synthetic supramolecular analogues that leverage exciton delocalization and energetic disorder to drive energy transport at the nanoscale21–27.
However, efforts to engineer the self-assemblies were hindered by the absence of a high-resolution structure among the synthetic supramolecular analogues. Indirect methods involving temperature-dependent spectroscopy and extensive modelling had to be undertaken to get any supramolecular structure–excitonic property relationships12,13,28. The presence of disorder, higher dimensionality, and other types of couplings cause ambiguities in the structure–property relationships. High-resolution structures of the self-assemblies have eluded the community for the following reasons.
Even though the excitonic coupling in the chromophore aggregates is strong, the self-assembly itself is driven by weak dispersive forces (π−π stacking, van der Waals interactions and entropically driven micellization) leading to structural disorder and the absence of supramolecular phonon modes despite the long-range periodicity29–31.
Like other amphiphiles, molecular aggregates often cannot be crystallized due to the absence of symmetry elements that can be packed into a 3D space group. For instance, the only helical filaments that may be packed into a crystal so that all subunits are in an equivalent environment contain either two, three, four or six subunits per turn32,33. Even if they do crystallize, the solid-state crystal structures will not be representative of the inherent solution state assembly that causes the emergent excitonic phenomena. As a result, such chromophore aggregates have not been amenable to traditional crystallographic approaches, rendering any high-resolution structural information highly elusive.
The structures are also known to be extremely sensitive to minute changes in their environments, forming in very specific solvent mixtures and falling apart with mild heating or drying34,35. This limits the scope of the applicable solution-state experimental techniques (for example, nuclear magnetic resonance (NMR)).
Cryo-electron microscopy (cryo-EM) has recently emerged as the dominant technique in structural biology for determining the atomic structure of proteins, viral assemblies and so on32. The widely used plunge freezing method of sample preparation ensures the preservation of the native solvated structure. However, its application to non-biological synthetic self-assemblies has been extremely limited32,36–38. Currently, there are no high-resolution cryo-EM structures among the chromophore aggregates with distinguishable molecular-level details. Major bottlenecks involve the lack of a vast prior knowledge that can be relied upon and sample-related issues (larger disorder, experimental conditions or sensitivity to the environment). Here, we present a high-resolution cryo-EM structure of a model supramolecular chromophore aggregate—light-harvesting nanotubes (LHNs). We demonstrate how the independently obtained structure influences the modelling of excitonic properties and the design of chemically modified assemblies.
Results and discussion
Optical spectroscopy of the LHNs
Originally synthesized in 1995, amphiphilic cyanine dye 3,3′-bis (3-sulfopropyl)-5,5′,6,6′-tetrachloro-1,1′-dioctylbenzimidacarbocyanine or C8S3-Cl (Fig. 1a), aggregates into double-walled nanotubes and bundled morphologies39. The presence of long hydrophobic alkyl chains and hydrophilic sulfonate groups rationalized the bilayer micelle-like self-assembly into double-walled nanotubes, also known as LHNs. The double-walled nanotubes of C8S3-Cl (Fig. 1c), have been explored extensively as a model excitonic system that mimics the structural complexity of natural photosynthetic antennae, showing a high degree of exciton superradiance, ultrafast energy transport and micrometre-scale exciton migration at room temperature5,21,40,41. As shown in Fig. 1b, the aggregated LHNs have a red-shifted absorption from the monomer, a signature of J-aggregation. The absorption spectrum of the LHNs displays characteristic features with two sharp low energy peaks and several shoulder peaks at higher energies (Fig. 1b). Previous studies have assigned the sharp peaks at 589 and 599 nm to polarization of excitons along the tube axis of outer and inner walls respectively, termed outer wall parallel (OW||) and inner wall parallel (IW||) peaks, respectively42,43. Polarization perpendicular to the tube axis results in several broader shoulder peaks at higher energy, labelled as OW⊥ and IW⊥ peaks in Fig. 1b ref. 42. Selective reduction of outer wall chromophores allows the isolation of the inner wall spectra from the double-walled nanotube43. Figure 1d shows the absorption and linear dichroism spectra of the photochemically isolated inner wall LHNs with four distinct peaks (two parallel and two perpendicular). The presence of four distinct peaks in the inner wall spectra previously led researchers to propose a herringbone model with two molecules per unit cell39. LHNs also possess a strong circular dichroism signature, though the structural origin of the persistent chirality is yet to be elucidated42,44–47.
Fig. 1 |. LHNs of amphiphilic cyanine dye C8S3-Cl.

a, Structure of C8S3-Cl. b, Absorption spectra of C8S3-Cl monomer in methanol (dashed line) and LHNs in 30% v/v methanol:water mixture (solid line), the red shifted spectrum of LHNs indicate J-aggregation. c, Representative cryo-EM micrograph of LHNs showing double-walled nanotubular morphology with uniform widths. d, Absorption (blue) and linear dichroism (black) spectra of photochemically isolated inner wall LHNs with polarizations parallel (solid) and perpendicular (dashed) to the tube axis. Four distinct peaks are visible (two parallel and two perpendicular). e, Power spectrum of the LHNs averaged from the power spectra of several nanotube segments from the cryo-EM images.
Extended Data Table 1 details a literature survey of structural studies on pristine LHNs, their methodologies and key findings. As shown in Extended Data Table 1, all the nanoscale structural information was derived from low-resolution electron microscopy (with no molecular-level features), excitonic modeling and molecular dynamics simulations that were validated by comparing to the optical spectra. But the complex nature of excitonic couplings, which may include additional van der Waals or charge transfer interactions, makes such spectral assignments ambiguous48,49. All the nanoscale molecular packing parameters were either obtained from simulated models or extrapolated from molecular crystals. Solution-based structural techniques, such as small angle X-ray scattering, are not stand-alone and require additional modelling for data interpretation50. Native-state experimental probes, such as cryo-electron tomography (cryo-ET), have uncovered several mesoscale structural details such as the double-walled nature of LHNs, as well as twisted and straight bundle structures, though the resolution of the reconstructed 3D maps was not high enough to resolve the nanoscale molecular packings21.
High-resolution structure of the LHNs
Figure 1e shows a power spectrum of the LHNs averaged from the power spectra of hundreds of thousands of segments of length 414.7 Å. The meridional layer line (corresponding to n = 0 Bessel function) is at 1/(9.9 Å), showing a helical rise of 9.9 Å per asymmetric unit. A striking feature in the power spectrum is the presence of weak layer lines extending out as far as 1/(3.9 Å), providing evidence for local order in the self-assembled nanotubes. The observation of layer lines corresponding to Bessel functions of order n = 0, 5, 10 and so on, further suggests a possible C5 rotational symmetry in addition to the helical symmetry. We use these parameters as a starting point to iteratively reconstruct the tube density for both outer and inner walls (Fig. 2).
Fig. 2 |. Cryo-EM density maps of the LHNs.

a, Top view of the double-walled nanotubes with diameters labelled, blue arrows indicate the position of the groves in the outer wall. b, Side view of the outer wall. c,d, Side (c) and cutaway (d) views of the inner wall. Black boxes respective inner- and outer-wall ASUs.
We obtain a cryo-EM map for the inner wall at 3.3 Å resolution, and the outer wall at 4.3 Å with a helical rise of h = 9.9 Å and twist of γ = 33.6° for both the walls. The inner wall has a higher resolution as it is more ordered, possibly due to tighter packing and protection from the solvent environment. The diameters obtained from the reconstructed densities are ~63 and ~143 Å (Fig. 2a), close to the previously reported values of 6 ± 1 nm and 13 ± 1 nm for the inner and outer walls, respectively43. As seen in Fig. 2a,b, the outer wall density shows some grooves, denoted by blue arrows. Thus, the outer wall can be better described as broad helically wound strips with a gap in between each asymmetric unit, rather than uniformly packed molecular helices like the inner wall (Fig. 2c,d). This level of structural details was not possible to be seen experimentally until now.
The reconstructed inner wall density was fit with a molecular model, and an overlay of the two is shown in Fig. 3a,b. We observed an excellent correlation between the molecular model and the reconstructed density. The asymmetric unit (ASU) for the inner wall contains six molecules (Fig. 3c and Extended Data Fig. 1). Five ASUs go around the circumference of the tube to complete a single turn (Fig. 3d), and each adjacent turn is related by the helical symmetry parameters (h,γ). Figure 3e,f shows space-filling models for two such segments (magenta and cyan). Another report with a low-resolution reconstruction of C8S3-Cl and C8S2 mixture nanotubes obtained 6-start helices with a pitch of 127 Å from 2D projections37. Our 3D reconstruction shows 5-start helices with a pitch of 105 Å. We note an ambiguity in the assignment of the helical hand, which is inherent to any helical reconstruction from 2D projections51,52. For protein or peptide assemblies containing α-helices, the known hand of the α-helices (right-handed for L amino acids) allows for unambiguous determination of the hand at any resolution better than ~4.5 Å (refs. 32,53). Similarly, for β-stranded structures, the hydrogen-bonding pattern allows for determining the absolute hand at better than ~2.8 Å resolution53. However, C8S3-Cl being an achiral planar molecule, presents no clear preference for a single handedness. Circular dichroism spectra (Extended Data Fig. 2) on identically prepared samples of the LHNs showed varying intensities and sometimes even opposite signs, hinting that the LHNs may exist in an ensemble of both right- and left-handed helices (related by mirror image symmetry). We report the structure with a right-handed 5-start helix for simplicity.
Fig. 3 |. Molecular model for the inner wall LHNs.

a,b, Inner wall density overlaid with the refined structure showing excellent agreement with the reconstructed density (side (a) and cutaway (b) views). c, Structure of ASU with six non-identical molecules. d, Top-down view of the five repeats of the ASUs going around the circumference. e,f, Side (e) and top-down (f) views of two helically translated repeats of the ring in d. The yellow arrow denotes the helical translation vector for the obtained helical rise and helical twist parameters.
Insights from the high-resolution structure
Both brick layer and herringbone arrangements had been proposed for the nanoscale structure of the LHNs with the plausibility of each geometry still open to debate6,43,50,54,55. However, Fig. 3 clearly shows slip-stacked packing of all the dye molecules with a brick layer arrangement leading to a structural reassignment with direct ramifications towards the excitonic properties. The herringbone geometry was originally motivated by apparent symmetry breaking in the optical spectra of the isolated inner wall, resulting in multiple parallel and perpendicular polarized peaks (Fig. 1d). While this was a reasonable assumption with the limited structural knowledge at the time, our results clearly show that all the molecules are in a brick layer arrangement, and the six unique molecules must form the basis for the ground-state inner wall structure. Within the ASU, the π−π stacking distance is 3.4 Å and the slip between adjacent molecules is 9.0 Å. Our results represent a direct experimental confirmation of these supramolecular packing parameters, that are often used as input parameters in the Frenkel exciton model for calculating the excitonic spectra.
Furthermore, we observe regular crisscrossed pattern of the lobes in the lumen of the inner wall (Fig. 3b, c and Extended Data Fig. 3). These lobes are assigned to the sulfonate groups from neighbouring dye molecules, where a sulfonate from the neighbouring dye stabilizes the delocalized positive charge on polymethine chromophore. Previously, the sulfonate groups were thought to impart hydrophilicity in the amphiphile; however, our results indicate that the sulfonates also appear to be a structural motif. We believe the interlocking sulfonates are responsible for the slip-stacked packing geometry that is crucial for the J-aggregate behaviour (optical red shifts, high superradiance) of the LHNs. Previously, chemical handles like sterics and hydrogen bonding, have been used to enforce slip-stacked packing in other chromophores29,56. However, this interlocking motif was not present in any of the previously proposed models (Extended Data Table 1).
Due to the lower resolution of the outer wall map, we could not obtain a high-resolution structure for the outer wall. Instead, we fit the outer wall density to a geometry optimized model with manual constraints, shown in Extended Data Fig. 4. We focus on the locations of the sulfonate groups as well as conjugated dye backbone that are better resolved in the cryo-EM map (Fig. 2). Some of the unique structural features of the outer wall are clearly resolved in the cryo-EM map as well as in the fitted model. Rather than a continuous molecular packing like the inner wall, the outer wall shows helically wound strips separated by gaps between each ASU with the overall symmetry parameters preserved, C5 rotational symmetry with the helical symmetry parameters of rise h = 9.9 Å and angle γ = 33.6°. Within each of the helical strips, the conjugated backbone of the molecules follows a slip-stacked brick layer pattern similar to the inner wall albeit with eight molecules per ASU (due to the radius increment from the inner wall to the outer wall). The sulfonate groups within the densely packed bands also follow an interlocking pattern as the inner wall, while those near the gaps are more disordered and less resolved. In Fig. 2a, we observe some continuous density in the middle of the two walls. While the origin of this density is unclear, it should be noted that this does not correspond to the alkyl groups since we do not observe a continuous arm extending from the dye backbone, similar to the sulfonate chains.
Dimerized Frenkel exciton model for optical spectra
Optical properties of the LHNs and other excitonic systems are computed using the Frenkel exciton Hamiltonian57. The couplings are based on specific molecular packing arrangements which, until now, would be estimated from simulations (Extended Data Table 1). Here, we reconstruct the excitonic structure of the inner wall and reproduce the absorption, linear and circular dichroism spectra using the structural information from the cryo-EM structure. We refer the readers elsewhere for detailed studies on exciton transport within the LHNs6,21,31,40,57–59. For simplicity, we propose a minimal dimerized Frenkel exciton model with no disorder, aiming to verify the extent to which the cryo-EM structure can reproduce the observed excitonic spectra. Instead of using all six molecules in the ASU, which is computationally expensive, we separate them into three adjacent pairs of molecules and average over their positions by assuming a helical symmetry with while retaining the C5 rotational symmetry (Fig. 4a). This reduces the number of molecules within an ASU to two while keeping a reasonable level of atomistic details of the original structure. Construction of the tube and relevant geometric parameters are shown in Fig. 4b. A detailed description of the methodology is given in Supplementary Section 1.
Fig. 4 |. Dimerized Frenkel exciton model for the inner wall.

a, ASU as viewed from inside the tube with intra-dimer coupling matrix ΔH. b, Schematic showing the relevant geometric parameters and construction of the nanotube from the ASU. c–e, Fitting the calculated spectra from the dimerized Frenkel exciton model to the experimental; absorption (c), linear dichroism (d) and circular dichroism (e) spectra of the isolated inner wall LHNs. Solid black lines: experimental spectra; blue lines: calculated spectra from 1,500 monomer nanotube (length of each helical strand M = 150); see Extended Data Fig. 5 for size dependence, dashed black lines: calculated spectra with periodic boundary conditions and added Lorentzian broadenings. The Lorentzian broadening parameters are given in Supplementary Table 2.
Based on the dimer model and the associated helical-rotational symmetry, the excitonic structure of an infinitely long inner wall can be described by a collection of 2 × 2 matrices Hk,k′(l,l′), where k = 0, …, 4 is the rotational quantum number, k′ is the quasimomentum associated with the helical symmetry and l,l′ = 1, 2 (refs. 13,60). These matrices are obtained by block-diagonalizing the full Hamiltonian H by applying the Bloch theorem, and the matrix elements of H are calculated based on the cryo-EM structure. The corresponding excitonic couplings are calculated using the transition charges method61. In practice, this Hamiltonian with parameters estimated from the cryo-EM model and quantum chemistry calculations only gives two bright states. To resolve this inconsistency, we break the dimer symmetry by adding to Η∥ and Η⊥ (detailed forms in Supplementary Section 1) an effective intra-dimer coupling matrix :
| (1) |
where and are free parameters subjecting the on-site energies and and the intra-dimer coupling such that the locations and relative brightness of the absorption peaks match the experimental values. This approach also turns the resulting fitting neither under-determined nor overdetermined. The exact origin of is unclear as a full account of the possible types of intermolecular interactions (for example, charge-transfer and ground-state dipoles) requires higher-level computations. However, the high-resolution structure presented here forms a benchmark for the geometric parameters that the excitonic couplings depend so sensitively upon. Once is given, we adopt expressions reported previously to calculate various linear spectra and compare to experimental measurements62.
The resulting absorption, linear dichroism and circular dichroism spectra are shown in Fig. 4c–e, showing reasonable agreement with the experiments. Extended Data Fig. 5 shows the calculated spectra for aggregates of different sizes. The longer the aggregate length, the more dispersed are the spectral features. The fitted parameters used in are and (detailed lists of parameters are given in Supplementary Tables 1 and 2). In Supplementary Table 2, we find the lowest energy peak (#1) is the narrowest, which can be explained by the lack of spontaneous phonon emission scattering, consistent with previous observations of strong temperature dependence of the lowest energy (or near band-edge) peak and the lack thereof for the three higher energy (or away from band-edge) peaks12,25,28. From these simulations, we estimate the coherence size of the bright excitonic states in the inner wall under the experimental conditions to be 1,000 < Ncoh < 1,500. We note that this coherence size is an estimate based on a best match with the experimental spectra (not including any Lorentzian broadening). Since the model does not include any disorder, the actual coherence size is probably smaller. Previous models have obtained similar values (~103) with finite truncation of tube length and disorder63,64. The fit for the circular dichroism spectra (Fig. 4c) is less than ideal. In particular, the high-frequency positive-valued shoulder is not reproduced with the model. We hypothesize that the dynamics of the right- and left-handed helices described in Extended Data Fig. 2 results in a slightly modulated circular dichroism spectrum.
We consider two constraints to this model set by the long- and short-range excitonic couplings (Supplementary Section 1). The first condition from the long-range coupling predicts the energy gap between the parallel- and the perpendicular-polarized peaks:
| (2) |
where , , and are the transition dipole moment of the molecule, area of a molecule projected onto the cylindrical surface, radius of the cylinder and angle between the cylinder axis and the transition dipole moment, respectively. The second constraint relates the short-range excitonic couplings and the energy gap between the two perpendicular-polarized peaks and places an upper limit on the short-range couplings. Equation (2) leads to ∆E⟂/∥ = 495cm−1, which agrees remarkably well with the experimental value of 489 cm−1, a testament to the consistency between the cryo-EM structure and the Frenkel exciton model. We note that the dimerized model is fully consistent with it regardless of the magnitude of adopted.
Impact of chemical modifications on the self-assembly
To explore the structural sensitivity of self-assembly, we tested two different chemical modifications to the C8S3-Cl scaffold—length of the sulfonate chains and halogen substitution (Fig. 5a)39,65. Previous work has found that replacing the four chlorine atoms with the larger bromine increases the diameter of the double-walled nanotubes while conserving the molecular packing65. Figure 5b shows overlayed normalized absorptions of the prototypical LHNs and C8S3-Br aggregates. Besides the slight broadening and red shift of the IW|| and OW|| peaks, most spectral features are well conserved. Cryo-EM of C8S3-Br aggregates also shows a well-conserved double-walled nanotubular morphology (Fig. 5c). However, C8S3-Br nanotubes have varying tube diameters unlike the uniform tube widths of the pristine LHNs. Using the larger molecule size and assuming the same packings and symmetry parameters as the pristine LHNs, one would expect the nanotubes to be only slightly wider by ~1%. This surprising observation led us to analyse the widths of ~105 nanotube segments, histogrammed in Fig. 5d (taking into account the physical limit set by the pixel size). C8S3-Cl shows a single narrow peak centered at ~140 Å, but C8S3-Br shows a much wider distribution spreading from 110–180 Å. As seen from Fig. 5c, both inner and outer wall diameters of C8S3-Br nanotubes seem to increase or decrease in sync, and the inter-wall separation remains the same. Additionally, we found that C8S3-Br nanotubes initially form short nanotubular fragments that slowly convert into longer bundles over the course of a month. Dynamic light scattering (DLS) and cryo-EM images (Extended Data Fig. 6) taken over this duration show striking differences between the first day and over 5 weeks, confirming this observation.
Fig. 5 |. Impact of chemical modifications on the self-assembly.
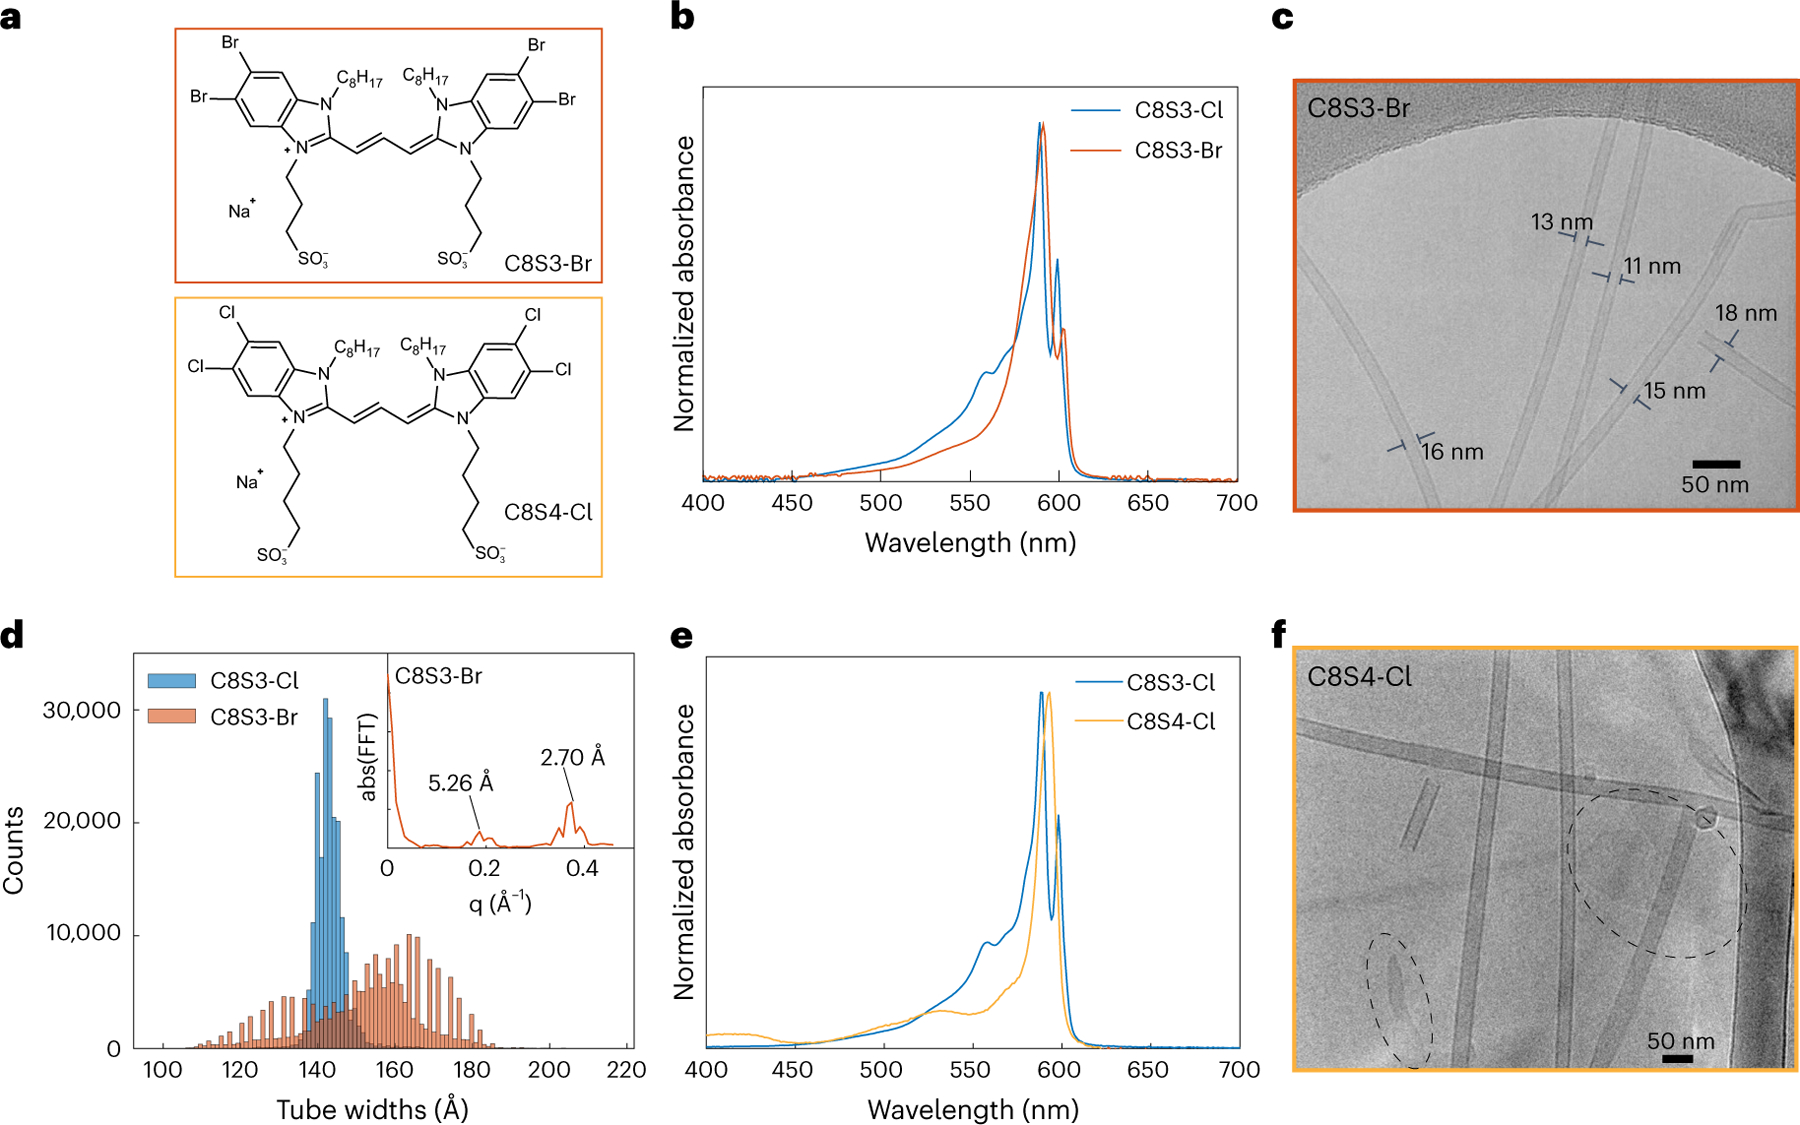
a, Structures of the dyes C8S3-Br and C8S4-Cl. b, Normalized absorption spectra of C8S3-Cl aggregates in blue (pristine LHNs) and C8S3-Br aggregates in red. c, Cryo-EM micrograph of C8S3-Br aggregates showing double-walled nanotubular morphology with variable tube diameters labelled on the image. d, Histograms of C8S3-Cl and C8S3-Br tube widths over ~105 segments. Inset, Fourier transform of C8S3-Br histogram with the step size of the discretized tube widths labelled. e, Normalized absorption spectra of the pristine LHNs (blue) and C8S4-Cl aggregates (yellow). f, Cryo-EM micrograph of C8S4-Cl aggregates showing nanotubes and sheets (dashed circles).
Because of such complications, we could not readily reconstruct the C8S3-Br nanotubes to obtain a 3D map. In principle, a massive data set might be collected to obtain a few relatively homogeneous subsets, as was done previously for a spindle-shaped viral tube66. Nevertheless, the C8S3-Br widths histogram in Fig. 5d shows an interesting feature with discrete steps rather than a continuous distribution that can be related to the nanoscale packing. A Fourier transform of the C8S3-Br histogram is shown in the inset of Fig. 5d with peaks at 2.70 Å and 5.26 Å, corresponding to the step size for the discretized widths. Based on the projection of a single chromophore adding on to the tube width (Supplementary Fig. 3), we relate this step size to tube-wrapping chiral angle of θ = 66.4°, as opposed to the 57° angle observed in the LHNs (Supplementary Section 2). This signifies that the underlying molecular packing is likely distinct from the pristine LHNs derived from C8S3-Cl.
Figure 5e shows the absorption spectra of the prototypical LHNs overlayed with the aggregates of C8S4-Cl (four methylene spacers between the conjugated backbone and the sulfonate groups instead of three in the standard LHNs). While the spectral line shape is very distinct from the pristine LHNs, cryo-EM shows a mixture of both nanotubular and sheet-like morphologies (Fig. 5f). Upon careful screening of the aggregation conditions, we find that C8S4-Cl initially assembles into nanotubes that are relatively unstable and spontaneously convert into sheet-like morphology over a week as seen in Extended Data Fig. 7. This instability may be explained by the fact that adding an extra carbon in the sulfonate chains can disrupt the sulfonate interlocking either by inducing more disorder or due to sterics, further hinting at the importance of this supramolecular motif in the self-assembly. Indeed, most of the other cyanine dyes in the literature with similar S4 chains have sheets as their most stable aggregate morphology29.
Overall, these twoexamples demonstrate the sensitivity of the supramolecular self-assembly to small chemical modifications. The disruption of the nanotubular morphology in C8S4-Cl suggests the importance of the sulfonate interlocking motif. On the other hand, the robustness of the optical spectra of C8S3-Br despite the clear structural differences is quite surprising. Going forward, only the optical spectra may not be an ideal basis to test structural models against. Instead, independently obtained high-resolution structures form more reliable benchmarks. Approaching the broader goal of chemical control would require more concerted efforts on obtaining nanoscale structures, self-assembly as well as the excitonic properties. Particularly, a lot of the nanoscale structural information relevant towards the stabilization of the self-assemblies can be uncovered from independent native-state structural investigations.
Conclusions
We use 3D reconstruction of cryo-EM images to obtain a high-resolution native-state structure of the supramolecular J-aggregated light-harvesting nanotubes (LHNs). The LHNs continue to be a rich model system demonstrating novel excitonic behaviors such as superradiance and light harvesting. Further theoretical and experimental explorations are needed to unravel all the possible couplings within this structure. Like the FMO complex, this structure will form a solid basis for such explorations in the future. The structure also sheds light on new insights into self-assembly itself, that will inform the design of supramolecular materials.
We settle the long-standing question about the molecular arrangements (herringbone or brick layer) that are crucial towards the excitonic couplings and ultimately the unique photophysical properties of the LHNs. Our structure clearly shows the molecules in a brick layer arrangement with a six molecule ASU in the inner wall and eight molecule ASU in the outer wall. The ASUs follow the helical symmetry parameters of axial rise = 9.9 Å and rotation = 33.6° for both the walls. A similar observation was recently made for a synthetic peptide assembly - the lanreotide nanotubes53. The small peptide, previously thought to have 2 molecules in the ASU, was recently found to adopt eight slightly different conformations. Such self-assembly details are only possible to be observed through high-resolution native-state structures.
The sulfonate chains in both inner and outer walls show a highly conserved interlocked arrangement which enforce the slip-stacking. This slip-stacking, in turn, is responsible for the J-aggregate characteristics of the LHNs with narrow red shifted spectra and high superradiance. Not only does this provide a new chemical handle for designing excitonic materials, but this motif can also be introduced to other supramolecular self-assemblies as a configuration locking mechanism, in analogy to supramolecular synthons in crystal engineering67. In the future, independent native-state structural explorations will provide precise supramolecular structure – excitonic property relationships, enabling predictable design of excitonic materials. Such structural explorations will complement the vast efforts in spectroscopy and modeling of excitonic supramolecular materials.
Methods
Materials
C8S3-Cl was obtained from FEW Chemicals GmbH and used without further purification. C8S3-Br was synthesized using a reported procedure65. C8S4-Cl was synthesized from the heterocycle 5,6-dichloro-2-methyl-1-octyl-1H-benzo[dimidazole]. We refer the readers to our earlier work for detailed synthetic procedures and characterizations of C8S3-Br as well as the precursor heterocycle for C8S4-Cl (ref. 68). A detailed synthetic procedure for C8S4-Cl is given in Supplementary Section 3. Products were characterized with 1H NMR, taken on a Bruker Avance 400 spectrometer and processed using TopSpin 4.0.4. 1H NMR spectra are shown in Supplementary Fig. 4.
Aggregate preparation
C8S3-Cl aggregates (or LHNs) were prepared by injecting a 1.46 mM methanol solution of C8S3-Cl dye into Milli-Q water with the final conditions 0.43 mM dye and 30% MeOH (v/v) in glass vials pre-soaked in Milli-Q water for hydrophilization. The aggregate solutions were stored in parafilm-sealed vials in the dark at room temperature for 24 h before taking any measurements. C8S3-Br nanotubes were prepared similarly by injecting 1 mM methanol solution of the dye into Milli-Q water giving 0.2 mM, 20% MeOH as the final conditions. This sample was found to initially form short nanotubes that slowly converted to longer bundles over the course of a few weeks. Therefore, subsequent high-resolution cryo-EM was performed on a much higher concentration sample with 2 mM dye and 20% MeOH. This sample was stored for 1–2 weeks to allow for growth of long tubes. For C8S4-Cl aggregates, several conditions (dye concentrations and % MeOH) were screened for the narrow redshifted J-aggregate absorption. C8S4-Cl aggregates were prepared with final conditions of 0.2 mM dye in 10% MeOH, unless noted otherwise.
Inner wall isolation
For isolation of inner wall spectra of C8S3-Cl LHNs, we used a modified form of a previously reported procedure43. LHNs were prepared by dissolving C8S3-Cl monomer (2.58 mg, 2.86 μmol) into 2.4 ml spectroscopic grade methanol (Fisher). This solution was sonicated for 30 seconds to ensure complete dissolution before adding 4.76 ml Milli-Q H2O. The solution was stored in the dark for 24 h in parafilm-sealed vials before measuring the absorbance to confirm doubled-walled LHN formation. For outer wall bleaching, 0.6 ml of 0.011 M aqueous AgNO3 solution in Milli-Q H2O was added to the LHNs vial. The vial was briefly shaken to ensure mixing, then illuminated with a flashlight until the outer wall peak was completely bleached (~10 min) and subsequently kept in the dark. Further spectroscopic measurements were taken immediately.
Spectroscopic measurements
UV-Vis and linear dichroism spectra were taken on an Agilent Cary-60 spectrometer in 0.2 mm or 0.01 mm path length quartz cuvettes obtained from Starna Cells. Cuvettes were pre-soaked for several days in Milli-Q water for hydrophilization. For linear dichroism spectra, a linear polarizer (Thorlabs LPVIS050, mounted on a rotational stage) was inserted into the spectrophotometer between the sample and lamp source. To achieve parallel or perpendicular polarizations, the polarizer was set to 0° or 90°, respectively. The instrument was blanked using the appropriate solvent for each polarizer orientation. The sample was flown at a rate of 4 ml min−1 through a 0.2 mm path length flow cell (Starna Cells) using a syringe pump (AL-1000, Thermo Fisher) to align the nanotubes to the direction of the flow. Circular dichroism spectra were taken on ChiraScan V100 in 0.2 mm path length cuvettes while purging the chamber with N2 gas. DLS measurements were obtained using a Malvern Zetasizer Nano ZSP instrument, and the data shown are each representative of five consecutive measurements. Between measurements the sample was kept sealed and in the dark. Sample was in a freely diffusing solution (prepared as explained in the ‘Aggregate preparation’ section) in 1 cm quartz cuvette (Starna Cells). We note that the DLS scattering intensities are related to the hydrodynamic diameters of the freely diffusing nanotubes and roughly correlate to lengths69.
Cryo-EM data collection and processing
The LHNs or C8S3-Br double-walled nanotubes (2 μl) were applied to plasma-cleaned lacey carbon grids, followed by plunge-freezing in liquid ethane using a Leica EM GP. Data collection was carried out at liquid nitrogen temperature on a Titan Krios microscope (ThermoFisher Scientific) operated at an accelerating voltage of 300 kV. Forty movie frames were collected with defocus values range between −1 and −2.5 μm on a K3 camera (Gatan), with a total dose of ~55 electrons per Å2 and a pixel size of 1.08 Å per px. For C8S3-Cl double-walled nanotubes, a total of 193,693 segments (384 pixels long) were manually boxed in EMAN2 from 2,000 images, followed by testing the helical symmetry possibilities in SPIDER. The C5 rotational symmetry yielded the most reasonable map, which was used as an initial map to further processing in RELION 3.0 (ref. 70). Three rounds of Refine3D, Post Processing, contrast transfer function refinement and Bayesian polishing were done until the map improved with recognizable small molecule features at the resolution of 3.3 Å. The helical parameters converged to a rotation of 33.6° and an axial rise of 9.9 Å per subunit. The resolution of the final reconstruction was determined by the Fourier shell correlation (FSC) between two independent half maps, which was 3.3 Å for the inner wall and 4.3 Å for the outer wall at FSC = 0.143. Due to the large size of the LHNs and relatively small ASU, it was not possible to solve the structure without any imposed symmetry. Relevant parameters for the reported structure are shown in Supplementary Table 3.
For cryo-EM images of C8S4-Cl, 5 μl of the aggregate was dropped onto plasma-cleaned lacey carbon grids, and subsequently vitrified in liquid ethane using a Vitrobot Mark IV cryo-sample plunger. Images were obtained under cryogenic conditions using a Thermo Scientific Talos F200C TEM with an accelerating voltage of 200 kV with a pixel size of 4.0 Å per px.
Model building and refinement
We use the C8S3-Cl Protein Data Bank (PDB) model as an initial template to dock into the cryo-EM map by rigid body fitting in UCSF Chimera71, and then manually edited the model in Coot72. The refined monomeric model of C8S3-Cl was then re-built in Chimera with helical symmetry and rotational symmetry, followed by real-space refinement with Phenix73.
Extended Data
Extended Data Fig. 1 |. Structure of inner wall asymmetric unit.

Left: Inner wall asymmetric unit (hydrogen atoms are omitted for clarity) obtained from the refined inner wall model, right: the corresponding ChemDraw structure.
Extended Data Fig. 2 |. Circular dichroism spectra of identical LHN samples.

Circular dichroism spectra of four identical LHN samples in 30% MeOH:H2O mixtures and 0.43 mM final dye concentration.
Extended Data Fig. 3 |. Zoomed-in inner wall density.

Cut away top-down view of the inner wall. The sulfonate lobes (denoted by black arrows) show a regular interlocked pattern.
Extended Data Fig. 4 |. Outer wall molecular model.

Outer wall density overlayed with the fitted molecular model with manual constraints. a. side view, b. cut-away view, and c. asymmetric unit (ASU). The sulfonate interlocking can be seen in the outer wall as well.
Extended Data Fig. 5 |. Calculated spectra from the dimerized Frenkel exciton model.

a. Absorption, b. linear dichroism, and c. circular dichroism spectra of isolated inner walls of the LHNs. Solid black lines: experimental spectra; colored lines: spectra calculated from the dimerized Frenkel exciton Hamiltonian corresponding to inner wall structures of varying sizes, blue: 1500, red: 3000, yellow: 4500, and purple: 6000 monomers; dashed black lines: calculated spectra assuming periodic boundary conditions with added Lorentizian broadenings. The lineshape of the perpendicular peaks depends more strongly on the tube length truncation than their parallel counterparts which could possibly introduce more lineshape mismatch for the perpendicular peaks.
Extended Data Fig. 6 |. C8S3-Br nanotubes self-assembly over long time.

a Dynamic light scattering (DLS) intensity distributions of C8S3-Br nanotubes in solutions (20% MeOH v/v in MeOH:H2O mixture with 0.2 mM dye concentration) at various time intervals after aggregate preparation. The distribution depicts shorter lengths initially at 10 min and then shifts to drastically longer lengths over a course of 5 weeks. We note that the DLS scattering intensities are related to the hydrodynamic diameters of the freely diffusing nanotubes and can be used to estimate the length of the nanotubes, b. normalized absorption spectra corresponding to each time point showing a slow conversion from nanotubes to bundles, c. and d. representative cryo-EM images of the samples frozen 1 day and 5 weeks after aggregate preparation, respectively.
Extended Data Fig. 7 |. C8S4-Cl aggregate absorption spectra over a week.
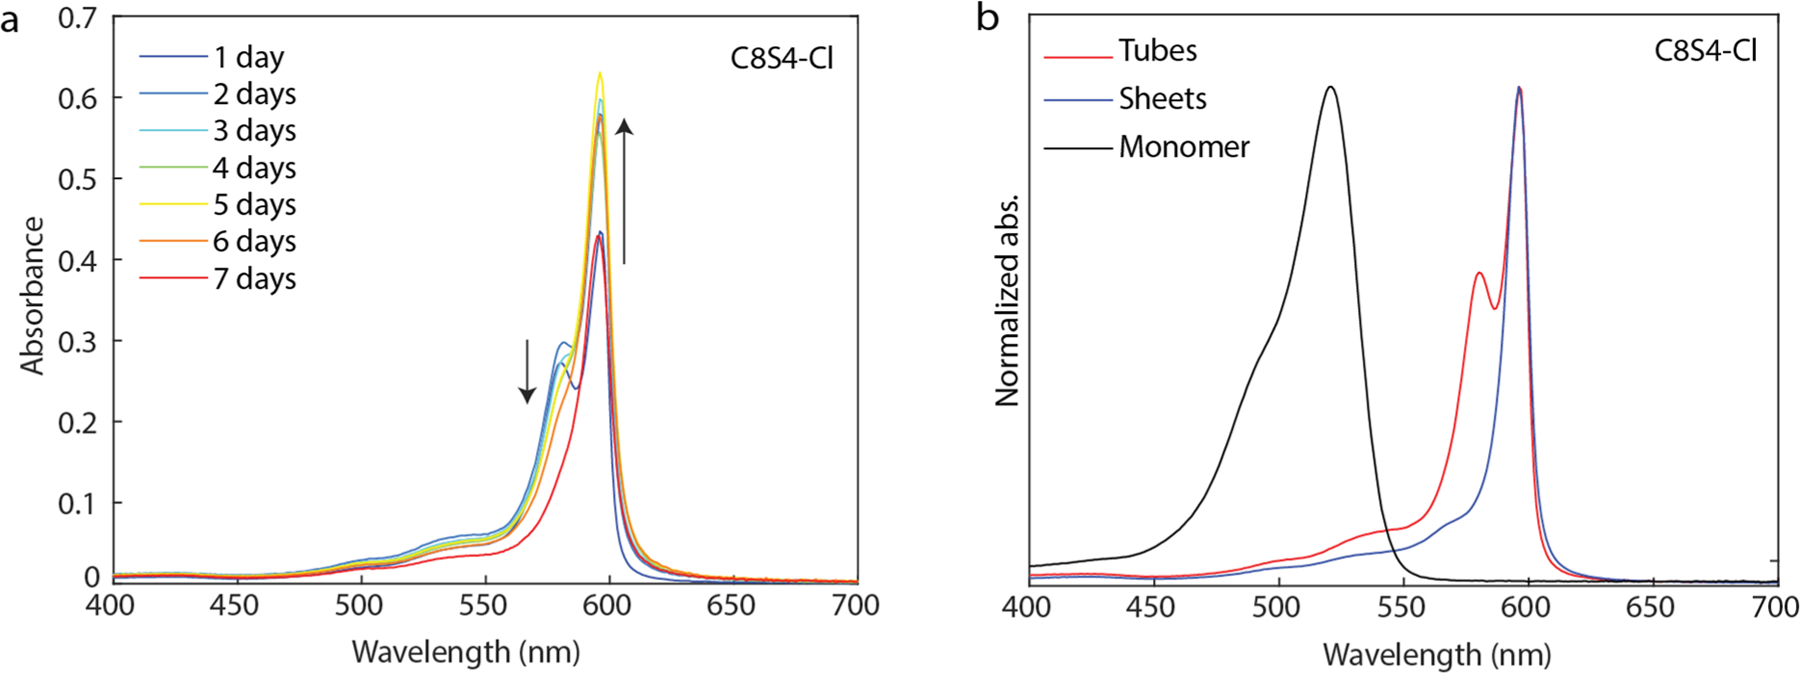
a. Absorption spectra of C8S4-Cl aggregates made at 0.1 mM dye concentration and 5% MeOH over a course of 7 days showing conversion to sheet-like morphology, and b. normalized absorption spectra of the monomer in 100% MeOH (black), sheets in 20% MeOH (blue) and tubes in 5% MeOH (red) with 0.1 mM final dye concentration.
Extended Data Table 1 |.
A literature survey of structural investigations on the LHNs
| Reference | Method | Key findings |
|---|---|---|
| Kirstein et al., 200044 | Cryo-EM micrographs CD spectroscopy |
Chirality in bundled nanotubes of C8O3a |
| Didraga et al. (Knoester), 200457 | Brick layer model informed by CD and LD Cryo-EM micrographs |
Cryo-EM showed double-walled morphology of the nanotubes |
| Berlepsch et al., 200774 | Cryo-EM micrographs | Tubes formed rope-like bundles over weeks |
| Lyon et al. (Stevenson), 200875 | Cyclic voltammetry, optical spectroscopy and spectroelectrochemistry of immobilized LHNs on ITO | Initial oxidation of outer wall, followed by irreversible dehydrogenation and dimerization. Inner wall stayed relatively intact. |
| Eisele et a. (Rabe & Vanden Bout), 200941 | Atomic force microscopy and near-field scanning optical microscopy | The supramolecular structure was uniform within individual nanotubes as well as across an ensemble. |
| Berlepsch et al. (Bottcher), 201137 | Cryo-EM 3D reconstruction of mixed C8S3 and C8S2 tubes | 2 nm resolution map with pitch angle of 17.3° |
| Eisele et al. (Knoester & Vanden Bout), 201243 | Redox chemistry Herringbone model fitted to absorption spectra |
Excitonic decoupling of inner and outer wall Explains symmetry breaking in isolated inner wall spectra |
| Clark et al. (Vanden Bout), 201342 | Linear dichroism of double-walled nanotubes and photochemically isolated inner wall spectra | Total six transitions isolated for doubled-walled nanotubes (3 parallel and perpendicular pairs), 4 of which assigned to inner wall |
| Eisele et al. (Nicastro, Knoester & Bawendi), 201421 | Cryo-electron tomography of LHNs and bundles Herringbone model informed with absorption spectra | Hierarchical assembly of the LHNs with observations of straight and twisted bundles |
| Megow et al., 201554 | MD simulations with two molecules per unit cell in brick layer arrangement | Site dependent dispersive shifts due to van der Waals interactions explained the peak splitting |
| Kriete et al. (Pshenichnikov), 201765 | Replaced Cl atoms with Br Herringbone model fitted to absorption spectra |
C8S3-Br tubes were wider than C8S3-Cl Spectral differences were attributed to higher radius of C8S3-Br tubes |
| Bondarenko et al. (Marrink & Knoester), 202055 | Multiscale modelling – MD (Herringbone arrangement), microelectrostatics and Frenkel exciton Hamiltonian, optimized with absorption spectra | Energetic and structural disorder, higher packing density in IW explained the spectral splitting |
| Patmanidis et al. (Marrink), 202050 | MD simulations (with brick layer, staircase and herringbone arrangements); Small-angle X-ray scattering | Brick layer and herringbone arrangements were plausible, brick layer being more stable. Interdigitated alkyl chains led to reduced widths between the two walls |
| Krishnaswamy et al. (Pshenichnikov), 202276 | Microfluidic flash dilution and Cryo-EM micrographs, compared to MD model | Inner wall remains unchanged and homogeneous during flash dilution |
| Patmanidis et al. (Marrink), 202277 | MD simulations on a coarse-grained model based on QM calculations and crystal structures of similar dyes | Time-dependent orientations of molecules during the assembly, model favors brick layer arrangement |
Supplementary Material
Acknowledgements
This work was funded by National Science Foundation Division of Chemistry grant 2204263 (E.M.S. and J.R.C.) and National Institutes of Health grant GM122510 (E.H.E.). A.P.D. thanks the University of California, Los Angeles Graduate Division Dissertation Year Fellowship for financial support. The authors acknowledge the use of the University of California, Los Angeles-Department of Energy Biochemistry Instrumentation Core Facility and University of California, Los Angeles Molecular Instrumentation Center. C.C. acknowledges start-up funding from University of Nevada, Las Vegas.
Footnotes
Online content
Any methods, additional references, Nature Portfolio reporting summaries, source data, extended data, supplementary information, acknowledgements, peer review information; details of author contributions and competing interests; and statements of data and code availability are available at https://doi.org/10.1038/s41557-023-01432-6.
Code availability
Codes for the model used in the paper are available from the corresponding author upon reasonable request.
Competing interests
The authors declare no competing interests.
Additional information
Extended data is available for this paper at https://doi.org/10.1038/s41557-023-01432-6.
Supplementary information The online version contains supplementary material available at https://doi.org/10.1038/s41557-023-01432-6.
Peer review information Nature Chemistry thanks Thomas Jansen, Maxim Pshenichnikov and the other, anonymous, reviewer(s) for their contribution to the peer review of this work.
Data availability
All data required to interpret, verify and extend the results are given in the paper and its Supplementary Information. The map of both outer and inner wall LHNs is deposited in the Electron Microscopy Data Bank under accession code EMD-27820. The PDB file for inner wall structure is given in Supplementary Data 1. Source data are provided with this paper.
References
- 1.Bricks JL, Slominskii YL, Panas ID & Demchenko AP Fluorescent J-aggregates of cyanine dyes: basic research and applications review. Methods Appl. Fluoresc 6, 012001 (2017). [DOI] [PubMed] [Google Scholar]
- 2.Brixner T, Hildner R, Köhler J, Lambert C & Würthner F Exciton transport in molecular aggregates - from natural antennas to synthetic chromophore systems. Adv. Energy Mater 7, 1700236 (2017). [Google Scholar]
- 3.Scholes GD & Rumbles G Excitons in nanoscale systems. Nat. Mater 5, 683–696 (2006). [DOI] [PubMed] [Google Scholar]
- 4.Wang C & Weiss EA Accelerating FRET between near-infrared emitting quantum dots using a molecular J-aggregate as an exciton bridge. Nano Lett 17, 5666–5671 (2017). [DOI] [PubMed] [Google Scholar]
- 5.Freyria FS et al. Near-infrared quantum dot emission enhanced by stabilized self-assembled J-aggregate antennas. Nano Lett 17, 7665–7674 (2017). [DOI] [PubMed] [Google Scholar]
- 6.Doria S et al. Photochemical control of exciton superradiance in light-harvesting nanotubes. ACS Nano 12, 4556–4564 (2018). [DOI] [PubMed] [Google Scholar]
- 7.Jelley EE Spectral absorption and fluorescence of dyes in the molecular state. Nature 138, 1009–1010 (1936). [Google Scholar]
- 8.Scheibe G Über die Veränderlichkeit der Absorptionsspektren in Lösungen und die Nebenvalenzen als ihre Ursache. Angew. Chemie 50, 212–219 (1937). [Google Scholar]
- 9.Davydov AS, ydov ASD, Kasha M & Oppenheimer M Theory of Molecular Excitons (McGraw-Hill, 1962). [Google Scholar]
- 10.Kasha M Energy transfer mechanisms and the molecular exciton model for molecular aggregates. Radiat. Res 20, 55–71 (1963). [PubMed] [Google Scholar]
- 11.Czikkely V, Försterling HD & Kuhn H Light absorption and structure of aggregates of dye molecules. Chem. Phys. Lett 6, 11–14 (1970). [Google Scholar]
- 12.Deshmukh AP et al. Bridging the gap between H- and J-aggregates: classification and supramolecular tunability for excitonic band structures in two-dimensional molecular aggregates. Chem. Phys. Rev 3, 021401 (2022). [Google Scholar]
- 13.Hestand NJ & Spano FC Expanded theory of H- and J-molecular aggregates: the effects of vibronic coupling and intermolecular charge transfer. Chem. Rev 118, 7069–7163 (2018). [DOI] [PubMed] [Google Scholar]
- 14.Heijs DJ, Malyshev VA & Knoester J Decoherence of excitons in multichromophore systems: Thermal line broadening and destruction of superradiant emission. Phys. Rev. Lett 95, 177402 (2005). [DOI] [PubMed] [Google Scholar]
- 15.Fenna RE & Matthews BW Chlorophyll arrangement in a bacteriochlorophyll protein from Chlorobium limicola. Nature 258, 573–577 (1975). [Google Scholar]
- 16.Maiuri M, Ostroumov EE, Saer RG, Blankenship RE & Scholes GD Coherent wavepackets in the Fenna–Matthews– Olson complex are robust to excitonic-structure perturbations caused by mutagenesis. Nat. Chem 10, 177–183 (2018). [DOI] [PubMed] [Google Scholar]
- 17.Panitchayangkoon G et al. Long-lived quantum coherence in photosynthetic complexes at physiological temperature. Proc. Natl Acad. Sci. USA 107, 12766–12770 (2010). [DOI] [PMC free article] [PubMed] [Google Scholar]
- 18.Cao J et al. Quantum biology revisited. Sci. Adv 6, eaaz4888 (2020). [DOI] [PMC free article] [PubMed] [Google Scholar]
- 19.Renger T Theory of excitation energy transfer: from structure to function. Photosynth. Res 102, 471–485 (2009). [DOI] [PubMed] [Google Scholar]
- 20.Engel GS et al. Evidence for wavelike energy transfer through quantum coherence in photosynthetic systems. Nature 446, 782–786 (2007). [DOI] [PubMed] [Google Scholar]
- 21.Eisele DM et al. Robust excitons inhabit soft supramolecular nanotubes. Proc. Natl Acad. Sci. USA 111, E3367–E3375 (2014). [DOI] [PMC free article] [PubMed] [Google Scholar]
- 22.Lim J et al. Vibronic origin of long-lived coherence in an artificial molecular light harvester. Nat. Commun 6, 7755 (2015). [DOI] [PMC free article] [PubMed] [Google Scholar]
- 23.Scholes GD, Fleming GR, Olaya-Castro A & van Grondelle R Lessons from nature about solar light harvesting. Nat. Chem 3, 763–774 (2011). [DOI] [PubMed] [Google Scholar]
- 24.Würthner F, Kaiser TE & Saha-Möller CR J-aggregates: from serendipitous discovery to supramolecular engineering of functional dye materials. Angew. Chem. Int. Ed 50, 3376–3410 (2011). [DOI] [PubMed] [Google Scholar]
- 25.Wan Y, Stradomska A, Knoester J & Huang L Direct imaging of exciton transport in tubular porphyrin aggregates by ultrafast microscopy. J. Am. Chem. Soc 139, 7287–7293 (2017). [DOI] [PubMed] [Google Scholar]
- 26.Haedler AT et al. Long-range energy transport in single supramolecular nanofibres at room temperature. Nature 523, 196–199 (2015). [DOI] [PubMed] [Google Scholar]
- 27.Kreger K, Schmidt HW & Hildner R Tailoring the excited-state energy landscape in supramolecular nanostructures. Electron. Struct 3, 023001 (2021). [Google Scholar]
- 28.Chuang C et al. Generalized Kasha’s model: T-dependent spectroscopy reveals short-range structures of 2D excitonic systems. Chem 5, 3135–3150 (2019). [Google Scholar]
- 29.Deshmukh AP et al. Thermodynamic control over molecular aggregate assembly enables tunable excitonic properties across the visible and near-infrared. J. Phys. Chem. Lett 11, 8026–8033 (2020). [DOI] [PubMed] [Google Scholar]
- 30.Wasielewski MR Self-assembly strategies for integrating light harvesting and charge separation in artificial photosynthetic systems. Acc. Chem. Res 42, 1910–1921 (2009). [DOI] [PubMed] [Google Scholar]
- 31.Pandya R et al. Observation of vibronic-coupling-mediated energy transfer in light-harvesting nanotubes stabilized in a solid-state matrix. J. Phys. Chem. Lett 9, 5604–5611 (2018). [DOI] [PubMed] [Google Scholar]
- 32.Wang F, Gnewou O, Solemanifar A, Conticello VP & Egelman EH Cryo-EM of helical polymers. Chem. Rev 122, 14055–14065 (2021). [DOI] [PMC free article] [PubMed] [Google Scholar]
- 33.Egelman EH The iterative helical real space reconstruction method: Surmounting the problems posed by real polymers. J. Struct. Biol 157, 83–94 (2007). [DOI] [PubMed] [Google Scholar]
- 34.Herman K et al. Individual tubular J-aggregates stabilized and stiffened by silica encapsulation. Colloid Polym. Sci 298, 937–950 (2020). [Google Scholar]
- 35.Ng K et al. Frenkel excitons in heat-stressed supramolecular nanocomposites enabled by tunable cage-like scaffolding. Nat. Chem 12, 1157–1164 (2020). [DOI] [PubMed] [Google Scholar]
- 36.Lafleur RPM et al. Supramolecular double helices from small C3-symmetrical molecules aggregated in water. J. Am. Chem. Soc 142, 17644–17652 (2020). [DOI] [PMC free article] [PubMed] [Google Scholar]
- 37.Berlepsch HV, Ludwig K, Kirstein S & Böttcher C Mixtures of achiral amphiphilic cyanine dyes form helical tubular J-aggregates. Chem. Phys 385, 27–34 (2011). [Google Scholar]
- 38.Yi M et al. Enzyme responsive rigid-rod aromatics target ‘undruggable’ phosphatases to kill cancer cells in a mimetic bone microenvironment. J. Am. Chem. Soc 144, 13055–13059 (2022). [DOI] [PMC free article] [PubMed] [Google Scholar]
- 39.Pawlik A, Ouart A, Kirstein S, Abraham HW & Daehne S Synthesis and UV/Vis spectra of J-aggregating 5,5′,6, 6′-tetrachlorobenzimidacarbocyanine dyes for artificial light-harvesting systems and for asymmetrical generation of supramolecular helices. Eur. J. Org. Chem 2003, 3065–3080 (2003). [Google Scholar]
- 40.Caram JR et al. Room-temperature micron-scale exciton migration in a stabilized emissive molecular aggregate. Nano Lett 16, 6808–6815 (2016). [DOI] [PubMed] [Google Scholar]
- 41.Eisele DM, Knoester J, Kirstein S, Rabe JP & Vanden Bout DA Uniform exciton fluorescence from individual molecular nanotubes immobilized on solid substrates. Nat. Nanotechnol 4, 658–663 (2009). [DOI] [PubMed] [Google Scholar]
- 42.Clark KA, Cone CW & Vanden Bout DA Quantifying the polarization of exciton transitions in double-walled nanotubular J-aggregates. J. Phys. Chem. C 117, 26473–26481 (2013). [Google Scholar]
- 43.Eisele DM et al. Utilizing redox-chemistry to elucidate the nature of exciton transitions in supramolecular dye nanotubes. Nat. Chem 4, 655–662 (2012). [DOI] [PubMed] [Google Scholar]
- 44.Kirstein S et al. Chiral J-aggregates formed by achiral cyanine dyes. ChemPhysChem 1, 146–150 (2000). [DOI] [PubMed] [Google Scholar]
- 45.Schade B et al. Stereochemistry-controlled supramolecular architectures of new tetrahydroxy-functionalised amphiphilic carbocyanine dyes. Chem. Eur. J 26, 6919–6934 (2020). [DOI] [PMC free article] [PubMed] [Google Scholar]
- 46.Roodenko K et al. Anisotropic optical properties of thin-film thiacarbocyanine dye aggregates. J. Phys. Chem. C 117, 20186–20192 (2013). [Google Scholar]
- 47.Kriete B, Feenstra CJ & Pshenichnikov MS Microfluidic out-of-equilibrium control of molecular nanotubes. Phys. Chem. Chem. Phys 22, 10179–10188 (2020). [DOI] [PubMed] [Google Scholar]
- 48.Bialas D, Zhong C, Würthner F & Spano FC Essential states model for merocyanine dye stacks: bridging electronic and optical absorption properties. J. Phys. Chem. C 123, 18654–18664 (2019). [Google Scholar]
- 49.Spano FC Analysis of the UV/Vis and CD spectral line shapes of carotenoid assemblies: spectral signatures of chiral H-aggregates. J. Am. Chem. Soc 131, 4267–4278 (2009). [DOI] [PubMed] [Google Scholar]
- 50.Patmanidis I et al. Structural characterization of supramolecular hollow nanotubes with atomistic simulations and SAXS. Phys. Chem. Chem. Phys 22, 21083–21093 (2020). [DOI] [PubMed] [Google Scholar]
- 51.Egelman EH Reconstruction of helical filaments and tubes. Methods Enzymol 482, 167–183 (2010). [DOI] [PMC free article] [PubMed] [Google Scholar]
- 52.Egelman EH Ambiguities in helical reconstruction. eLife 3, e04969 (2014). [DOI] [PMC free article] [PubMed] [Google Scholar]
- 53.Pieri L et al. Atomic structure of Lanreotide nanotubes revealed by cryo-EM. Proc. Natl Acad. Sci. USA 119, e2120346119 (2022). [DOI] [PMC free article] [PubMed] [Google Scholar]
- 54.Megow J et al. Site-dependence of van der Waals interaction explains exciton spectra of double-walled tubular J-aggregates. Phys. Chem. Chem. Phys 17, 6741–6747 (2015). [DOI] [PubMed] [Google Scholar]
- 55.Bondarenko AS et al. Multiscale modeling of molecular structure and optical properties of complex supramolecular aggregates. Chem. Sci 11, 11514–11524 (2020). [DOI] [PMC free article] [PubMed] [Google Scholar]
- 56.Herbst S et al. Self-assembly of multi-stranded perylene dye J-aggregates in columnar liquid-crystalline phases. Nat. Commun 9, 2646 (2018). [DOI] [PMC free article] [PubMed] [Google Scholar]
- 57.Didraga C et al. Structure, spectroscopy, and microscopic model of tubular carbocyanine dye aggregates. J. Phys. Chem. B 108, 14976–14985 (2004). [Google Scholar]
- 58.Clark KA, Krueger EL & Vanden Bout DA Direct measurement of energy migration in supramolecular carbocyanine dye nanotubes. J. Phys. Chem. Lett 5, 2274–2282 (2014). [DOI] [PubMed] [Google Scholar]
- 59.Doria S et al. Vibronic coherences in light harvesting nanotubes: unravelling the role of dark states. J. Mater. Chem. C 10, 7216–7226 (2022). [Google Scholar]
- 60.Spano FC, Silvestri L, Spearman P, Raimondo L & Tavazzi S Reclassifying exciton-phonon coupling in molecular aggregates: evidence of strong nonadiabatic coupling in oligothiophene crystals. J. Chem. Phys 127, 184703 (2007). [DOI] [PubMed] [Google Scholar]
- 61.Krueger BP, Scholes GD & Fleming GR Calculation of couplings and energy-transfer pathways between the pigments of LH2 by the ab initio transition density cube method. J. Phys. Chem. B 102, 5378–5386 (1998). [Google Scholar]
- 62.Didraga C, Klugkist JA & Knoester J Optical properties of helical cylindrical molecular aggregates: the homogeneous limit. J. Phys. Chem. B 106, 11474–11486 (2002). [Google Scholar]
- 63.Bondarenko AS, Jansen TLC & Knoester J Exciton localization in tubular molecular aggregates: Size effects and optical response. J. Chem. Phys 152, 194302 (2020). [DOI] [PubMed] [Google Scholar]
- 64.Bloemsma EA, Vlaming SM, Malyshev VA & Knoester J Signature of anomalous exciton localization in the optical response of self-assembled organic nanotubes. Phys. Rev. Lett 114, 156804 (2015). [DOI] [PubMed] [Google Scholar]
- 65.Kriete B et al. Steering self-assembly of amphiphilic molecular nanostructures via halogen exchange. J. Phys. Chem. Lett 8, 2895–2901 (2017). [DOI] [PMC free article] [PubMed] [Google Scholar]
- 66.Wang F et al. Spindle-shaped archaeal viruses evolved from rod-shaped ancestors to package a larger genome. Cell 185, 1297–1307.e11 (2022). [DOI] [PMC free article] [PubMed] [Google Scholar]
- 67.Desiraju GR Crystal engineering: from molecule to crystal. J. Am. Chem. Soc 135, 9952–9967 (2013). [DOI] [PubMed] [Google Scholar]
- 68.Bailey AD et al. Exploring the design of superradiant J-aggregates from amphiphilic monomer units. Nanoscale 15, 3841–3849 (2023). [DOI] [PubMed] [Google Scholar]
- 69.Lotya M, Rakovich A, Donegan JF & Coleman JN Measuring the lateral size of liquid-exfoliated nanosheets with dynamic light scattering. Nanotechnology 24, 265703 (2013). [DOI] [PubMed] [Google Scholar]
- 70.Zivanov J et al. New tools for automated high-resolution cryo-EM structure determination in RELION-3. eLife 7, e42166 (2018). [DOI] [PMC free article] [PubMed] [Google Scholar]
- 71.Goddard TD, Huang CC & Ferrin TE Visualizing density maps with UCSF Chimera. J. Struct. Biol 157, 281–287 (2007). [DOI] [PubMed] [Google Scholar]
- 72.Emsley P, Lohkamp B, Scott WG & Cowtan K Features and development of Coot. Acta Crystallogr. Sect. D 66, 486–501 (2010). [DOI] [PMC free article] [PubMed] [Google Scholar]
- 73.Adams PD et al. PHENIX: A comprehensive Python-based system for macromolecular structure solution. Acta Crystallogr. D Biol. Crystallogr 66, 213–221 (2010). [DOI] [PMC free article] [PubMed] [Google Scholar]
- 74.von Berlepsch H, Kirstein S, Hania R, Pugžlys A & Böttcher C Modification of the nanoscale structure of the J-aggregate of a sulfonate-substituted amphiphilic carbocyanine dye through incorporation of surface-active additives. J. Phys. Chem. B 111, 1701–1711 (2007). [DOI] [PubMed] [Google Scholar]
- 75.Lyon JL et al. Spectroelectrochemical investigation of double-walled tubular J-aggregates of amphiphilic cyanine dyes. J. Phys. Chem. C 112, 1260–1268 (2008). [Google Scholar]
- 76.Krishnaswamy SR et al. Cryogenic TEM imaging of artificial light harvesting complexes outside equilibrium. Sci. Rep 12, 5552 (2022). [DOI] [PMC free article] [PubMed] [Google Scholar]
- 77.Patmanidis I et al. Modelling structural properties of cyanine dye nanotubes at coarse-grained level. Nanoscale Adv 4, 3033–3042 (2022). [DOI] [PMC free article] [PubMed] [Google Scholar]
- 78.Manrho M et al. Watching molecular nanotubes self-assemble in real time. J. Am. Chem. Soc 145, 22494–22503 (2023). [DOI] [PMC free article] [PubMed] [Google Scholar]
Associated Data
This section collects any data citations, data availability statements, or supplementary materials included in this article.
Supplementary Materials
Data Availability Statement
All data required to interpret, verify and extend the results are given in the paper and its Supplementary Information. The map of both outer and inner wall LHNs is deposited in the Electron Microscopy Data Bank under accession code EMD-27820. The PDB file for inner wall structure is given in Supplementary Data 1. Source data are provided with this paper.