Abstract
Prolonged tachycardia—a risk factor for cardiovascular morbidity and mortality—can induce cardiomyopathy in the absence of structural disease in the heart. Here, by leveraging human patient data, a canine model of tachycardia and engineered heart tissue generated from human induced pluripotent stem cells, we show that metabolic rewiring during tachycardia drives contractile dysfunction by promoting tissue hypoxia, elevated glucose utilization and the suppression of oxidative phosphorylation. Mechanistically, a metabolic shift towards anaerobic glycolysis disrupts the redox balance of nicotinamide adenine dinucleotide (NAD), resulting in increased global protein acetylation (and in particular the acetylation of sarcoplasmic/endoplasmic reticulum Ca2+-ATPase), a molecular signature of heart failure. Restoration of NAD redox by NAD+ supplementation reduced sarcoplasmic/endoplasmic reticulum Ca2+-ATPase acetylation and accelerated the functional recovery of the engineered heart tissue after tachycardia. Understanding how metabolic rewiring drives tachycardia-induced cardiomyopathy opens up opportunities for therapeutic intervention.
Heart rate plays a critical role in cardiac pathophysiology. Elevated resting heart rate, for instance, is closely associated with increased cardiovascular risk in patients with pre-existing heart disease1. An increase in the resting heart rate by 10 beats per minute (bpm) raises the incidence of heart failure (HF) by 13–16% in a healthy cohort over a study period of 14 years (ref. 2). Lowering the resting heart rate using ivabradine improved the prognosis of patients with chronic HF, with a strong correlation between the benefits of the treatment and the reduction of heart rate3. It is increasingly recognized that heart rate may not only serve as an essential biological indicator for cardiac health but also an independent risk factor that modifies cardiac pathophysiology4,5.
In a more aggressive form, an increased heart rate is sufficient to cause rapid deterioration of cardiac health. Specifically, prolonged tachycardia alone can lead to ventricular dysfunction in patients who have no prior structural heart disease in as fast as several days6, a condition termed tachycardia-induced cardiomyopathy (TIC). TIC is often driven by primary arrhythmias such as atrial fibrillation, atrial flutter, atrial tachycardia and ventricular tachyarrhythmias7. In some cases, sinus tachycardia has also been reported to cause TIC8–11. Upon normalization of heart rate, TIC can be partially or fully reversed in weeks or months, typically marked by a considerable improvement in ejection fraction. However, subtle and persistent damages after recovery have also been reported in patients with TIC12,13. A recent analysis of biopsies from patients with TIC revealed increased mitochondrial abnormality and tissue fibrosis12. Furthermore, the recovery time may also be substantially longer for patients with relapsed TIC14. The overall prevalence of TIC is unknown but probably underdiagnosed15. It was estimated that 25–75% of patients with atrial fibrillation and left ventricular (LV) dysfunction may have some degree of TIC16,17.
Chronic tachypacing in large animals (for example, dogs) is a valuable model widely used to elucidate the pathogenesis of tachycardia-mediated cardiac dysfunction18–20. Several mechanisms have been proposed so far, including reduced myocardial energy reserve21,22, increased oxidative stress23,24, abnormal calcium handling25,26, metabolic disorder27 and reduced coronary flow28,29. Yet our understanding of TIC is still far from complete. In particular, the molecular drivers underlying the reversible contractile dysfunction in TIC remain elusive. This gap in our knowledge presents an obstacle to the development of therapeutics for patients with persistent tachyarrhythmias or elevated resting heart rates.
In this Article, we unveil a central role of metabolic remodelling in the pathological progression of tachycardia-induced contractile dysfunction by integrating human patient data, a canine model of tachypacing-induced HF and an engineered heart tissue (EHT) model of tachycardia. Our data indicate that tachycardia promotes tissue hypoxia and substantially increases glucose utilization. In the short term, this metabolic shift towards anaerobic glycolysis disrupts nicotinamide adenine dinucleotide (NAD) homeostasis, leading to increased global protein acetylation, a molecular signature of HF previously reported in mouse and patient samples30,31. We identified sarcoplasmic/endoplasmic reticulum Ca2+-ATPase (SERCA2a) acetylation as a molecular driver of tachycardia-induced contractile dysfunction. In the long term, chronic tachycardia promotes the downregulation of oxidative phosphorylation (OXPHOS), fatty acid oxidation and the tricarboxylic acid (TCA) cycle, further reinforcing the metabolic reliance on anaerobic glycolysis and exacerbates the impairment of NAD redox balance. Collectively, these results help us dissect the complex role of tachycardia in cardiac pathophysiology.
Results
Tachycardia downregulates OXPHOS, TCA cycle and fatty acid oxidation
To elucidate the effect of tachycardia on the human heart, we first analysed transcriptomic data from patients with HF (n = 16), patients with HF and tachycardia (n = 19) and patients without HF (n = 14) (ref. 32). Specifically, we performed pathway enrichment analysis of genes exclusively downregulated in patients with tachycardia (Fig. 1a, Extended Data Fig. 1a,b and Supplementary Fig. 1). This analysis revealed that tachycardia is associated with the downregulation of OXPHOS genes such as NADH:ubiquinone oxidoreductase subunit AB1 (NDUFAB1), subunit B3 (NDUFB3), subunit B4 (NDUFB4) and subunit C1 (NDUFC1) (Fig. 1b); the downregulation of TCA cycle genes such as pyruvate dehydrogenase E1 subunit beta (PDHB), succinate dehydrogenase complex iron sulfur subunit B (SDHB), succinate-CoA ligase GDP/ADP-forming subunit alpha (SUCLG1) and isocitrate dehydrogenase (NAD(+)) 3 catalytic subunit alpha (IDH3A) (Fig. 1c); and the downregulation of fatty acid oxidation genes such as acyl-CoA synthetase long chain family member 1 (ACSL1), fatty acid binding protein 3 (FABP3), methylmalonyl-CoA epimerase (MCEE) and cytochrome c1 (CYC1) (Fig. 1d).
Fig. 1 |. Tachycardia is associated with the downregulation of OXPHOS, TCA cycle and fatty acid oxidation in patients with HF.
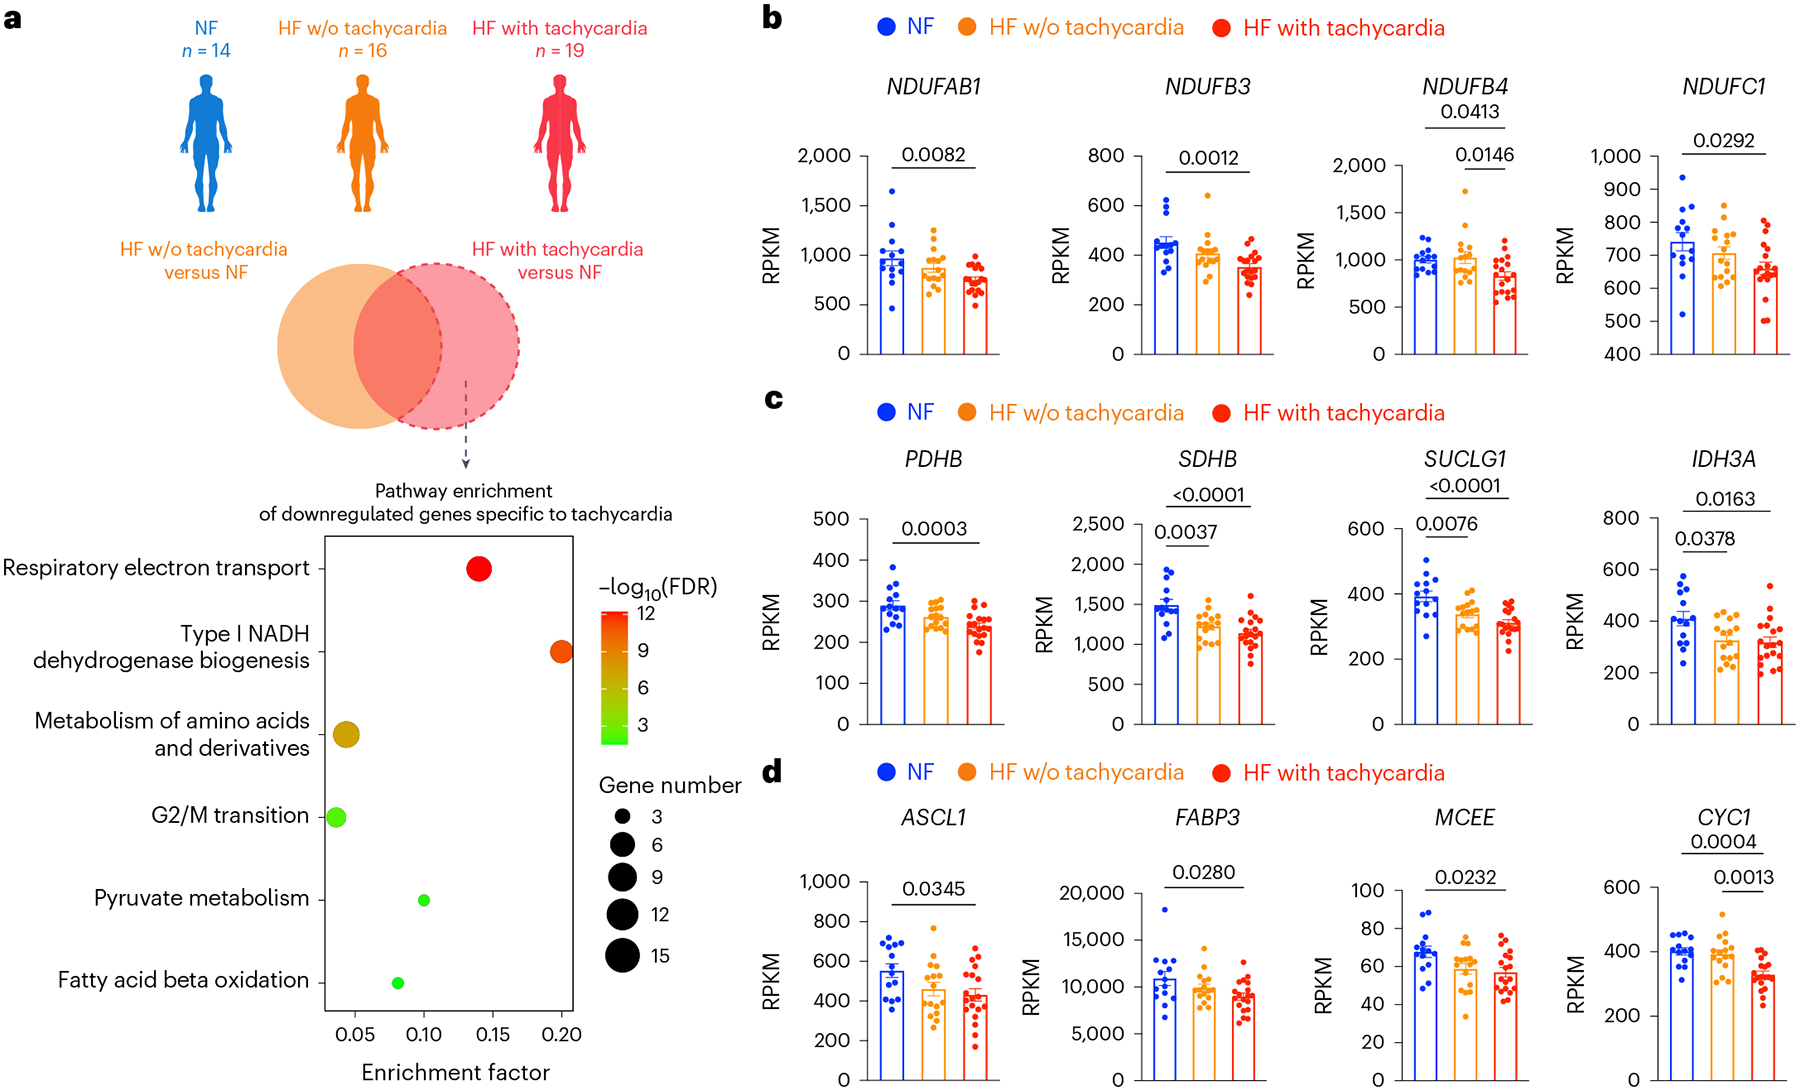
a, Transcriptomic analysis of myocardial samples from human patients with non-failing hearts (NF; n = 14, 49.1 ± 8.6 years old, 11 males and 3 females), HF without (w/o) tachycardia (HF; n = 16, 46.5 ± 14.3 years old, 12 males and 4 females) and HF with tachycardia (n = 19, 51.3 ± 11.9 years old, 16 males and 3 females). Genes exclusively downregulated in patients of HF with tachycardia were analysed for pathway enrichment. Results are shown as a bubble plot. Bubble color and size represent false discovery rate (FDR) and gene number, respectively. b, Expression of OXPHOS genes NDUFAB1, NDUFB3, NDUFB4 and NDUFC1. c, Expression of TCA cycle genes PDHB, SDHB, SUCLG1 and IDH3A. d, Expression of fatty acid oxidation genes ACSL1, FABP3, MCEE and CYC1. In b–d, the expression levels are shown in reads per kilobase of transcript per million mapped reads (RPKM). One-way ANOVA with Tukey’s multiple comparisons test. Data are displayed as mean ± s.e.m.
To understand whether these changes are driven by or merely associated with tachycardia, we analysed a public dataset from canine model of tachypacing-induced HF33 (Fig. 2a). In this model of tachycardia, dogs were tachypaced at 240 bpm continuously for up to 4 weeks to induce HF. Left ventricle tissue was used for microarray analysis. Myocardial samples taken before the initiation of pacing were used as the control33. This pure model of tachycardia eliminates confounding factors from pre-existing heart disease. Consistent with the human data, chronic tachycardia in dogs also resulted in the downregulation of OXPHOS genes such as NDUFAB1, NDUFB3, NADH:ubiquinone oxidoreductase core subunit V2 (NDUFV2) and subunit A2 (NDUFA2); the downregulation of TCA cycle genes such as PDHB, SDHB, succinate-CoA ligase ADP-forming subunit beta (SUCLA2) and aconitase 2 (ACO2); and the downregulation of fatty acid oxidation genes such as ACSL1, hydroxyacyl-CoA dehydrogenase trifunctional multienzyme complex subunit alpha (HADHA), subunit beta (HADHB) and enoyl-CoA hydratase short chain 1 (ECHS1) (Fig. 2b–d). Furthermore, western blot analysis of tachypaced canine hearts showed a consistent trend at the protein level (Fig. 2e). In particular, mitochondrial complexes I, II, IV and V were downregulated by tachycardia, with complex IV having the most substantial reduction (~40% decrease). Notably, these data are consistent with previous canine tachycardia studies, which reported the shift in metabolic substrate from fatty acids to glucose in the heart27,33. Together, these results cohesively suggest that tachycardia alone is sufficient to drive adverse metabolic remodelling. However, it is unclear whether this metabolic remodelling drives the impairment of contractility in tachycardia.
Fig. 2 |. Tachypacing downregulates OXPHOS, TCA cycle and fatty acid oxidation in dogs.
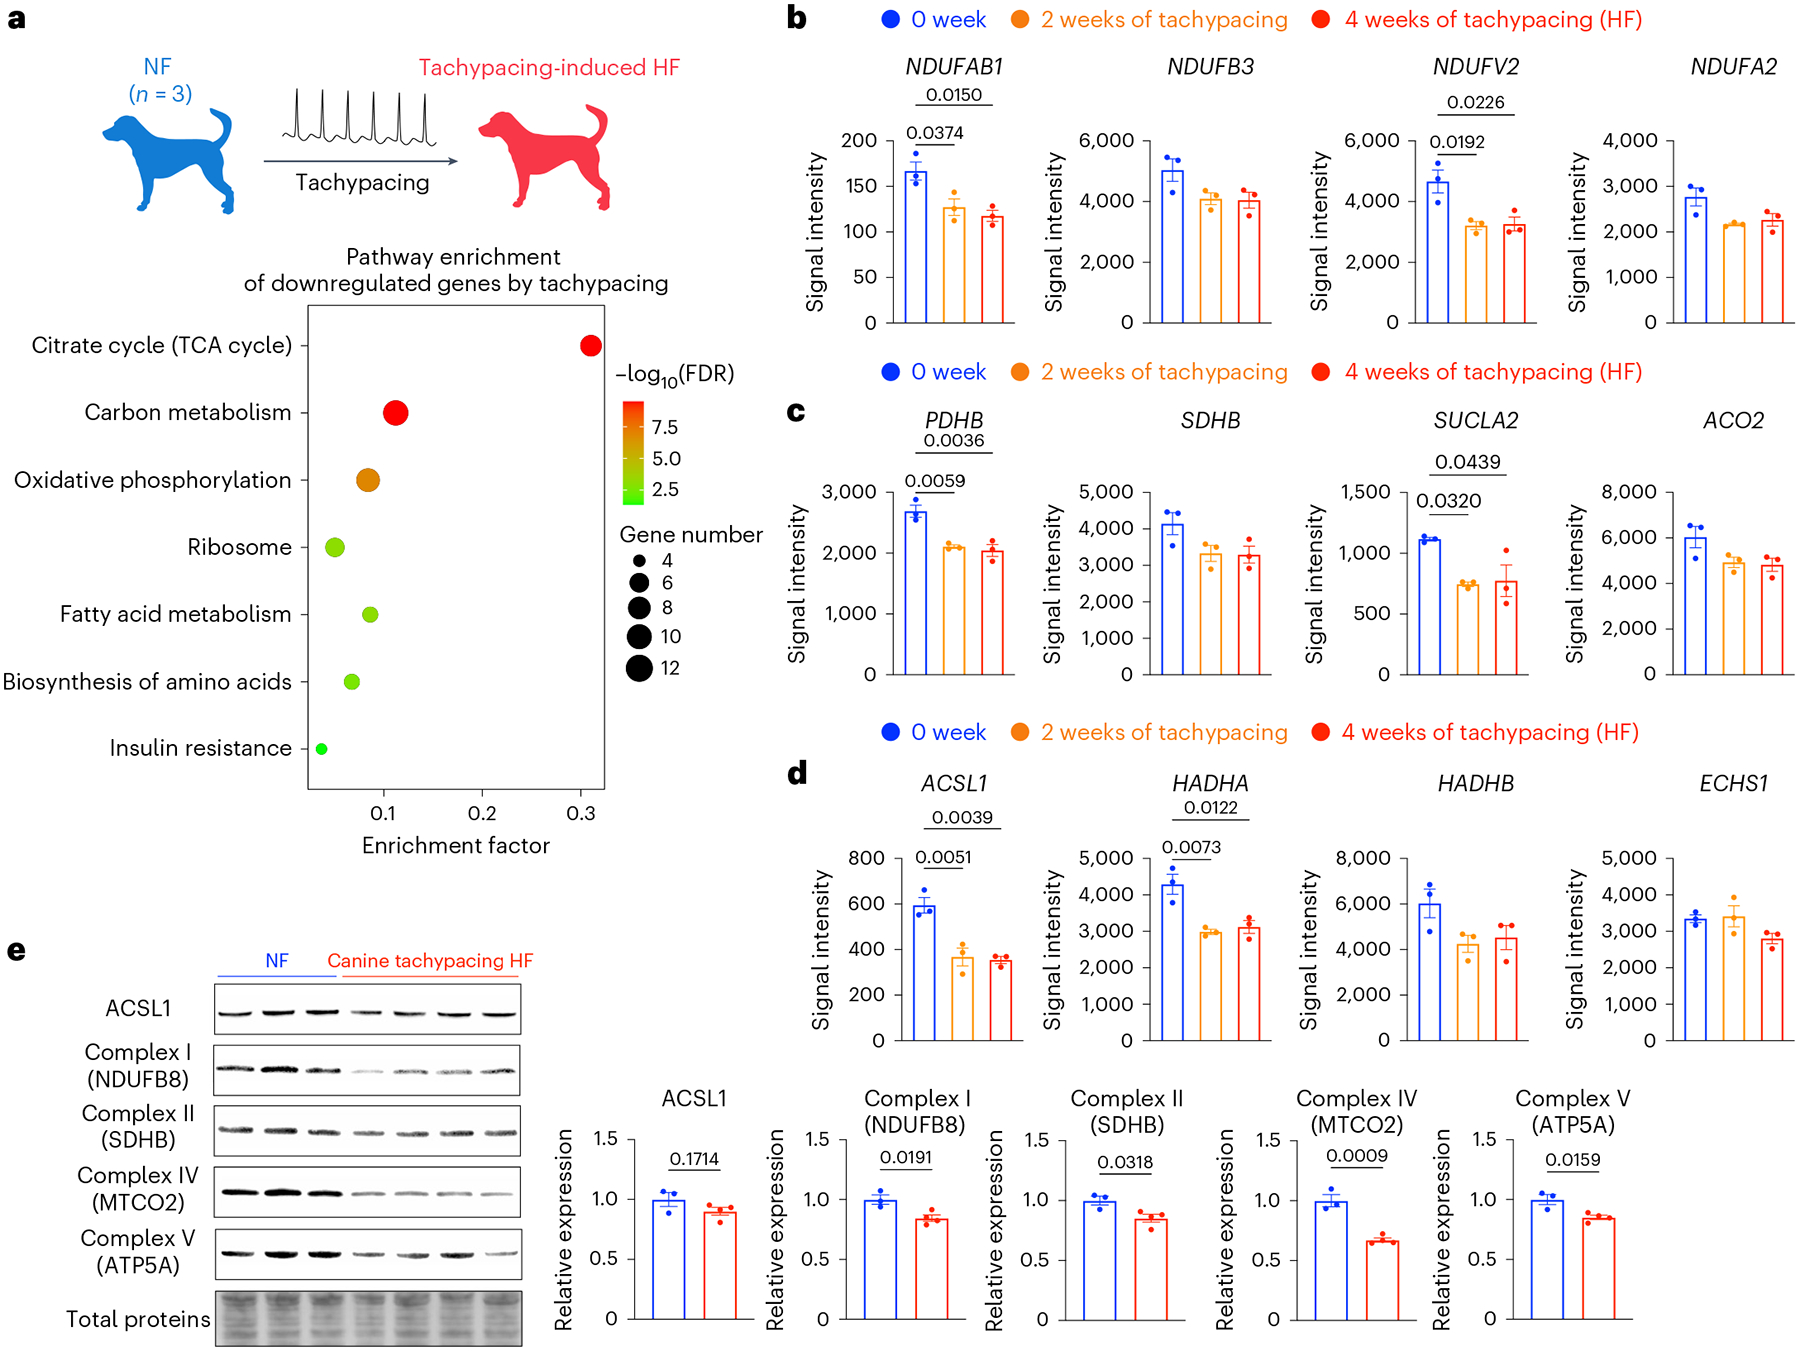
a, Microarray analysis (GSE9794) of LV tissue from dogs with or without tachypacing-induced HF. Genes downregulated in tachypacing-induced HF were subjected to pathway enrichment analysis. b, Expression of OXPHOS genes NDUFAB1, NDUFB3, NDUFV2 and NDUFA2. c, Expression of TCA cycle genes PDHB, SDHB, SUCLA2 and ACO2. d, Expression of fatty acid oxidation genes ACSL1, HADHA, HADHB and ECHS1. In b–d, the expression levels are shown as signal intensity. n = 3 dogs for each group. One-way ANOVA with Tukey’s multiple comparisons test. e, Western blot analysis of ACSL1 and OXPHOS proteins including NADH:ubiquinone oxidoreductase subunit B8 (NDUFB8), SDHB, mitochondrially encoded cytochrome c oxidase II (MTCO2) and ATP synthase F1 subunit alpha (ATP5A) in dogs with or without tachypacing-induced HF. Expression levels were normalized against the NF dogs. n = 3 NF dogs and 4 HF dogs, respectively. Unpaired Student’s t-test. Data are displayed as mean ± s.e.m.
Validation of the EHT tachypacing setup
While the canine tachypacing model offers us critical clues into the pathology of tachycardia-induced cardiac dysfunction, it is limited by throughput. In addition, there is a need to understand the direct effect of increased beating rates on cardiomyocytes, which would be difficult to achieve with bulk analysis of the heart due to the presence of non-myocytes. Therefore, we are motivated to establish a complementary model with increased throughput to facilitate mechanistic study and therapeutic testing. We designed an in vitro tachypacing setup for three-dimensional (3D) EHTs generated from human induced pluripotent stem cells (iPSCs). This tachypacing setup consists of an electrical stimulation chamber and a customized circuit connected to an Arduino microcontroller (Fig. 3a and Supplementary Fig. 2). This design can generate electrical stimulations that switch directions after each pulse, allowing us to conduct long-term pacing without inducing medium acidification. To generate EHTs, human iPSCs were differentiated into cardiomyocytes (iPSC–CMs) (Supplementary Fig. 3). The cells were cast into moulds with fibrinogen, Matrigel and thrombin to form 3D constructs, as previously described34. The resulting EHTs were treated with triiodothyronine (T3), dexamethasone (Dex) and fatty acids for 6 days35,36, followed by 40–50 days of culture to allow for further metabolic and functional maturation (Fig. 3b). This protocol resulted in comprehensive cardiac maturation as evidenced by improved metabolic function, enhanced calcium handling and stronger contraction, as well as the upregulation of maturity markers (Extended Data Fig. 2a–e). EHTs were cryosectioned and immunostained for cardiac marker troponin T (TNNT2) and non-myocytes marker vimentin (Vim). Confocal imaging revealed alignment of cardiomyocytes along the direction of contraction (Fig. 3c and Supplementary Fig. 4). These mature EHTs were highly responsive to pacing and followed the electrical stimulation to at least 3 Hz (Fig. 3d–g and Supplementary Fig. 5).
Fig. 3 |. Validation of the EHT tachypacing setup.
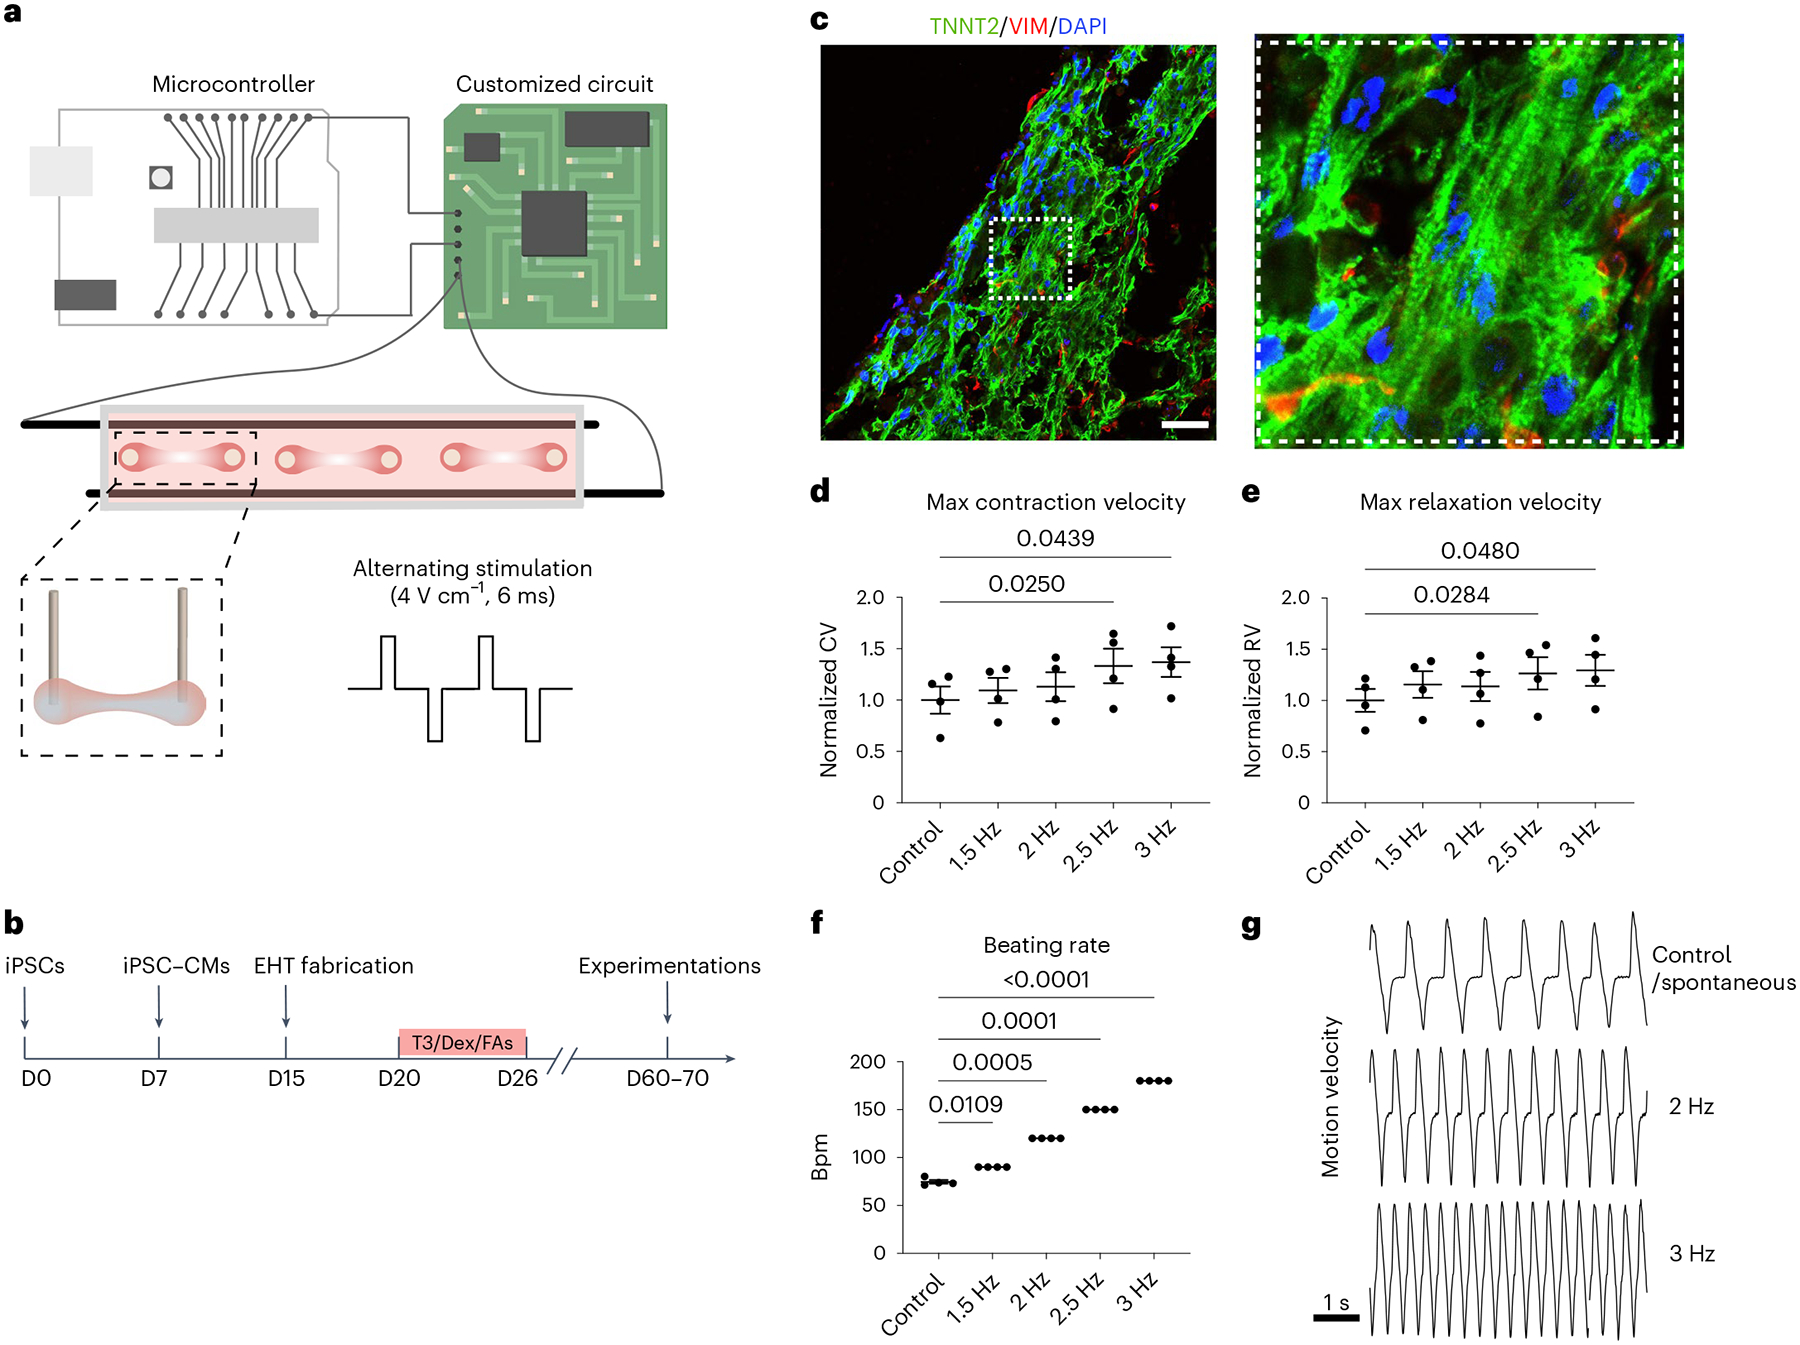
a, Schematic illustration of the customized pacing setup consisting of a microcontroller, a custom-built circuit and a culture chamber for EHTs. The direction of the stimulation current was altered after each pulse (4 V cm−1 and 6 ms pulse width). Parts of the illustration were created with BioRender. b, EHTs were generated from human iPSCs, matured with a combination of T3, Dex and fatty acids (FAs) supplementation and cultured until day (D) 60–70 for subsequent experimentations. c, Confocal images of an EHT cross-section immunostained for TNNT2 shown in green, and Vim shown in red; cell nuclei were stained by 4,6-diamidino-2-phenylindole (DAPI) shown in blue. Scale bar, 200 μm. d,e, High-speed videos of the beating EHTs from iPSC line SCVI-273 were taken to calculate maximum (max) contraction velocity (CV) (d) and maximum relaxation velocity (RV) (e) while the EHTs were subjected to an increasing stimulation frequency. For d and e, data were normalized against the unpaced control EHTs. f, The beating rate of the EHTs in response to electrical stimulation with an increasing frequency. g, Representative motion velocity traces of EHTs measured during spontaneous beating (control), 2 Hz pacing and 3 Hz pacing. n = 4 EHTs per group. One-way ANOVA with Dunnett’s multiple comparisons test. Data are displayed as mean ± s.e.m.
Tachypacing of EHTs recapitulates the key phenotype of TIC
The defining characteristic of TIC is the reversible depression of contractility7,15,37,38. To examine whether matured EHTs could recapitulate this key feature of TIC, EHTs from two independent iPSC lines were tachypaced at 3 Hz for 5 days, followed by 5 days of recovery without pacing. Contractility was measured on days 1, 3, 5, 6, 8 and 10 without pacing (Fig. 4a). Specifically, we quantified three functional parameters: contractile force, maximum contraction velocity and maximum relaxation velocity. Tachypacing did not significantly alter the spontaneous beating rate of the EHTs, therefore eliminating rate as a cofounding factor for contractility measurements (Supplementary Fig. 6). Within 24 h of tachypacing, contractility declined significantly in both cell lines (Fig. 4b–d). This is consistent with a previous canine study that showed a 30% decrease in ejection fraction after just 1 day of tachypacing39. During the 5 days of tachypacing, EHT contractility continuously declined: contractile force, maximum contraction velocity and relaxation velocity declined by about 50% in both cell lines. Upon cessation of tachypacing and normalization of the beating rate, the tachypaced EHTs experienced steady improvement and achieved full functional recovery in 5 days (Fig. 4b–d). Furthermore, a cytotoxicity assay showed no significant change in cell viability of the EHTs after tachypacing (Supplementary Fig. 7). These results suggest that in vitro tachypacing of EHTs can replicate the reversible dysfunction of TIC. We next performed two experiments to verify that tachypacing-induced contractile dysfunction is purely driven by the accelerated beating rate rather than the side effects of the electrical pacing (for example, electrical oxidation). First, EHTs were continuously paced at 1 Hz (60 bpm), a physiological heart rate, for 10 days. Contractility analysis showed that 1 Hz pacing did not affect EHT function (Extended Data Fig. 3a–d). Second, we treated EHTs with compounds to lower the beating rate during tachypacing. By doing so, the effect of the beating rate is decoupled from the effect of pacing. We tested three compounds: carvedilol, a commonly used beta-blocker, FK506, an immunosuppressant drug known to blunt heart rate increase40, and ivabradine, a clinically relevant compound targeting the funny current in pacemaker cells. All three compounds lowered the beating rate of EHTs during tachypacing, presumably by lowering the cardiac responsiveness to pacing. Furthermore, all three compounds mitigated or abolished the deterioration of contractility (Extended Data Fig. 4a–d). Taken together, these data confirmed that the impairment of contractility by tachypacing is primarily driven by the increase in beating rate.
Fig. 4 |. Tachypacing induces reversible contractile dysfunction in human EHTs.
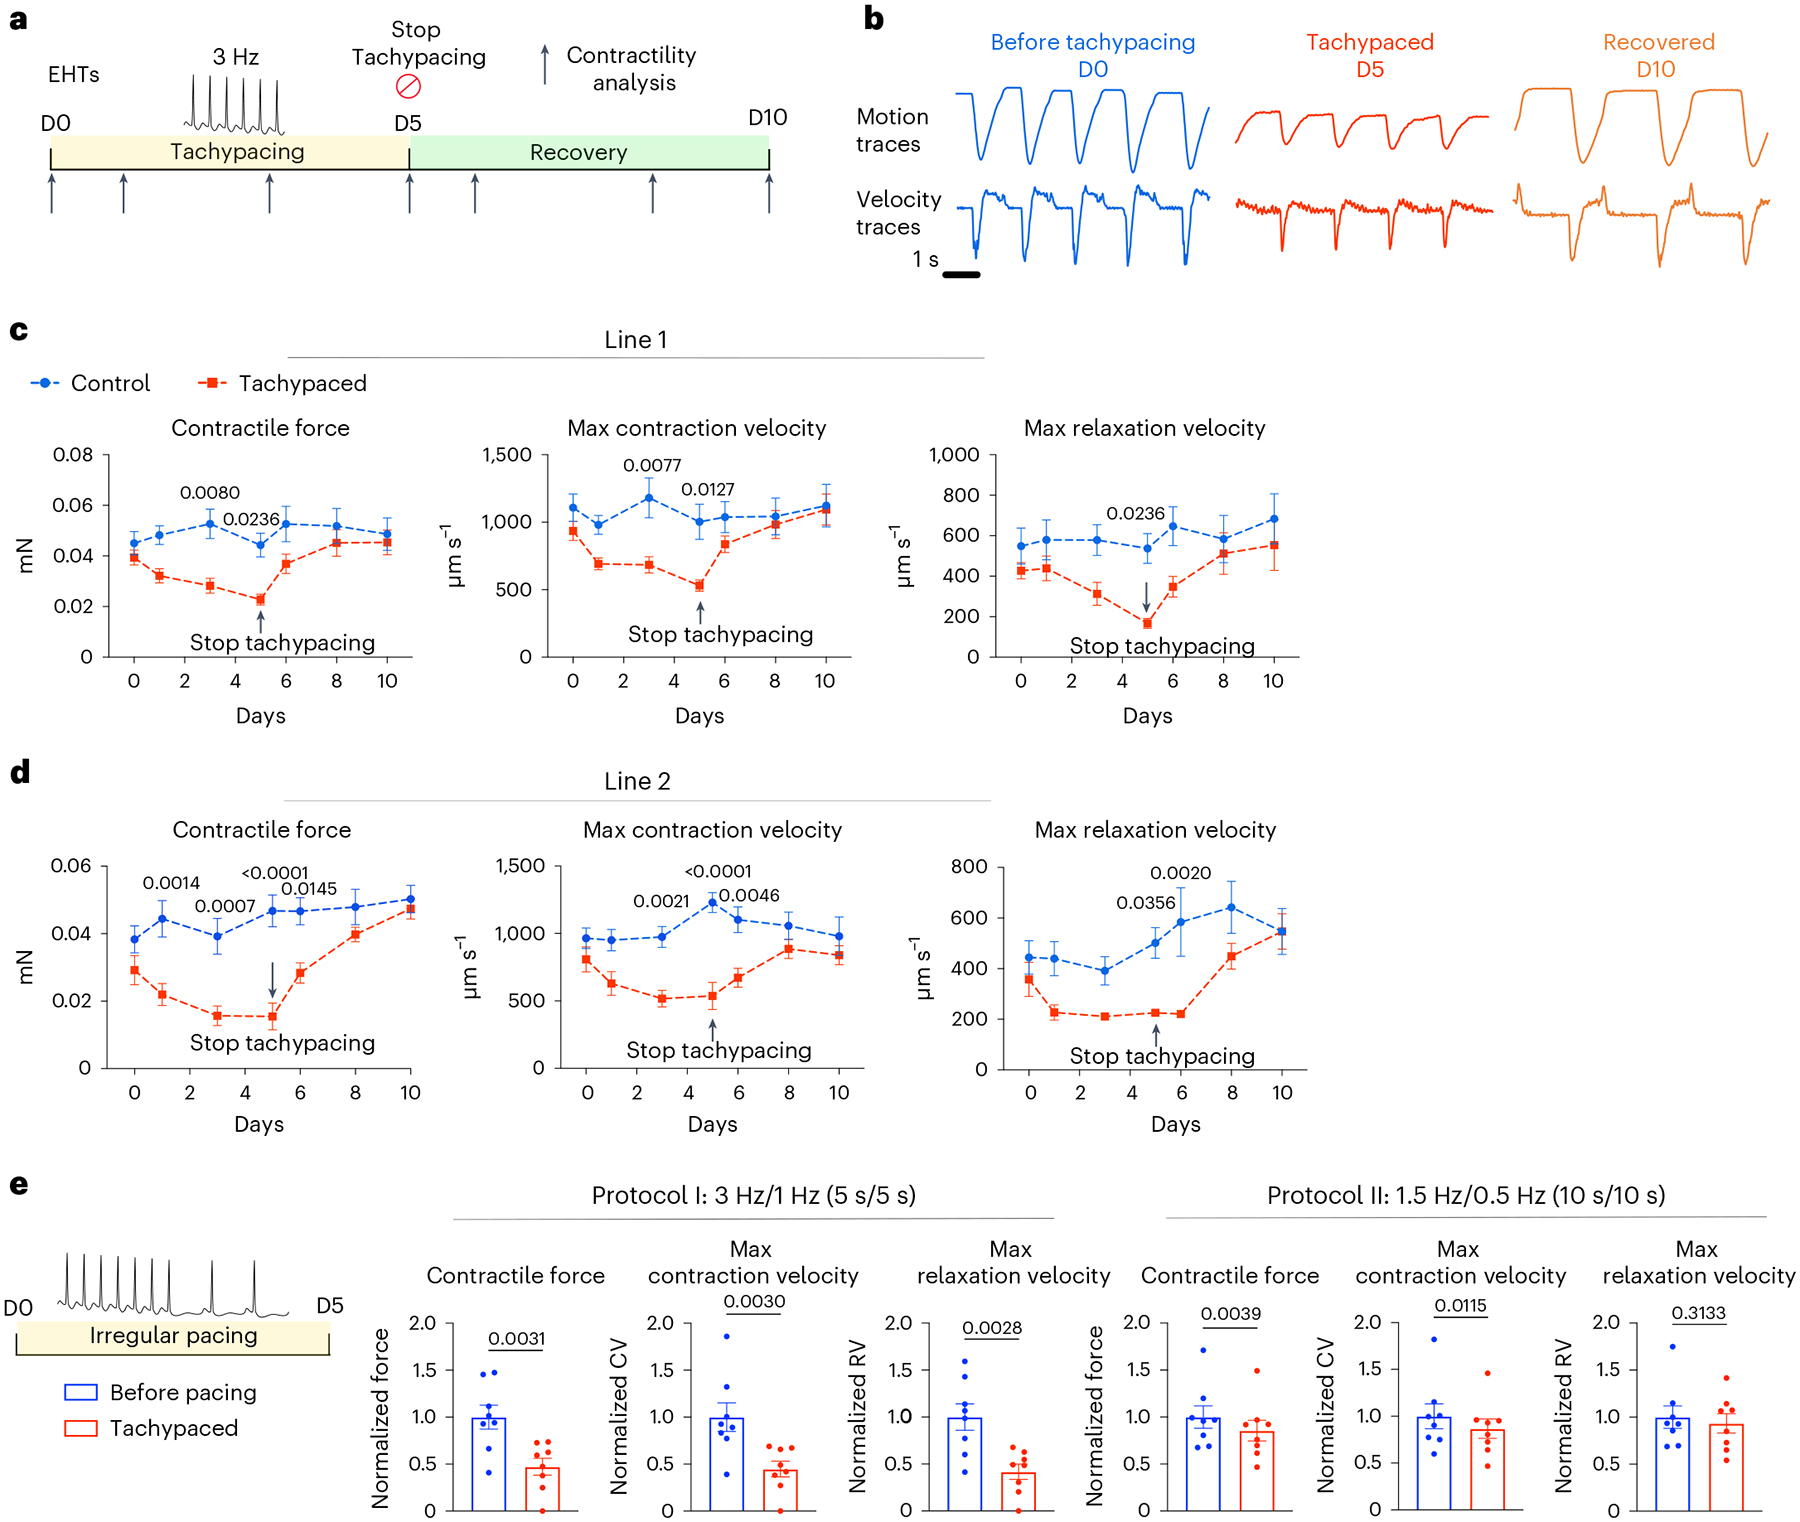
a, Schematic illustration of the experimental design: human EHTs from line SCVI-273 were tachypaced at 3 Hz for 5 days and allowed to resume the normal beating rate to recover for 5 days. Contractility was recorded at various timepoints (indicated by the arrows). No pacing was applied during the recording so functional parameters were generated under spontaneous beating for all EHTs. b, Representative motion traces and velocity traces of the tachypaced EHTs and the unpaced control EHTs from day 0, day 5 and day 10. c, Maximum contraction velocity, maximum relaxation velocity and contractile force were quantified for tachypaced EHTs (indicated by red) and control unpaced EHTs (indicated by blue) and plotted over time. d, The experiment in c was repeated in a second iPSC cell line (SCVI-15). For c and d, n = 7 EHTs for each group. Two-way ANOVA with Bonferroni’s multiple comparisons test. Control EHTs were compared with the tachypaced EHTs for each timepoint. e, EHTs (SCVI-15) were subjected to irregular pacing with either a fast-irregular regimen (3 Hz/1 Hz, 5 s/5 s) or a slow-irregular regimen (1.5 Hz/0.5 Hz, 10 s/10 s). Contractility was measured before and after 5 days of pacing and normalized against the unpaced EHTs. n = 8 EHTs. Paired Student’s t-test. Data are displayed as mean ± s.e.m.
In addition to the wild-type cell lines, we also performed tachypacing on EHTs generated from a hypertrophic cardiomyopathy (HCM) iPSC line. Specifically, these cells carry a pathogenic mutation in myosin binding protein C3 (MYBPC3) (c.3330+2T>G). Similar to their wild-type counterparts, HCM EHTs also showed reversible suppression of contractile function by tachypacing (Extended Data Fig. 5). However, the degree of functional impairment was more substantial in these HCM EHTs. On average, contractile force, contraction velocity and relaxation velocity dropped by >90% at the end of tachypacing (Extended Data Fig. 5b–d), in contrast to the 50% decrease observed in the wild-type cell lines (Fig. 4b–d). Furthermore, 7 out of the 11 tachypaced HCM EHTs completely stopped beating, an observation that was rarely seen in the wild-type EHTs. After 2 days of recovery, 3 of the 7 EHTs resumed beating, and 4 days after recovery all EHTs resumed spontaneous contraction (Extended Data Fig. 5b–d). Collectively, these data indicate that genetic predisposition may increase the severity of TIC despite the reversibility.
Clinically, tachycardia is often accompanied by an irregular heart rhythm due to a primary arrhythmia such as atrial fibrillation41. Irregularity in the heart rhythm was shown to be detrimental independent of the beating rate42,43. We devised two pacing protocols to examine the effect of rate and rhythm on cardiac contractility (Fig. 4e). In the first protocol, EHTs were electrically stimulated using a frequency alternating between 3 Hz and 1 Hz every 5 s (Fig. 4e). This protocol is intended to stress the EHTs with both a fast rate and an irregular rhythm. In the second protocol, the frequency alternates between 1.5 Hz and 0.5 Hz every 10 s, and hence, the EHTs are only stressed by the irregular rhythm. After 5 days of pacing, the fast-irregular pacing regimen reduced contractility by about 55% (Fig. 4e). Interestingly, this is comparable to the reduction induced by constant tachypacing at 3 Hz (Fig. 4b–d). The slow-irregular pacing regimen also reduced cardiac contractility but to a milder degree (~10–15% decrease) (Fig. 4e). These results suggest that both the increased beating rate and the irregular rhythm can contribute to cardiac dysfunction and beating rate appears to have a greater effect in the EHT model. Notably, an irregular heart rate may have a more profound impact on cardiac function in vivo due to the disruption of blood flow.
Tachypacing alters calcium handling and disrupts PKA signalling in a biphasic manner
Given that calcium plays a fundamental role in cardiac excitation–contraction coupling, we next assessed the effect of tachypacing on calcium handling in iPSC–CMs. Using Fluo-4, a cell-permeable calcium indicator, we examined calcium transients in tachypaced cells and quantified various parameters (Fig. 5a,b). Overall, data from two iPSC–CM lines showed a consistent trend. Tachypacing reduced the amplitude of the calcium transient in one cell line, while the decrease in the other cell line was not statistically significant (P = 0.131). Tachypacing in both cell lines significantly shortened the time to peak (TTP). Upstroke velocity decreased slightly after tachypacing. Tachypacing also resulted in the reduction of TD10 (calcium transient duration at 10% decay), TD20 and TD30 in both cell lines. TD10, TD20 and TD30 may serve as an indicator for the amount of cytosolic calcium available for maximal contraction. Given an unchanged or reduced amplitude, a decrease in TD10, TD20 and TD30 may explain the weakened contractile force in tachypaced EHTs (Fig. 4b–d). Decay time, measuring the time for calcium removal at the later phase of the transient, was significantly prolonged, indicating impaired relaxation function. Overall, these changes in calcium handling are consistent with the impairment of contractile function provoked by tachypacing in EHTs.
Fig. 5 |. PKA signalling is dysregulated by tachypacing in a biphasic manner.
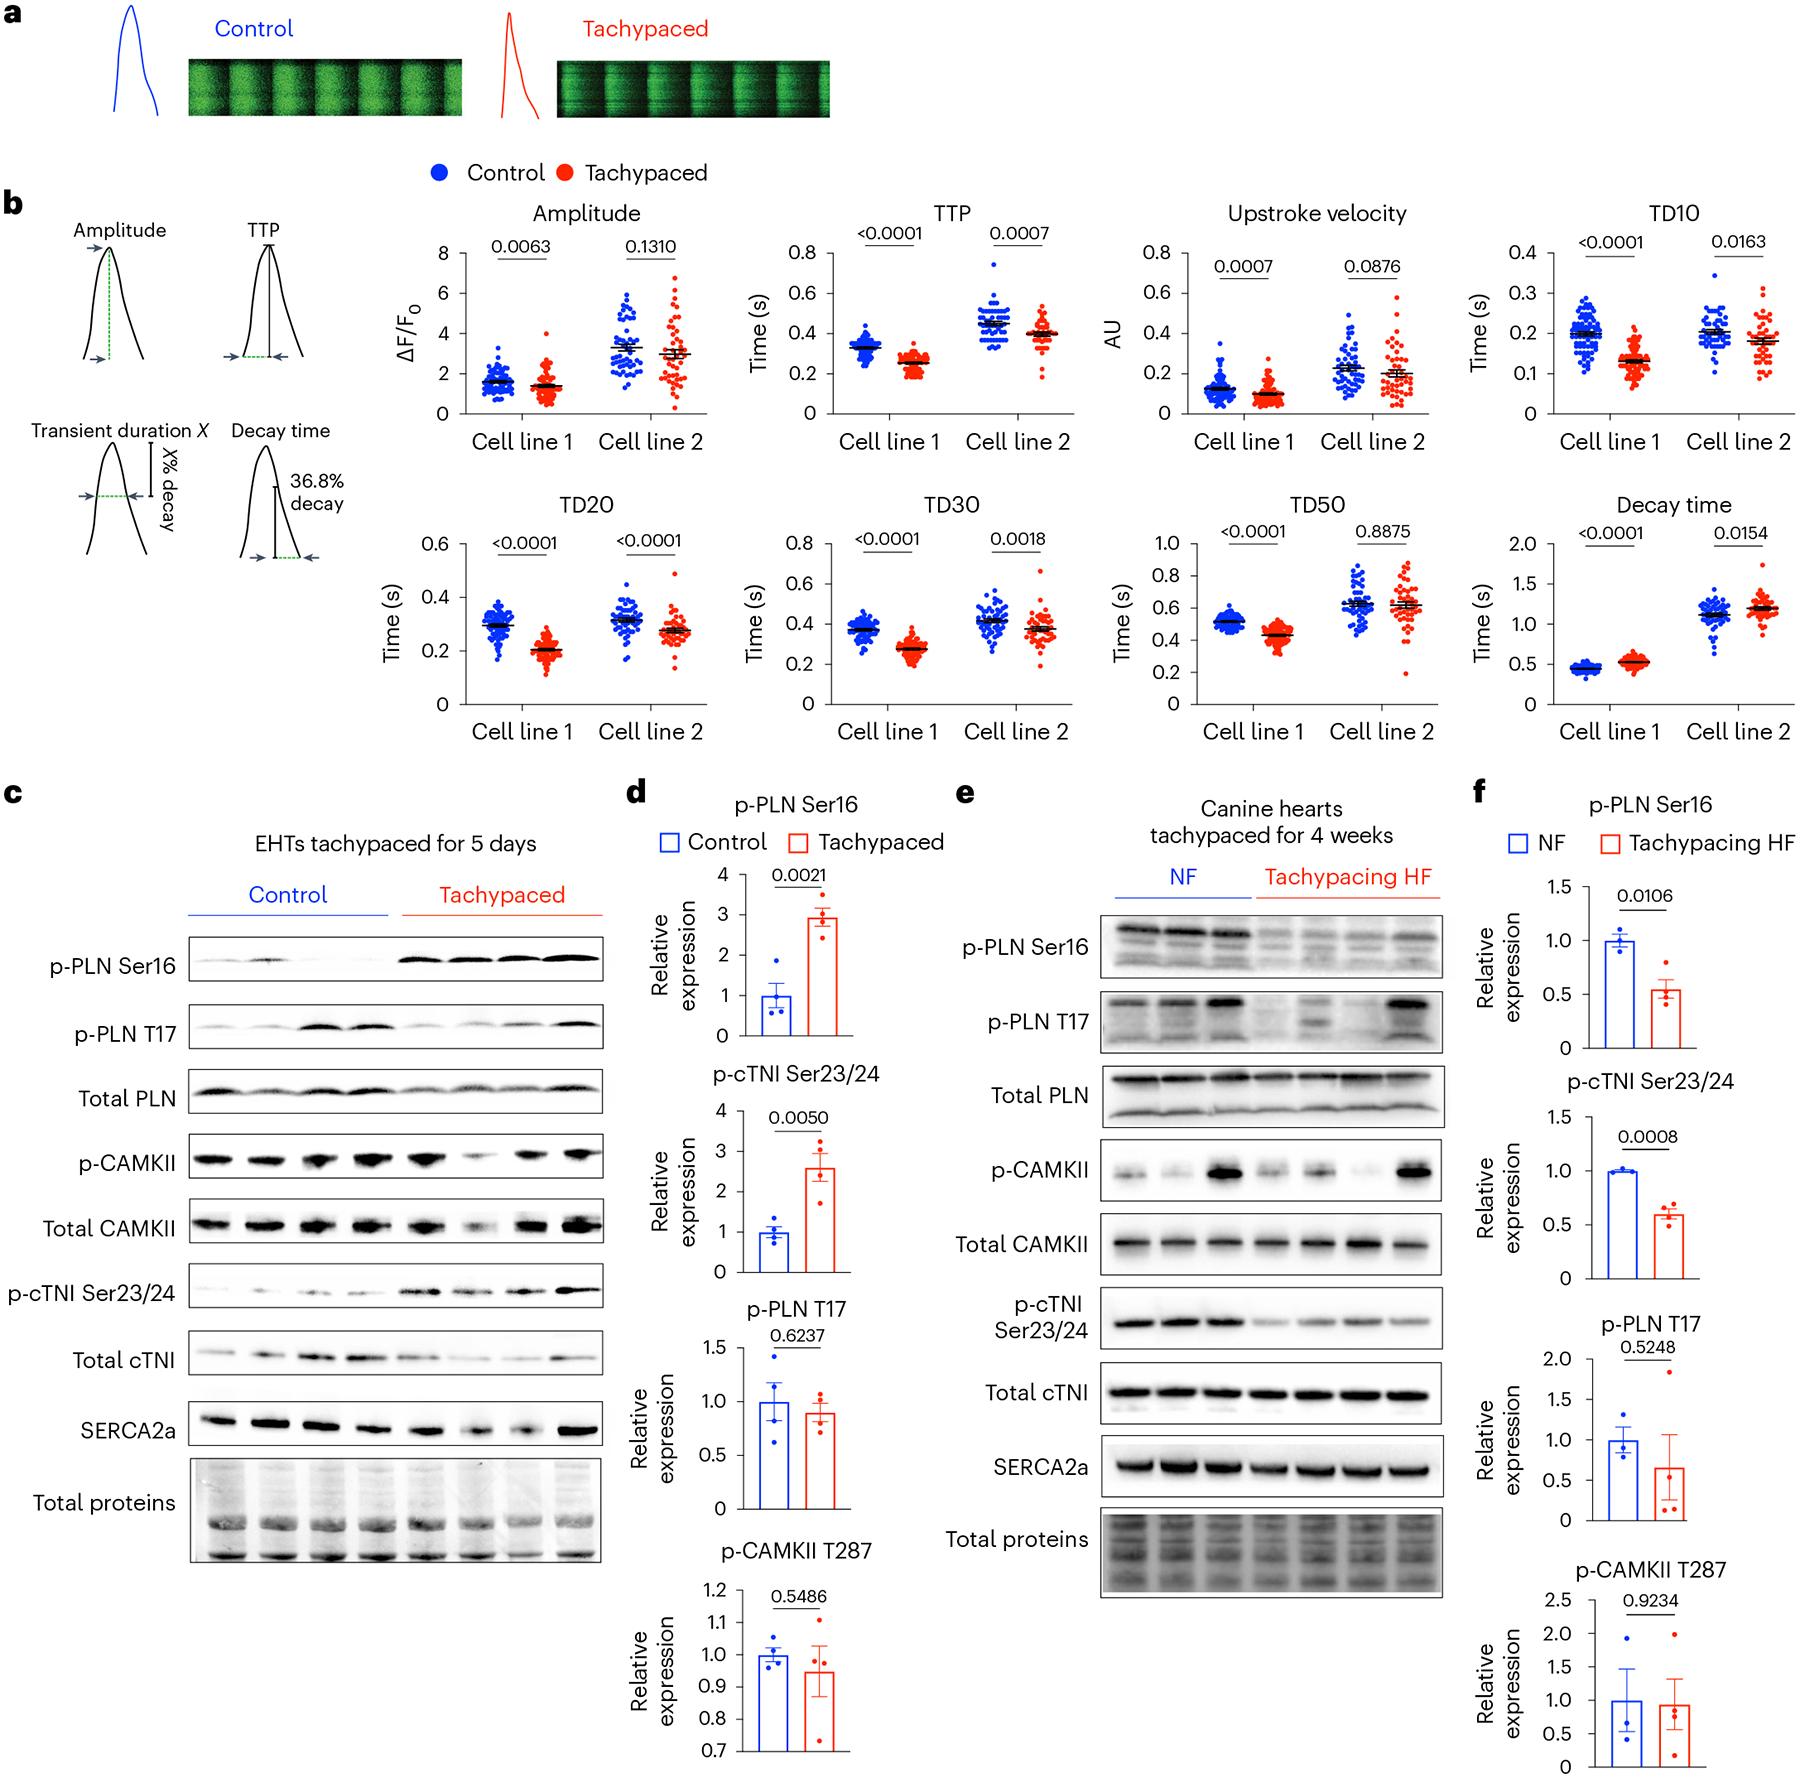
a, Monolayers of iPSC–CMs were tachypaced at 3 Hz for 5 days and imaged with the Fluo-4 dye using confocal line-scanning microscopy. Cells were paced at 0.5 Hz or 1 Hz during imaging. Representative images of calcium transients from single tachypaced iPSC–CMs (indicated by red) or unpaced control (indicated by blue). This experiment was independently performed in two different iPSC lines. b, Parameters of calcium handling were quantified in control and tachypaced iPSC–CMs, including calcium amplitude, TTP, upstroke velocity, TD10, TD20, TD30, TD50 and decay time (36.8% decay to the end of the transient). For cell line 1 (SCVI-273), n = 75 cells for the control group and n = 86 cells for the tachypaced group; for cell line 2 (SCVI-15), n = 53 cells for the control group and n = 46 cells for the tachypaced group. Two-tailed Mann–Whitney test. Data are displayed as mean ± s.e.m. c, EHTs were tachypaced for 5 days at 3 Hz (SCVI-273), followed by protein extraction and western blot analysis of phosphorylated PLN at Ser16 (p-PLN Ser16), phosphorylated PLN at Thr17 (p-PLN T17), total PLN, phosphorylated CAMKII at T287 (p-CAMKII T287), total CAMKII, phosphorylated cardiac troponin I at Ser23/24 (p-cTNI Ser23/24), total cTNI and SERCA2a. d, Expression of p-PLN Ser16, p-PLN T17, p-cTNI Ser23/24 and p-CAMKII in EHTs. Data were normalized against the unpaced EHTs. n = 4 EHTs per group. e, Western blot analysis of p-PLN Ser16, p-PLN T17, total PLN, p-CAMKII, total CAMKII, p-cTNI Ser23/24, total cTNI and SERCA2a in dogs with non-failing hearts (NF) or with tachypacing-induced HF. f, Expression of p-PLN Ser16, p-PLN T17, p-cTNI Ser23/24 and p-CAMKII in the canine samples. Data were normalized against the NF group. n = 3 NF dogs and n = 4 HF dogs. For d and f, an unpaired Student’s t-test was applied. Data are displayed as mean ± s.e.m.
Subsequently, we examined two critical regulators of calcium handling in cardiomyocytes: the protein kinase A (PKA) pathway and the calcium/calmodulin-dependent protein kinase II (CAMKII) pathway. Both PKA and CAMKII phosphorylate a broad spectrum of substrates to modulate cardiac contractility. For instance, phospholamban (PLN) can be phosphorylated by PKA (p-PLN Ser16) (ref. 44) or by CAMKII (p-PLN Thr17) (ref. 45), which relieves its inhibition of SERCA2a, resulting in positive inotropy and lusitropy. We found that tachypacing substantially increased the phosphorylation of PKA substrates in EHTs, including p-PLN Ser16 and phosphorylated cardiac troponin I (p-cTNI Ser23/24) (Fig. 5c,d). In contrast, p-PLN Thr17 and phosphorylated CAMKII (p-CAMKII) were unchanged (Fig. 5c,d). These data indicate that the PKA signalling axis was probably activated by tachypacing. This finding is consistent with a previous report that acute tachypacing of human myocardium specifically upregulated the PKA signalling pathway46. Activation of PKA in EHTs partially explains the shortening of TD10, TD20 and TD30.
We then analysed the PKA pathway and the CAMKII pathway in a more advanced stage of HF using the canine tachycardia model. This model was validated with in vivo functional data. Specifically, dogs with tachypacing-induced HF had significantly reduced ejection fraction (62% versus 35%), elevated resting heart rate (101 bpm versus 128 bpm), and increased end diastolic diameter (38 mm versus 47 mm) (Extended Data Fig. 6). We performed western blot analysis on LV tissue from three unpaced dogs and four HF dogs after 4 weeks of tachypacing. We observed the opposite trend in these canine samples. In particular, PKA signalling was downregulated, as evidenced by the reduction of p-PLN Ser16 and p-cTNI Ser23/24 (Fig. 5e,f). Indeed, it is known that PKA signalling is diminished in advanced HF such as dilated cardiomyopathy (DCM) and myocardial infarction47.
Taken together, these results suggest that tachycardia disrupts the PKA pathway in a biphasic manner. Specifically, the PKA pathway is activated in response to short-term tachycardia to meet the surging mechanical load and energetic demands. We reason at this stage functional impairment is probably fully reversible. However, sustained and high-intensity tachycardia, coupled with neurohormonal activation, eventually leads to the decompensation and diminishment of PKA signalling, as observed in end-stage HF. Intriguingly, contractility depression manifested after just several days of tachypacing in spite of increased PKA signalling activity (Figs. 4b–d and 5c,d). This discrepancy indicates the presence of an alternative mechanism overriding the positive inotropic effect of the PKA pathway.
Tachycardia promotes tissue hypoxia
To uncover the mechanism underlying tachypacing-induced contractile dysfunction, we next performed RNA sequencing (RNA-seq) analysis of three groups of samples: tachypaced EHTs, unpaced EHTs and tachypaced EHTs after functional recovery (Fig. 6a). We hypothesized that transcriptomic changes induced by tachypacing, similar to the reduction in contractility, are largely reversible. We reasoned that the expression of a subset of genes would be altered by tachypacing and then normalize after recovery. These ‘reversible genes’, which correlate with the reversible functional impairment, could offer critical mechanistic insights. Comparison between tachypaced EHTs and unpaced EHTs revealed 58 differentially expressed genes (DEGs), and 31 of the 58 genes showed normalized expression after recovery, such as pyruvate dehydrogenase kinase 4 (PDK4), fos proto-oncogene (FOS), lactate dehydrogenase A (LDHA) and vascular endothelial growth factor A (VEGFA), which were confirmed by qPCR (Fig. 6b,c and Extended Data Fig. 7). Pathway analysis of these ‘reversible genes’ showed strong enrichment for hypoxia-inducible-factor 1 (HIF1) signalling and glycolysis pathway. Similarly, Gene Ontology (GO) analysis indicates that these genes participate in glycolytic metabolic processes and cellular responses to an abiotic stimulus (for example, oxygen depletion) (Fig. 6c).
Fig. 6 |. Tachycardia promotes tissue hypoxia.
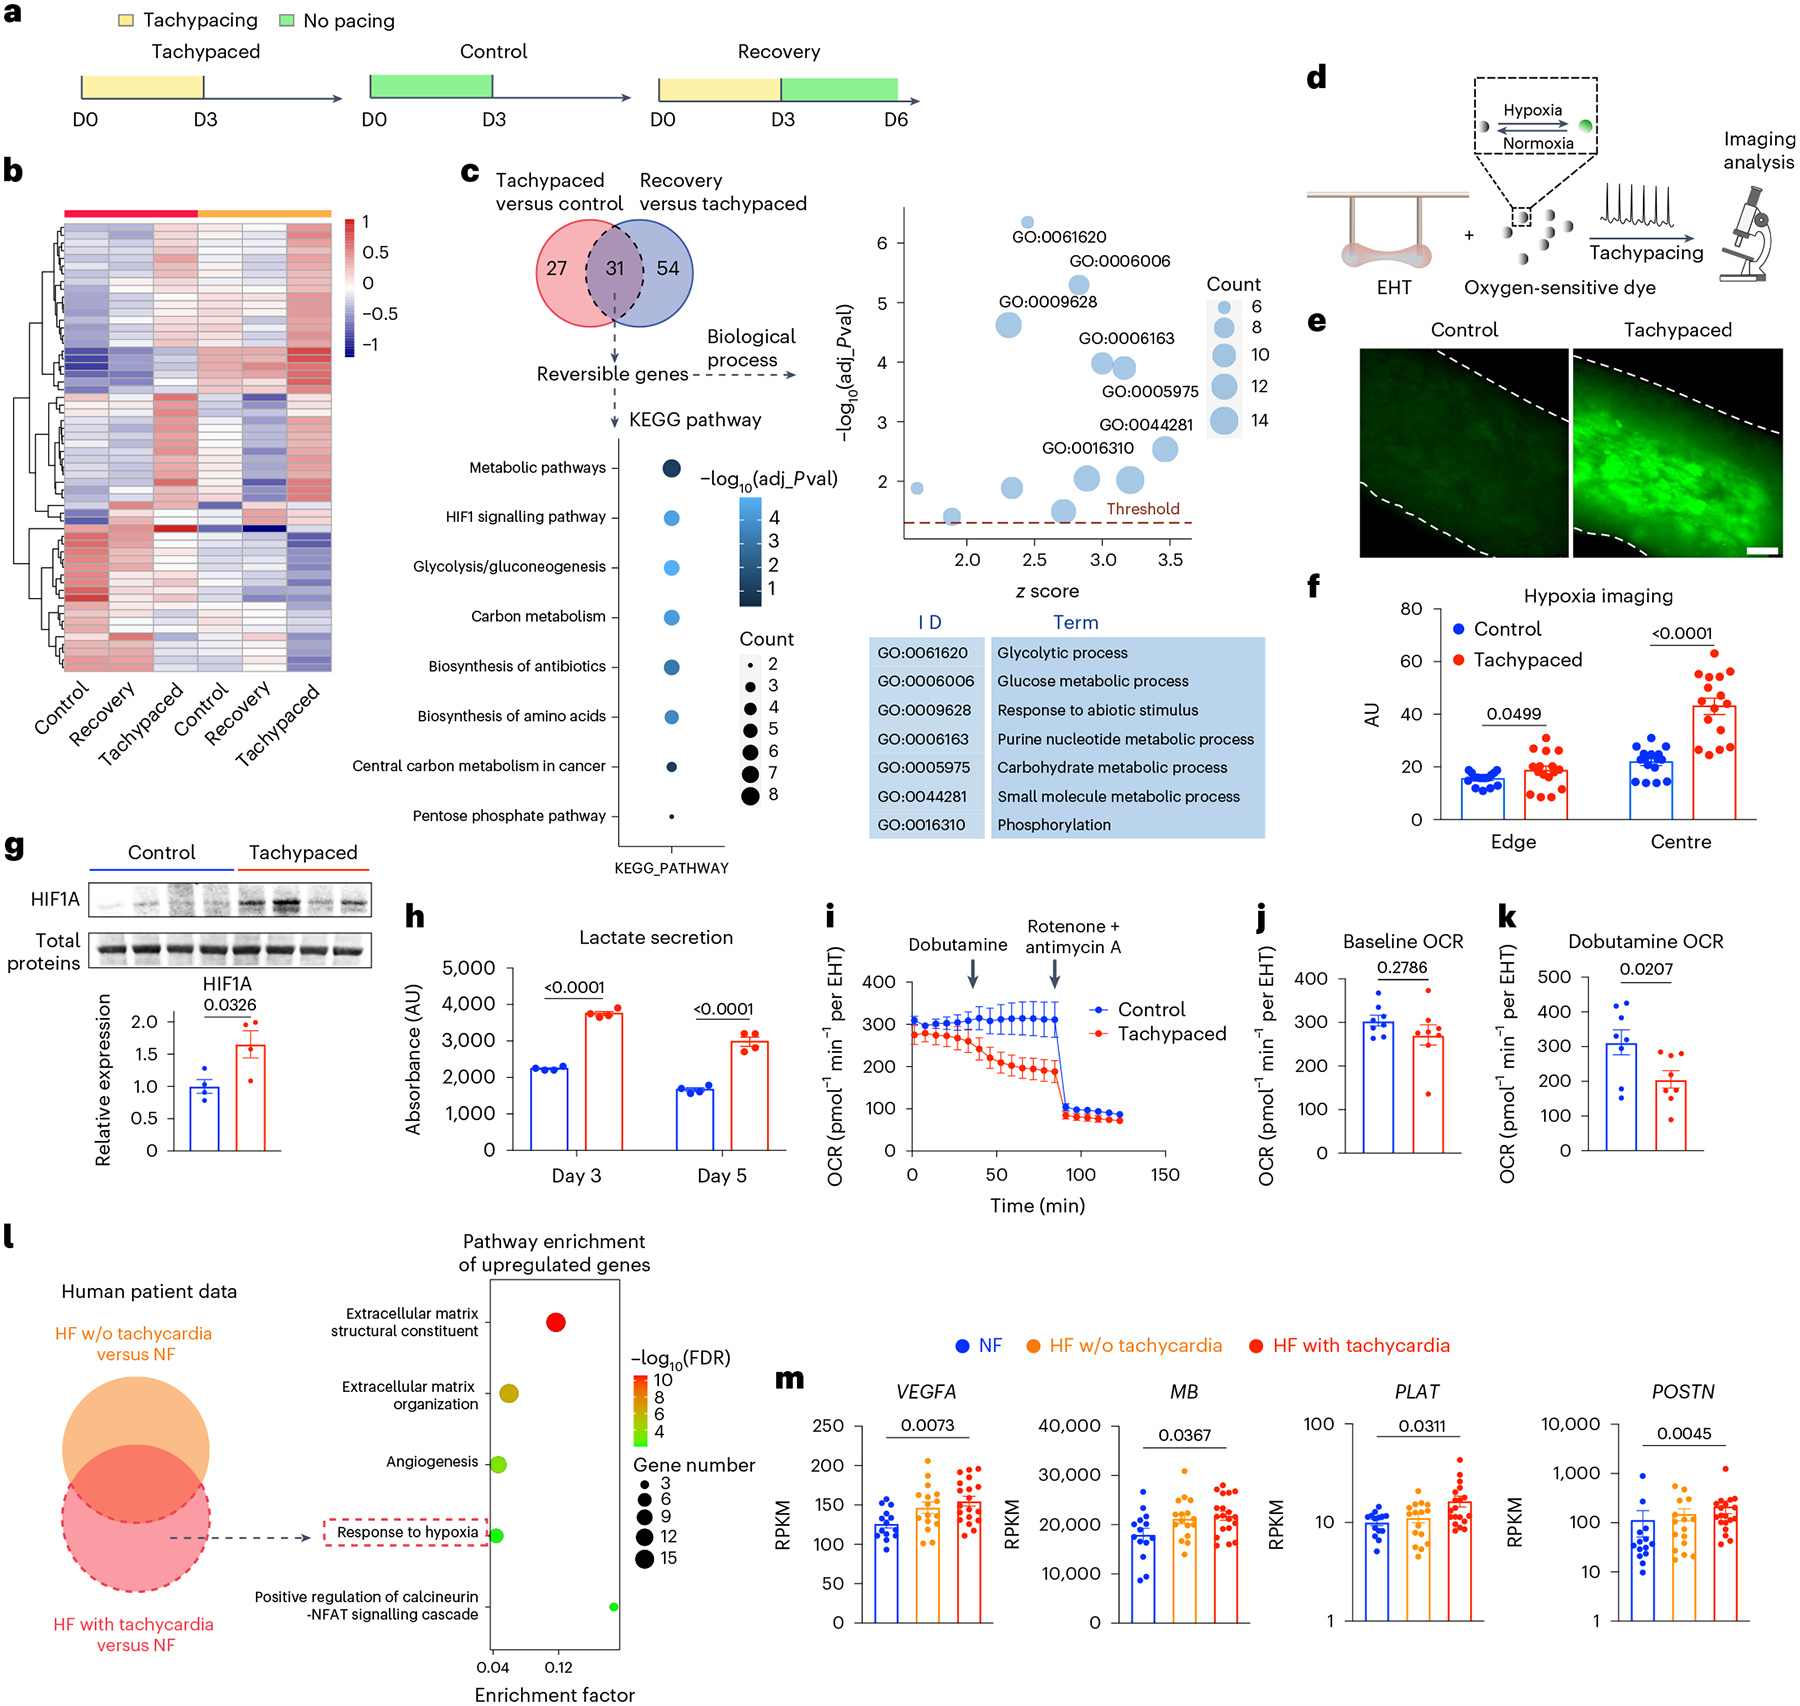
a, RNA-seq analysis of three groups of EHTs: tachypaced EHTs, unpaced EHTs and tachypaced EHTs after recovery. b, Heat map of DEGs between tachypaced and unpaced EHTs are shown in six samples from two independent batches (SCVI-273). c, Pathway analysis and GO analysis of genes reversibly affected by tachypacing. The cutoff of adjusted p-value (adj_pval) was 0.05. d, Schematic illustration of hypoxia imaging: EHTs (SCVI-273) were incubated with an oxygen-sensitive dye and then subjected to tachypacing at 3 Hz or no pacing for 3 h, followed by fluorescence imaging. e, Representative fluorescence images of unpaced control EHTs and tachypaced EHTs. Scale bar, 200 μm. f, Quantification of the fluorescence intensity from unpaced control EHTs (indicated by blue) and tachypaced EHTs (indicated by red) at the edge of the tissue or the centre of the tissue. n = 16 regions of interest. Two-tailed Mann–Whitney test. g, Western blot analysis of HIF1A in unpaced EHTs or EHTs tachypaced for 5 days. Expression levels were normalized against the unpaced EHTs. n = 4 EHTs per group (SCVI-273). Unpaired Student’s t-test. h, Lactate was measured from the extracellular medium of unpaced EHTs (indicated by blue) and tachypaced EHTs (indicated by red) on day 3 and day 5 of pacing. n = 4 samples per group. Unpaired Student’s t-test. i, OCR measurement of unpaced or tachypaced EHTs by Seahorse analysis. n = 8 EHTs per group (SCVI-273). j, OCR of control and tachypaced EHTs at baseline. k, OCR of unpaced and tachypaced EHTs measured after dobutamine (10 μM) treatment. Two-tailed Mann–Whitney test. l, Analysis of human data identifies tachycardia-specific genes exclusively upregulated in failing hearts with tachycardia but not in those without. The results of pathway enrichment analysis are presented in a bubble diagram. m, Expression of hypoxia genes VEGF, MB, tissue-type plasminogen activator (PLAT) and periostin (POSTN) in patients with non-failing hearts (n = 14), patients with HF (n = 16) or patients with HF and tachycardia (n = 19). The y axes were shown in a linear scale for VEGF and MB and a log scale for PLAT and POSTN. One-way ANOVA with Tukey’s multiple comparisons test (for VEGF and MB) or Kruskal–Wallis with Dunn’s multiple comparisons test (for PLAT and POSTN). Data are displayed as mean ± s.e.m.
Transcriptomic activation of HIF1 suggests tachycardia may induce tissue hypoxia. To test this hypothesis, we loaded EHTs with an oxygen-sensitive dye, which is dark in a normoxic condition and becomes fluorescent in a hypoxic environment (Fig. 6d). Subsequently, the EHTs were tachypaced for 3 h at 3 Hz, followed by imaging analysis. Tachypacing substantially increased the intensity of the fluorescence signal, indicating reduced oxygen availability in the tissue (Fig. 6e,f). The signal intensity, as expected, was most prominent at the centre of the tissue and minimal at the edge. In contrast, little signal was observed in the unpaced EHTs, suggesting minimum hypoxia at the baseline (Fig. 6e,f). The imaging data were corroborated by the upregulation of HIF1A protein in tachypaced EHTs (Fig. 6g) as well as increased lactate secretion, a marker of anaerobic glycolysis (Fig. 6h). Furthermore, we gauged the effect of hypoxia on the tachypaced EHTs via the Seahorse analysis, which measures oxygen consumption rate (OCR). In adaptation to hypoxia, we expect tachypaced EHTs to have suppressed OCR. After 5 days of tachypacing, EHTs had a slight but non-significant decrease in baseline OCR (Fig. 6i,j). Interestingly, upon beta adrenergic stimulation by dobutamine, tachypaced EHTs showed a marked reduction in OCR compared with the healthy unpaced EHTs (Fig. 6i,k). Lastly, transcriptomic analysis of human myocardial biopsies also showed that tachycardia is associated with hypoxia, as evidenced by the upregulation of hypoxia markers such as VEGFA and myoglobin (MB) (Fig. 6l,m).
The mechanism underlying tachycardia-induced hypoxia is probably the mismatch between oxygen demand and supply. In particular, cardiac oxygen consumption was found to be largely proportional to its beating rate48,49. Increasing the heart rate from 100 bpm to 200 bpm, for example, doubles the oxygen demand49. Therefore, tachycardia, especially sustained tachycardia, is likely to reduce myocardial oxygen availability in patients who often have some vascular dysfunction. In the long term, reduced oxygen can lead to the downregulation of OXPHOS on both messenger RNA and protein levels (Figs. 1 and 2). Indeed, after exposure of iPSC–CMs to hypoxia for just 24 h, OXPHOS genes such as NADH:ubiquinone oxidoreductase complex assembly factor 1 (NDUFAF1), subunit A2 (NDUFA2), subunit B9 (NDUFB9) and subunit S5 (NDUFS5) were significantly downregulated (Extended Data Fig. 8).
Glucose metabolites are increased by tachypacing
In addition to the activation of hypoxia signalling, our transcriptomic data also pointed towards increased glucose metabolism (Fig. 6c). To confirm this metabolic shift towards glucose utilization, we employed metabolomics to compare the tachypaced EHTs with the unpaced EHTs. Glucose metabolism comprises multiple branches of pathways such as glycolysis, hexosamine biosynthetic pathway (HBP), polyol pathway and serine biosynthetic pathway (Fig. 7a). Overall, we observed a consistent increase of various glucose metabolites in tachypaced EHTs. Specifically, glycolysis metabolites such as dihydroxyacetone phosphate and pyruvate were increased (Fig. 7b). Two key metabolites from the serine biosynthetic pathway, phosphohydroxypyruvic acid and serine were upregulated by tachypacing (Fig. 7c). Ribulose 5-phosphate, an important metabolite of the pentose phosphate pathway (PPP), was nearly doubled (Fig. 7d), which agrees with a prior report that the PPP pathway is upregulated in tachypacing-induced HF50. Sorbitol, an intermediate of the polyol pathway and a marker for diabetic cardiomyopathy51, was increased by 50% (Fig. 7e). Furthermore, the HBP pathway also appeared to be activated. The HBP pathway drives glutamine conversion to glutamate, and the glutamate/glutamine ratio was elevated by tachypacing. In the meantime, there appears to be a slight but non-significant increase of uridine diphosphate N-acetylglucosamine (UDP-GlcNAc), the final product of the HBP pathway (Fig. 7f). While most TCA metabolites were minimally changed by tachypacing, the level of succinic acid increased (Fig. 7g). Accumulation of succinic acid is a well-established marker for tissue ischaemia52,53, further confirming that tachypaced EHTs were hypoxic. The increased abundance in glucose metabolites was probably driven by an elevated level of glucose transporter 1 (GLUT1), which was confirmed by the western blot analysis (Fig. 7h). Notably, a similar trend (P = 0.062) of GLUT1 upregulation was also observed in the tachypaced canine hearts (Fig. 7i). These data indicate that tachypacing promotes metabolic reprogramming towards increased reliance on glucose utilization at least partially via GLUT1 upregulation.
Fig. 7 |. Increased glucose utilization in tachypaced EHTs.
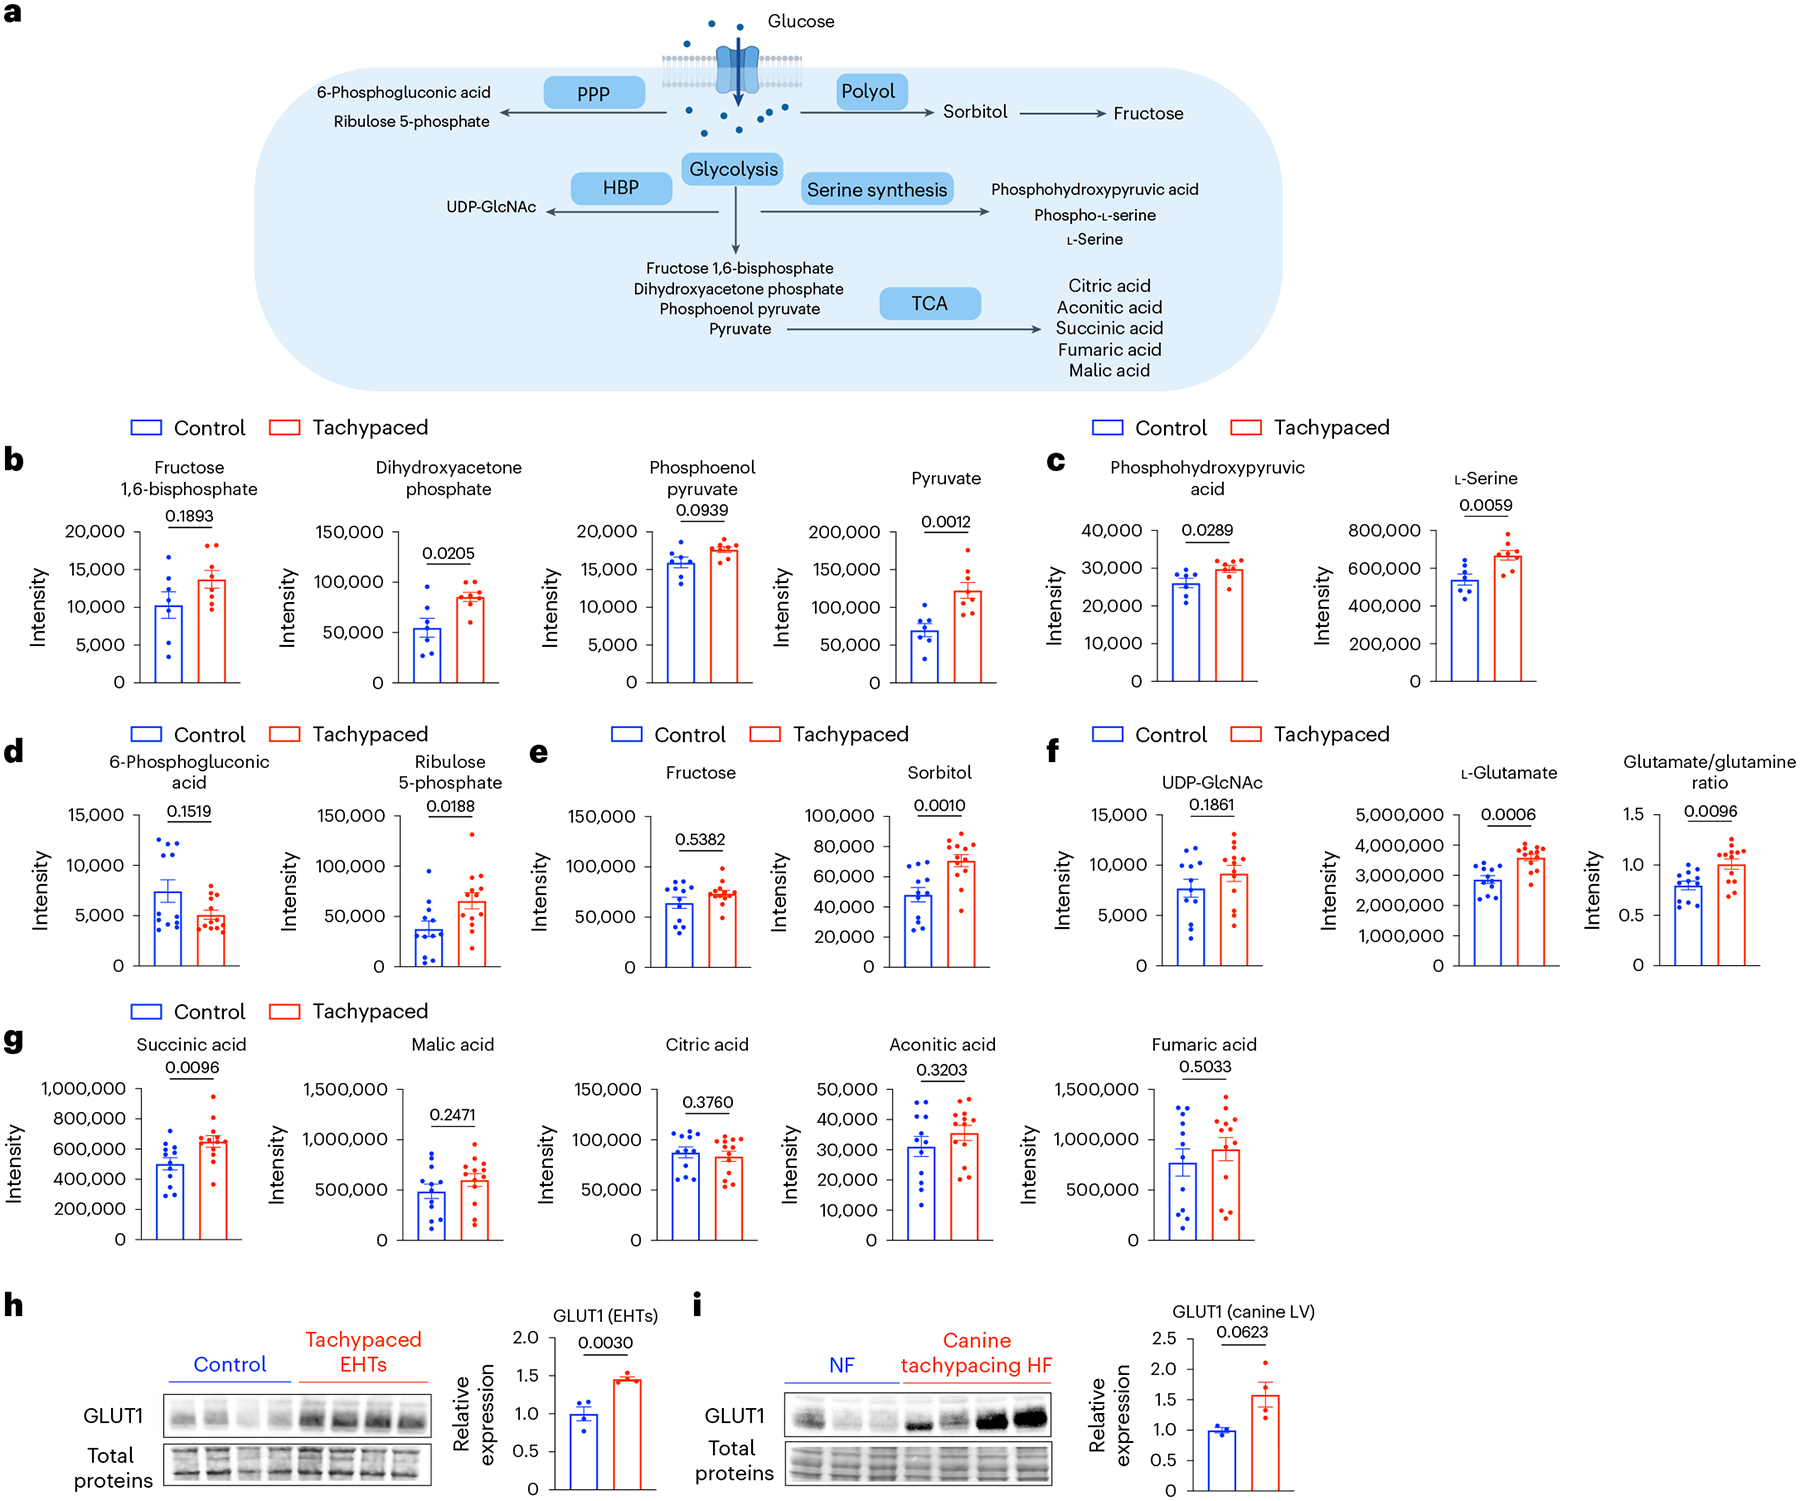
a, Key pathways and metabolites of glucose metabolism. EHTs from line SCVI-273 were tachypaced (indicated by red) or unpaced (indicated by blue) for 5 days at 3 Hz, followed by metabolomic analysis. Parts of the illustration were created with BioRender. b, Quantification of glycolysis metabolites: fructose 1,6-biphosphate, dihydroxyacetone phosphate, phosphoenol pyruvate and pyruvate (n = 7 control EHTs and n = 8 tachypaced EHTs). c, Quantification of serine biosynthesis pathway metabolites: phosphohydroxypyruvic acid and serine (n = 7 control EHTs and n = 8 tachypaced EHTs). d, Quantification of the PPP pathway metabolites: 6-phosphogluconic acid and ribulose 5-phosphate (n = 12 control EHTs and n = 13 tachypaced EHTs). e, Quantification of the polyol pathway metabolites: fructose and sorbitol (n = 12 control EHTs and n = 13 tachypaced EHTs). f, Quantification of the HBP pathway metabolites: UDP-GlcNAc, glutamate and the glutamate/glutamine ratio (n = 12 control EHTs and n = 13 tachypaced EHTs). g, Quantification of TCA cycle metabolites: succinic acid, malic acid, citric acid, aconitic acid and fumaric acid (n = 12 control EHTs and n = 13 tachypaced EHTs). For b–g, a two-tailed Mann–Whitney test was applied. h, Western blot analysis of GLUT1 in unpaced or tachypaced EHTs. n = 4 EHTs per group. i, Western blot analysis of GLUT1 in canine left ventricle tissue with or without tachypacing-induced HF. n = 3 NF dogs and n = 4 HF dogs. For h and i, data were normalized against the control EHTs and the NF dogs, respectively. Unpaired Student’s t-test. Data are displayed as mean ± s.e.m.
NAD redox imbalance and increased SERCA2a acetylation underlie tachycardia-induced contractile dysfunction
On the basis of the transcriptomic, metabolomic and imaging data, we suspected that NAD homeostasis was disturbed with two rationales. First, NAD+ is an essential coenzyme extensively used in glucose metabolism54. For instance, NAD+ is consumed in glycolysis to generate pyruvate and further required to generate acetyl-CoA in the TCA cycle. In the polyol pathway, NAD+ is used to convert sorbitol into fructose. Increased glucose utilization, therefore, raises the consumption of NAD+ in the cytosol. Second, NAD+ is regenerated from NADH during mitochondrial respiration, mainly through type I NADH dehydrogenase (complex I). This process is highly sensitive to oxygen depletion. Therefore, hypoxia induced by tachycardia would probably lead to reduced NAD+ regeneration. Both hypoxia and hyperglycaemia have been shown to reduce the NAD+/NADH ratio in other types of cells55,56. To test the hypothesis, we exposed iPSC–CMs to low glucose (2.5 mM glucose; LG), hyperglycaemia (25 mM glucose; HG) or a combination of hypoxia (<1% O2) and hyperglycaemia for 24 h. HG had a minimal effect on NAD+ content but significantly increased the level of NADH, causing the expansion of the total NAD pool and the reduction of NAD+/NADH ratio (Fig. 8a). The combination of HG and hypoxia exacerbated this change and further decreased the NAD+/NADH ratio. Interestingly, tachypacing had a similar effect on EHTs. After 5 days of tachypacing, EHTs had a slightly elevated total NAD pool (P = 0.1049) and a decreased NAD+/NADH ratio (Fig. 8b). Collectively, these data suggest that increased hypoxia and glucose utilization induced by tachypacing contributed to NAD redox imbalance.
Fig. 8 |. Disrupted NAD homeostasis and SERCA2a acetylation underlie tachycardia-induced cardiac dysfunction.
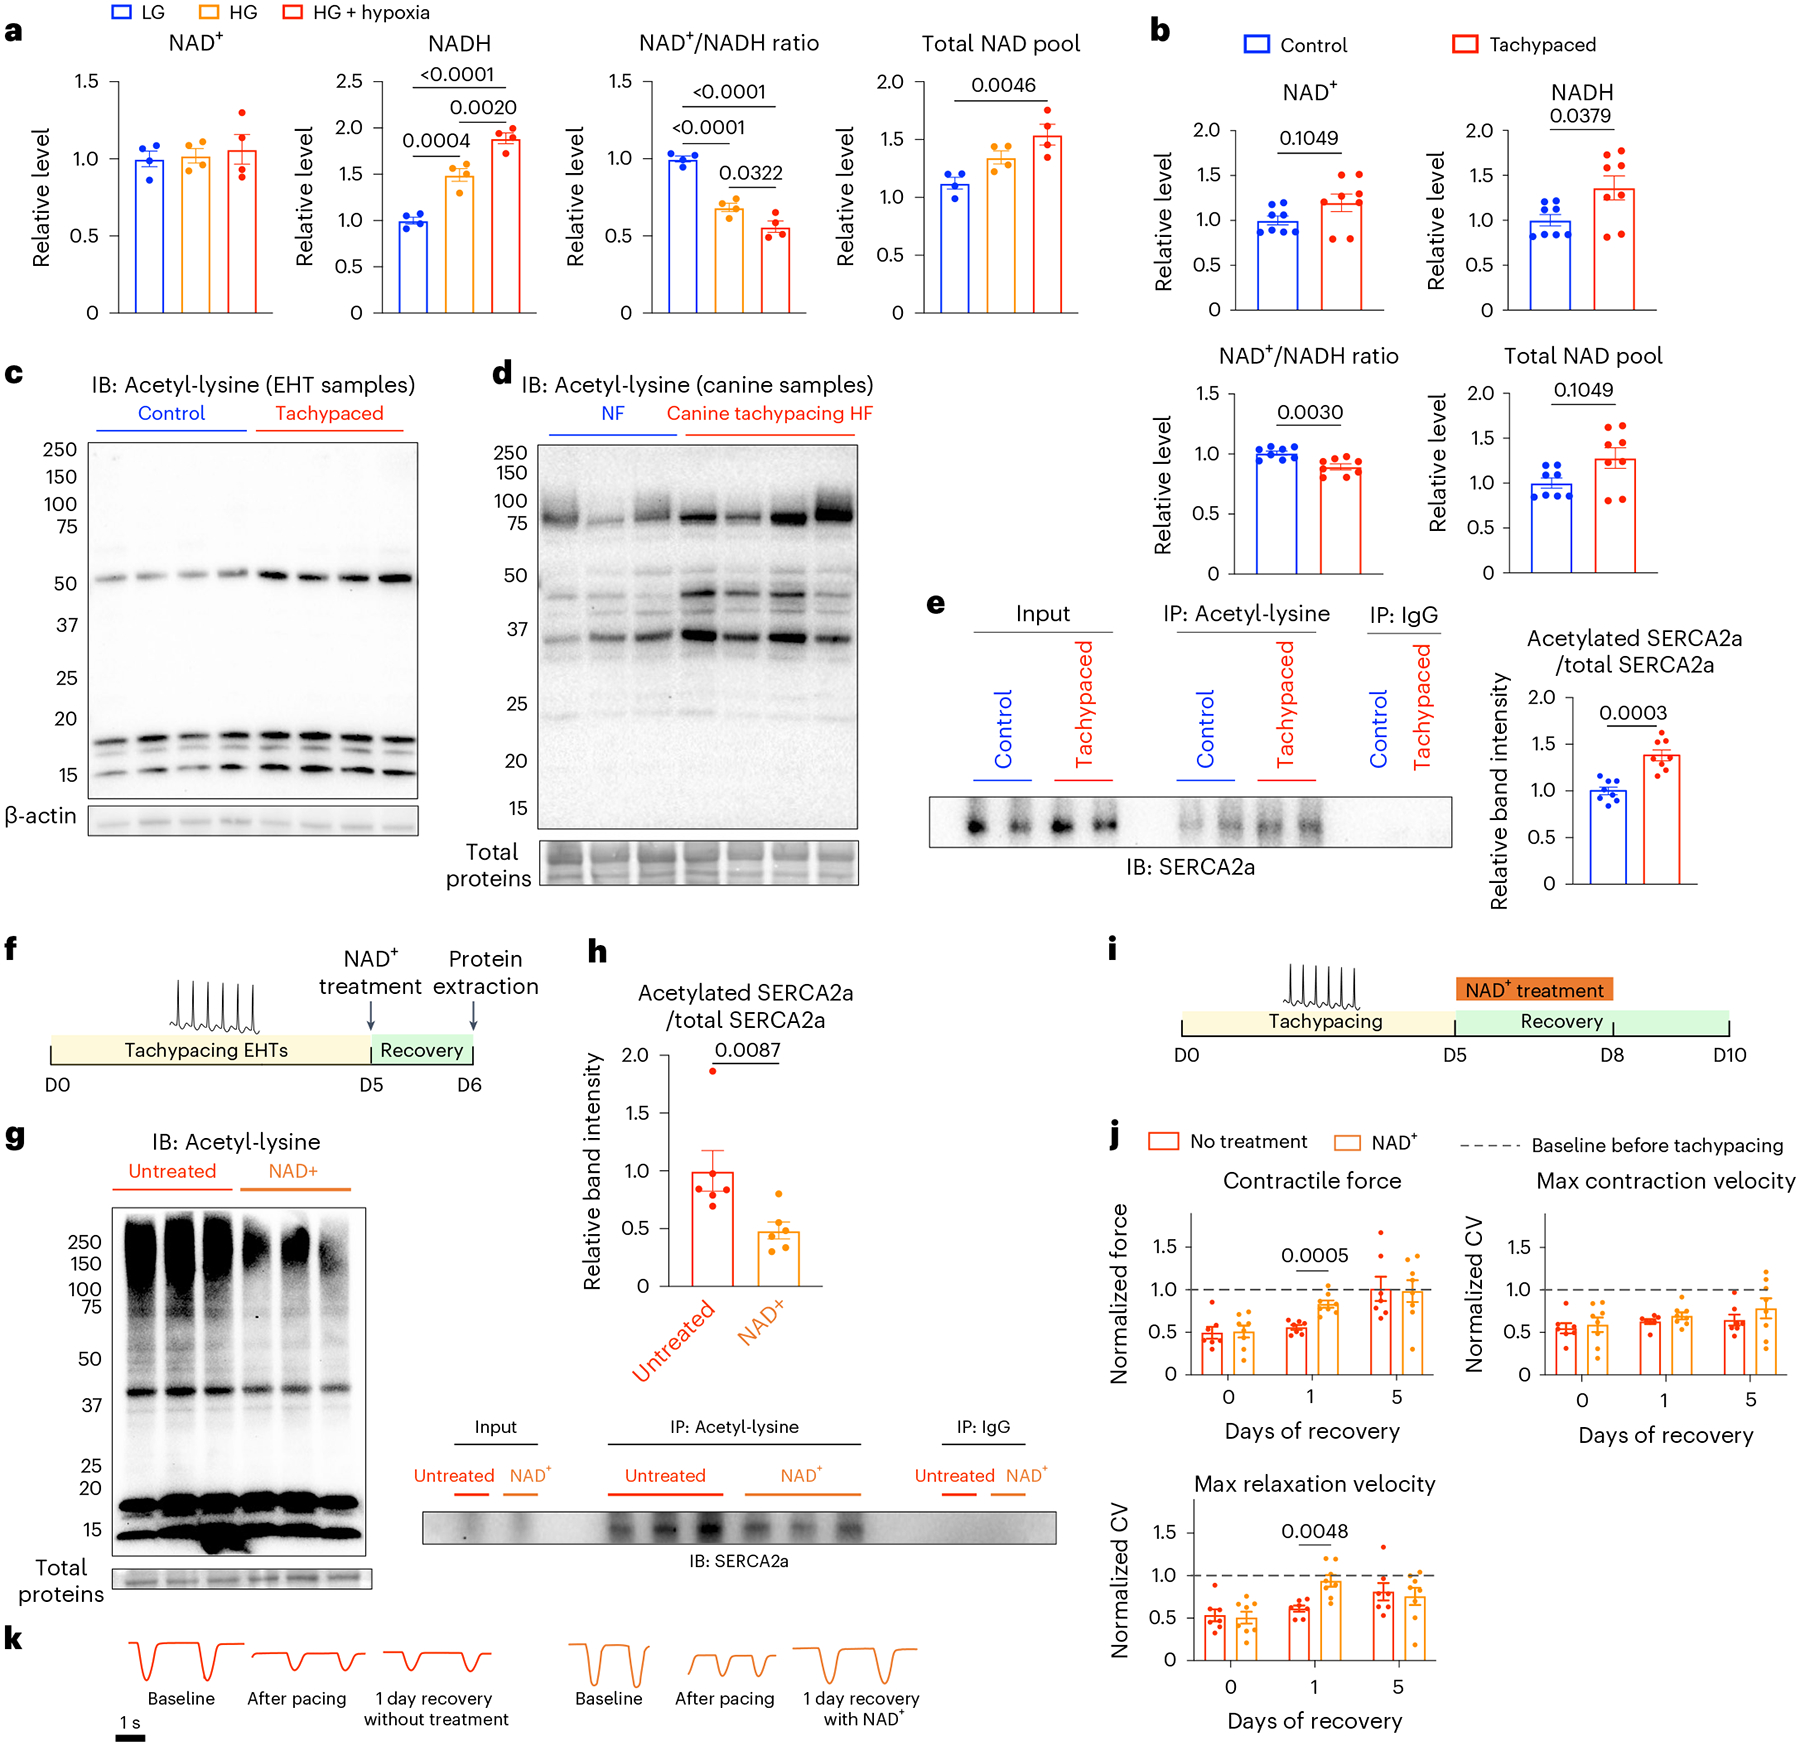
a, Measurement of NAD+ and NADH in iPSC–CMs (SCVI-273) subjected to low glucose (2.5 mM glucose), high glucose (25 mM glucose, HG) or HG with hypoxia (<1% O2) for 24 h. Data were normalized against the LG group. n = 4 wells of cells for each condition. One-way ANOVA with Tukey’s multiple comparisons test. b, Measurement of NAD+ and NADH in unpaced control or tachypaced EHTs (SCVI-273). Data were normalized against the unpaced EHTs. n = 8 EHTs for each group. Two-tailed Mann–Whitney test. c, Immunoblot (IB) analysis of total proteins from unpaced control or tachypaced EHTs for lysine acetylation. n = 4 samples for each group with each sample pooled from two EHTs (SCVI-273). d, Immunoblot analysis of total proteins from dogs with tachypacing-induced HF or dogs without HF (NF) for lysine acetylation. n = 3 NF dogs and n = 4 HF dogs. e, EHTs (SCVI-273 and SCVI-15) unpaced or tachypaced for 5 days were lysed for protein extraction and IP for acetylated lysine, and the IP samples were blotted for SERCA2a. Acetylated SERCA2a was quantified and normalized against the total SERCA2a detected in the input samples. n = 8 samples for each group and each sample was pooled from two EHTs. Two-tailed Mann–Whitney test. f, EHTs (SCVI-273 and SCVI-15) were tachypaced for 5 days at 3 Hz, allowed to recover for 24 h with or without 1 mM NAD+ followed by protein extraction. g, Immunoblot analysis of global lysine acetylation from tachypaced EHTs with or without NAD+ treatment. n = 3 samples for each group with each sample pooled from two EHTs. h, Tachypaced EHTs with or without NAD+ treatment were lysed for protein extraction, followed by IP for acetylated lysine, and the IP samples were blotted for SERCA2a. Acetylated SERCA2a was quantified and normalized against the total SERCA2a detected in the input samples. n = 6 samples for each group and each sample was pooled from two EHTs. Two-tailed Mann–Whitney test. i, EHTs (SCVI-273) were tachypaced for 5 days at 3 Hz, then allowed to recover with or without 1 mM NAD+, followed by contractility measurement. j, Quantification of contractile force, maximum contraction velocity and relaxation velocity in NAD+-treated or untreated EHTs on day 0, day 1 and day 5 of recovery. Data were normalized against the baseline values before pacing. n = 7 untreated EHTs and n = 8 NAD+-treated EHTs. Two-way ANOVA with Bonferroni’s multiple comparisons test. k, Representative motion traces of EHTs at baseline, after tachypacing and 1 day after recovery with or without NAD+. Data are displayed as mean ± s.e.m.
The next key question is whether changes in NAD redox play a causal role in contractile dysfunction. A major cellular function of NAD+ is to serve as the coenzyme for sirtuins, a family of NAD+-dependent protein deacetylases. Recently, there has been a growing recognition that increased protein acetylation is a key mediator in the pathogenesis of HF, and targeting NAD+–sirtuin signalling showed promising results in treating HF in mouse models31,57. In particular, a recent study found that acetylation of SERCA2a inhibited cardiac contractility in mice58. Given that tachypacing reduced the NAD+/NADH ratio, we speculated that it might increase protein acetylation in cardiac cells. First, we examined the global protein acetylation level in tachypaced and unpaced EHTs. We found tachypacing led to increased protein acetylation (Fig. 8c). We then analysed protein samples from canine myocardium of tachypacing-induced HF and observed a similar increase in global protein acetylation (Fig. 8d). Subsequently, using immunoprecipitation (IP), we quantified the ratio of acetylated SERCA2a over total SERCA2a, which showed a ~40% increase in SERCA2a acetylation by tachypacing (Fig. 8e).
If the imbalance of NAD homeostasis and increased protein acetylation play a causal role in tachycardia-induced contractile dysfunction, supplementation of NAD+ would expedite cardiac function recovery. To test this hypothesis, EHTs were tachypaced at 3 Hz for 5 days and then treated with either 1 mM NAD+ or the vehicle control for 24 h (Fig. 8f). NAD+ treatment resulted in increased total NAD pool and an increased NAD+/NADH ratio (Supplementary Fig. 8). By western blot analysis, NAD+ supplementation reduced global protein acetylation (Fig. 8g). Furthermore, IP experiments revealed that NAD+ supplementation reduced SERCA2a acetylation by about 50% (Fig. 8h). Next, we evaluated the functional recovery of EHTs with or without NAD+ after tachypacing (Fig. 8i). After 5 days of tachypacing, EHTs had a ~50% reduction in contractile force, maximum contraction velocity and relaxation velocity. In the presence of 1 mM NAD+, EHT contractile force recovered to 83% of the baseline in 1 day, whereas the untreated group showed minimal improvement (Fig. 8j,k). Similarly, maximum relaxation velocity recovered to 91% with NAD+ treatment compared with 61% in the untreated EHTs. In addition to boosting functional recovery, NAD+ also reduced the abundance of glycolysis metabolites such as glucose-6-phosphate and pyruvate (Extended Data Fig. 9). Collectively, our data indicate that the disruption of NAD homeostasis is a critical driver underlying tachycardia-induced contractile dysfunction. While changes in NAD homeostasis in cardiomyocytes may have a plethora of effects on cellular signalling and physiology59, our results suggest increased protein acetylation is probably a key molecular culprit underlying the impairment of contractility. Moreover, acetylation of SERCA2a may be responsible for overriding the positive inotropy of the PKA signalling.
Discussion
Increased heart rate is broadly implicated in various aetiologies of heart disease3. Tachycardia, an extreme form of heart rate elevation, is well known to impair cardiac contractility. Unlike most cardiomyopathies, TIC is partially or fully reversible on the functional level. So far, the molecular mechanism underlying this reversible contractile dysfunction remains elusive. Large animals (for example, dogs) are most suitable for the study of TIC due to their similarity with humans in cardiac physiology, including the resting heart rate. Yet tachypacing in large animals is a low-throughput process due to its high cost, ethical concerns and technical complexity. To address this issue, we developed an in vitro tachycardia model using 3D EHTs derived from human iPSCs. Admittedly, there are important limitations to the EHTs as a model to study cardiac pathophysiology. First, EHTs lack functional vasculatures for metabolites and nutrient exchange. Second, EHTs lack the architectural and electrophysiological complexity of the heart. In particular, the absence of structurally independent atrial tissue in EHTs poses a challenge to fully recapitulate the pathology of TIC driven by atrial fibrillation, a prevalent cause of TIC7. Lastly, the cellular diversity of the EHTs is much lower than that of the human heart. Nevertheless, the EHT model allows us to interrogate the effect of tachycardia on human cardiac tissue with minimal confounding factors and serves as a powerful technology for testing therapeutics60.
To model TIC, we reason that the maturity of the EHT is critical. There is an inconsistency in the literature regarding the effect of tachypacing on iPSC–CMs or EHTs. In particular, tachypacing has been reported to improve maturation in some studies61–63 yet induce cardiac damage or adverse remodelling in other studies60,64,65. This discrepancy may partially stem from the timing of pacing. It was shown that tachypacing promotes maturation in early stage EHTs (~12 days) but not in late-stage EHTs (~28 days)61, which also aligns with the fact that the foetal heart can tolerate a much faster heart rate than the adult heart. Therefore, maturation of the EHT is probably a prerequisite for modelling TIC in vitro. We applied Dex, T3 and fatty acid supplementation coupled with long-term culture to promote cardiac maturation (Extended Data Fig. 2). We were able to recapitulate the key phenotype of TIC using these matured EHTs. We demonstrated that tachypacing of human EHTs induced reversible impairment of contractile function (Fig. 4 and Supplementary Fig. 9), the hallmark of TIC. Tachypacing induced a metabolic transition towards glycolysis in the EHTs, which is consistent with both our canine samples and with prior canine tachypacing studies27,66. Furthermore, tachypaced EHTs, similar to tachypaced canine hearts27, had a depressed response to dobutamine stimulation (Fig. 6i–k). Lastly, tachypacing of EHTs selectively activated the PKA signalling pathway but not the CAMKII pathway, a phenomenon previously reported in acutely tachypaced human myocardium46. Collectively, these data validated the utility of EHTs in modelling TIC.
Leveraging this EHT tachycardia model, we uncovered the missing link between metabolic reprogramming and contractile dysfunction in TIC. In particular, while increased glycolysis has been previously documented in canine tachypacing-induced HF27 as well as HF in patients67, it was unknown whether this metabolic shift plays a causal role in the depression of cardiac contractility. Here, we show tachycardia reduces oxygen availability in the cardiac tissue, promoting a metabolic shift towards anaerobic glycolysis. This leads to the disruption of NAD redox balance and increases global protein acetylation, which was observed in both the EHTs and the canine samples. Specifically, the level of SERCA2a acetylation was increased by tachypacing. Acetylation of SERCA2a was recently shown to reduce cardiac contractility in HF by inhibiting its calcium uptake activity58. NAD+ supplementation reduced SERCA2a acetylation and improved cardiac contractility after tachypacing. Taken together, these data suggest that increased acetylation of proteins such as SERCA2a plays a causal role in the suppression of cardiac contractility.
While TIC is clinically considered as reversible cardiomyopathy, our data, along with accumulating evidence from other studies, raise concerns for persistent damage with long-term implications. First, transcriptomic analysis of tachypaced EHTs after functional recovery showed an upregulation of extracellular matrix genes, implying the activation of structural remodelling (Extended Data Fig. 10). These data agree with a recent report that found increased myocardial fibrosis in patients with TIC12. Second, dogs that recovered from tachypacing-induced HF showed reduced metabolic flexibility and depressed adrenergic response27. Furthermore, when extending the pacing duration to >30 days, irreversible damages to the EHTs were observed (Supplementary Fig. 10). Lastly, we observed increased global protein acetylation in the EHTs after 5 days of tachypacing. This observation is surprising because this molecular phenotype has been exclusively reported in models of advanced HF. As a future direction, it may be interesting to perform in-depth profiling of the acetylome for different subcellular compartments (such as mitochondria versus the cytosol) at different stages of TIC, and compare the results with other types of cardiomyopathies. This may reveal additional therapeutic targets, in addition to SERCA2a, that are not only applicable to pure TIC but to a broad spectrum of heart disease where tachycardia is implicated.
Methods
Human iPSC culture
Human iPSC cell lines: SCVI-273 (female), SCVI-15 (male) and SCVI-591 (female) were generated by the Stanford Cardiovascular Institute Biobank. All iPSCs were cultured in Essential 8 (E8) medium (Thermo Fisher Scientific) at 37 °C in a humidified incubator with 5% CO2 and 20% O2. Cells were passaged every 4–5 days using 0.5 mM ethylenediaminetetraacetic acid (Thermo Fisher Scientific). Cell lines were used between passages 20 and 40. All cell cultures were routinely tested for potential mycoplasma contamination using the MycoAlert Plus Kit (Lonza).
Cardiac differentiation
Human iPSCs at >90% confluency were used for cardiac differentiation. The basal differentiation medium was Roswell Park Memorial Institute (RPMI) 1640 (Thermo Fisher Scientific) supplemented with B-27 minus insulin (Thermo Fisher Scientific). This differentiation medium was used for the entire cardiac differentiation process unless otherwise specified. On day 0, E8 medium was changed to the differentiation medium supplemented with 6 μM of CHIR99021 (LC Laboratories). On day 2, the culture medium was replaced to remove CHIR99021. Between day 3 and day 5, cells were treated with 5 μM of IWR-1 (Selleck Chemicals). On day 5, the culture medium was replaced with a fresh differentiation medium. After day 7, the differentiated cells were maintained in RPMI 1640 supplemented with B-27 with insulin. The culture medium was changed every 2–3 days. To purify the iPSC–CMs, cells were cultured in glucose-free RPMI 1640 medium supplemented with B-27 with insulin for 2–4 days. iPSC–CMs generated using this protocol have been extensively characterized in our previous publications68,69.
Generation of human EHTs
EHTs were generated using a previously published protocol with minor modifications70. Briefly, on day 12–18 of cardiac differentiation, 2 × 10⁶ iPSC–CMs were suspended in 100 μl low-glucose Dulbecco’s modified Eagle medium (Thermo Fischer Scientific) containing 5 mg ml−1 bovine fibrinogen (Sigma-Aldrich), 10%(vol/vol) Matrigel (Corning), 10% (vol/vol) foetal bovine serum (Gibco), 1% (vol/vol) penicillin–streptomycin (Thermo Fischer Scientific) and 3 U ml−1 thrombin (Sigma-Aldrich). The mixture was injected into a pre-made mould made of 2% agarose, forming a 3D construct around two silicone posts (EHT Technologies). After 1.5 h of incubation at 37 °C, EHTs were transferred into 24-well plates for long-term culture. EHTs were maintained in 50% EGM-2 medium (Lonza) and 50% RPMI 1640 with B-27 with insulin. During days 20–26, culture medium was supplemented with 10 nM T3 (Sigma-Aldrich), 1 μM dexamethasone (Sigma-Aldrich), 30 μM oleic acid–bovine serum albumin conjugates (Sigma-Aldrich) and 80 μM palmitic acid–bovine serum albumin conjugates (Sigma-Aldrich) to promote metabolic and functional maturation. EHTs were further cultured for 40–50 days to be ready for experiments.
Measurement of EHT contractility
Bright-field videos of beating EHTs were taken using the SI8000 Cell Motion Imaging System (Sony). Each video was recorded for 8 s at the frame rate of 150 frames per second and a resolution of 1,024 × 1,024 pixels using a 10× objective on a fully automated microscope (Eclipse Ti, Nikon). During recording, EHTs were kept in a humidified chamber at 37 °C supplied with 5% CO2. No electrical pacing was applied during the recording unless otherwise specified. Each video tracks the deflection of the silicone posts in response to the contraction of the EHT. SI8000 analyser software was used to extract the trajectory data from the videos, then analysed using Tracker, an open-source software. Maximum contraction velocity, maximum relaxation velocity, contractile force and beating rate were calculated.
Calcium imaging
Human iPSC–CMs were seeded on Matrigel-coated glass coverslips, which were transferred to a customized chamber designed for the electrical pacing of two-dimensional monolayers of cells. After 5 days of tachypacing at 3 Hz, cells were loaded with 5 μM of Fluo-4 AM dye (Thermo Fisher Scientific) in Tyrode’s solution for 30 min at 37 °C. After washing three times with Tyrode’s solution, cells were imaged using a confocal microscope (LSM 710, Carl Zeiss). Calcium transients were captured with the line-scanning mode (512 pixels × 1,920 lines) at the speed of 8 ms per line. During imaging, cells were electrically paced at 1 Hz (cell line 1) or 0.5 Hz (cell line 2) depending on their spontaneous beating rate. In addition, environmental control was employed to keep the cells at 37 °C with 5% CO2. Fiji ImageJ was used to analyse the images. Background signal from extracellular regions was subtracted.
RNA-seq and analysis
Total RNA was extracted using the miRNeasy Mini Kit (Qiagen). Libraries were generated using the NEBNext Ultra RNA Library Prep Kit for Illumina (New England Biolabs) and sequenced on a Hiseq 4000 platform (Novogene). Quality was examined by analysing per-base sequence quality plots using FastQC. Sequence reads were trimmed by TrimGalore and aligned to the human genome (hg38) using STAR71. Reads with overlapping exon coordinates were counted using RSEM72 and featurecounts73. Raw read counts were transformed using the variance stabilizing transformation function in DESeq2 (ref. 74). DEGs between different groups were identified using DESeq2. The biological processes and pathways of the DEGs were predicted using the GO annotation and Kyoto Encyclopedia of Genes and Genomes (KEGG).
Hypoxia imaging
EHTs were incubated with 5 μM of Image-iT Green Hypoxia Reagent in the culture medium for 1 h at 37 °C. The dye-containing medium was then replaced with fresh medium. EHTs were then tachypaced at 3 Hz or unpaced for 3 h. Subsequently, EHTs were removed from the silicone racks and rinsed with Dulbecco’s phosphate-buffered saline before being transferred onto glass-bottom dishes. Imaging was performed on a Leica DMi8 fluorescence microscope using a 10× objective. Images were analysed in Fiji ImageJ. Regions of interest were randomly drawn, and the fluorescence intensity was quantified.
Canine tachypacing-induced HF
Male, 1–2 year-old mongrel dogs weighing 22–25 kg were chronically instrumented as described before75. Briefly, telazol (6 mg kg−1 intravenous) and glycopyrrolate (0.01 mg kg−1) were used to induce anaesthesia, and 1.5–2% isoflurane was administered to maintain anaesthesia along with 40% oxygen/60% air ventilation. A thoracotomy was performed in the left fifth intercostal space, a catheter was inserted into the descending thoracic aorta and a solid-state pressure gauge (E-430001-IMP-10, Stellar Implantable Transmitter) was placed in the left ventricle across the apex. A Doppler flow transducer (20 MHz pulsed Doppler velocimeter) was positioned around the left circumflex coronary artery, and two pacing leads were attached to the LV free wall. Catheters and wires were placed subcutaneously in the inter-scapular area, and the chest cavity was closed in layers to minimize pneumothorax. Following the surgery, dogs were given antibiotics and allowed to recover fully. Ten days after the surgery, the dogs were trained to lie on the laboratory table. To induce HF, dogs were subjected to LV pacing using an external pacemaker at 210 bpm for the first 3 weeks. Subsequently, the pacing rate was increased to 240 bpm for an additional week. This pacing protocol is well known to cause DCM and compensated HF during the first 3 weeks, which will culminate in severe decompensated HF between day 27 and day 30. All of the dogs were sacrificed on day 28 after the acquisition of in vivo data. Myocardial samples were frozen at −80 °C for future analysis. The protocol complies with the guiding principles for the care and use of laboratory animals published by the National Institutes of Health and was approved by the Institutional Animal Care and Use Committee of Temple University.
Human patient transcriptome data
Raw transcriptomic data from patients without HF or patients who have DCM with or without tachycardia were previously published and deposited at GSE116250 (ref. 32) and no additional ethical approval is required to use and analyse the data. Processing of the raw data was carried out as described above. Tachycardia-specific genes are defined as those significantly up- or downregulated in HF with tachycardia but not in those without tachycardia. These tachycardia-specific genes were analysed for pathway enrichment.
Statistical analysis
Data were analysed using Prism (GraphPad) and reported as mean ± s.e.m unless otherwise specified. Statistical comparisons were conducted via a one-way analysis of variance (ANOVA) with Tukey’s multiple comparison test for more than two groups and one variable, or a two-way ANOVA with Bonferroni’s multiple comparisons test for two variables. For two groups, the two-tailed Mann–Whitney test or the two-tailed Student’s t-test was performed to assess the significant differences. P < 0.05 was indicated as significant, and P > 0.05 was indicated as not significant.
Reporting summary
Further information on research design is available in the Nature Portfolio Reporting Summary linked to this article.
Extended Data
Extended Data Fig. 1 |. Clinical characteristics of the patient cohorts.
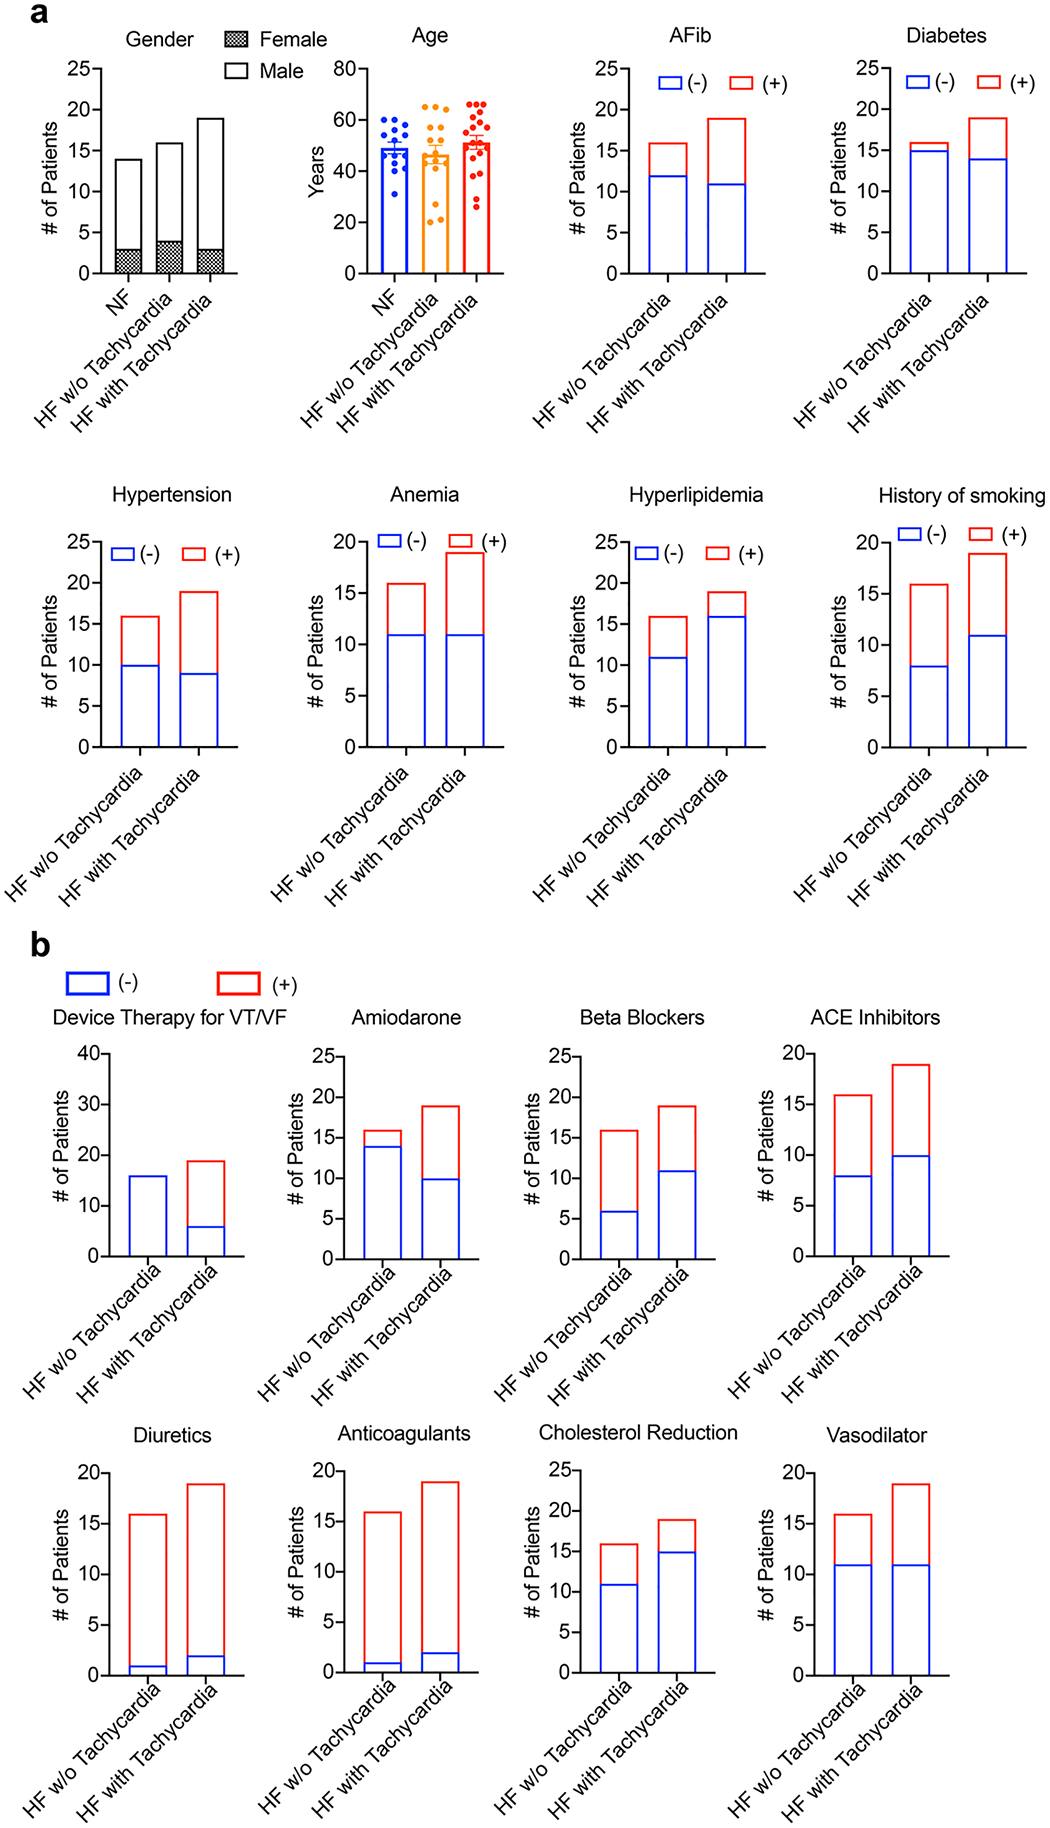
a, Gender, age, and common co-morbidities of the patients. n = 14 patients without heart failure, 16 patients with heart failure, and 19 patients with heart failure and tachycardia. The number of patients with or without a co-morbidity is indicated by red or blue boxes respectively. b, Summary of medical therapies used on the patients. The number of patients using or not using a therapy is indicated by red or blue boxes respectively.
Extended Data Fig. 2 |. Improved iPSC-CM maturation by hormone and fatty acid supplementation.
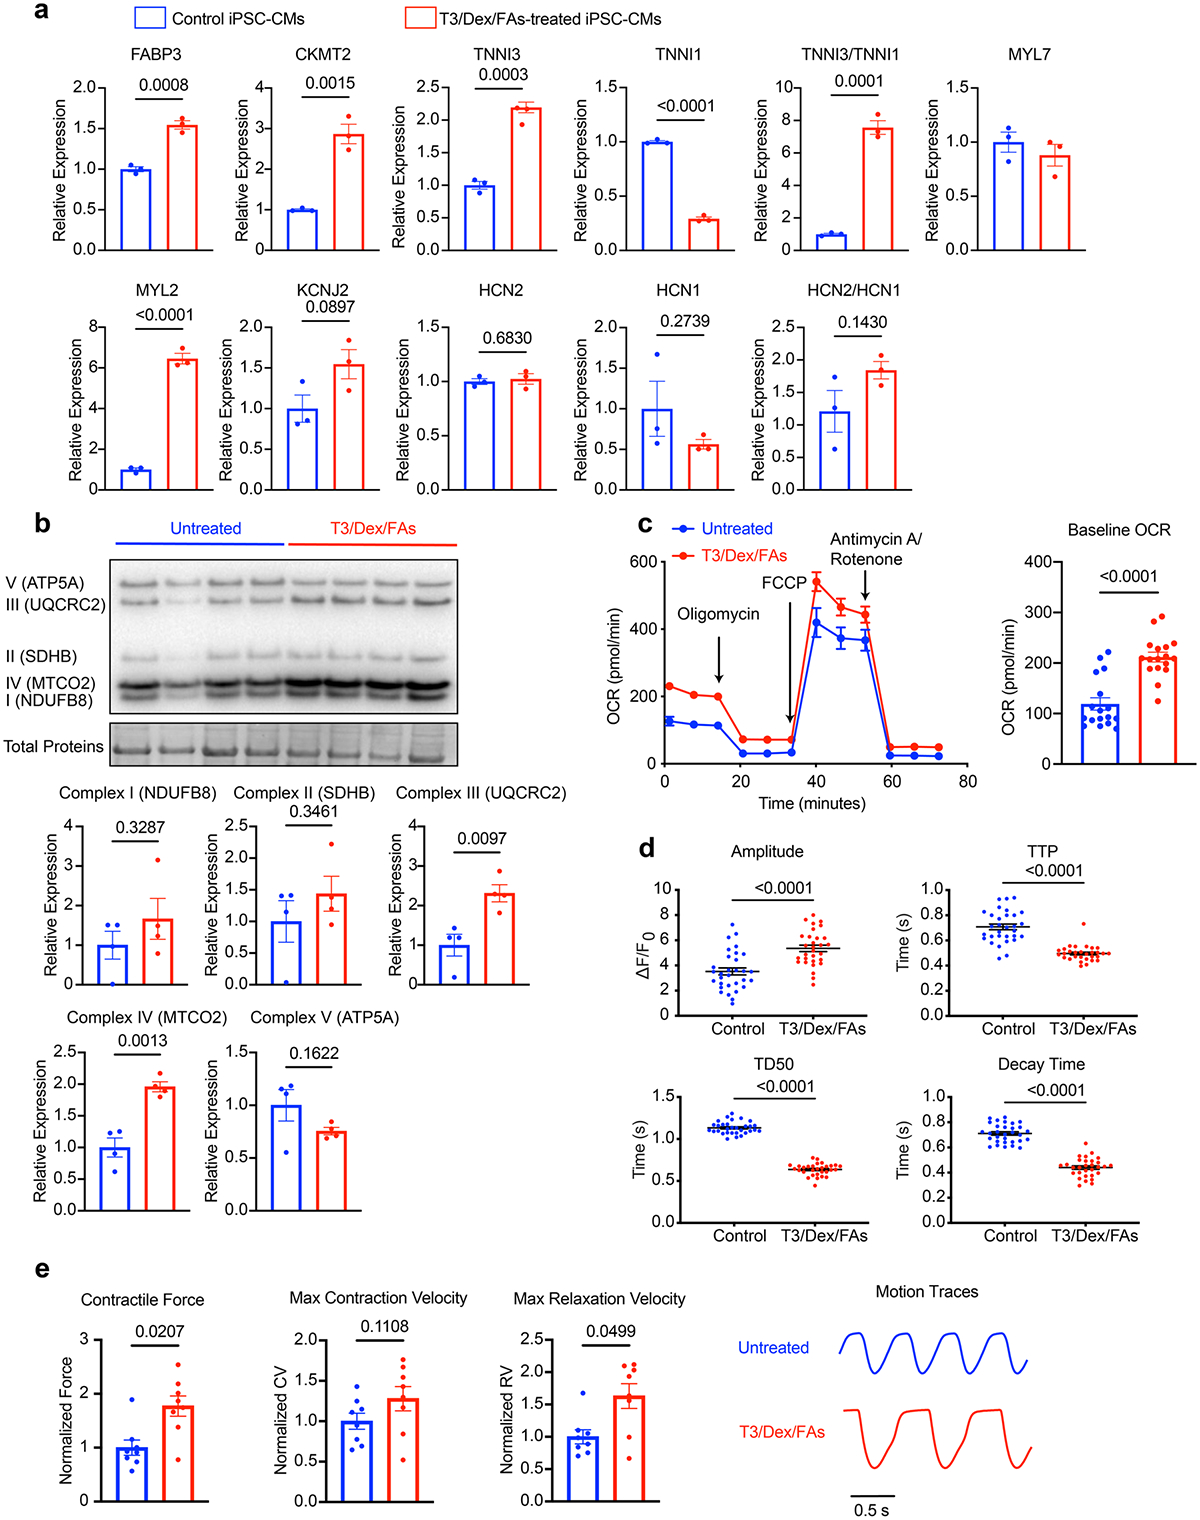
Treatment of human iPSC-CMs (SCVI-273) with a maturation media containing triiodothyronine (10 nM), dexamethasone (1 μM), oleic acid (30 μM), and palmitic acid (80 μM) for 6 days promoted the maturation of iPSC-CMs. a, qPCR analysis of maturation markers in iPSC-CMs with or without the maturation treatment. n = 3 technical replicates. Unpaired Student’s t-test. b, Western blot analysis of OXPHOS proteins in EHTs with or without the maturation treatment, including NDUFB8, SDHB, ubiquinol-cytochrome c reductase core protein 2 (UQCRC2), MTCO2, and ATP5A. n = 4 EHTs per group. Unpaired Student’s t-test. c, Measurement of oxygen consumption rate (OCR) of iPSC-CMs with or without the maturation treatment. n = 17 wells. 10,000 cells/well. Two-tailed Mann–Whitney test. d, Analysis of calcium handling using Fluo-4 dye in iPSC-CMs with or without the maturation treatment. n = 31 immature cells and n = 30 mature cells. Two-tailed Mann–Whitney test. e, Contractility analysis of EHTs with or without the maturation treatment. n = 8 EHTs per group. Two-tailed Mann–Whitney test. For a, b, and e, data were normalized against the untreated cells or EHTs. Data are displayed as mean ± s.e.m.
Extended Data Fig. 3 |. Pacing at a physiological rate does not induce contractile dysfunction in EHTs.
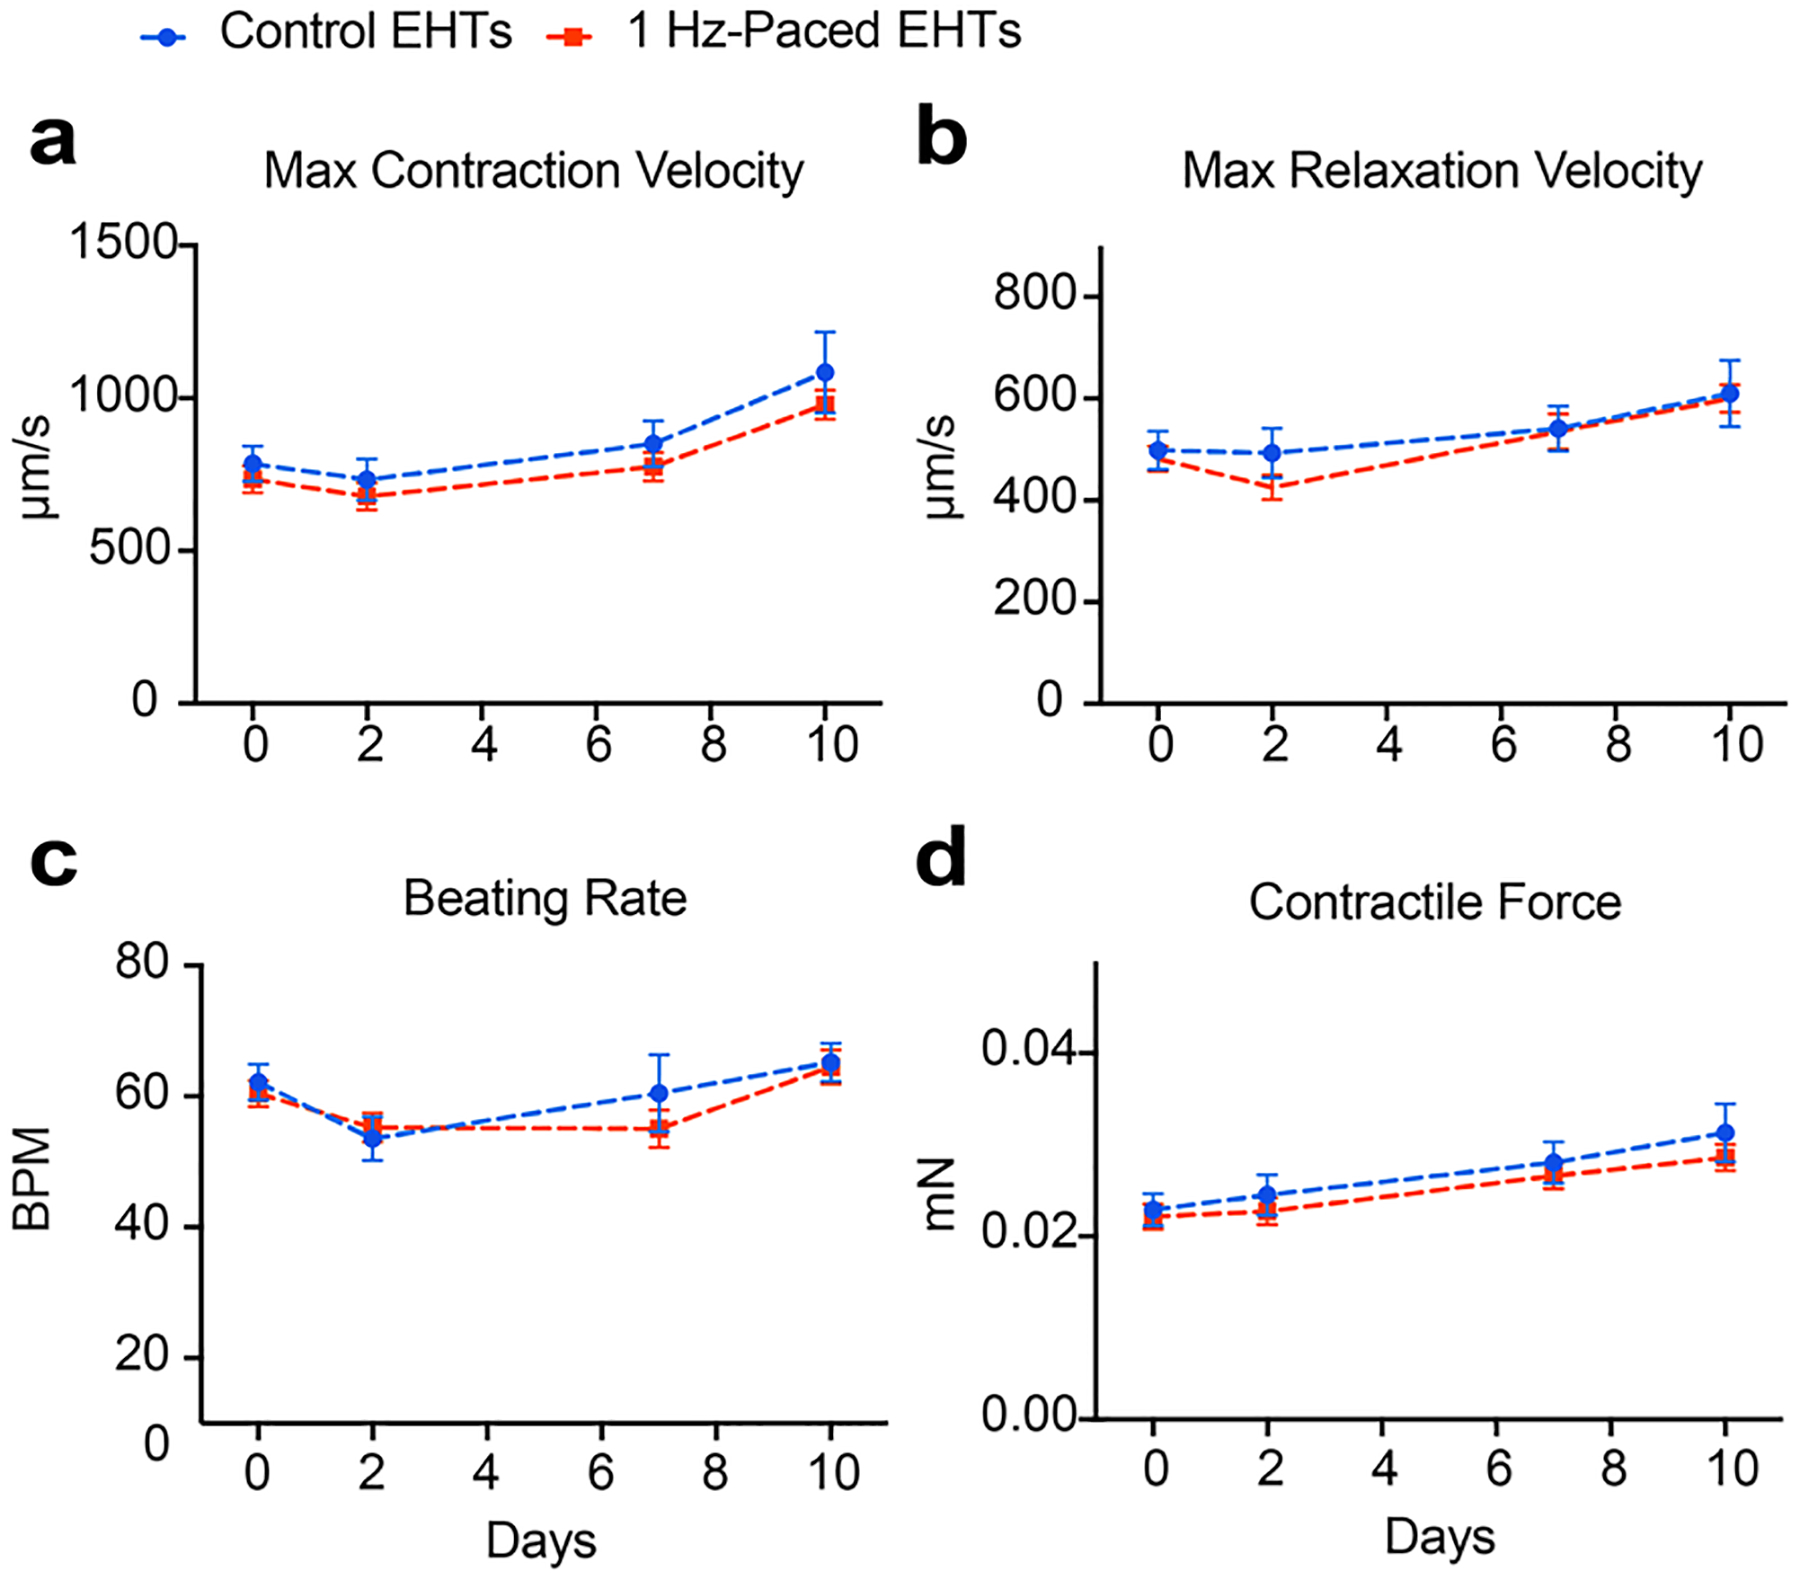
EHTs (SCVI-273) were tachypaced or unpaced for 10 days and contractility measurements were performed on days 0, 2, 7, and 10. Functional parameters generated from the analysis include maximum contraction velocity (a), maximum relaxation velocity (b), spontaneous beating rate (c), and contractile force (d). n = 16 for unpaced EHTs and n = 14 for paced EHTs. Two-way ANOVA with Bonferroni’s multiple comparisons test. Data are displayed as mean ± s.e.m.
Extended Data Fig. 4 |. Pharmacological suppression of the beating rate increase blunts the deterioration of EHT contractility.
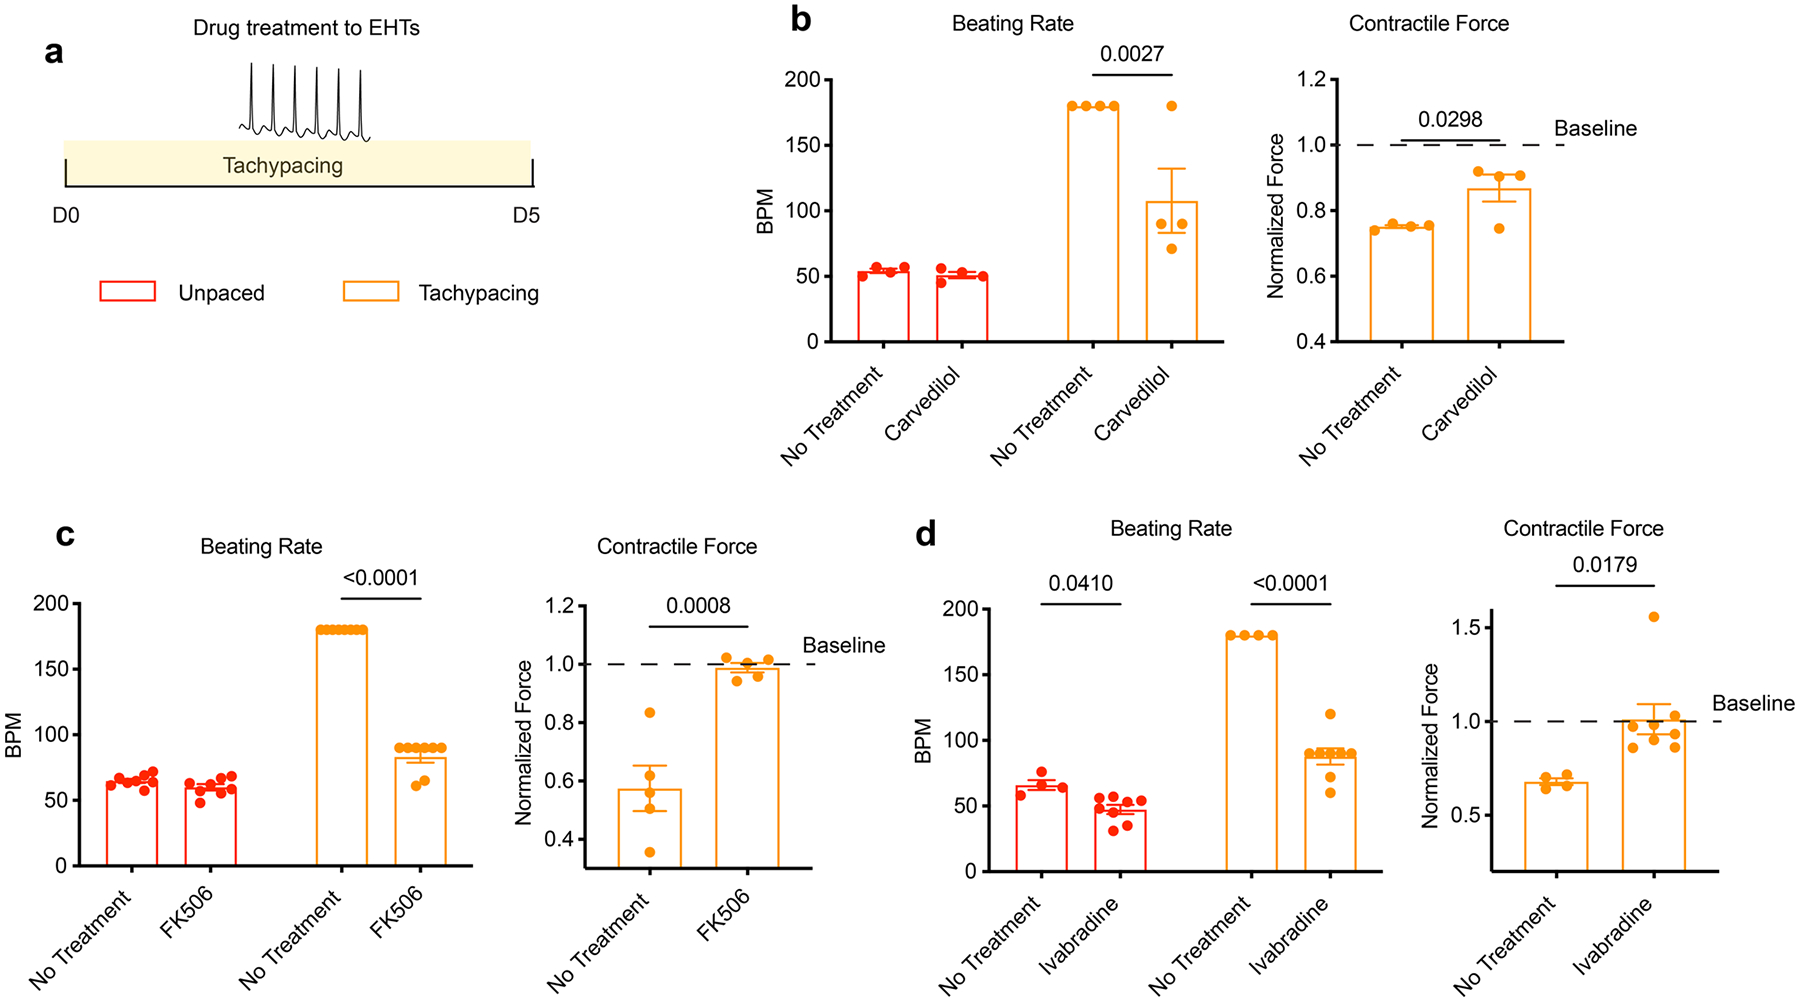
a, Experimental outline: EHTs (SCVI-273) were tachypaced for 5 days with or without drug treatment. Contractility was measured before and after tachypacing. b, Effect of carvedilol (250 ng/mL) on the beating rate (unpaced or paced) and the contractile force of tachypaced EHTs. n = 4 EHTs per group. c, Effect of FK506 (5 μM) on the beating rate (unpaced or paced) and the contractile force of tachypaced EHTs. n = 8 EHTs for the beating rate measurements and n = 5 EHTs for contractile force measurements. d, Effect of ivabradine (5 μM) on the beating rate (unpaced or paced) and the contractile force of tachypaced EHTs. n = 4 untreated EHTs and n = 8 ivabradine-treated EHTs. Unpaired Student’s t-test. Data are displayed as mean ± s.e.m.
Extended Data Fig. 5 |. Hypertrophic cardiomyopathy (HCM) EHTs have increased sensitivity to tachypacing-induced contractile dysfunction.
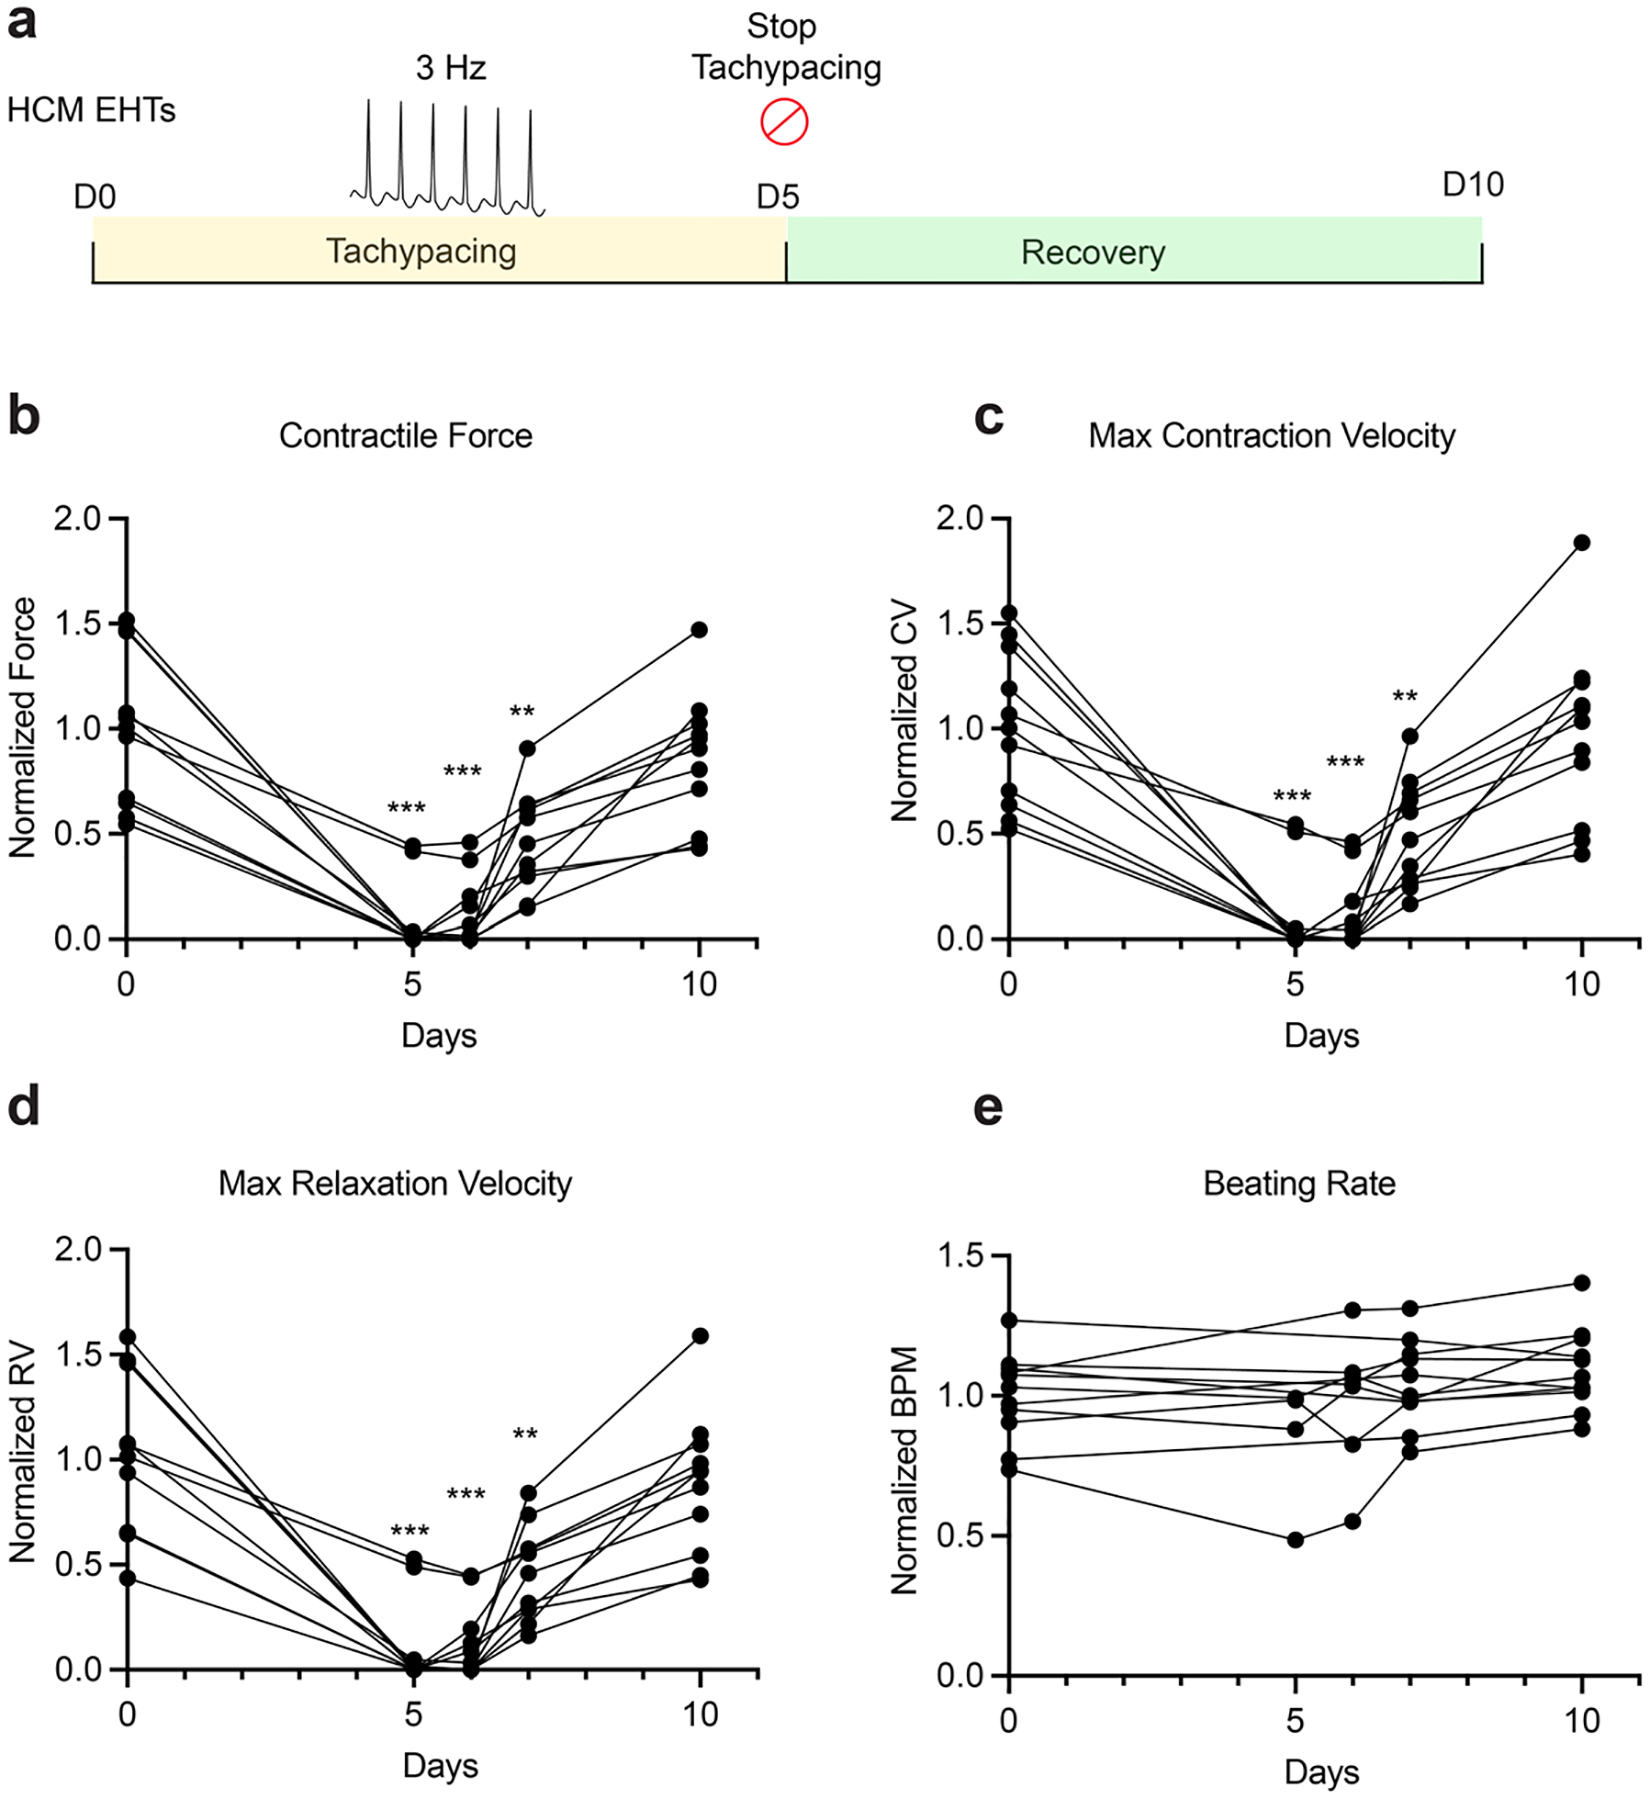
a, Experimental outline: HCM (MYBPC3 mutation) EHTs (SCVI-591) were tachypaced at 3 Hz for 5 days, then allowed to recover for 5 days. Contractile force (b), maximum contraction velocity (c), maximum relaxation velocity (d), and beating rate (e) were measured before tachypacing, 5 days after tachypacing, 1 day, 2 days, and 5 days after recovery. Data points of beating rates for EHTs that stopped beating were not shown. Data were normalized against the baseline values from day 0. n = 11 EHTs. One-way paired ANOVA with Tukey’s multiple comparison test. Only comparisons with day 0 are shown for statistical significance. *: P < 0.05; **: P < 0.01; ***: P < 0.001. Data are displayed as repeated measures of each EHT’s contractility over time.
Extended Data Fig. 6 |. Functional changes in the canine model of tachypacing-induced HF.
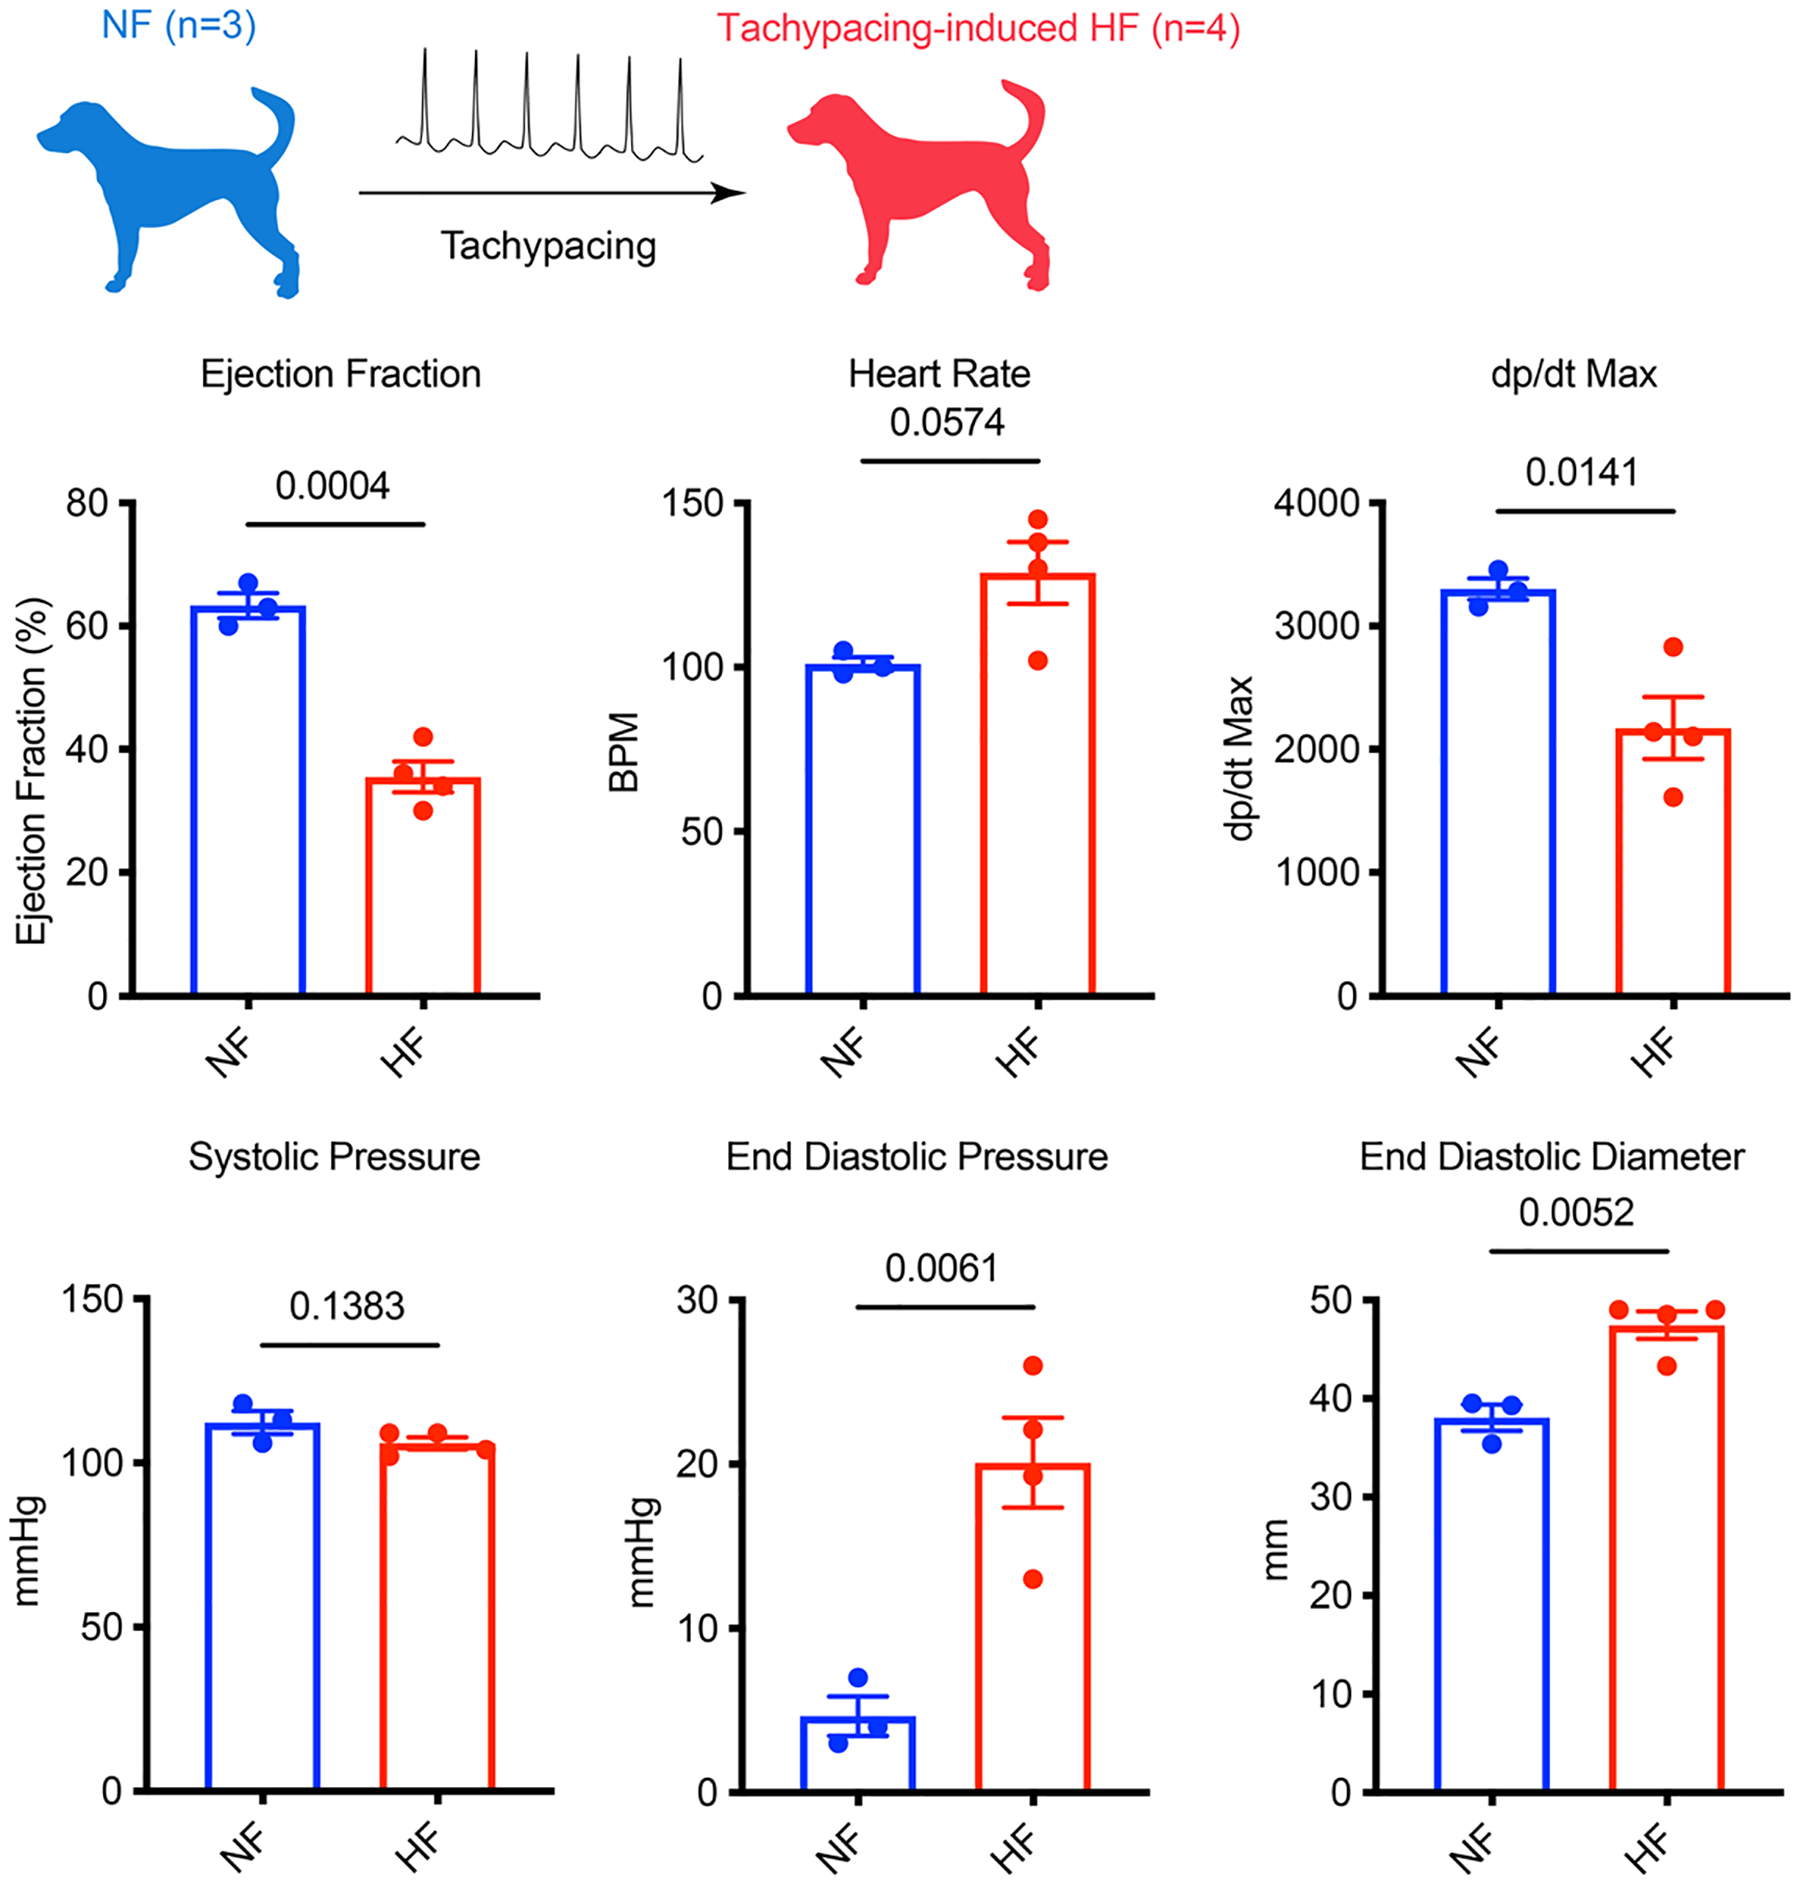
Functional parameters including: ejection fraction, heart rate, dp/dt max, systolic pressure, end-diastolic pressure and end-diastolic diameter were measured in healthy (NF) and tachypaced dogs (HF). n = 3 NF dogs and n = 4 HF dogs. Unpaired Student’s t-test. Data are displayed as mean ± s.e.m.
Extended Data Fig. 7 |. Reversible activation of glycolysis and hypoxia genes by tachypacing.
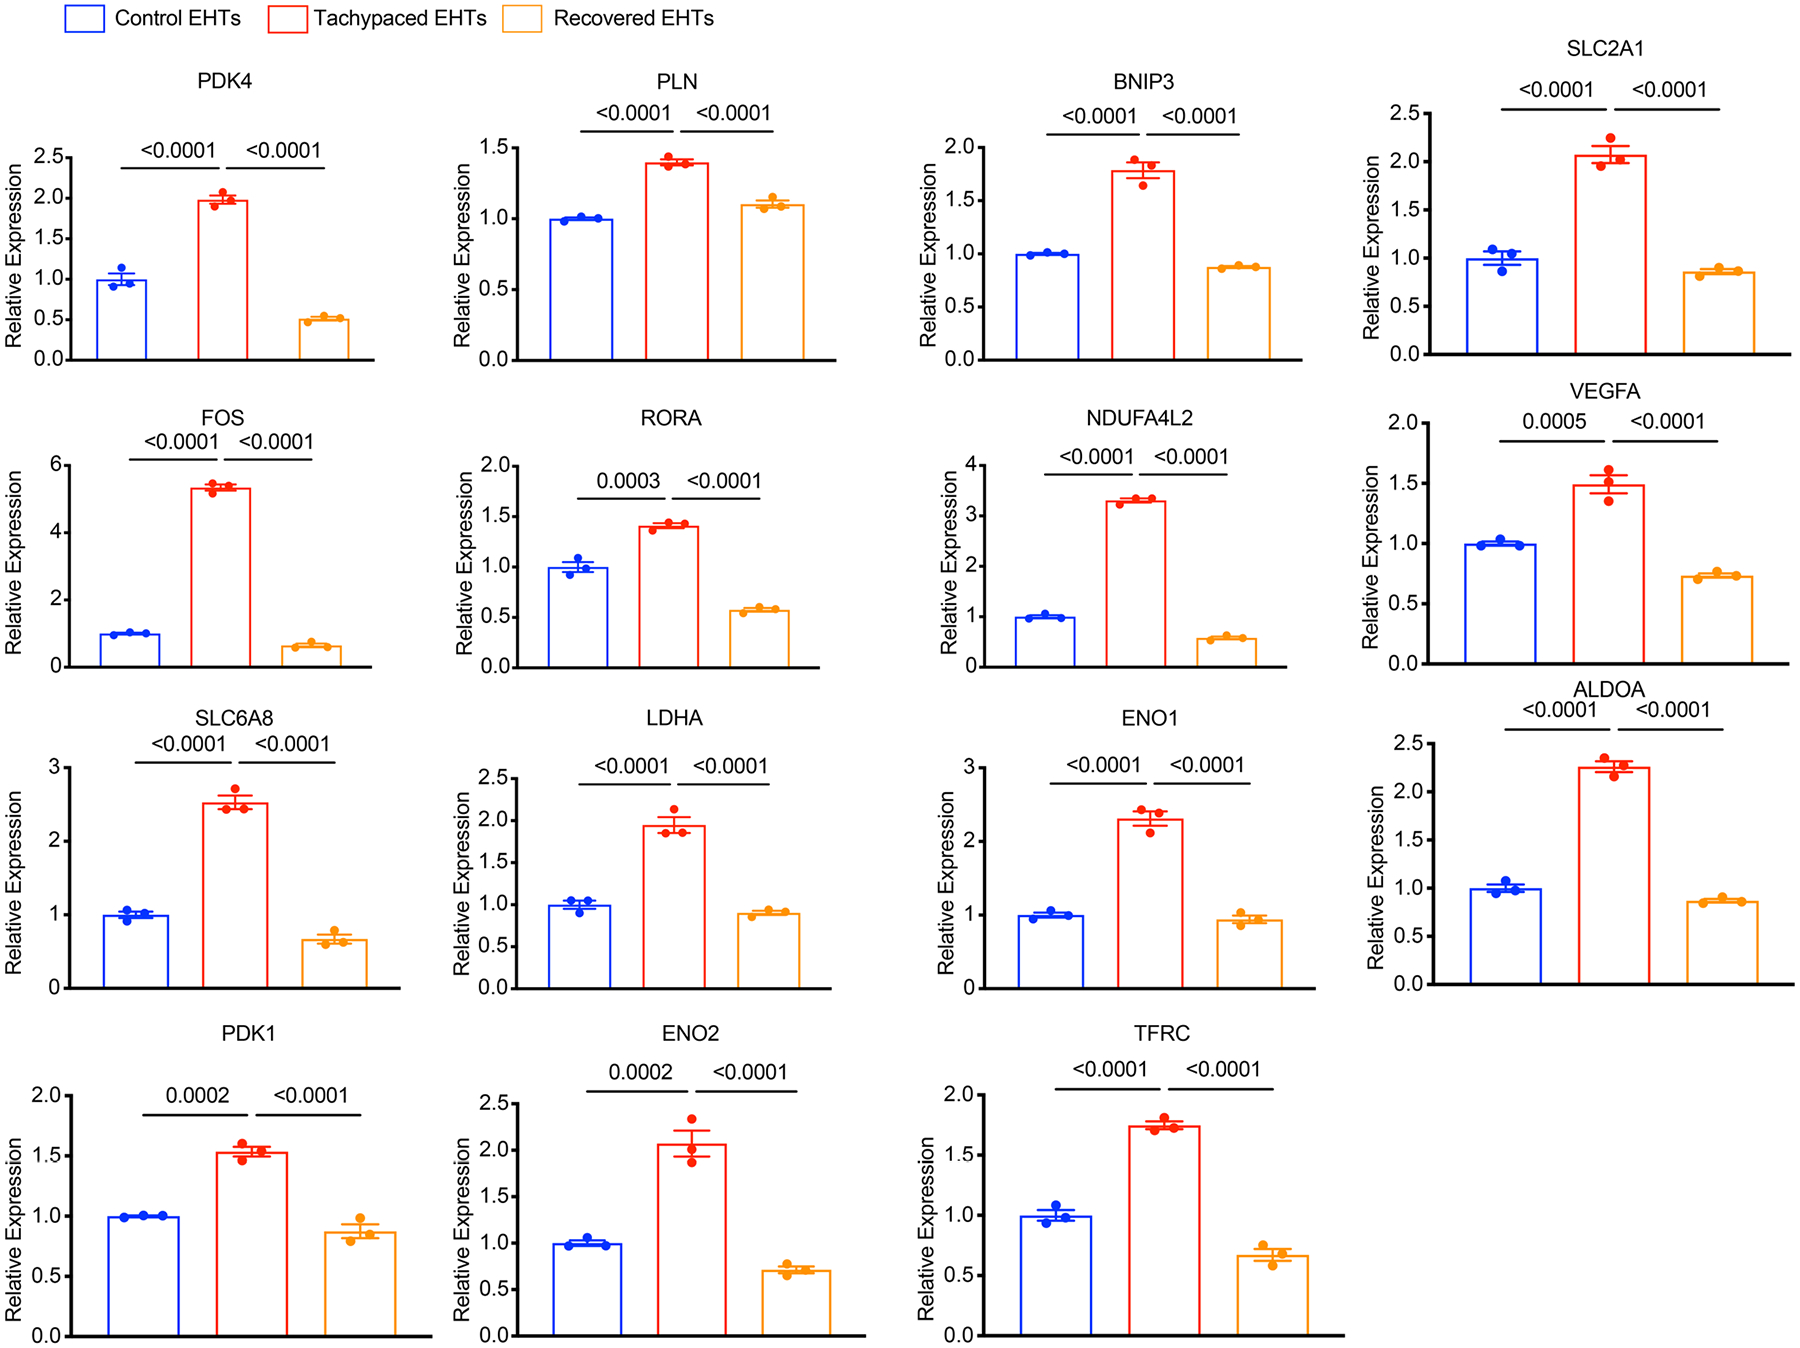
Tachypaced EHTs, unpaced control EHTs, and EHTs recovered from tachypacing were subjected to qPCR analysis for DEGs identified through RNA-Seq. Expression levels were normalized against the control EHTs. n = 3 technical replicates. One-way ANOVA with Bonferroni’s multiple comparisons test. EHTs were generated from line SCVI-273. Data are displayed as mean ± s.e.m.
Extended Data Fig. 8 |. Hypoxia downregulates oxidative phosphorylation genes.
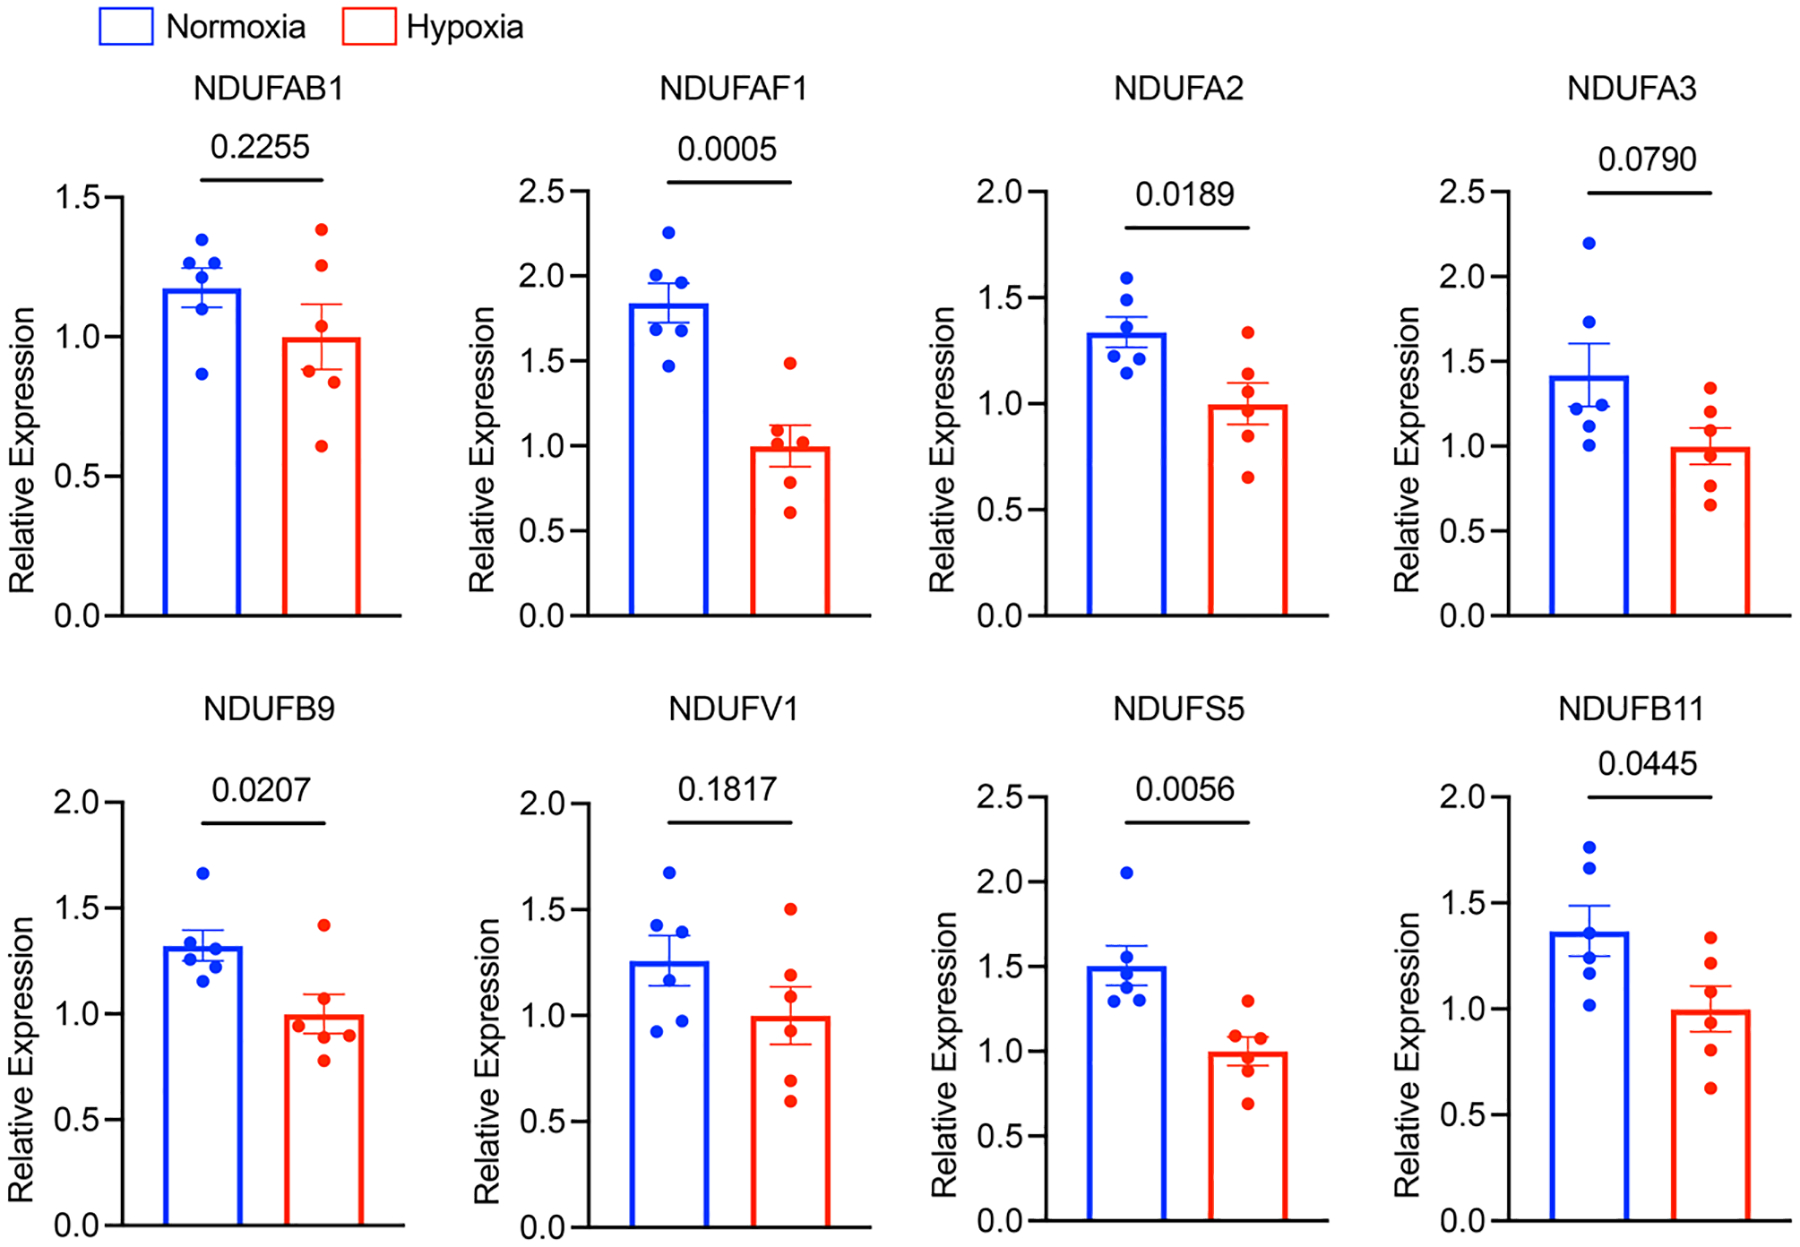
iPSC-CMs (SCVI-273) were exposed to hypoxia (<1% O2) for 24 hours. Expression of complex I genes was quantified with qPCR analysis, including NFUFAB1, NDUFAF1, NDUFA2, NDUFA3, NDUFB9, NDUFV1, NDUFS5 and NDUFB11. Expression levels were normalized against hypoxia-treated cells. n = 6 wells of cells. Unpaired Student’s t-test. Data are displayed as mean ± s.e.m.
Extended Data Fig. 9 |. Effect of NAD+ supplementation on glucose metabolites.
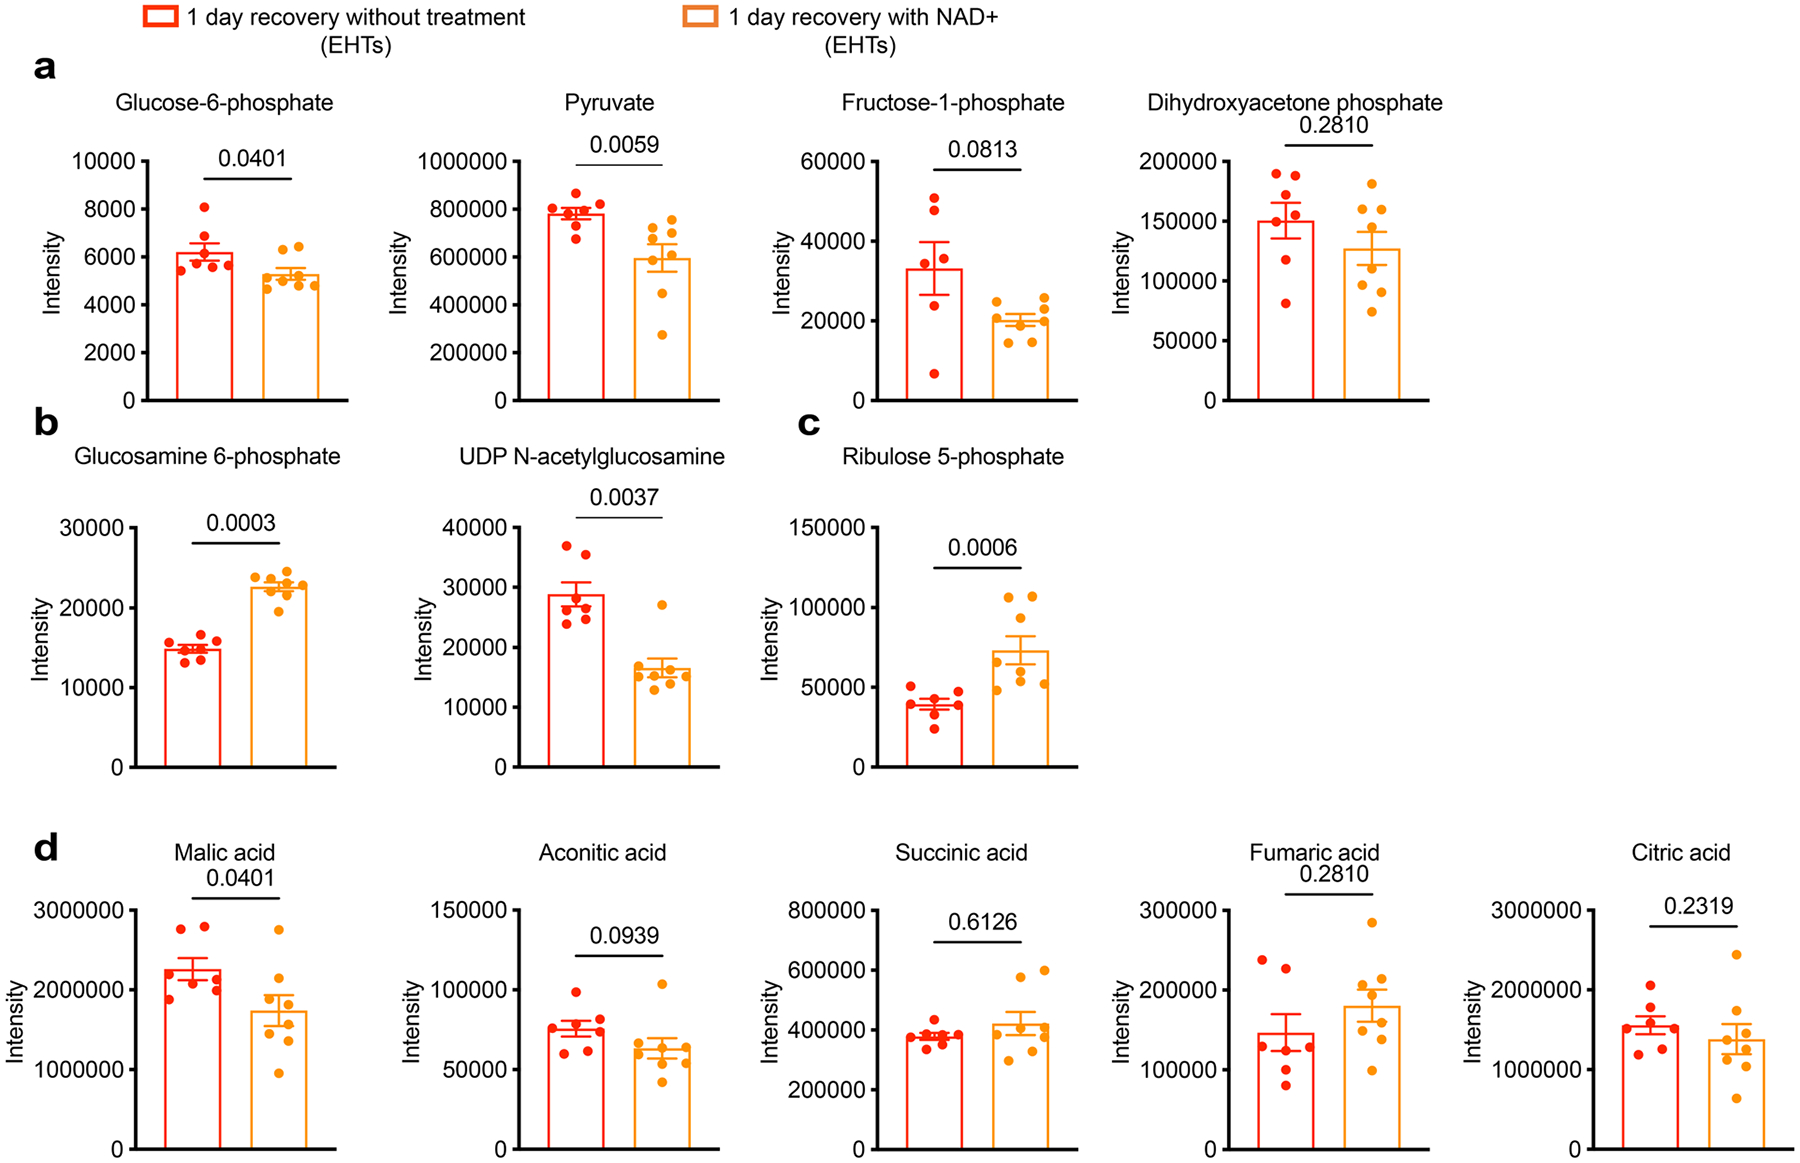
Metabolomic analysis of EHTs (SCVI-273) treated with 1 mM NAD+ or vehicle (water) for 1 day after tachypacing. a, Quantification of glycolysis metabolites: glucose-6-phosphate, pyruvate, fructose-1-phosphate and dihydroxyacetone phosphate. b, Quantification of HBP pathway metabolites: glucosamine-6-phosphate and UDP-GlcNAc. c, Quantification of PPP pathway metabolite: ribulose-5-phosphate. d, Quantification of TCA cycle metabolites: malic acid, aconitic acid, succinic acid, fumaric acid and citric acid. n = 7 untreated EHTs and n = 8 NAD+-treated EHTs. Two-tailed Mann–Whitney test. Data are displayed as mean ± s.e.m.
Extended Data Fig. 10 |. Upregulation of ECM remodelling genes in tachypaced EHTs after recovery.
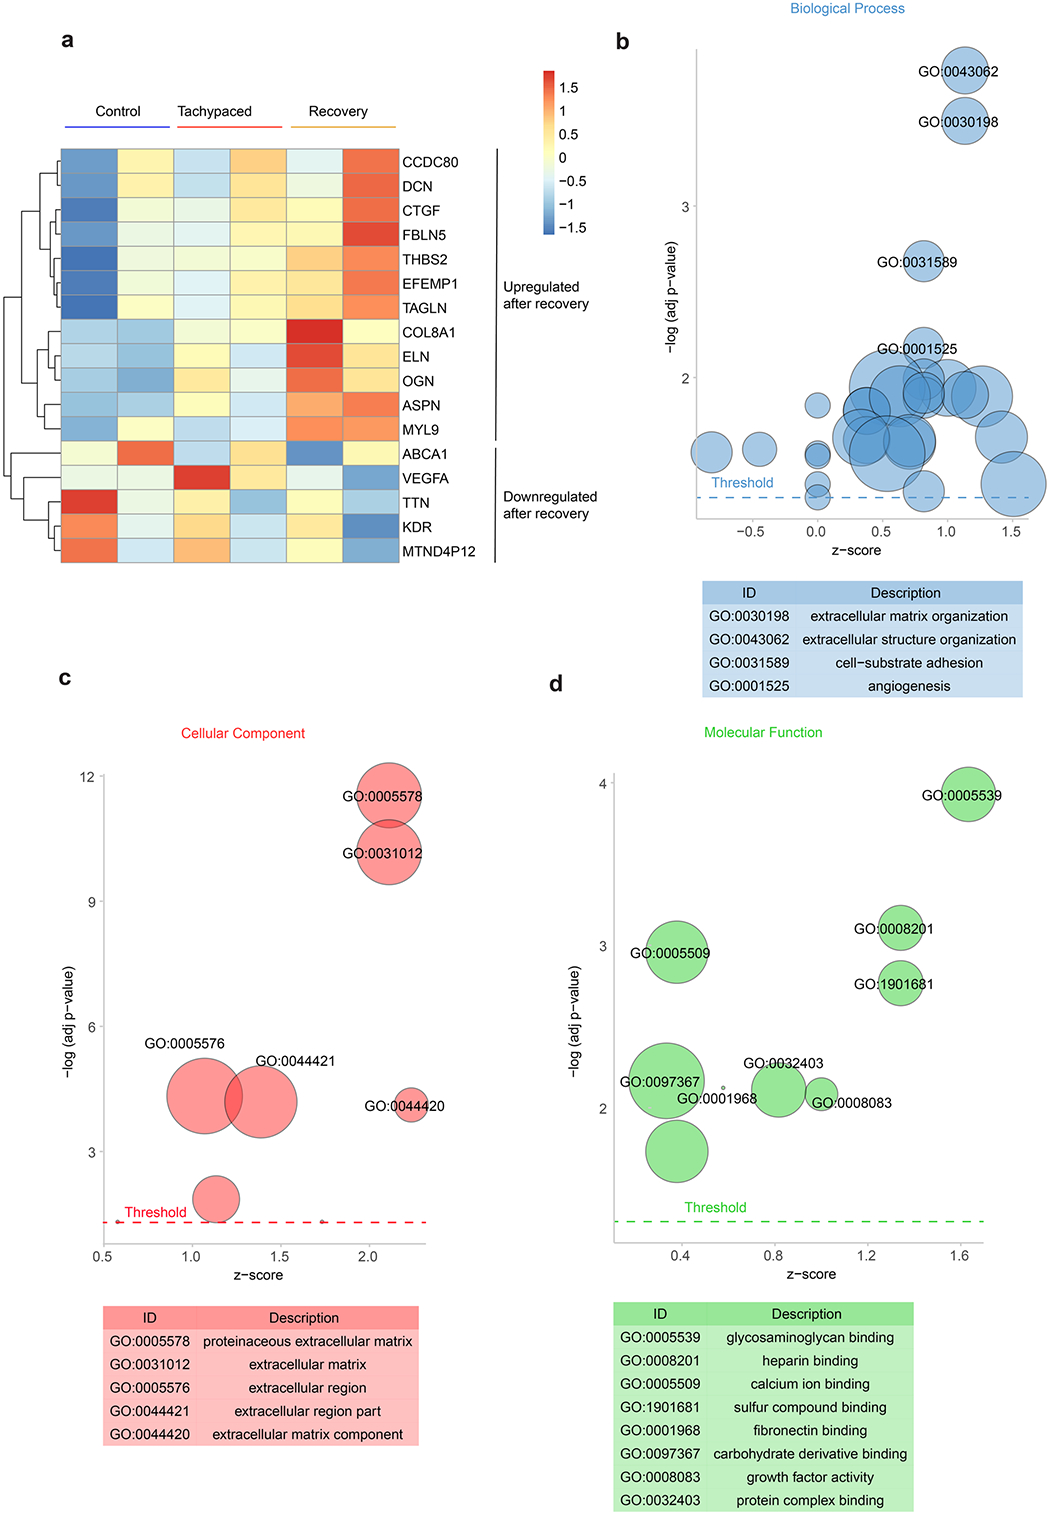
The transcriptome of EHTs recovered from tachypacing was compared with the transcriptome of unpaced control EHTs (SCVI-273). a, Heatmap of the expression of DEGs. Gene ontology analysis for b) biological process, c) cellular component, and d) molecular function of the DEGs.
Supplementary Material
Acknowledgements
C.T. discloses support for the research described in this study from the American Heart Association (AHA) (20POST35080175) and the National Institutes of Health (NIH) (K99 HL164962). A.C. discloses support for the publication of this study from AHA (908136). H.Z. discloses support for the publication of this study from AHA (23CDA1050577). O.J.A. discloses support for the publication of this study from the NIH (K01 HL130608). F.A.R. discloses support for the publication of this study from NIH (R01 HL151345). J.C.W. discloses support for the publication of this study from the NIH (R01 HL163680, R01 HL141371, R01 HL113006, R01 HL150693 and P01 HL141084) and the National Aeronautics and Space Administration (80ARC022CA003).
Footnotes
Competing interests
J.C.W. is a co-founder and scientific advisory board member of Greenstone Biosciences. All other authors declare no competing interests.
Extended data is available for this paper at https://doi.org/10.1038/s41551-023-01134-x.
Supplementary information The online version contains supplementary material available at https://doi.org/10.1038/s41551-023-01134-x.
Peer review information Nature Biomedical Engineering thanks Thomas Eschenhagen, Zachary Laksman and the other, anonymous, reviewer(s) for their contribution to the peer review of this work. Peer reviewer reports are available.
Data availability
The main data supporting the results in this study are available within the paper and its Supplementary Information. Source data for the figures are available in figshare, with the identifier https://doi.org/10.6084/m9.figshare.24112587. RNA-seq data are available at the National Center for Biotechnology Information Gene Expression Omnibus repository, under accession number GSE242727. Publicly available data used in this study are available at the National Center for Biotechnology Information Gene Expression Omnibus repository, under accession numbers GSE116250 and GSE9794. The raw and analysed datasets generated during the study are available for research purposes from the corresponding authors on reasonable request. Source data are provided with this paper.
References
- 1.Fox K et al. Heart rate as a prognostic risk factor in patients with coronary artery disease and left-ventricular systolic dysfunction (BEAUTIFUL): a subgroup analysis of a randomised controlled trial. Lancet 372, 817–821 (2008). [DOI] [PubMed] [Google Scholar]
- 2.Nanchen D et al. Resting heart rate and the risk of heart failure in healthy adults the rotterdam study. Circ. Heart Fail 6, 403–410 (2013). [DOI] [PubMed] [Google Scholar]
- 3.Böhm M et al. Heart rate as a risk factor in chronic heart failure (SHIFT): the association between heart rate and outcomes in a randomised placebo-controlled trial. Lancet 376, 886–894 (2010). [DOI] [PubMed] [Google Scholar]
- 4.Hori M & Okamoto H Heart rate as a target of treatment of chronic heart failure. J. Cardiol 60, 86–90 (2012). [DOI] [PubMed] [Google Scholar]
- 5.Komajda M Heart rate in chronic heart failure: an overlooked risk factor. Eur. Heart J 36, 648–649 (2015). [DOI] [PubMed] [Google Scholar]
- 6.Watanabe H et al. Clinical characteristics, treatment, and outcome of tachycardia induced cardiomyopathy. Int. Heart J 49, 39–47 (2008). [DOI] [PubMed] [Google Scholar]
- 7.Ellis ER & Josephson ME What about tachycardia-induced cardiomyopathy? Arrhythmia Electrophysiol. Rev 2, 82–90 (2013). [DOI] [PMC free article] [PubMed] [Google Scholar]
- 8.Inamori T et al. Inappropriate sinus tachycardia-induced cardiomyopathy with severe functional mitral regurgitation and successful treatment with ivabradine. J. Cardiol. Cases 25, 6–9 (2022). [DOI] [PMC free article] [PubMed] [Google Scholar]
- 9.Sağ S, Çoşkun H, Baran İ, Güllülü S & Aydınlar A Inappropriate sinus tachycardia-induced cardiomyopathy during pregnancy and successful treatment with ivabradine. Anatol. J. Cardiol 16, 212–213 (2016). [DOI] [PMC free article] [PubMed] [Google Scholar]
- 10.Kavanaugh M et al. Cardiomyopathy induced by sinus tachycardia in combat wounded: a case study. Mil. Med 179, e1062–e1064 (2014). [DOI] [PubMed] [Google Scholar]
- 11.Mayuga KA et al. Sinus tachycardia: a multidisciplinary expert focused review. Circ. Arrhythmia Electrophysiol 15, E007960 (2022). [DOI] [PMC free article] [PubMed] [Google Scholar]
- 12.Mueller KAL et al. Histopathological and immunological characteristics of tachycardia-induced cardiomyopathy. J. Am. Coll. Cardiol 69, 2160–2172 (2017). [DOI] [PubMed] [Google Scholar]
- 13.Nerheim P, Birger-Botkin S, Piracha L & Olshansky B Heart failure and sudden death in patients with tachycardia-induced cardiomyopathy and recurrent tachycardia. Circulation 110, 247–252 (2004). [DOI] [PubMed] [Google Scholar]
- 14.Montero S, Ferrero-Gregori A, Cinca J & Guerra JM Long-term outcome of patients with tachycardia-induced cardiomyopathy after recovery of left ventricular function. Rev. Esp. Cardiol 71, 681–683 (2018). [DOI] [PubMed] [Google Scholar]
- 15.Huizar JF, Ellenbogen KA, Tan AY & Kaszala K Arrhythmia-induced cardiomyopathy: JACC state-of-the-art review. J. Am. Coll. Cardiol 73, 2328–2344 (2019). [DOI] [PMC free article] [PubMed] [Google Scholar]
- 16.Rodriguez LM et al. Improvement in left ventricular function by ablation of atrioventricular nodal conduction in selected patients with lone atrial fibrillation. Am. J. Cardiol 72, 1137–1141 (1993). [DOI] [PubMed] [Google Scholar]
- 17.Redfield MM et al. Tachycardia-related cardiomyopathy: a common cause of ventricular dysfunction in patients with atrial fibrillation referred for atrioventricular ablation. Mayo Clin. Proc 75, 790–795 (2000). [DOI] [PubMed] [Google Scholar]
- 18.Hobai IA & O’Rourke B Enhanced Ca2+-activated Na+–Ca2+ exchange activity in canine pacing-induced heart failure. Circ. Res 87, 690–698 (2000). [DOI] [PubMed] [Google Scholar]
- 19.Gabisonia K et al. Proteome dynamics and bioinformatics reveal major alterations in the turnover rate of functionally related cardiac and plasma proteins in a dog model of congestive heart failure. J. Card. Fail 28, 588–600 (2022). [DOI] [PubMed] [Google Scholar]
- 20.Seki M et al. Acute and chronic increases of circulating FSTL1 normalize energy substrate metabolism in pacing-induced heart failure. Circ. Heart Fail 11, e004486 (2018). [DOI] [PMC free article] [PubMed] [Google Scholar]
- 21.Shen W et al. Progressive loss of myocardial ATP due to a loss of total purines during the development of heart failure in dogs. Circulation 100, 2113–2118 (1999). [DOI] [PubMed] [Google Scholar]
- 22.O’Brien PJ, Ianuzzo CD, Moe GW, Stopps TP & Armstrong PW Rapid ventricular pacing of dogs to heart failure: biochemical and physiological studies. Can. J. Physiol. Pharmacol 68, 34–39 (2011). [DOI] [PubMed] [Google Scholar]
- 23.Shite J et al. Antioxidant vitamins attenuate oxidative stress and cardiac dysfunction in tachycardia-induced cardiomyopathy. J. Am. Coll. Cardiol 38, 1734–1740 (2001). [DOI] [PubMed] [Google Scholar]
- 24.Nakamura R et al. Probucol attenuates left ventricular dysfunction and remodeling in tachycardia-induced heart failure: roles of oxidative stress and inflammation. Circulation 106, 362–367 (2002). [DOI] [PubMed] [Google Scholar]
- 25.Wolff MR, Whitesell LF & Moss RL Calcium sensitivity of isometric tension Is increased in canine experimental heart failure. Circ. Res 76, 781–789 (1995). [DOI] [PubMed] [Google Scholar]
- 26.Perreault CL, Shannon RP, Komamura K, Vatner SF & Morgan JP Abnormalities in intracellular calcium regulation and contractile function in myocardium from dogs with pacing-induced heart failure. J. Clin. Invest 89, 932–938 (1992). [DOI] [PMC free article] [PubMed] [Google Scholar]
- 27.Qanud K et al. Reverse changes in cardiac substrate oxidation in dogs recovering from heart failure. Am. J. Physiol. Heart Circ. Physiol 295, 2098–2105 (2008). [DOI] [PMC free article] [PubMed] [Google Scholar]
- 28.Schmitz W et al. Alterations in the myocardial capillary vasculature accompany tachycardia-induced cardiomyopathy. Basic Res. Cardiol 87, 65–79 (1992). [DOI] [PubMed] [Google Scholar]
- 29.Shannon RP, Komamura K, Shen YT, Bishop SP & Vatner SF Impaired regional subendocardial coronary flow reserve in conscious dogs with pacing-induced heart failure. Am. J. Physiol 265, H801–H809 (1993). [DOI] [PubMed] [Google Scholar]
- 30.Diguet N et al. Nicotinamide riboside preserves cardiac function in a mouse model of dilated cardiomyopathy. Circulation 137, 2256–2273 (2018). [DOI] [PMC free article] [PubMed] [Google Scholar]
- 31.Tong D et al. NAD+ repletion reverses heart failure with preserved ejection fraction. Circ. Res 128, 1629–1641 (2021). [DOI] [PMC free article] [PubMed] [Google Scholar]
- 32.Haywood ME et al. Transcriptome signature of ventricular arrhythmia in dilated cardiomyopathy reveals increased fibrosis and activated TP53. J. Mol. Cell. Cardiol 139, 124–134 (2020). [DOI] [PMC free article] [PubMed] [Google Scholar]
- 33.Gao Z et al. Key pathways associated with heart failure development revealed by gene networks correlated with cardiac remodeling. Physiol. Genomics 35, 222–230 (2008). [DOI] [PMC free article] [PubMed] [Google Scholar]
- 34.Mannhardt I et al. Human engineered heart tissue: analysis of contractile force. Stem Cell Rep 7, 29–42 (2016). [DOI] [PMC free article] [PubMed] [Google Scholar]
- 35.Parikh SS et al. Thyroid and glucocorticoid hormones promote functional T-tubule development in human-induced pluripotent stem cell-derived cardiomyocytes. Circ. Res 121, 1323–1330 (2017). [DOI] [PMC free article] [PubMed] [Google Scholar]
- 36.Yang X et al. Fatty acids enhance the maturation of cardiomyocytes derived from human pluripotent stem cells. Stem Cell Rep 13, 657–668 (2019). [DOI] [PMC free article] [PubMed] [Google Scholar]
- 37.Gopinathannair R et al. Arrhythmia-induced cardiomyopathies: mechanisms, recognition, and management. J. Am. Coll. Cardiol 66, 1714–1728 (2015). [DOI] [PMC free article] [PubMed] [Google Scholar]
- 38.Martin CA & Lambiase PD Pathophysiology, diagnosis and treatment of tachycardiomyopathy. Heart 103, 1543–1552 (2017). [DOI] [PMC free article] [PubMed] [Google Scholar]
- 39.Chen Y et al. Detailed characterization of microRNA changes in a canine heart failure model: relationship to arrhythmogenic structural remodeling. J. Mol. Cell. Cardiol 77, 113–124 (2014). [DOI] [PubMed] [Google Scholar]
- 40.De Lima JJG et al. Effects of FK506 in rat and human resistance arteries. Kidney Int 55, 1518–1527 (1999). [DOI] [PubMed] [Google Scholar]
- 41.Prystowsky EN The history of atrial fibrillation: the last 100 years. J. Cardiovasc. Electrophysiol 19, 575–582 (2008). [DOI] [PubMed] [Google Scholar]
- 42.Slawik J et al. Irregular pacing of ventricular cardiomyocytes induces pro-fibrotic signalling involving paracrine effects of transforming growth factor beta and connective tissue growth factor. Eur. J. Heart Fail 21, 482–491 (2019). [DOI] [PubMed] [Google Scholar]
- 43.Ling LH et al. Irregular rhythm adversely influences calcium handling in ventricular myocardium. Circ. Heart Fail 5, 786–793 (2012). [DOI] [PubMed] [Google Scholar]
- 44.Liu Y, Chen J, Fontes SK, Bautista EN & Cheng Z Physiological and pathological roles of protein kinase A in the heart. Cardiovasc. Res 118, 386–398 (2022). [DOI] [PMC free article] [PubMed] [Google Scholar]
- 45.Beckendorf J, van den Hoogenhof MMG & Backs J Physiological and unappreciated roles of CaMKII in the heart. Basic Res. Cardiol 113, 1–12 (2018). [DOI] [PMC free article] [PubMed] [Google Scholar]
- 46.Brixius K, Wollmer A, Bölck B, Mehlhorn U & Schwinger RHG Ser16-, but not Thr17-phosphorylation of phospholamban influences frequency-dependent force generation in human myocardium. Pflugers Arch. Eur. J. Physiol 447, 150–157 (2003). [DOI] [PubMed] [Google Scholar]
- 47.Liu R et al. Tead1 is required for maintaining adult cardiomyocyte function, and its loss results in lethal dilated cardiomyopathy. JCI Insight 2, e93343 (2017). [DOI] [PMC free article] [PubMed] [Google Scholar]
- 48.Tanaka N et al. Heart-rate-proportional oxygen consumption for constant cardiac work in dog heart. Jpn J. Physiol 40, 503–521 (1990). [DOI] [PubMed] [Google Scholar]
- 49.Boerth RC, Corel JW, Pool PE & Ross J Increased myocardial oxygen consumption and contractile state associated with increased heart rate in dogs. Circ. Res 24, 725–734 (1969). [DOI] [PubMed] [Google Scholar]
- 50.Gupte SA et al. Glucose-6-phosphate dehydrogenase-derived NADPH fuels superoxide production in the failing heart. J. Mol. Cell. Cardiol 41, 340–349 (2006). [DOI] [PubMed] [Google Scholar]
- 51.Daniels LJ et al. Elevated myocardial fructose and sorbitol levels are associated with diastolic dysfunction in diabetic patients, and cardiomyocyte lipid inclusions in vitro. Nutr. Diabetes 11, 1–7 (2021). [DOI] [PMC free article] [PubMed] [Google Scholar]
- 52.Zhang J et al. Accumulation of succinate in cardiac ischemia primarily occurs via canonical Krebs cycle activity. Cell Rep 23, 2617–2628 (2018). [DOI] [PMC free article] [PubMed] [Google Scholar]
- 53.Chouchani ET et al. Ischaemic accumulation of succinate controls reperfusion injury through mitochondrial ROS. Nature 515, 431–435 (2014). [DOI] [PMC free article] [PubMed] [Google Scholar]
- 54.Cantó C, Menzies KJ & Auwerx J NAD+ metabolism and the control of energy homeostasis: a balancing act between mitochondria and the nucleus. Cell Metab 22, 31–53 (2015). [DOI] [PMC free article] [PubMed] [Google Scholar]
- 55.Garofalo O, Cox DWG & Bachelard HS Brain levels of NADH and NAD+ under hypoxic and hypoglycaemic conditions in vitro. J. Neurochem 51, 172–176 (1988). [DOI] [PubMed] [Google Scholar]
- 56.Eales KL, Hollinshead KER & Tennant DA Hypoxia and metabolic adaptation of cancer cells. Oncogenesis 5, e190–e190 (2016). [DOI] [PMC free article] [PubMed] [Google Scholar]
- 57.Lee CF et al. Normalization of NAD+ redox balance as a therapy for heart failure. Circulation 134, 883–894 (2016). [DOI] [PMC free article] [PubMed] [Google Scholar]
- 58.Gorski PA et al. Role of SIRT1 in modulating acetylation of the sarco-endoplasmic reticulum Ca2+-ATPase in heart failure. Circ. Res 124, e63–e80 (2019). [DOI] [PMC free article] [PubMed] [Google Scholar]
- 59.Xie N et al. NAD+ metabolism: pathophysiologic mechanisms and therapeutic potential. Signal Transduct. Target. Ther 5, 1–37 (2020). [DOI] [PMC free article] [PubMed] [Google Scholar]
- 60.Lemme M et al. Chronic intermittent tachypacing by an optogenetic approach induces arrhythmia vulnerability in human engineered heart tissue. Cardiovasc. Res 116, 1487–1499 (2020). [DOI] [PMC free article] [PubMed] [Google Scholar]
- 61.Ronaldson-Bouchard K et al. Advanced maturation of human cardiac tissue grown from pluripotent stem cells. Nature 556, 239–243 (2018). [DOI] [PMC free article] [PubMed] [Google Scholar]
- 62.Shen S et al. Physiological calcium combined with electrical pacing accelerates maturation of human engineered heart tissue. Stem Cell Rep 17, 2037–2049 (2022). [DOI] [PMC free article] [PubMed] [Google Scholar]
- 63.Hirt MN et al. Functional improvement and maturation of rat and human engineered heart tissue by chronic electrical stimulation. J. Mol. Cell. Cardiol 74, 151–161 (2014). [DOI] [PubMed] [Google Scholar]
- 64.Cui C et al. Structural and electrophysiological dysfunctions due to increased endoplasmic reticulum stress in a long-term pacing model using human induced pluripotent stem cell-derived ventricular cardiomyocytes. Stem Cell Res. Ther 8, 109 (2017). [DOI] [PMC free article] [PubMed] [Google Scholar]
- 65.Geng L et al. Rapid electrical stimulation increased cardiac apoptosis through disturbance of calcium homeostasis and mitochondrial dysfunction in human induced pluripotent stem cell-derived cardiomyocytes. Cell. Physiol. Biochem 47, 1167–1180 (2018). [DOI] [PubMed] [Google Scholar]
- 66.Osorio JC et al. Impaired myocardial fatty acid oxidation and reduced protein expression of retinoid X receptor-α in pacing-induced heart failure. Circulation 106, 606–612 (2002). [DOI] [PubMed] [Google Scholar]
- 67.Neglia D et al. Impaired myocardial metabolic reserve and substrate selection flexibility during stress in patients with idiopathic dilated cardiomyopathy. Am. J. Physiol. Heart Circ. Physiol 293, 3270–3278 (2007). [DOI] [PubMed] [Google Scholar]
- 68.Churko JM et al. Defining human cardiac transcription factor hierarchies using integrated single-cell heterogeneity analysis. Nat. Commun 10.1038/s41467-018-07333-4 (2018). [DOI] [PMC free article] [PubMed] [Google Scholar]
- 69.Zhang JZ et al. A human iPSC double-reporter system enables purification of cardiac lineage subpopulations with distinct function and drug response profiles. Cell Stem Cell 10.1016/j.stem.2019.02.015 (2019). [DOI] [PMC free article] [PubMed] [Google Scholar]
- 70.Tiburcy M et al. Defined engineered human myocardium with advanced maturation for applications in heart failure modeling and repair. Circulation 135, 1832–1847 (2017). [DOI] [PMC free article] [PubMed] [Google Scholar]
- 71.Dobin A et al. STAR: ultrafast universal RNA-seq aligner. Bioinformatics 29, 15–21 (2013). [DOI] [PMC free article] [PubMed] [Google Scholar]
- 72.Li B & Dewey CN RSEM: accurate transcript quantification from RNA-seq data with or without a reference genome. BMC Bioinformatics 12, 1–16 (2011). [DOI] [PMC free article] [PubMed] [Google Scholar]
- 73.Liao Y, Smyth GK & Shi W featureCounts: an efficient general purpose program for assigning sequence reads to genomic features. Bioinformatics 30, 923–930 (2014). [DOI] [PubMed] [Google Scholar]
- 74.Love MI, Huber W & Anders S Moderated estimation of fold change and dispersion for RNA-seq data with DESeq2. Genome Biol 15, 1–21 (2014). [DOI] [PMC free article] [PubMed] [Google Scholar]
- 75.Mitacchione G et al. The gut hormone ghrelin partially reverses energy substrate metabolic alterations in the failing heart. Circ. Hear. Fail 7, 643–651 (2014). [DOI] [PMC free article] [PubMed] [Google Scholar]
Associated Data
This section collects any data citations, data availability statements, or supplementary materials included in this article.
Supplementary Materials
Data Availability Statement
The main data supporting the results in this study are available within the paper and its Supplementary Information. Source data for the figures are available in figshare, with the identifier https://doi.org/10.6084/m9.figshare.24112587. RNA-seq data are available at the National Center for Biotechnology Information Gene Expression Omnibus repository, under accession number GSE242727. Publicly available data used in this study are available at the National Center for Biotechnology Information Gene Expression Omnibus repository, under accession numbers GSE116250 and GSE9794. The raw and analysed datasets generated during the study are available for research purposes from the corresponding authors on reasonable request. Source data are provided with this paper.


