Abstract
Adaptive immunity relies on specialized effector functions elicited by lymphocytes, yet how antigen recognition activates appropriate effector responses through non-specific signaling intermediates is unclear. Here, we examined the role of chromatin priming in specifying the functional outputs of effector T cells and found that most of the cis-regulatory landscape active in effector T cells was poised early in development, prior to the expression of the T cell antigen receptor. We identified two principal mechanisms underpinning this poised landscape: the recruitment of the nucleosome remodeler mSWI/SNF by the transcription factors RUNX1 and PU.1 to establish chromatin accessibility at T effector loci; and a ‘relay’ whereby the transcription factor BCL11B succeeded PU.1 to maintain occupancy of the chromatin remodeling complex mSWI/SNF together with RUNX1, after PU.1 silencing during lineage commitment. These mechanisms define modes by which T cells acquire the potential to elicit specialized effector functions early in their ontogeny and underscore the importance of integrating extrinsic cues to the developmentally specified intrinsic program.
T cells sense diverse stimuli and elicit specific effector functions to coordinate the adaptive immune response1, 2. This coordination is dependent on the T cell antigen receptor (TCR), but how specific information sensed by the TCR is transduced to activate T cell-specific effector programs remains to be clearly defined. A common view to explain the specificity of the effector T cell program postulates an instructive role for the antigen receptor, supported by the impact of TCR signal strength on the phenotypic outcomes of T cell differentiation3, 4, 5 and the changes in epigenomic states following TCR triggering6, 7, 8.
However, this receptor-centric view is not sufficient to explain how the same signaling pathways triggered by the TCR activate fundamentally different effector programs in other immune cell types9, 10, nor is it consistent with the results of ‘receptor-switch’ experiments in which a neuronal muscarinic subtype-1 receptor elicited T cell-specific effector activity in response to its agonist carbachol in T cells without surface TCR11. Furthermore, the large overlap between TCR-induced and B cell antigen receptor (BCR)-induced chromatin accessibility12 suggests the epigenomic remodeling that follows antigen receptor triggering directs shared features of lymphocyte activation13. Together these findings suggest the potential to elicit T cell effector functions might be specified prior to antigen receptor signaling and underscore the importance of a developmentally preconditioned program that constrains the range of genomic sites that can be targeted by signaling pathways14, 15. The extent of this preconditioning, when it is first established in development and how it is propagated through T cell maturation is largely unknown.
In this study, we traced the chromatin accessibility profiles distinctive to effector T cells back through T cell development and found that the majority of T effector loci became accessible prior to antigen receptor expression. We identified the transcription factor RUNX1 and the chromatin remodeling complex mSWI/SNF as determinants that were necessary but insufficient to establish and maintain accessibility at T cell effector loci. We found that cooperativity between RUNX1 and the transcription factor PU.1 facilitated mSWI/SNF localization at T effector loci in thymic immigrants. We further defined a ‘relay’ whereby the transcription factor BCL11B succeeded PU.1 to maintain RUNX1-mSWI/SNF occupancy at T effector loci and propagate chromatin accessibility at these sites. Taken together, these results define the molecular mechanisms by which T cells acquire the potential to elicit specialized effector functions early in their ontogeny.
RESULTS
Accessibility at many T effector loci precedes TCR expression
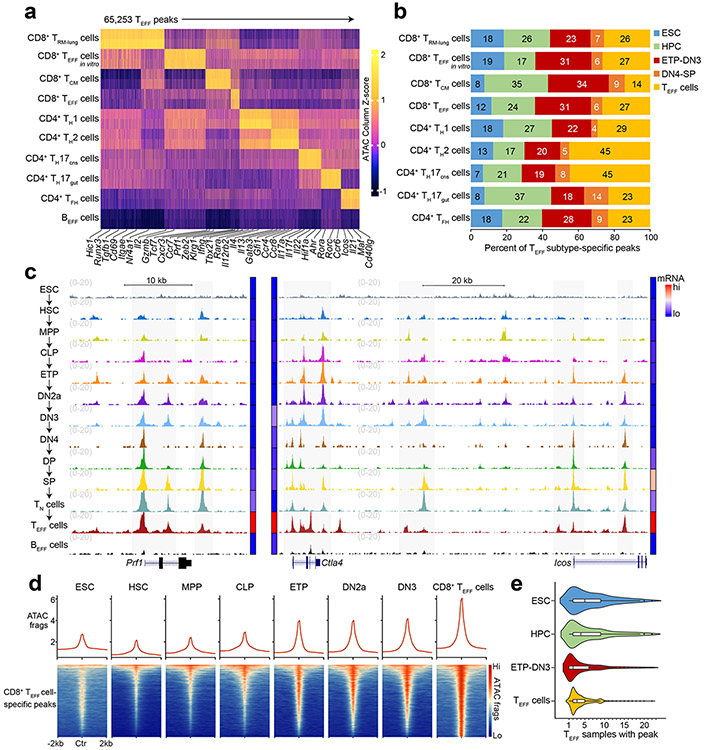
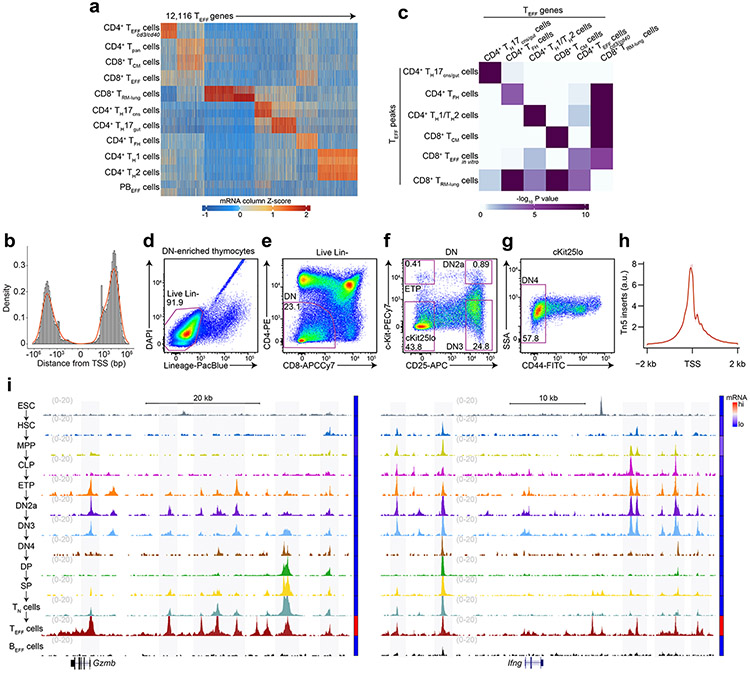
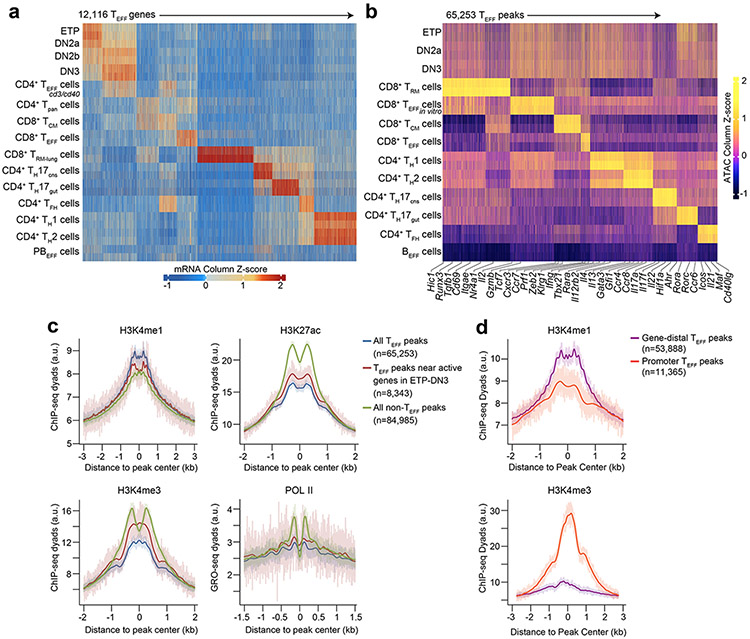
To determine when and how T cells acquire the potential to elicit lineage-specific effector activity, we first defined ‘T effector loci’ (hereafter TEFF loci) by profiling chromatin accessibility landscapes of differentiated CD8+ T cells (terminal KLRG1+CD127−LCMV-d7-specific effector T cells (TEFF cells), long-lived CD44+CD62L+LCMV-d180-specific central memory T cells (TCM cells), lung intravenous−CD44+influenza-d35-specific resident memory T cells (TRM cells), in vitro CD3ε/CD28 Ab-treated TEFF cells) and CD4+ T cells (IL-12/IL-4-Ab-treated TH1 cells, IL-4/IFNγ-Ab-treated TH2 cells, IL-17A-GFP+ TH17 cells from ileum or inflamed brain/spinal cord, CXCR5+SLAMlo/int TFH cells) using published ATAC-seq16 (assay for transposase-accessible chromatin) datasets17, 18, 19, 20, 21; excluding accessible regions that overlapped those in published ATAC-seq profiles22 of activated B cells (72h post-lipopolysaccharide/IL-4 treatment) to remove constitutively accessible peaks and those encoding general features of lymphocyte activation12; and clustering the remaining peaks into a non-overlapping set representing the unique landscapes of each TEFF cell subtype (Fig. 1a). To link these landscapes to distinctive functional responses, we profiled the transcriptomes of each TEFF cell using RNA-seq datasets from the same samples used to generate the ATAC-seq data17, 18, 19, 20, 21, 23. We clustered the transcriptomes (Extended Data Fig. 1a) and found the genes in closest proximity to the subtype-specific ATAC-seq peaks (median distance ~15 kb, Extended Data Fig. 1b) were selectively enriched for genes differentially expressed by the same TEFF cell subtype (Extended Data Fig. 1c). The chromatin landscape of the lung CD8+ TRM cells was the only exception, showing enrichment for genes of many TEFF cell subtypes, e.g. Ifng, Ccr4, Rora, Bcl6, Cxcr3 (Extended Data Fig. 1c). Thus, the defined TEFF loci reflected the distinctive chromatin landscapes and associated gene signatures of the major T cell subtypes.
Figure 1. Chromatin accessibility at many T effector loci is established prior to TCR expression.
a, Heatmap of Z scores of TSS-normalized ATAC-seq fragments across the k-means clustered (k=9) T effector loci (hereafter TEFF loci) in lung CD8+IV−CD44+influenza-d35-specific tissue-resident memory CD8+ T cells20 (CD8+ TRM cells), CD8+CD19−γδTCR−TCRβhiCD44loCD62Lhi naïve T cells (TN cells) in vitro activated with CD3ε/CD28 Abs (CD8+ TEFF in vitro cells), CD8+KLRG1+CD127−LCMV-d7-specific terminal effector T cells17 (CD8+ TEFF cells), CD8+CD44+CD62L+LCMV-d180-specific central memory T cells17 (CD8+ TCM cells), IL-12/IL-4-Ab-treated CD4+ TN cells18 (TH1 cells), IL-4/IFNγ-Ab-treated CD4+ TN cells18 (TH2 cells), IL-17A-GFP+CD4+TCRβ+ T cells21 from ileum (TH17gut cells) or inflamed brain/spinal cord (TH17CNS cells), CD4+CXCR5+SLAMlo/int T cells19 (TFH cells) and IL-4/LPS-treated B cells (BEFF cells)22 (n=2 each). b, Bar plots showing the developmental stages at which TEFF loci specific to indicated TEFF cell subtypes in a first became accessible. Serum+LIF-maintained embryonic stem cells24 (ESCs), hematopoietic progenitor cells (HPCs) as aggregate of CD127−cKithiSca-1+Flt3− hematopoietic stem cells8 (HSCs), CD127−cKithiSca-1+Flt3+ multipotent progenitors8 (MPPs) and CD127+cKithiSca-1+Flt3+ common lymphoid progenitors8 (CLPs); ETP-DN3 thymocytes as aggregate of γδTCR−CD11b−CD11c−CD19−B220−NK-1.1−Gr-1−TER-119− (Lin−) cKithiCD25−CD4−CD8− (ETPs), and Lin−cKithiCD25hiCD4−CD8− (DN2a) and Lin−c-Kit−CD25hiCD4−CD8− (DN3); DN4-SP thymocytes as aggregate of Lin−c-Kit−CD25−CD44−CD4−CD8− (DN4), Lin−CD4+CD8+TCRβloCD69− (DP), Lin−CD4+CD8−TCRβhi (CD4SP) and Lin−CD4−CD8+TCRβhi (CD8SP) and indicated TEFF cells. c, Representative genome browser of ATAC-seq (1 of n=2 each) in ESC, HSC, MPP, CLP, ETP, DN2a, DN3, DN4, DP, CD8 SP, TN, TEFF, BEFF at Prf1 (TEFF=CD8+ TEFF in vitro), Ctla4 and Icos (TEFF=TFH). Adjoined bars indicate transcripts-per-million (TPM) from RNA-seq in each cell type of indicated gene. d, Representative aggregate histograms (top) and heatmaps (bottom) (1 of n=2) of ATAC-seq fragments of ESC, HSC, MPP, CLP, ETP, DN2a, DN3 and CD8+ TEFF in vitro that intersect open chromatin regions specific to CD8+ TEFF in vitro. e, Violin plots (boxes represent 1st, median and 3rd quartiles; whiskers represent median +/− 1.5 interquartile range) representing the number of overlap between each ATAC-seq peak (columns in a) and all T effector ATAC-seq profiles (rows in a), grouped by the developmental windows (ESC, HPC, ETP-DN3 and respective TEFF cells) during which the ATAC-seq peak first became accessible.
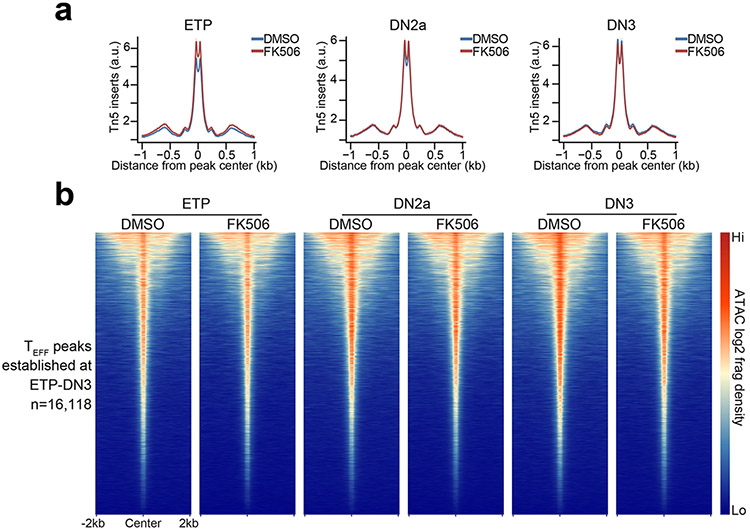
To identify when TEFF loci first became accessible, we performed ATAC-seq at major stages of T cell development beginning with Lin−(NK1.1−γδTCR−CD11b−CD19−Gr-1−CD11c−Ter119−) c-KithiCD25−CD4−CD8α− early T lineage progenitors (ETPs), Lin−c-KithiCD25hiCD4−CD8α− DN2a and Lin−c-Kit−CD25hiCD4−CD8α− DN3 thymocytes (Extended Data Fig. 1d-h) to CD8+ or CD4+ CD19−γδTCR−TCRβhiCD44loCD62Lhi naïve T cells (TN cells). These markers were used to sort the respective lineages throughout this report. We also profiled the accessibility landscapes of serum+LIF (leukemia inhibitory factor)-maintained embryonic stem cells (ESCs), Lin−CD127−c-KithiSca-1+Flt3− hematopoietic stem cells (HSCs), Lin−CD127−c-KithiSca-1+Flt3+ multipotent progenitors (MPPs) and Lin−CD127+c-KithiSca-1+Flt3+ common lymphoid progenitors (CLPs) using published ATAC-seq datasets8, 24. These profiles showed that a large fraction () of TEFF loci first became accessible in the thymus (Fig. 1b-d and Extended Data Fig. 1i), with the greatest gain in de novo accessibility ( of TEFF loci) in ETPs (Fig. 1b-d and Extended Data Fig. 2a-f), with nearly half of all TEFF loci, including Prf1, Gzmb and Ifng, accessible by the DN2a stage (Fig. 1b-d and Extended Data Fig. 1i, 2a-f). The regions in which accessibility was established in ETP-DN3 thymocytes overlapped with the accessible genomes of a median of 2 (75 percentile=5) of the 23 T effector samples we profiled (Fig. 1e and Extended Data Fig. 2g-l), which was less than that for ESC-established (median=5, 75 percentile=9) or HSC/MPP/CLP-established peaks (median=4, 75 percentile=9), indicating a greater enrichment for subtype-specific TEFF loci (e.g. Tbx21, Il4, Il17a and Icos) compared to more common TEFF loci (e.g. Cd69, Cd40lg) (Fig. 1c,e and Extended Data Fig. 2g-l). The poising of these TEFF loci was not affected by treatment with FK506, an inhibitor of calcineurin that blocks the calcium-NFAT signaling pathway – a key arm of TCR signal transduction25 (Extended Data Fig. 3a,b) – indicating that most chromatin accessibility at TEFF loci was independent of TCR signaling.
Enhancer priming mediates early accessibility at TEFF loci
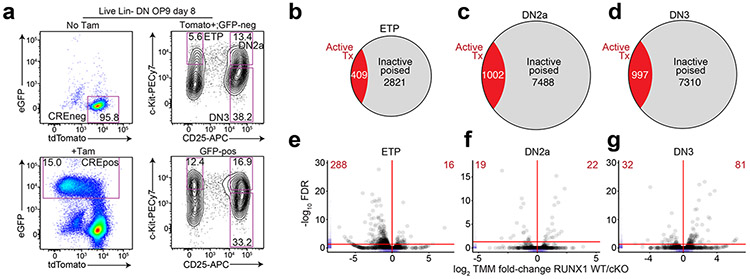
To test whether the accessibility at TEFF loci in DN thymocytes reflected active transcription needed for early T cell development, we profiled the transcriptomes of ETP-DN3 thymocytes using published RNA-seq datasets23 and assessed the expression levels of genes neighboring the TEFF loci (TEFF genes). The large majority (>80%) of TEFF genes were transcriptionally silent or expressed at levels orders of magnitude lower than those in effector T cells (Fig. 1c, Extended Data Fig. 1i, 4a,b). We further characterized these loci by profiling the state of histone modifications and RNA polymerase II (POL II) occupancy using published chromatin immunoprecipitation (ChIP-seq) and global run-on (GRO-seq) sequencing datasets26, 27. We found an enrichment of H3K4me1 and depletion of H3K27ac, H3K4me3 and POL II, cardinal features of transcriptionally inactive distal enhancers28 (Extended Data Fig. 4c), consistent with ~83% of TEFF loci being gene-distal (Extended Data Fig. 4d). These data indicated that the accessibility at TEFF loci in early thymocyte subsets largely reflected enhancer priming28, 29.
Distinct regulatory logic underlies early poising at TEFF loci
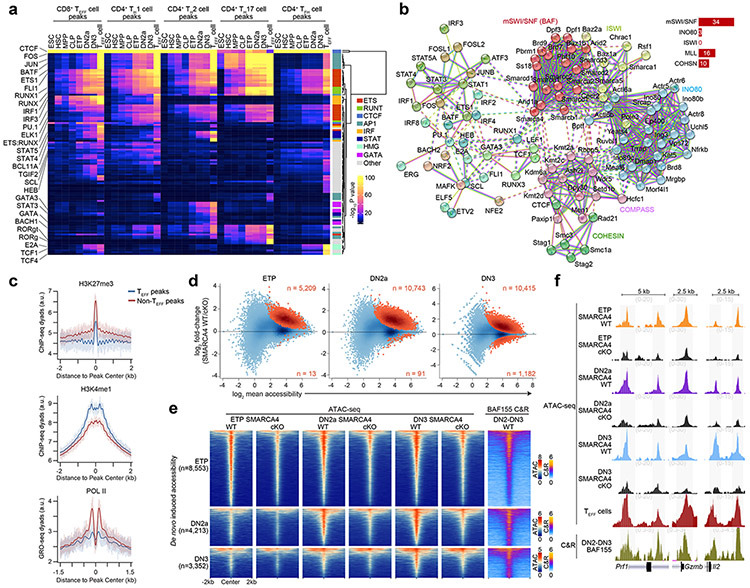
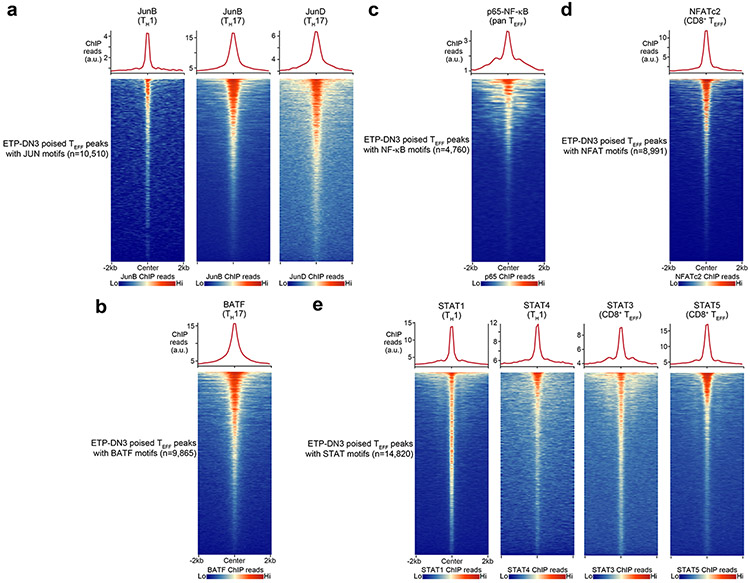
Next, we sought to identify potential transcription factors that could be targeting these regions in early T cell development by conducting transcription factor motif enrichment analysis within accessible TEFF loci specific to CD8+ TEFF, CD4+ TH1, CD4+ TH2, CD4+ TH17 and CD4+ TFH cells in ESCs, HSCs, MPPs, CLPs, ETP, DN2a and DN3 thymocytes using the same ATAC-seq profiles generated above. We found a sharp enrichment of ETS and RUNX motifs at the ETP-DN3 stages at all assessed TEFF loci (compared to ESC-CLPs), and a more modest enrichment of AP-1 motifs in ETP-DN3 stages at accessible loci specific for CD4+ TH1, CD4+ TH2 and CD4+ TH17 cells compared to those specific for CD8+ TEFF cells or CD4+ TFH cells (Fig. 2a). Motifs for STAT factors (e.g. STAT3, STAT4, STAT5) were enriched in DN2a-DN3 thymocytes at accessible loci specific for CD4+ TH2 cells and CD8+ TEFF cells (Fig. 2a). Using published ChIP-seq datasets30, 31, 32, 33, 34, 35, 36, 37, we detected robust localization of AP-1 and STAT factors, as well as NFAT and NF-κB, at TEFF loci poised at ETP-DN3 stages in activated CD4+ TH1 cells, CD4+ TH17 cells and CD8+ TEFF cells (Extended Data Fig. 5a-e), suggesting that accessibility at these early stages of T cell development may specify the genomic regions that signal-regulated transcription factors could later target upon TCR and cytokine receptor signaling.
Figure 2. Early poising of TEFF loci is dependent on the mSWI/SNF ATPase SMARCA4.
a, Heatmaps depicting −log10 P values of transcription factor motif enrichments for the top 100 motifs with family classification (vertical axis) within each of the CD8+ TEFF-, CD4+ TH1-, CD4+ TH2-, CD4+ TH17- and CD4+ TFH-specific peaks that were accessible in ESC, HSC, MPP, CLP, ETP, DN2a, DN3 and respective TEFF type (n=2 each) developmental stages (horizontal axis). b, STRING high-confidence protein-protein interaction network generated from top decile (n=44) transcription factors from a and known subunits of mSWI/SNF, ISWI, INO80, COMPASS and Cohesin complexes. Node colors indicate MCL cluster assignment with dotted lines indicating inter-cluster interactions. Red lines indicate experimentally determined interactions; blue lines indicate curated databases-determined interaction; green lines indicate text mining-determined interactions. c, Representative aggregate histograms of H3K27me339 (top; 1 of n=2) or H3K4me126 (middle; 1 of n=2) ChIP-seq dyads or GRO-seq dyads26 (bottom; 1 of n=2) over TEFF peaks and non- TEFF peaks in wild-type mouse DN2-DN3 thymocytes. d, MA plots depicting the log2 fold-change of normalized ATAC-seq fragments at TEFF loci between SMARCA4 WT and SMARCA4 cKO ETP (n=3), DN2a (n=3) and DN3 (n=2) thymocytes. Statistically significant differentially expressed peaks (Benjamini-Hochberg-corrected FDR < 0.1) are highlighted in orange. e, Representative heatmaps of ATAC-seq fragments from in vitro differentiated SMARCA4 WT and SMARCA4 cKO ETP (1 of n=3), DN2a (1 of n=3) and DN3 (1 of n=2) thymocytes and BAF155 occupancy (CUT&RUN) from in vitro differentiated SMARCA4 WT DN2-DN3 thymocytes (1 of n=3) that intersect TEFF loci that first become accessible in ETP (top), DN2a (middle) and DN3 (bottom) thymocytes. f, Representative genome browser of ATAC-seq fragments from in vitro differentiated SMARCA4 WT and SMARCA4 cKO ETP (1 of n=3), DN2a (1 of n=3), DN3 (1 of n=2) thymocytes and CD8+ TEFF in vitro (1 of n=2) (top) and BAF155 occupancy (1 of n=3) (bottom) in in vitro differentiated SMARCA4 WT DN2-DN3 thymocytes at Prf1, Gzmb and Il2 loci.
We next used the STRING database (string-d.org) to generate a network of known and predicted protein-protein interactions between the top decile of transcription factors from our motif enrichment analysis and subunits of the major cofactor complexes attributed to promoting de novo chromatin accessibility28, 29, 38, such as the trithorax group complexes mSWI/SNF (also known as BAF) chromatin remodeling complex and COMPASS histone methyltransferase complex. We observed a strong bias of interactions between the transcription factors and subunits of the mSWI/SNF complex, an antagonist of Polycomb repression38 (Fig. 2b). Aggregate density analysis of published H3K27me3 ChIP-seq39 read dyads indicated focal depletion of H3K27me3 at TEFF loci compared to other accessible regions of the genome in ETP–DN2b thymocytes (Fig. 2c), consistent with the eviction of Polycomb following recruitment of mSWI/SNF to TEFF loci.
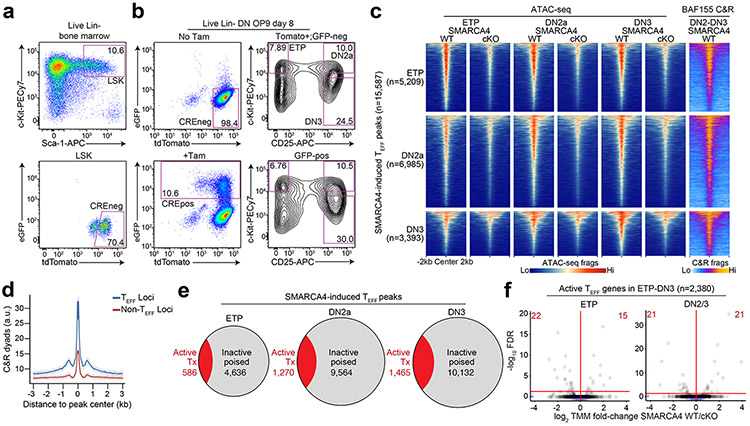
To test the functional role of mSWI/SNF in the early poising of TEFF loci, we generated Smarca4f/fRosaCreERT2/nTnG mice, in which tamoxifen treatment induces deletion of the gene encoding the mSWI/SNF ATPase SMARCA4, also known as BRG1. We sorted and cultured Smarca4f/fRosaCreERT2/nTnG Lin−Sca-1+c-Kit+ (hereafter LSK) hematopoietic progenitors on OP9-DL440 (Extended Data Fig. 6a) and treated with tamoxifen or ethanol at day 4 of culture (30h), washed out, replated and sorted GFP+ KO (hereafter SMARCA4 cKO) or tdTomato+ WT (hereafter SMARCA4 WT) ETP, DN2a or DN3 thymocytes at day 8 for ATAC-seq (Extended Data Fig. 6b). GFP+ SMARCA4 cKO cells were outcompeted by tdTomato+ cells in the same tamoxifen-treated culture (Extended Data Fig. 6b), suggesting a fitness loss in SMARCA4 cKO cells. However, the ratio of ETP:DN2a:DN3 thymocytes was comparable between SMARCA4 cKO and SMARCA4 WT thymocytes in the OP9-DL4 co-cultures (Extended Data Fig. 6b), suggesting the developmental heterogeneity of cells at the time of tamoxifen treatment yielded asynchronously differentiating SMARCA4 cKO cells to reach respective ETP, DN2a and DN3 stages prior to depletion of SMARCA4 levels. We found significant decreases in chromatin accessibility at 5,209, 10,743 and 10,415 TEFF loci in SMARCA4 cKO compared to SMARCA4 WT ETP, DN2a and DN3 thymocytes, respectively (Fig. 2d). Furthermore, the de novo gain in ATAC-seq fragment density at TEFF loci established in SMARCA4 WT ETPs was substantially diminished at 74.6% and 70.5% of these loci in SMARCA4 cKO DN2a and DN3 thymocytes, respectively (Fig. 2e,f). Likewise, the de novo accessibility at TEFF loci established in SMARCA4 WT DN2a thymocytes became diminished in 80.9% of SMARCA4 cKO DN3 thymocytes (Fig. 2e,f). These results indicated that SMARCA4 had a critical role in the establishment and maintenance of chromatin accessibility at TEFF loci in early T cell development.
To determine whether the loci dependent on SMARCA4 for chromatin accessibility in ETP-DN3 thymocytes (Extended Data Fig. 6c) were directly bound by mSWI/SNF, we performed CUT&RUN (cleavage under targets & release using nuclease)41 for BAF155, a core subunit of mSWI/SNF, in sorted Lin−CD25+CD4−CD8− DN2-DN3 thymocytes (hereafter DN2-DN3) differentiated from wild-type mouse LSK progenitors on OP9-DL4 cultures. We found BAF155 CUT&RUN fragment density selectively enriched at TEFF loci compared to accessible regions that were not TEFF loci in wild-type DN2-DN3 thymocytes (Extended Data Fig. 6d). Moreover, we found robust mSWI/SNF occupancy at 82.8% of SMARCA4-induced ETP-DN3 established TEFF loci compared to that at background regions ±2 kb of these loci (Fig. 2e,f, Extended Data Fig. 6c). Of note, the changes in chromatin accessibility at TEFF loci in SMARCA4 cKO ETP-DN3 thymocytes did not correlate with local mRNA expression from the associated genes, as the large majority (~86–89%) of the TEFF loci were associated with transcriptionally inactive genes (Extended Data Fig. 4a) and less than 1% of the transcribed TEFF loci (~11-14% of total TEFF loci) were downregulated in SMARCA4 cKO compared to SMARCA4 WT ETP-DN3 thymocytes (Extended Data Fig. 6e,f). Taken together, these data indicated that mSWI/SNF was a positive regulator of chromatin poising at TEFF loci in early T cell development.
RUNX1 facilitates mSWI/SNF recruitment to poise TEFF loci
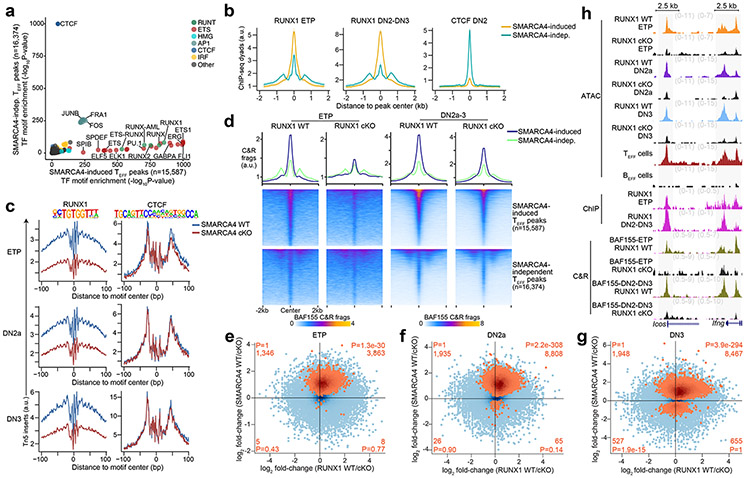
To identify the specific transcription factors that interacted with mSWI/SNF to establish and maintain accessibility at TEFF loci in early T cell development, we leveraged the ATAC-seq data from SMARCA4 cKO ETP-DN3 thymocytes to distinguish the motif lexicon of SMARCA4-induced versus SMARCA4-independent TEFF loci. We found significant enrichment of binding motifs for ETS and RUNX factors at an order of magnitude greater than that for CTCF motifs within SMARCA4-induced regions (e.g. Prf1, Il2, Icos) in ETP-DN3 thymocytes. In contrast, SMARCA4-independent sites (e.g. Klrg1, Ccr4, Sell) were significantly enriched for CTCF motifs at an order of magnitude greater than that for ETS and RUNX motifs (Fig. 3a). Because half of all transcription factor-mSWI/SNF associations in the above STRING-generated protein interaction network was connected to RUNX1, we focused on RUNX1 as a potential mSWI/SNF targeting factor. Using published ChIP-seq datasets27, 42, we investigated whether RUNX1 bound to the same TEFF loci that mSWI/SNF regulated in ETP-DN3 thymocytes. We found focal RUNX1 occupancy at 87.2% and 85.9% of SMARCA4-induced TEFF loci in ETPs and DN2-DN3 thymocytes, respectively, with enhanced RUNX1, but not CTCF ChIP-seq26 read density at these sites compared to SMARCA4-independent TEFF loci (Fig. 3b), indicating preferential localization of RUNX1 at SMARCA4-induced sites in ETP-DN3 thymocytes. Leveraging the ETP-DN3 SMARCA4 WT and SMARCA4 cKO ATAC-seq datasets, we assessed differences in transcription factor footprinting at TEFF loci with RUNX1 motifs (e.g. Ifng, Il2, Icos). We found the difference in Tn5 insert density between the center and flanking regions of the RUNX1 motif (footprint depth) was substantially diminished by 29.9%, 24.2% and 39.1% in SMARCA4 cKO compared to SMARCA4 WT ETPs, DN2a and DN3 thymocytes, respectively (Fig. 3c). By contrast, no change in footprint depth was detected at the CTCF motif at the same stages (Fig. 3c), indicating synergy between RUNX1 and mSWI/SNF co-occupancy at SMARCA4-induced TEFF loci in early thymocyte progenitors.
Figure 3. RUNX1 partners with mSWI/SNF to poise TEFF loci in early T cell development.
a, Scatter plot of −log10 P values of transcription factor motif enrichment within SMARCA4-induced (horizontal axis) vs. SMARCA4-independent (vertical axis) TEFF loci from ETP, DN2a or DN3 thymocytes. b, Representative aggregate histograms of RUNX1 occupancy (ChIP-seq) in ETPs42 (left), DN2-DN3 thymocytes27 (middle) and CTCF occupancy26 (ChIP-seq) in DN2-DN3 thymocytes at SMARCA4-induced (orange) vs. SMARCA4-independent (cyan) TEFF loci (1 of n=2 for each). c, Representative transcription factor footprints (i.e. ATAC-seq inserts near motifs) within TEFF loci centered on RUNX1 and CTCF transcription factor motifs in in vitro differentiated SMARCA4 WT vs. SMARCA4 cKO ETP (top; 1 of n=3), DN2a (middle; 1 of n=3) and DN3 (bottom; 1 of n=2) thymocytes. d, Representative aggregate histograms and heatmaps of BAF155 occupancy (CUT&RUN) in in vitro differentiated RUNX1 WT vs. RUNX1 cKO ETPs (left; 1 of n=2) and DN2-DN3 thymocytes (right; 1 of n=2) over SMARCA4-induced (top heatmaps) or SMARCA4-independent (bottom heatmaps) TEFF loci. e-g, Scatter plots depicting the log2 fold-change of normalized ATAC-seq fragments at TEFF loci between in vitro differentiated RUNX1 WT vs. RUNX1 cKO ETPs (n=2; horizontal axis) and in vitro differentiated SMARCA4 WT vs. SMARCA4 cKO ETPs (n=3; vertical axis) (e); in vitro differentiated RUNX1 WT vs. RUNX1 cKO DN2a thymocytes (n=2; horizontal axis) and in vitro differentiated SMARCA4 WT vs. SMARCA4 cKO DN2a thymocytes (n=3; vertical axis) (f); and in vitro differentiated RUNX1 WT vs. RUNX1 cKO DN3 thymocytes (n=2; horizontal axis) and in vitro differentiated SMARCA4 WT vs. SMARCA4 cKO DN3 thymocytes (n=2; vertical axis) (g). SMARCA4-induced TEFF loci (Benjamini-Hochberg-corrected FDR < 0.1) peaks at each stage are highlighted in orange. Number and statistical enrichment of SMARCA4-induced TEFF loci (determined by one-sided Fisher’s exact test) within each Cartesian quadrant shown in orange. h, Representative genome browser of ATAC-seq in in vitro differentiated RUNX1 WT vs. RUNX1 cKO ETP, DN2a and DN3 thymocytes (1 of n=2 each), TEFF cells and BEFF cells (1 of n=2), RUNX1 occupancy (ChIP-seq) in ETP42 and DN2-DN327 thymocytes (1 of n=2 each) and BAF155 occupancy in in vitro differentiated RUNX1 WT vs. RUNX1 cKO ETP and DN2-DN3 thymocytes (1 of n=2 each) at Icos (TEFF=TFH) and Ifng (TEFF=TH1) loci.
To test whether mSWI/SNF localization at TEFF loci in ETP-DN3 thymocytes depended on RUNX1, we generated Runx1f/fRosaCreERT2/nTnG mice, cultured sorted LSK progenitors on OP9-DL4, treated them with tamoxifen or ethanol at day 4, washed out, replated and sorted GFP+ cells (hereafter RUNX1 cKO) or tdTomato+ cells (hereafter RUNX1 WT) ETPs at day 8 (Extended Data Fig. 7a). BAF155 CUT&RUN in RUNX1 cKO ETPs and pooled DN2-DN3 thymocytes indicated a marked loss of mSWI/SNF localization at TEFF loci compared to RUNX1 WT ETP and DN2-DN3 thymocytes (Fig. 3d), with a more pronounced loss of BAF155 occupancy at SMARCA4-induced compared to SMARCA4-independent TEFF loci (Fig. 3d), suggesting that RUNX1 was required for recruitment of mSWI/SNF to TEFF loci in ETP-DN3 thymocytes. To determine whether the loss in mSWI/SNF targeting due to Runx1 deletion impacted chromatin accessibility at TEFF loci, we performed ATAC-seq on sorted RUNX1 cKO and RUNX1 WT ETP, DN2a and DN3 thymocytes and found 74.2%, 82.0% and 81.3% of SMARCA4-induced loci (e.g. Icos, Ifng) exhibited decreased chromatin accessibility in RUNX1 cKO compared to RUNX1 WT ETPs-DN3 (Fig. 3e-h), indicating strong synergy between RUNX1 and SMARCA4 in establishing chromatin accessibility at TEFF loci. The mRNA levels at <1% of transcriptionally active TEFF loci were downregulated in RUNX1 cKO compared to RUNX1 WT ETP-DN3 thymocytes (Extended Data Fig. 7b-g), indicating that changes in chromatin accessibility at the RUNX1-induced TEFF loci were not caused by changes in local gene expression. Together, these results showed that RUNX1 and mSWI/SNF cooperated to facilitate the induction of de novo accessibility at TEFF loci in early T cell development.
BCL11B maintains poising at SMARCA4-induced TEFF loci
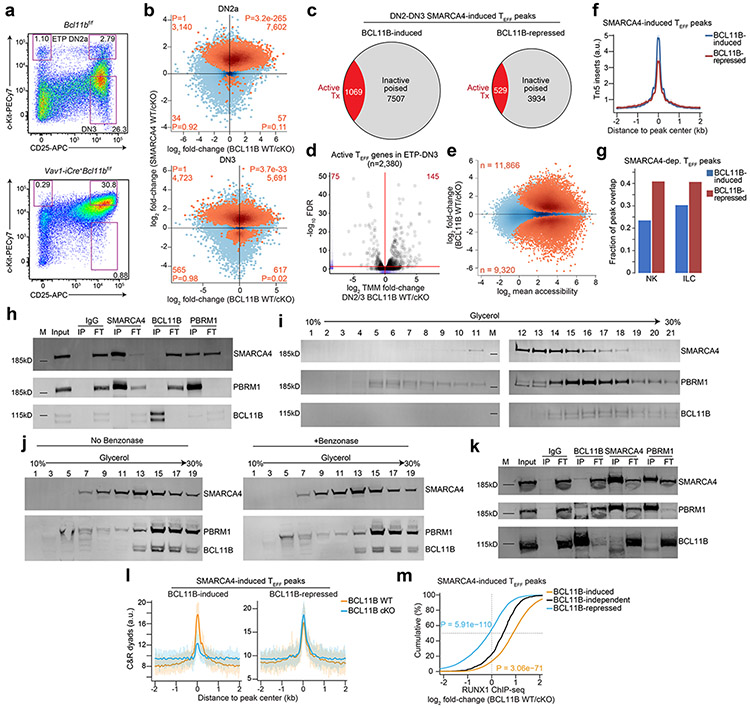
mSWI/SNF complexes assemble lineage-specific combinations of subunits to impart unique biological functions across different tissues43. BCL11B, a major determinant of T lineage commitment whose expression is induced at the DN2a stage44, 45, 46 is the only putative T cell-specific mSWI/SNF complex subunit reported to date47. To investigate whether BCL11B contributed to imparting T cell-specific mSWI/SNF function that promoted chromatin accessibility at TEFF loci in early T cell development, we profiled the genomic occupancy of BCL11B in sorted wild-type mouse DN2-DN3 thymocytes using published ChIP-seq datasets27. We found robust BCL11B occupancy at 82.8% of SMARCA4-induced, ETP-DN3 established TEFF loci in DN2-DN3 thymocytes compared to that at background regions ±2 kb of these loci (Fig. 4a,b). Furthermore, we found enhanced focal BCL11B ChIP-seq read density at mSWI/SNF-localized, SMARCA4-induced TEFF loci compared to that at SMARCA4-independent TEFF loci (Fig. 4a,b). To determine whether this preferential localization had functional consequences, we generated Vav1-iCre+Bcl11bf/f mice and performed ATAC-seq on sorted DN2a and separately sorted DN3 thymocytes from Vav1-iCre+Bcl11bf/f mice (hereafter BCL11B cKO) and Vav1-iCre−Bcl11bf/f sex-matched littermates (hereafter BCL11B WT) (Extended Data Fig. 8a). 70.7% and 54.6% of SMARCA4-induced TEFF loci had diminished chromatin accessibility in BCL11B cKO compared to BCL11B WT DN2a and DN3 thymocytes, respectively (Extended Data Fig. 8b). These changes had little correlation to mRNA levels48 at the respective differentially accessible TEFF loci (Extended Data Fig. 8c,d). The combined DN2a and DN3 (hereafter DN2a-DN3) ATAC-seq datasets identified 8,576 TEFF loci (e.g. Il2, Ifng) that required both BCL11B and SMARCA4 for chromatin accessibility at these developmental stages (Fig. 4c,d). We also identified 4,463 SMARCA4-induced TEFF loci at which the chromatin accessibility was greater in BCL11B cKO compared to BCL11B WT DN2a-DN3 thymocytes (e.g. Il17a, Fcer1g) (Fig. 4c,d and Extended Data Fig. 8e). The amplitude of chromatin accessibility at these BCL11B-repressed loci was substantially lower compared to BCL11B-induced loci in BCL11B WT DN2a-DN3 thymocytes (Extended Data Fig. 8f), suggesting that these loci were dampened at these stages of thymocyte differentiation. Considering the prominent role of BCL11B in alternative lineage exclusion44, 45, 46, we used published ATAC-seq datasets8 and found a greater overlap between BCL11B-repressed compared to BCL11B-induced TEFF loci and the accessibility landscapes of natural killer (NK) and innate lymphoid cells (ILCs) ILC1 and ILC3, but not ILC2 (Fig. 4e and Extended Data Fig. 8g), consistent with the essential role of BCL11B in ILC2 identity and function49. Taken together, these results suggested that BCL11B worked cooperatively with SMARCA4 to maintain a poised accessibility state at many TEFF loci in DN2a-DN3 thymocytes, while dampening loci shared with alternative lineage programs.
Figure 4. BCL11B maintains chromatin accessibility at SMARCA4-induced TEFF loci.
a, Representative aggregate histograms (1 of n=2) of BCL11B occupancy (ChIP-seq27) in WT DN2-DN3 thymocytes over SMARCA4-induced vs. SMARCA4-independent TEFF loci. b, Representative heatmaps of BCL11B occupancy (ChIP-seq27; 1 of n=2), BAF155 occupancy (CUT&RUN; 1 of n=3) and ATAC-seq (1 of n=2; right) in in vitro differentiated SMARCA4 WT vs. SMARCA4 cKO thymocytes intersecting SMARCA4-induced TEFF loci in DN2-DN3 thymocytes. c, Scatter plot depicting the log2 fold-change of normalized ATAC-seq fragments at TEFF loci between sorted BCL11B WT vs. BCL11B cKO DN2-DN3 primary thymocytes (n=2; horizontal axis) and in vitro differentiated SMARCA4 WT vs. SMARCA4 cKO DN2-DN3 thymocytes (n=2; vertical axis). SMARCA4-induced TEFF loci (Benjamini-Hochberg-corrected FDR < 0.1) peaks highlighted in orange. Number and statistical enrichment of SMARCA4-induced TEFF loci (determined by one-sided Fisher’s exact test) within each Cartesian quadrant shown in orange. d, Representative genome browser of BCL11B occupancy (ChIP-seq27; 1 of n=2) BAF155 occupancy (CUT&RUN; 1 of n=3) occupancy in DN2-DN3 thymocytes and ATAC-seq in sorted BCL11B WT vs. BCL11B cKO DN2-DN3 primary thymocytes (1 of n=2), in vitro differentiated SMARCA4 WT vs. SMARCA4 cKO DN2-DN3 thymocytes, in vitro differentiated SMARCA4 WT vs. SMARCA4 cKO ETPs, TEFF cells (1 of n=2) and BEFF cells (1 of n=2) at Il2, Ifng (BCL11B-induced, TEFF=TH1), Il17a (TEFF=TH17) and Fcer1g (TEFF=CD8+ TRM) (BCL11B-repressed) loci. e, Representative (1 of n=2 for each) aggregate histograms of ATAC-seq inserts over BCL11B-induced and BCL11B-repressed SMARCA4-induced TEFF loci in CD19−CD3ε−NKp46+DX5+TRAIL− natural killer8 (NK); CD19−CD3ε−NKp46+DX5−TRAIL+ (ILC18) CD3ε−CD19−NKp46−CD127+KLRG1+ (ILC28) and pooled CD3ε−CD19−NKp46−CD127+KLRG1−CD4+ and CD3ε−CD19−NKp46+CD127+NK1.1+ (ILC38).
BCL11B maintains mSWI/SNF occupancy at TEFF loci
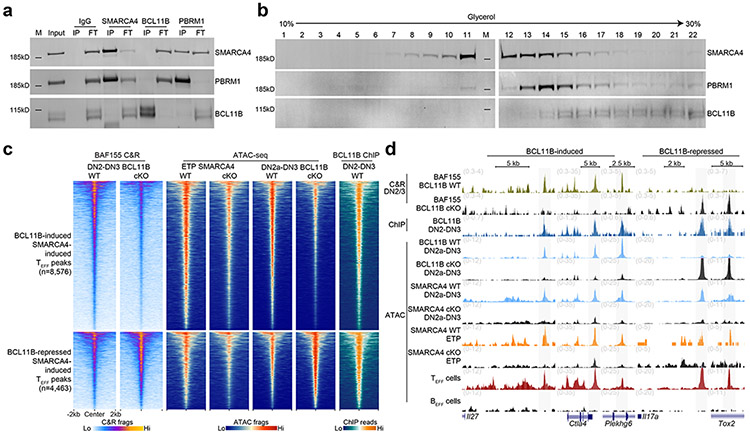
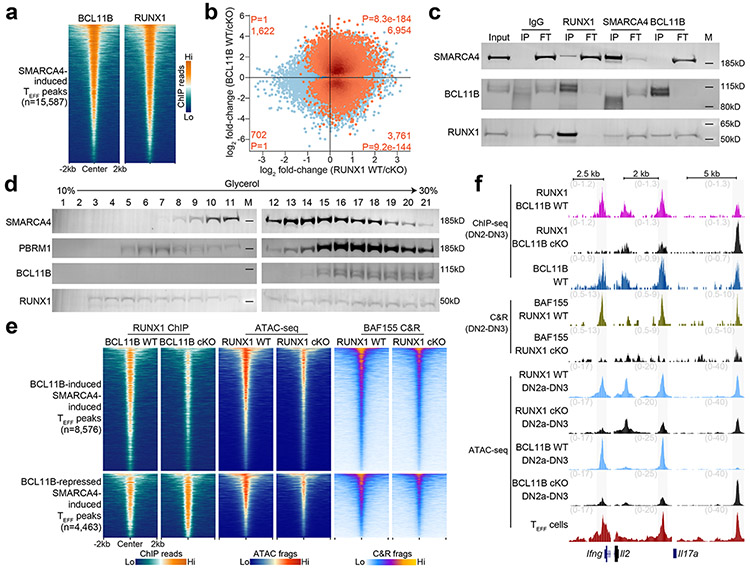
BCL11B was reported as a tightly associated, dedicated (i.e. doesn’t associate with other complexes or exist in nucleoplasm as unassociated factor) T cell-specific subunit of the mSWI/SNF complex in a T acute lymphoblastic leukemia cell line (CCRF-CEM)47. To determine whether this interaction was observed in untransformed primary thymocytes, we conducted reciprocal co-immunoprecipitation (co-IP) studies in nuclear lysates from total thymocytes isolated from wild-type mice at an IP efficiency that depleted the target antigen from the lysate flow-through. We found little to no detectable interaction between BCL11B and SMARCA4 or PBRM1, a core subunit of the Polybromo mSWI/SNF complex43, in salt stringency ranging 50-300 mM for IP or wash conditions (Fig. 5a), while a physical interaction between SMARCA4 and PBRM1 was detected at 300 mM salt concentration (Fig. 5a). Co-IP experiments using nuclear lysates from CCRF-CEM T cells in the same range of salt concentrations also detected no interaction between BCL11B and SMARCA4 or PBRM1 (Extended Data Fig. 8h).
Figure 5. BCL11B maintains mSWI/SNF occupancy at TEFF loci via indirect cooperativity.
a, Reciprocal co-immunoprecipitations of IgG, SMARCA4, BCL11B and PBRM1 (columns) from nuclear extracts (1mg/mL) of total thymocytes from wild-type mice and immunoblots of co-immunoprecipitating SMARCA4, PBRM1 and BCL11B (rows). (Input sample, immunoprecipitant (IP), flow-through fraction of non-interacting proteins (FT), molecular weight markers (M)). b, Density sedimentation (glycerol gradient; horizontal axis) and immunoblot of SMARCA4, PBRM1 and BCL11B (rows) from nuclear extracts of total thymocytes from wild-type mice. 1mg total extract loaded onto gradient. c, Representative heatmaps of BAF155 CUT&RUN in sorted BCL11B WT vs. BCL11B cKO DN2-DN3 primary thymocytes (1 of n=3), ATAC-seq in in vitro differentiated SMARCA4 WT vs. SMARCA4 cKO ETPs (1 of n=3), sorted BCL11B WT vs. BCL11B cKO DN2-DN3 primary thymocytes (1 of n=2) and BCL11B occupancy (ChIP-seq27) in DN2-DN3 thymocytes (1 of n=2) intersecting jointly SMARCA4-induced, BCL11B-induced (top) and jointly SMARCA4-induced, BCL11b-repressed (bottom) TEFF loci. d, Representative genome browser of BAF155 CUT&RUN in sorted BCL11B WT vs. BCL11B cKO DN2-DN3 primary thymocytes (1 of n=3), BCL11B occupancy (ChIP-seq27) in DN2-DN3 thymocytes (1 of n=2), ATAC-seq in sorted BCL11B WT vs. BCL11B cKO primary DN2-DN3 thymocytes (1 of n=2), in vitro differentiated SMARCA4 WT vs. SMARCA4 cKO DN2-DN3 thymocytes (1 of n=2), in vitro differentiated SMARCA4 WT vs. SMARCA4 cKO DN2-DN3 thymocytes (1 of n=2), TEFF cells (1 of n=2) and BEFF cells (1 of n=2) at Il27 (TEFF=TH2) , Ctla4 (TEFF= CD8+ TRM), Plekhg6 (TEFF=CD8+ TEFF in vitro) (SMARCA4-induced, BCL11B-induced; left), Il17a (TEFF=TH17) and Tox2 (TEFF=TFH) (SMARCA4-induced, BCL11B-repressed; right) loci.
To test whether BCL11B and mSWI/SNF subunits were in discrete complexes, we determined the relative density of BCL11B-containing protein complexes. Contrary to previous studies47, we found that BCL11B-associated complexes were significantly more dense than canonical mSWI/SNF complexes in both total thymocytes from wild-type mice (SMARCA4 fractions 10-15 vs. BCL11B fractions 15-22) and CCRF-CEM cells (SMARCA4 fractions 12-16 vs. BCL11B fractions 15-18) (Fig. 5b and Extended Data Fig. 8i). Treatment with benzonase endonuclease did not alter the density sedimentation of the respective complexes through the glycerol gradient (Extended Data Fig. 8j), indicating the readouts were not dependent on DNA or RNA in the nuclear lysates. These data indicated that BCL11B was not a tightly associated, dedicated mSWI/SNF subunit in T cell progenitors, and that it was largely associated in a distinct complex. However, we found that increasing the nuclear lysate concentration by an order of magnitude to drive protein interactions was sufficient to induce a weak but detectable physical interaction between BCL11B and SMARCA4 (Extended Data Fig. 8k), suggesting the possibility that BCL11B might exhibit weak, but meaningful affinity to mSWI/SNF complexes.
To investigate whether BCL11B facilitated the interaction between other transcription factors and mSWI/SNF to overcome the nucleosomal barriers at TEFF loci, a process previously described as ‘assisted loading’ or ‘competitive cooperativity’50, 51, we performed BAF155 CUT&RUN in DN2-DN3 thymocytes sorted from BCL11B cKO or BCL11B WT mice. 78.9% of TEFF loci whose chromatin accessibility depended on both SMARCA4 and BCL11B in DN2a-DN3 thymocytes exhibited a profound loss of BAF155 occupancy in BCL11B cKO compared to BCL11B WT DN2-DN3 thymocytes (Fig. 5c,d and Extended Data Fig. 8l), indicating that BCL11B was a critical determinant of mSWI/SNF recruitment at TEFF loci. In contrast, 69.2% of BCL11B-repressed TEFF loci that were also SMARCA4-induced (e.g. Il17a, Tox2) exhibited a modest gain of BAF155 occupancy in BCL11B cKO compared to BCL11B WT DN2-DN3 thymocytes (Fig. 5c,d and Extended Data Fig. 8l), indicating BCL11B inhibited mSWI/SNF recruitment to TEFF loci enriched for NK and ILC function. mSWI/SNF occupancy at BCL11B-induced and BCL11B-repressed regions was highly correlated with the loss and gain of chromatin accessibility at the respective TEFF loci in BCL11B cKO DN2a-3 thymocytes (Fig. 5c,d), suggesting that BCL11B indirectly specified mSWI/SNF targeting to TEFF loci at these developmental stages.
BCL11B and RUNX1 cooperate to maintain mSWI/SNF at TEFF loci
Because BCL11B preferentially targets RUNX motifs27 and RUNX1 was reported to physically interact with mSWI/SNF in a Jurkat T cell line52, we investigated whether RUNX1 mediated the indirect cooperativity between BCL11B and mSWI/SNF. Published ChIP-seq datasets27 indicated that BCL11B co-localized to the same SMARCA4-induced TEFF loci as RUNX1 in DN2-DN3 thymocytes (Fig. 6a). Leveraging the ATAC-seq profiles from RUNX1 cKO and RUNX1 WT DN2a-DN3 thymocytes, we found that 81.1% of BCL11B-induced SMARCA4-induced TEFF loci had decreased chromatin accessibility in RUNX1 cKO compared to RUNX1 WT DN2a-DN3 thymocytes (Fig. 6b). We also found that 84.3% of BCL11B-repressed SMARCA4-induced TEFF loci exhibited loss in chromatin accessibility in RUNX1 cKO compared to RUNX1 WT DN2a-DN3 thymocytes (Fig. 6b), indicating that the increased accessibility observed at these regions in BCL11B cKO DN2a-DN3 thymocytes was dependent on RUNX1. These changes in chromatin accessibility had little correlation with local gene expression at the respective TEFF loci (Extended Data Fig. 7b-g).
Figure 6. BCL11B and RUNX1 cooperate to maintain mSWI/SNF at TEFF loci.
a, Representative heatmaps (1 of n=2 each) of BCL11B and RUNX1 occupancy (ChIP-seq27) in DN2-DN3 thymocytes over SMARCA4-induced TEFF loci. b, Scatter plot depicting the log2 fold-change of normalized ATAC-seq fragments at TEFF loci between in vitro differentiated RUNX1 WT vs. RUNX1 cKO DN2-DN3 thymocytes (n=2; horizontal axis) and sorted BCL11B WT vs. BCL11B cKO DN2-DN3 primary thymocytes (n=2; vertical axis). SMARCA4-induced TEFF loci (Benjamini-Hochberg-corrected FDR < 0.1) peaks highlighted in orange. Number and statistical enrichment of SMARCA4-induced TEFF loci (determined by one-sided Fisher’s exact test) within each Cartesian quadrant shown in orange. c, Reciprocal co-immunoprecipitations of IgG, RUNX1, SMARCA4 and BCL11B (columns) from nuclear extracts (1mg/mL) of primary murine thymocytes and immunoblots of co-immunoprecipitating SMARCA4, BCL11B and RUNX1 (rows). (Input sample, immunoprecipitant (IP), flow-through fraction of non-interacting proteins (FT), molecular weight markers (M)). d, Density sedimentation (glycerol gradient; horizontal axis) and immunoblot of SMARCA4, PBRM1, BCL11B and RUNX1 (rows) from nuclear extracts of total thymocytes from wild-type mice. 1mg total extract loaded onto gradient. e, Representative heatmaps of RUNX1 occupancy (ChIP-seq27) in BCL11B WT vs. BCL11B cKO DN2-DN3 thymocytes (1 of n=2), ATAC-seq in in vitro differentiated RUNX1 WT vs. RUNX1 cKO DN2-DN3 thymocytes (1 of n=2) and BAF155 occupancy (CUT&RUN) in in vitro differentiated RUNX1 WT vs. RUNX1 cKO DN2-DN3 thymocytes (1 of n=2) intersecting jointly SMARCA4-induced, BCL11B-induced (top) and jointly SMARCA4-induced, BCL11b-repressed (bottom) TEFF loci. f, Representative genome browser of RUNX1 occupancy (ChIP-seq27) in BCL11B WT vs BCL11B cKO DN2-DN3 thymocytes (1 of n=2), BCL11B occupancy (ChIP-seq27) in wild-type DN2-DN3 thymocytes (1 of n=2), BAF155 occupancy (CUT&RUN) in in vitro differentiated RUNX1 WT vs. RUNX1 cKO DN2-DN3 thymocytes (1 of n=2), ATAC-seq in in vitro differentiated RUNX1 WT vs. RUNX1 cKO DN2-DN3 thymocytes (1 of n=2), sorted BCL11B WT vs. BCL11B cKO DN2-DN3 primary thymocytes (1 of n=2) and TEFF cells (1 of n=2) at Ifng (TEFF=TH1), Il2 (TEFF=TH1) and Il17a (TEFF=TH17) (SMARCA4-induced) loci.
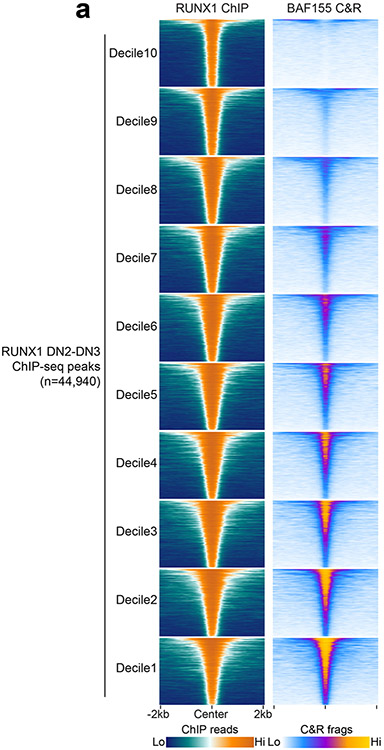
To test whether RUNX1 associated directly with mSWI/SNF in primary thymocytes, we performed reciprocal, depleting co-IPs from nuclear lysates of total thymocytes from wild-type mice. RUNX1 co-IPed with SMARCA4 at 300 mM salt concentrations independent of benzonase treatment (Fig. 6c). However, the majority of RUNX1 in the nuclear lysate did not interact with SMARCA4 and was observed in the IP flow-throughs (Fig. 6c), suggesting specific conditions, such as conformational states, might be necessary for interaction. To explore the potential heterogeneity of RUNX1 complexes, we performed density sedimentation in total thymocyte nuclear lysates from wild-type mice. RUNX1 was found across many fractions of varying densities (Fig. 6d), indicating distinct protein complexes competed for RUNX1 in the nucleus. Using the DN2-DN3 BAF155 CUT&RUN and RUNX1 ChIP-seq data from wild-type mice, we found that 56.6% of RUNX1-occupied genomic sites were also occupied by BAF155 (Extended Data Fig. 9a). Considering the strong preferential localization of mSWI/SNF to TEFF loci compared to other accessible regions in the DN2-DN3 thymocyte genome, these results suggested that the fraction of RUNX1 that localized at TEFF loci could be enriched in RUNX1-mSWI/SNF complexes relative to the heterogeneous pool of other RUNX1 complexes in the nucleus. We observed that most of the BCL11B in the nuclear lysate from total thymocytes from wild-type mice was pulled down by RUNX1 immunoprecipitation (Fig. 6c), suggesting that most BCL11B-associated complexes contained RUNX1. However, only a subset of the RUNX1 in the nucleus was pulled down by BCL11B immunoprecipitation (Fig. 6c), indicating the existence of heterogeneous RUNX1 complexes. Together, these data pointed to at least two distinct RUNX1 complexes, a BCL11B-associated complex and a mSWI/SNF-associated complex, that worked cooperatively to target and mediate remodeling of chromatin at TEFF loci.
Next, we tested whether cooperativity between BCL11B and RUNX1 was required for their mutual targeting to SMARCA4-induced TEFF loci. Analysis of published RUNX1 ChIP-seq data from Lin−c-Kit+CD25+ Bcl11bf/fCreERT2 DN2a-DN2b thymocytes27 showed that 87.5% of BCL11B-induced SMARCA4-induced TEFF loci exhibited loss in RUNX1 ChIP-seq read density in tamoxifen-treated (hereafter Bcl11b−/−) compared to ethanol-treated (hereafter Bcl11b+/+) Bcl11bf/fCreERT2 DN2a-DN2b thymocytes (Fig. 6e,f and Extended Data Fig. 8m), indicating that RUNX1 localization at these SMARCA4-induced TEFF loci was dependent on BCL11B. By contrast, 66.2% of BCL11B-repressed SMARCA4-induced TEFF loci exhibited gain in RUNX1 ChIP-seq read density in Bcl11b−/−) compared to Bcl11b+/+ DN2a-DN2b thymocytes, albeit at a lower magnitude (Fig. 6e,f and Extended Data Fig. 8m), comparable to the gain in BAF155 occupancy at these same regions in BCL11B cKO compared to BCL11B WT DN2-DN3 thymocytes. Using the BAF155 CUT&RUN data from RUNX1 cKO and RUNX1 WT DN2-DN3 thymocytes, we found that 72.9% of BCL11B-repressed SMARCA4-induced TEFF loci exhibited loss in BAF155 CUT&RUN fragment density in RUNX1 cKO compared to RUNX1 WT DN2-DN3 thymocytes (Fig. 6e,f). Together, these results suggested that BCL11B facilitated the prioritization of RUNX1-mSWI/SNF complexes away from more inflammatory TEFF loci shared with NK and ILCs (e.g. Il17a, Fcer1g) and towards other TEFF loci (e.g. Il2, Ifng, Il27, Ctla4), where a RUNX1-BCL11B associated complex and the RUNX1-mSWI/SNF complex potentially alternated occupancy at the same target sites in a ‘collaborative competition’50, 51 that resulted in a net increase in binding of both complexes.
PU.1 partners with RUNX1 to poise TEFF loci at ETP-DN2a stages
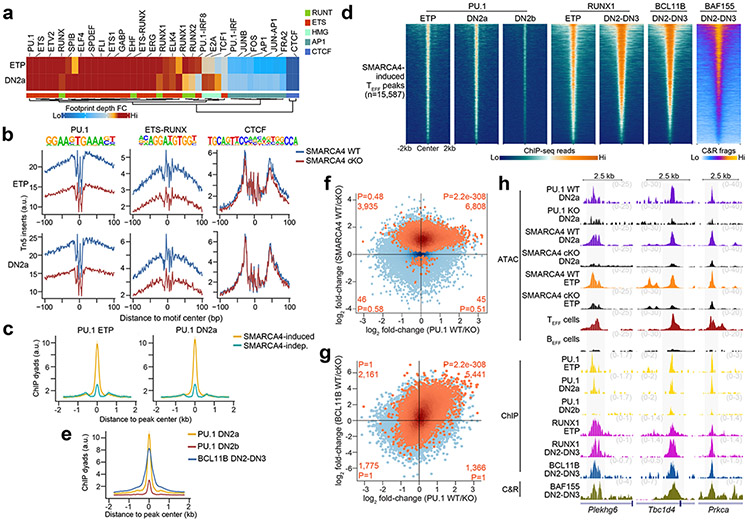
Next, we revisited the nature of the RUNX1-mediated induction of accessibility in ETP-DN2a thymocytes, prior to BCL11B expression. To identify potential transcription factors that cooperated with RUNX1 for mSWI/SNF recruitment to TEFF loci in ETP and DN2a thymocytes, we performed differential transcription factor footprinting at all known transcription factor motifs that resided within TEFF loci in ETP and DN2a thymocytes using the SMARCA4 cKO and SMARCA4 WT ATAC-seq datasets from these stages. Based on the differential footprint depth at target motifs between the SMARCA4 WT and SMARCA4-KO Tn5 insert profiles, PU.1 was identified as a potential RUNX1 partner for recruitment of mSWI/SNF to TEFF loci in ETP-DN2a thymocytes (Fig. 7a,b), consistent with the reported PU.1-dependent RUNX1 genomic targeting53 in ETPs and mSWI/SNF-dependent PU.1 genomic localization in myeloid cells54, 55. Analysis of published ChIP-seq datasets39 indicated that PU.1 had strong preferential binding to SMARCA4-induced compared to SMARCA4-independent TEFF loci in ETP and DN2a thymocytes (Fig. 7c), the same sites targeted by RUNX1 and mSWI/SNF complexes. Moreover, 88.1% of the SMARCA4-induced TEFF loci occupied by PU.1 in ETP and DN2a thymocytes were occupied by BCL11B in DN2-DN3 thymocytes (Fig. 7d,e) when PU.1 is no longer expressed. These observations suggested that BCL11B maintained chromatin accessibility at TEFF loci in DN2-DN3 thymocytes by maintaining the occupancy of RUNX1 and the associated mSWI/SNF complex that was initiated by PU.1 in ETPs.
Figure 7. PU.1 partners with RUNX1 to poise TEFF loci at ETP-DN2a stages.
a, Heatmap representing the fold-change in transcription factor footprint depth (flanking accessibility height/footprint base) between in vitro differentiated SMARCA4 WT and SMARCA4 cKO ETP and DN2a thymocytes (n=3 each) for previously identified motifs within TEFF loci. b, Representative transcription factor footprints (i.e. ATAC-seq inserts near motifs) at TEFF loci centered on PU.1, ETS-RUNX and CTCF motifs in in vitro differentiated SMARCA4 WT vs. SMARCA4 cKO ETP (1 of n=3; top) and DN2a (1 of n=3; bottom) thymocytes. c, Representative aggregate histograms of PU.1 occupancy (ChIP-seq39) at SMARCA4-induced and SMARCA4-independent TEFF loci in ETPs (left) and DN2a (right) thymocytes (1 of n=2 for each). d, Representative heatmaps of PU.1 occupancy (ChIP-seq39) in ETP, DN2a and DN2b thymocytes (1 of n=2 each), RUNX1 occupancy (ChIP-seq27, 42) in ETP and DN2-DN3 thymocytes (1 of n = 2 each), BCL11B occupancy (ChIP-seq27) in DN2-DN3 thymocytes and BAF155 occupancy (CUT&RUN) in in vitro differentiated DN2-DN3 thymocytes (1 of n=3) at SMARCA4-induced TEFF loci. e, Representative aggregate histograms of PU.1 occupancy (ChIP-seq39) in DN2a and DN2b thymocytes and BCL11B occupancy (ChIP-seq27) in DN2-DN3 thymocytes at SMARCA4-induced TEFF loci. f, Scatter plot depicting the log2 fold-change of normalized ATAC-seq fragments at TEFF loci between in vitro differentiated PU.1 WT vs. PU.1 cKO DN2a thymocytes53 (n=3; horizontal axis) and in vitro differentiated SMARCA4 WT vs. SMARCA4 cKO DN2a thymocytes (n=3; vertical axis). SMARCA4-induced TEFF loci (Benjamini-Hochberg-corrected FDR < 0.1) peaks highlighted in orange. Number and statistical enrichment of SMARCA4-induced TEFF loci (determined by one-sided Fisher’s exact test) within each Cartesian quadrant shown in orange. g, Scatter plot depicting the log2 fold-change of normalized ATAC-seq fragments at TEFF loci between in vitro differentiated PU.1 WT vs. PU.1 cKO DN2a thymocytes53 (n=3; horizontal axis) and sorted BCL11B WT vs. BCL11B cKO primary DN2-DN3 thymocytes (n=2; vertical axis). h, Representative genome browser of ATAC-seq in in vitro differentiated PU.1 WT vs. PU.1 cKO DN2a thymocytes53 (1 of n=3), in vitro differentiated SMARCA4 WT vs. SMARCA4 cKO DN2a thymocytes (1 of n=3), in vitro differentiated SMARCA4 WT vs. SMARCA4 cKO ETPs (1 of n=3), TEFF cells (1 of n = 2) and BEFF cells (1 of n = 2), PU.1 occupancy (ChIP-seq39) in wild-type ETP, DN2a and DN2b thymocytes (1 of n=2 each), RUNX1 occupancy (ChIP-seq27, 42) in wild-type ETP and DN2-DN3 thymocytes (1 of n=2 each), BCL11B occupancy (ChIP-seq27) in wild-type DN2-DN3 thymocytes (1 of n=2) and BAF155 occupancy (CUT&RUN) in wild-type DN2-DN3 thymocytes (1 of n=3) at Plekhg6 (TEFF= CD8+ TEFF in vitro), Tbc1d4 (TEFF=TFH) and Prkca (TEFF=TH1) loci.
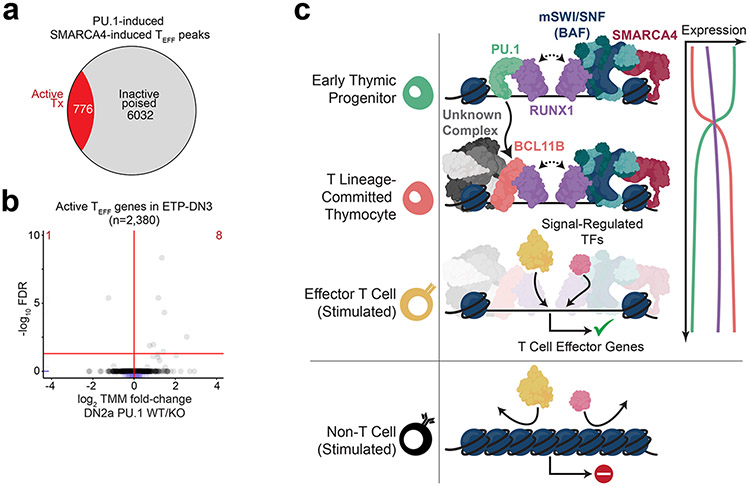
To determine the functional importance of PU.1 in establishing chromatin accessibility at TEFF loci, we compared accessibility landscapes generated from published ATAC-seq datasets53 between DN2a thymocytes from RosaCas9 mice transduced at the ETP stage with retrovirus encoding scrambled sgRNA (hereafter PU.1 WT) or sgRNA targeting Spi1, which encodes PU.1 (PU.1 KO). 63.3% of all SMARCA4-induced TEFF loci and 63.4% of the BCL11B-induced subset were diminished in PU.1 KO compared to PU.1 WT DN2a thymocytes (Fig. 7f-h), with no correlation to local mRNA expression53 at the respective TEFF loci (Extended Data Fig. 10a,b). These observations indicated that PU.1 and BCL11B acted as stage-specific RUNX1 partners that allowed the cooperative recruitment of mSWI/SNF to TEFF loci in ETP, DN2 and DN3 thymocytes (Extended Data Fig. 10c).
DISCUSSION
Here, we provide evidence that T cells specified lineage-specific effector activity through priming the chromatin landscape early in development, independently of the antigen receptor. This ‘effector licensing’ was mediated by a relay of transcription factors that conditions the genome for later targeting by signal-dependent transcription factors.
We identified that chromatin accessibility at TEFF loci was induced in ETPs, before commitment to the T cell lineage in DN2b thymocytes, indicating distinct mechanisms underlying T effector poising and lineage commitment. However, we found considerable overlap in the molecular determinants, especially pertaining to the cooperativity between RUNX1 and PU.1 or RUNX1 and BCL11B48, 53, 56. RUNX1 was shown to be largely localized to accessible regions of the genome (82.5%); however, chromatin accessibility did not strictly correlate with some of the changes in RUNX1 occupancy between ETPs and the DN2b/DN3 stage, which are associated with lineage commitment56. These results are consistent with our finding that the majority of mSWI/SNF targeting to TEFF loci in early T progenitors depended on RUNX1, but only a subset of RUNX1 in the nucleus physically associated with mSWI/SNF. Stoichiometric levels of RUNX1 were also shown to be limiting, as overexpression of RUNX1 resulted in localization at previously inaccessible regions enriched for NK or ILC-specific loci56. These results are consistent with our findings that Bcl11b deletion lead to a shift in RUNX1 and mSWI/SNF occupancy to TEFF loci that are normally repressed by BCL11B and have significant overlap with the NK and ILC regulatory landscapes.
Our findings highlight the uncoupling of the developmental acquisition of specialized effector potential and the signal-triggered gene expression that ultimately elicits specific effector activity. These results could reflect a design principle that allows distinct lineages of the immune system to use the same signaling pathways to execute disparate roles, which collectively orchestrate pathogen elimination, immune memory and tissue repair.
METHODS
Mice
Mice used in this study were housed in pathogen-free facilities at the University of Chicago or Stanford University. All mice were housed in positively pressurized individually ventilated cage racks and changed in biological safety cabinets. Cage supplies are sanitized using hot water (180°F). Bedding and shredded paper enrichment were autoclaved and cages were provided with irradiated food. Reverse Osmosis water was provided by an automated watering system directly to each cage. Rodent housing rooms were maintained at a 12-hour light / 12-hour dark cycle. Temperature and humidity were within the Guide for the Care and Use of Laboratory Animals recommended ranges: 68-79°F and 30-70% humidity. All experiments and animal use procedures were conducted in compliance with the National Institutes of Health Guide for the Care and Use of Laboratory Animals and were approved by the Institutional Animal Care and Use Committee (IACUC) at the University of Chicago and Stanford University. B6N.129S6-Gt(ROSA)26Sortm1(CAG-tdTomato*,-EGFP*)Ees/J (i.e. Rosa26nTnG), B6.129-Gt(ROSA)26Sortm1(cre/ERT2)Tyj/J (i.e. Rosa26CreERT2), B6.Cg-Tg(VAV1-cre)1Graf/MdfJ (i.e. Vav1-iCre) and C57BL/6J mice were purchased from Jackson Laboratories. Smarca4f/f mice were originally obtained from P. Chambon (University of Strasbourg)57, Bcl11bf/f mice were provided by M. Leid (Oregon State University)58 and Runx1f/f mice were provided by P. Liu (NIH/NHGRI), originally generated by D. Littman (New York University)59. These mice were bred to generate SMARCA4-KO (Smarca4f/fRosa26CreERT2/nTnG), BCL11B cKO (Vav1-Cre+Bcl11bf/f) and RUNX1-KO (Runx1f/fRosa26CreERT2/nTnG) strains for experiments. Bone marrow was harvested at 2-4 months of age. Primary thymocytes were harvested at 4-6 weeks of age. Sex-matched littermates were used for all genetic perturbations.
Cell lines and culture
OP9-DL4 cells were provided by their inventor, J. C. Zúñiga-Pflücker (University of Toronto). OP9-DL4 cells were cultured at 37°C and 5% CO2 in OP9 culture medium (MEM Alpha (Gibco) with 20% FBS (R&D Systems), 1% Penicillin-Streptomycin (Gibco)). CCRF-CEM (CCL-119) cells (human female) were purchased from ATCC. CCRF-CEM cells were authenticated by ATCC via short tandem repeat (STR) profiling. CCRF-CEM cells were cultured at 37°C and 5% CO2 in RPMI (Gibco) containing with 10% FBS (R&D Systems), 2mM L-glutamine (Gibco), 10mM HEPES (Gibco), 1mM sodium pyruvate (Gibco), 1% Penicillin-Streptomycin (Gibco). All cell lines showed expected cell surface protein expression and pro-T cell development proceeded as expected.
Flow cytometry and cell sorting
Cells were incubated for 15 minutes at 4°C with relevant antibody mix diluted in T cell FACS buffer (2% FCS, 0.5% BSA, 10 mM EDTA in PBS). Flow cytometry data were acquired and cell sorting was performed using FACS Symphony S6, FACSAria Fusion, or FACSAria II equipped with a 70 μm nozzle (BD Biosciences). Fluorochrome-conjugated monoclonal antibodies specific for mouse CD4 (clone GK1.5 1:150), CD8a (clone 53-6.7 1:150), γδTCR (clone GL3 1:150), CD11b (clone M1/70 1:150), CD11c (clone N418 1:150), CD19 (clone 6D5 1:150), CD45R / B220 (clone RA3-6B2 1:150), NK-1.1 (clone PK136 1:150), Ly-6G/Ly-6C / Gr-1 (clone RB6-8C5 1:150), Erythroid Cells (clone TER-119 1:150), CD25 (clone PC61, 1:100), CD44 (clone IM7 1:100), CD45 (clone 30-F11 1:100), CD117 / c-Kit (clone 2B8 1:100), Ly-6A/E / Sca-1 (clone D7 1:100), CD69 (clone H1.2F3 1:100), CD62L (clone MEL-14 1:100), TCR-β (clone H57-597 1:100) were purchased from BioLegend. Dead cells were excluded using DAPI (Invitrogen 1:20).
Isolation of Lin−Sca-1 c-Kit+ hematopoietic progenitors
Femurs and tibia of 2-4 month-old mice were mechanically liberated using a mortar and pestle to isolate bone marrow in OP9 media. Cells were filtered through 40 μm mesh strainer, red blood cells were lysed (BD PharmLyse) and CD4− CD8− CD11b− CD11c− CD19− GR-1− Ter119− NK1.1− γδTCR− cells were enriched using Direct Lineage Cell Depletion Cocktail (Miltenyi Biotec). Cells were stained with fluorescent antibodies in T cell FACS Buffer (2% FCS, 0.5% BSA, 10 mM EDTA in PBS) and sorted for DAPI− CD4− CD8− CD11b− CD11c− CD19− B220− GR-1− Ter119− NK1.1− γδTCR− Sca-1+ c-Kithi population into OP9 medium using aseptic FACS with Symphony S6, FACSAria Fusion, or FACS Aria II (BD Biosciences).
OP9 co-culture and differentiation
FACS-sorted primary Lin− Sca-1+ c-Kithi progenitors were co-cultured with OP9-DL4 cells as previously described.60 Briefly, sorted Lin− Sca-1+ c-Kithi progenitors were resuspended in OP9 culture medium supplemented with 5 ng /mL Flt-3L (R&D Systems), 1 ng/mL IL-7 (PeproTech) and 2.5 μg/mL Plasmocin Prophylactic (InvivoGen), then seeded onto 80%-90% confluent OP9-DL4 plates. Progenitors were split onto fresh OP9-DL4 plates every 4 days via mechanical liberation (without trypsin). For tamoxifen-inducible deletion at day 4 of co-culture, (Z)-4-Hydroxytamoxifen (Sigma) dissolved in ethanol was added to the supplemented OP9 culture medium at 1 μM for 30 hours. An equivalent volume of ethanol was added to the control samples. After 30 hours, progenitor cells were replated onto fresh OP9-DL4 plates. On Day 8 of co-culture, progenitor cells were mechanically liberated from co-culture dishes and differentiating T cell subsets were isolated via FACS. Live (DAPI−), lineage-negative (CD11b− CD11c− CD19− B220− GR-1− Ter119− NK1.1− γδTCR− EpCAM−), DN (CD4− CD8−) gated cells were sorted as “ETP” (CD25− c-Kithi), “DN2a” (CD25+ c-Kithi) and “DN3” (CD25+ c-Kit−). For genetic perturbations, DN subsets were additionally gated for tdTomato or GFP based on Cre activity as reported by the Rosa26nTnG allele. For inhibition of calcineurin activity, FK506 (Selleckchem) was added to supplemented OP9 culture medium at 30 nM at day 4 of co-culture. An equivalent volume of DMSO was added to the control samples. On Day 8 of co-culture, progenitors were mechanically liberated and FACS-sorted as described above.
Isolation of primary thymocytes
Thymi from 3-6 week-old mice were removed and small cortical incisions made prior to mechanical agitation with wide-bore glass pipettes in DMEM/F-12 (Gibco) to liberate thymocytes. BCL11B cKO thymi were digested with 1.25 μg/mL Collagenase IV (Sigma) and 1.0 μg/mL DNase I (Sigma) in DMEM/F-12 for 5 min at 37°C for efficient liberation of thymocytes. Cells were stained with antibodies in T cell FACS buffer and live, lineage-negative (DAPI− CD11b− CD11c− CD19− B220− Gr-1− Ter119− NK1.1− γδTCR−) gated cells were sorted as “DP” (CD4+ CD8+ TCR-βlo CD69−), “CD4SP” (CD4+ CD8− TCR-βhi) and “CD8SP” (CD4− CD8+ TCR-βhi). For isolation of DN thymocytes, cells were initially enriched via negative selection against CD8a using MACS with CD8a (Ly-2) microbeads (Miltenyi Biotec). Live, lineage-negative (DAPI− CD11b− CD11c− CD19− B220− Gr-1− Ter119− NK1.1− γδTCR−) DN (CD4− CD8−) cells were sorted as “ETP” (CD25− c-Kithi), “DN2a” (CD25+ c-Kithi), “DN3” (CD25+ c-Kit−) and “DN4” (CD25− c-Kit− CD44−).
Peripheral T cell isolation and stimulation
Spleen and lymph nodes from 3-6 week-old mice were isolated in RPMI 1640 (Gibco) supplemented with 10% FCS and 1% Penicillin-Streptomycin (10% RPMI). Cells were liberated by mincing with syringe plunger and filtered through 40 μm strainer. After ACK lysis, cells were stained with antibodies in T cell FACS buffer. Live, lineage-negative (DAPI− CD11b− CD11c− CD19− CB220− Gr-1− Ter119− NK1.1− γδTCR−) T cells (TCR-βhi) were sorted as “CD8+ TN” (CD8+ CD4− CD44lo CD62Lhi) and “CD4+ TN” (CD8− CD4+ CD44lo CD62Lhi). For in vitro T cell activation, 96-well tissue-culture-treated microtiter plates (Corning) were coated with 1 ug/ml anti-CD3ε (clone 145-2C11) and 2 ug/ml anti-CD28 (clone 37.51) and incubated at 37°C for 90 min. After 3 cold PBS washes, 200k FACS-sorted CD8+ or CD4+ TN cells were added to each well in 10% RPMI and incubated for 72 h at 37°C, 5% CO2. Live (DAPI−), activated T cells were FACS sorted as “CD4+ TEFF in vitro” or “CD8+ TEFF in vitro”.
ATAC-seq sample preparation
ATAC-seq was performed as previously described61 with minor modifications. For nuclei isolation of primary thymocytes or DN cells from OP9-DL4 co-cultures, 50,000-60,000 FACS-sorted cells were lysed in Thymocyte Hypotonic Buffer (25 mM HEPES, 5 mM MgCl2, 0.05 mM EDTA, 10% Glycerol, 0.1% NP40). For nuclei isolation of peripheral naïve T cells or in vitro activated T cells, 50,000-60,000 FACS-sorted cells were lysed in ATAC lysis buffer (10 mM Tris pH 7.4, 10 mM NaCl, 3 mM MgCl2, 0.1% Tween-20). Tagmentation reactions were performed for 30 minutes at 37°C using reagents from Illumina Tagment DNA TDE1 Enzyme and Buffer Kit. Tagmented DNA samples were purified with DNA Clean & Concentrator-5 kit (Zymo Research). Libraries were quantified by qPCR, amplified accordingly and purified using DNA Clean & Concentrator kit. Paired-end, dual-index sequencing was performed on the Illumina NextSeq500 platform.
RNA-seq sample preparation
50,000-100,000 primary thymocytes or DN cells from OP9-DL4 co-cultures were FACS-sorted directly into RULT lysis buffer from Qiagen RNeasy UCP Micro Kit and total RNA was extracted using manufacturer’s instructions. mRNA was enriched and RNA-seq libraries were constructed using the Illumina TruSeq Stranded mRNA Kit. Paired-end, dual-index sequencing was performed on the Illumina NovaSeq 6000 platform.
CUT&RUN sample preparation
CUT&RUN was performed as previously described41 with minor modifications. Briefly, 500k cells were washed 3x in Wash Buffer (20 mM HEPES pH 7.5, 150 mM NaCl, 0.5 mM spermidine, 1x EDTA-free protease inhibitor cocktail (Roche)), then bound to Concanavalin-A beads (Bangs Laboratories) according to manufacturer’s instructions. Cells were incubated with 1:100 dilution of anti-BAF155 antibody (G. Crabtree) for 2h or overnight at 4°C in Permeabilization Buffer (1x Permeabilization Buffer (eBioscience), 0.5 mM spermidine, 1x EDTA-free protease inhibitor cocktail, 2 mM EDTA). Sample was then incubated with 700 ng/mL pA-MNase (S. Henikoff) in Permeabilization Buffer at 4°C for 1h. Digestion was performed in 0.5x Permeabilization Buffer supplemented with 2 mM CaCl2 at 4°C for 1h. The reaction was stopped by the addition of 2x Stop Buffer (final concentration 100 mM NaCl, 10 mM EDTA, 2 mM EGTA, 20μg/mL glycogen, 25μg/mL RNase A (Thermo Fisher)) and the sample was incubated at 37°C for 20 min. Proteins in sample was then digested in 0.1% SDS and 250 μg/mL Proteinase K (New England Biolabs) for 2h at 56°C, shaking gently. CUT&RUN fragments were purified by phenol chloroform extraction. CUT&RUN libraries were generated using NEBNext UltraII DNA Library Prep Kit for Illumina coupled with NEBNext Multiplex Oligos for Illumina (New England Biolabs) with modifications optimized for small fragments as detailed in https://dx.doi.org/10.17504/protocols.io.wvgfe3w. Paired-end, dual-index sequencing was performed on the Illumina NextSeq500 platform.
Preparation of nuclear extracts
CCRF-CEM cells or thymocytes from 3-6 week-old mice were liberated as above and resuspended in Thymocyte Hypotonic Buffer supplemented with 1 mM DTT, 1 mM PMSF and 1x cOmplete protease inhibitor cocktail (Roche). Following 15-minute hypotonic lysis on ice, nuclei were centrifuged at 700 x g and resuspended in 600uL per 200e6 cells of Buffer C (10 mM HEPES pH 7.5, 100 mM NaCl, 0.1 mM EDTA, 3 mM MgCl2, 10% Glycerol). Ammonium sulfate was added drop-wise to 150 mM and samples rotated at 4°C for 30 minutes. Lysates were centrifuged at 435,400 x g (100,000 RPM) in TLA 120.2 rotor (Beckman Coulter) for 10 minutes at 4°C. Supernatant was transferred to an ice-chilled tube and proteins were precipitated with 0.33 mg/μL ammonium sulfate on ice for 20 minutes. Lysates were centrifuged once more at 435,400 x g for 10 minutes. Supernatant was discarded and pellets were used for downstream applications.
Density gradient sedimentation
Nuclear extracts were reconstituted in 0% glycerol HEMG buffer (25 mM HEPES pH 7.9, 0.1 mM EDTA, 12.5 mM MgCl2, 100 mM NaCl) supplemented with 1 mM DTT, 1 mM PMSF and 1x cOmplete protease inhibitor cocktail. For samples treated with benzonase, benzonase (Sigma 9025-65-4) was added to the nuclear extract (≥25 units/μL) and sample was pipette-mixed and incubated on ice for 30 minutes. 1 mg of nuclear extract (200 μL) was overlaid onto a 10-30% glycerol gradient (in HEMG buffer) prepared in 14 x 89 mm polypropylene centrifuge tubes (Beckman Coulter). Tubes were centrifuged at 274,400 x g (40,000 RPM), 16 hours, 4°C in a SW41-Ti rotor. 500 μL fractions were collected and subjected to immunoblotting directly or after concentrating using 50 μL StrataClean Resin (Agilent Technologies).
Co-immunoprecipitation
Nuclear extracts were reconstituted in EB300, EB150, or EB50 buffer (50 mM Tris-HCl pH 7.5, 1 mM EDTA, 1 mM MgCl2, 1% NP-40, with 300 mM or 150 mM or 50 mM NaCl, respectively), supplemented with 1 mM DTT, 1 mM PMSF and 1x cOmplete protease inhibitor cocktail tablet and volume adjusted to 1 mg/mL or 10 mg/mL. Nuclear extracts were incubated overnight with antibodies against SMARCA4 (Abcam, clone EPNCIR111A, 0.01 ug/ul), PBRM1/BAF180 (Cell Signaling Technology, clone D3F7O, 1:50), BCL11B (Cell Signaling Technology, clone D6F1, 1:100), RUNX1 (Thermo, polyclonal; Cell Signaling Technology, clone D4A6, 0.01 ug/ul), mouse IgG (Santa Cruz, 0.01 ug/ul) or rabbit IgG (EMD Millipore, 0.01 ug/ul). Washed Protein G Dynabeads (Invitrogen) were added to samples for 3 hours. Immunoprecipitants (IPs) were harvested by magnetic separation and remaining ‘supernatant’ was stored as “flow-thru” samples. IP samples were washed 3 times in EB300, resuspended in LDS loading buffer with 100 mM DTT and incubated at 70°C for 10 minutes. Dynabeads were removed and remaining samples were subjected to Western blots.
Immunoblotting
Proteins were separated on a 4-12% PAGE gel (Invitrogen), transferred onto a PVDF membrane (Millipore), blocked with 5% milk in TBST (20 mM Tris pH 7.6, 150 mM NaCl, 0.1% Tween-20) for 1 hour at RT and incubated overnight at 4°C with primary antibodies: rabbit anti-mouse BAF155 (courtesy of Crabtree Laboratory, 1:1000), rabbit anti-SMARCA4 (Abcam, clone EPNCIR111A, 1:1000), mouse anti-human SMARCA4 (Santa Cruz Biotechnology, clone G-7, 1:1000), rabbit anti-PBRM1 (Cell Signaling Technology, clone D3F7O, 1:1000), rabbit anti-human BCL11B (Thermo, polyclonal, 1:1000), mouse anti-human RUNX1 (Santa Cruz Biotechnology, clone A-2, 1:1000). Membranes were washed three times with TBST and incubated with secondary fluorophore-conjugated antibodies (Bio-Rad) for 1 hour at RT. Membranes were washed three times with TBST and imaged using Bio-Rad ChemiDoc MP Imaging System.
ATAC-seq pre-processing and peak definitions
Adaptor sequences were trimmed using SeqPurge (v2019_11). Trimmed reads were mapped to mm10 mouse genome assembly using Bowtie2 (v2.2.9) with settings --very-sensitive -X 2000. PCR duplicates were removed using Picard (v2.21.8) MarkDuplicates REMOVE_DUPLICATES=true VALIDATION_STRINGENCY=LENIENT. Reads with MAPQ scores below 30 were purged using samtools (v1.9) view with settings -b -q 30 -f 2 -F 1804. Peaks were called for each sample using MACS2 (v2.2.7.1) with settings --shift -75 --extsize 150 --nomodel --call-summits --nolambda --keep-dup all -p 0.01 --min-length 100. For each sample, a 501 bp fixed-width peak set was generated by extending the MACS2 summits by 250 bp in both directions. Peaks were ranked by significance (MACS2 peak score) and overlapping peaks with lower peak scores were removed iteratively to create non-overlapping sample peak sets. To facilitate comparison of peaks across samples, each peak’s ‘score-per-million’ (SPM) was calculated by dividing the peak score by the sum of all peak scores in the sample, divided by 1 million. All sample peak sets were merged, less significant overlapping peaks removed and remaining peaks were filtered for those that were observed in at least two samples with an SPM value ≥ 5. We removed peaks mapping to chrY as well as any that spanned genomic regions containing “N” nucleotides. We then removed any peak that overlapped with those called in activated B cell samples to create a “Total T cell” merged peak set. To identify T effector-specific peaks, sample peak sets from only peripheral T effector samples were merged and processed as above for non-overlapping, robust, reproducible peaks purged of activated B cell peaks. To account for less robust but significant T effector peaks which were robustly accessible in early thymocyte development, we added filtered sample peaks from ETP-DN4 stages (reproducible, SPM ≥ 5) that overlapped with reproducible T effector peaks at SPM ≥ 2 to this initial filtered T effector merged set. This merged set was again filtered for non-overlapping, robust (SPM ≥ 5), reproducible peaks purged of activated B cell peaks to generate the final union peak set referred to as ‘T effector loci’ (TEFF loci). Peaks from the “Total T cell” merged peak set that did not overlap with TEFF loci are collectively referred to as ‘Non-TEFF peaks’. To generate peak-by-sample count matrices, ATAC-seq fragment counts within each peak were normalized by the number of inserts intersecting nucleosome-depleted promoter regions (−300 bp to +100 bp relative to transcriptional start-sites).
Differential chromatin accessibility analysis
Differential accessibility was assessed using Limma (v3.50.1) in R. P-values for regression coefficient estimates representing variation due to genotype were corrected for multiple-testing using the Benjamini-Hochberg false discovery rate (FDR) method. Peaks exhibiting FDR < 0.1 were regarded as significant. To define a collective set of ‘SMARCA4-dependent TEFF loci’, we pooled the peaks that become differentially accessible at the respective ETP (n=5,209), DN2a (n=6,985) and DN3 (n=3,393) stages for a grand total of 15,587 SMARCA4-induced peaks. To define a collective set of ‘SMARCA4-independent TEFF loci’, we selected peaks with FDR > 0.5 and exhibiting differences in fold-change of normalized ATAC-seq fragments between SMARCA4 WT and SMARCA4 cKO samples at > 0.9 and < 1.1 at all stages of T cell development that were assessed (n=16,374 peaks). One-sided Fisher’s exact tests were performed for over-representation in quadrants of fold-change vs. fold-change scatter plots. Mann-Whitney U-tests were performed to identify significant differences at medians of pairwise comparisons in cumulative distribution function plots.
Transcription factor motif enrichment and footprinting
Enrichment of transcription factor binding motifs within peaks was computed using HOMER (v4.11.1) findMotifsGenome.pl with settings -size 501 -mask. TF footprinting was assessed by plotting normalized counts of ATAC 5’ inserts spanning a 200 bp window relative to the motif center. Footprint counts were normalized by the number of inserts intersecting nucleosome-depleted promoter regions (−300 bp to +100 bp relative to transcriptional start-sites). TF footprint depth was calculated by dividing the “flanking accessibility” by the “footprint base”. Footprint base = normalized ATAC insert counts within +/− 5 bp of motif center. Flanking accessibility = normalized ATAC insert counts within 20 bp regions flanking the ends of the footprint base. Footprint base and flanking accessibility counts were divided by the “footprint background” which was the normalized ATAC insert counts at a 40 bp region 1 kb upstream of the motif center.
RNA-seq data processing
Adaptor sequences were trimmed using SeqPurge (v2019_11). Trimmed RNA-seq reads were mapped to the mm10 mouse genome assembly using TopHat (v2.1.1) with settings –microexon-search. Unmapped, unpaired and low quality reads (MAPQ < 5) were removed using samtools (v1.9) view with settings -q 5 -f 2. Paired reads were counted for each gene using featureCounts from Subread (v2.0.1). ‘Transcripts-per-million’ (TPM) values were calculated for each gene to quantify the relative abundance of transcripts for clustering analysis. ‘Trimmed mean of M values’ (TMM) was calculated for each gene for differential comparisons across samples using edgeR (calcNormFactors). Common dispersions were estimated using estimateCommonDisp and Benjamini-Hochberg false discovery rates (FDRs) were calculated for pairwise comparisons using exactTest. Genes exhibiting FDR < 0.05 were regarded as significant.
Protein interaction network
Known subunits of the mSWI/SNF, ISWI, INO80, COMPASS, Cohesin complexes and the TFs representing the top motif enrichments of accessible TEFF loci in early thymocyte progenitors were used as inputs to the STRING (v11.5) database (http://string-db.org/) to construct a putative protein-protein interaction network. Parameters were set to Full STRING network for high confidence (0.700) interactions using Experiments, Databases and Textmining as Active Interaction Sources. MCL clustering of the interaction network was performed with inflation parameter = 2.
CUT&RUN data processing
CUT&RUN reads were mapped to mm10 mouse genome assembly using Bowtie2 (v2.2.9) with settings --local --very-sensitive-local –no-unal –no-mixed –no-discordant –phred33 -I 10 -X 700. PCR duplicates were removed using Picard (v2.21.8) MarkDuplicates REMOVE_DUPLICATES=true VALIDATION_STRINGENCY=LENIENT. Reads with MAPQ scores below 30 were purged and excluded from downstream analysis using samtools (v1.9) view -b -q 30 -f 2 -F 1804. To generate ATAC peak-by-sample count matrices, CUT&RUN fragment counts within each peak were normalized by the number of fragments intersecting nucleosome-depleted promoter regions (−300 bp to +100 bp relative to transcriptional start-sites).
ChIP-seq data processing
ChIP-seq reads were mapped to mm10 mouse genome assembly using Bowtie2 (v2.2.9) with settings --very-sensitive -X 2000. PCR duplicates were removed using Picard (v2.21.8) MarkDuplicates REMOVE_DUPLICATES=true VALIDATION_STRINGENCY=LENIENT. Reads with MAPQ scores below 30 were purged and excluded from downstream analysis using samtools (v1.9) view -b -q 30 -F 1796. To generate ATAC peak-by-sample count matrices, ChIP-seq read counts within each peak were normalized by sequence depth.
Genome Browser and Heatmap Visualizations
BedGraph files for ATAC-seq, ChIP-seq and CUT&RUN datasets were generated using bedtools (v2.27.1) genomecov and normalized as described above. BedGraphs were converted to BigWig format using bedGraphToBigWig (v4) and uploaded to the UCSC genome browser (http://genome.ucsc.edu/) for visualization. Heatmaps of normalized fragments/reads across genomic regions of interest were visualized using deepTools (v3.5.1) computeMatrix and plotHeatmap with settings -bs 100 --missingDataAsZero --skipZeros --referencePoint center.
Statistics and reproducibility
All experimental findings were reliably reproduced with at least 2 biologically independent replicates for all experiments (except for ATAC-seq of CD4 SP and CD4 naive T cells for which data was only taken from one biological replicate as they largely recapitulate the data from CD8 SP and CD8 Naive T cells (performed with two biological replicates) and is not the stage in T development the manuscript focuses on). No statistical method was used to determine sample size. The number of replicates performed was determined based on those of previous related studies42, 56, 62, 63, 64. No animals or samples were excluded from analysis. No method of randomization was used. Investigators were not blinded to experimental group allocations. All controls and perturbations were performed on sex-matched littermates. All experimental and bioinformatic processing for control and perturbation groups was performed identically, together and in parallel for each replicate. All statistical tests performed were non-parametric. For all statistical tests, P-values, sample sizes and test “sidedness” (if applicable) are provided.
Extended Data
Extended Data Figure 1. T effector loci reflect the chromatin and transcriptional profiles of major T effector subtypes.
a, Heatmap of Z scores of TPM-normalized RNA-seq reads across the k-means clustered (k=7) transcriptomes (less genes robustly expressed in BEFF cells) of sorted CD4+CD44+TCRβlo splenic T cells21 18h post-injection with CD3/CD40 Abs (hereafter CD4+ TEFF cd3/cd40), splenic CD19−CD8−TCRβ+CD4+ T cells21 (hereafter CD4+ Tpan), TCM, CD8+ TEFF, TRM, TH17CNS, TH17gut, TFH, TH1, TH2 and CD11b−NK-1.1−TCRβ−CD138+Blimp1intMHCIIhi plasmablast cells21 (hereafter PBEFF) (n=2 each). b, Distribution of genomic displacement of T effector loci (hereafter TEFF loci) in relation to the nearest TSS (signed logarithmic scale). c, Heatmap of statistical enrichment (one-sided Fisher’s exact test) of TEFF peaks whose nearest gene is in RNA-seq k-means cluster i (horizontal axis) within an ATAC-seq k-means cluster j (vertical axis; see Fig. 1a). d-g, Representative flow cytometry plots illustrating gating strategy for in vivo DN thymocyte FACS. h, Representative distribution (for all ATAC-seq samples) of normalized Tn5 insertions within 2 kb of transcriptional start-sites (TSS). i, Representative genome browser of ATAC-seq in ESC29, HSC11, MPP11, CLP11, ETP, DN2a, DN3, DN4, DP, CD8 SP, TN, TEFF cells and BEFF cells at Gzmb (TEFF=CD8+ TEFF in vitro) and Ifng (TEFF=TH1) loci (1 of n=2 for each). Adjoined bars indicate RNA-seq-determined transcripts-per-million (TPM) in each cell type.
Extended Data Figure 2. Establishment and maintenance of chromatin accessibility at TEFF loci in early T cell development.
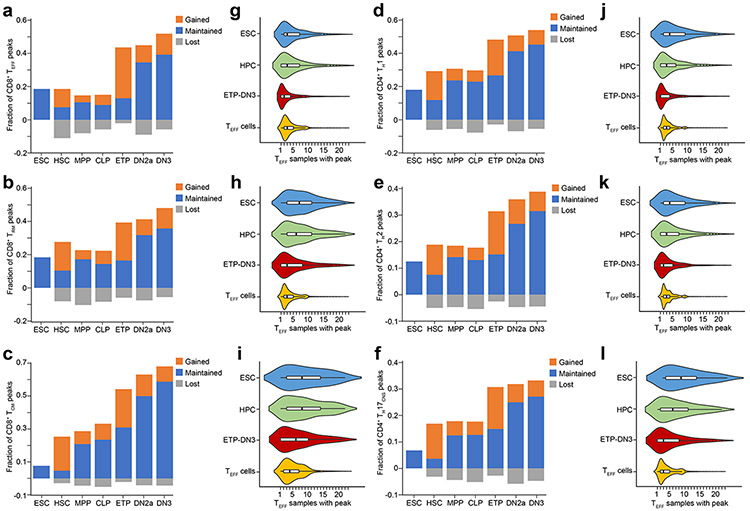
a-f, Bar plots representing the fraction of CD8+ TEFF-specific (a), CD8+ TRM-specific (b), CD8+ TCM-specific (c), CD4+ TH1-specific (d), CD4+ TH2-specific (e), CD4+ TH17-specific (f) ATAC-seq peaks that became accessible (orange), are maintained accessible from previous stage (blue) or are no longer accessible relative to previous stage (gray) at ESC, HSC, MPP, CLP, ETP, DN2a and DN3 stages. g-l, Corresponding violin plots (boxes represent 25th, 50th and 75th percentiles; whiskers represent median +/− 1.5 interquartile range) representing the number of overlap between each ATAC-seq peak from CD8+ TEFF-specific (g), CD8+ TRM-specific (h), CD8+ TCM-specific (i), CD4+ TH1-specific (j), CD4+ TH2-specific (k), CD4+ TH17-specific (l) ATAC-seq profiles, grouped by the developmental windows (ESC, HPC, ETP-DN3 and respective TEFF cells) during which the ATAC-seq peak first became accessible.
Extended Data Figure 3. Chromatin accessibility at TEFF loci in early T cell progenitors is not dependent on calcineurin activity.
a, Representative aggregate histograms (1 of n=2) of ATAC-seq Tn5 insertions in in vitro differentiated FK506-treated (calcineurin inhibitor) vs. DMSO-treated (control) ETP-DN3 thymocytes at TEFF loci that first became accessible in ETP-DN3 thymocytes. b, Representative heatmaps (1 of n=2) of ATAC-seq in in vitro differentiated FK506-treated (calcineurin inhibitor) vs. DMSO-treated (control) ETP-DN3 thymocytes at TEFF loci that first become accessible in ETP-DN3 thymocytes.
Extended Data Figure 4. Enhancer priming mediates early chromatin accessibility at TEFF loci.
a, Heatmap of Z scores of TPM-normalized RNA-seq reads across the k-means clustered (k=10) transcriptomes (less genes robustly expressed in PBEFF cells) of ETP, DN2a, Lin−c-KitintCD25hiCD44hiCD4−CD8− (DN2b), DN3, CD4+ TEFF cd3/cd40, CD4+ Tpan, TCM, CD8+ TEFF, TRM, TH17CNS, TH17gut, TFH, TH1 and TH2 cells (n=2 for each). b, Heatmap of Z scores of TSS-normalized ATAC-seq fragments across the k-means clustered (k=9) TEFF loci in ETP, DN2, DN3, TRM, CD8+ TEFF in vitro, CD8+ TEFF, TCM, TH1, TH2, TH17CNS, TH17gut, TFH cells and BEFF cells (n=2 each). Labeled columns highlight ATAC-seq peaks whose nearest gene represents a canonical gene reflective of a distinct T effector program. c, Representative aggregate histograms of H3K4me131 (1 of n=2), H3K4me331 (1 of n=2), H3K27ac32 (1 of n=2) or RNA Polymerase II31 (POL II) (1 of n=2) ChIP-seq or GRO-seq dyads intersecting all TEFF loci (blue), TEFF loci near active genes in ETP-DN3 cells (blue) and all non-TEFF loci (green) in DN2-DN3 thymocytes. d, Representative aggregate histograms of H3K4me131 (1 of n = 2), H3K4me331 (1 of n = 2) ChIP-seq dyads at promoter vs. gene-distal TEFF loci in DN2-DN3 thymocytes.
Extended Data Figure 5. Signal-regulated transcription factors localize to developmentally poised TEFF loci in activated TEFF cells.
a, Heatmaps and aggregate histograms of JUNB occupancy (ChIP-seq45) in TH1 cells (n=1), JUNB in TH17 cells40 (1 of n=2), JUND occupancy (ChIP-seq40) in TH17 cells (n=1) at TEFF loci that contain Jun motifs. b, Heatmap and aggregate histogram of NFκB-p65 occupancy (ChIP-seq43) in in vitro activated TEFF cells (1 of n=2) at TEFF loci that contain NFκB-p65 motifs. c, Heatmap and aggregate histogram of NFATc2 occupancy (ChIP-seq41) in CD8+ TEFF cells (n = 1) at TEFF loci that contain NFATc2 motifs. d, Heatmap and aggregate histogram of BATF occupancy (ChIP-seq39) in TH17 cells (1 of n=2) at TEFF loci that contain BATF motifs. e, Heatmaps and aggregate histograms of STAT1 occupancy (ChIP-seq6) in TH1 cells (n=1), STAT4 occupancy in TH1 cells (ChIP-seq44) (1 of n=2), STAT3 occupancy (ChIP-seq42) in CD8+ TEFF cells (1 of n=2) and STAT5 occupancy (ChIP-seq42) in CD8+ TEFF cells (1 of n=2) at TEFF loci that contain STAT motifs. For this figure only, TEFF loci (rows) in each heatmap were sorted independently and do not correspond to other heatmaps in the group.
Extended Data Figure 6. Smarca4 deletion inhibits chromatin poising of TEFF loci in DN thymocytes.
a, Representative gating strategy for FACS of primary Lin− Sca-1+ c-Kit+ hematopoietic progenitors without Cre activity from Smarca4f/fRosaCreERT2/nTnG bone marrow cells. b, Representative gating strategy for FACS of ETP-DN3 thymocytes with or without Cre activity from OP9-DL4 in vitro differentiation co-cultures. c, Representative heatmaps of normalized ATAC-seq in in vitro differentiated SMARCA4 WT vs. SMARCA4 cKO ETP (1 of n=3), DN2a (1 of n=3) and DN3 (1 of n=2) thymocytes and BAF155 occupancy (CUT&RUN) in DN2-DN3 thymocytes (1 of n=3) across SMARCA4-induced TEFF loci that first became accessible in ETP, DN2a and DN3 stages (rows). d, Representative aggregate histograms of BAF155 occupancy (CUT&RUN) in DN2-DN3 thymocytes (1 of n=3) across TEFF loci (blue) and Non-TEFF loci (red). e, Fraction of transcriptionally active SMARCA4-induced loci in ETP, DN2a, and DN3 thymocytes (n=2 each). f, Volcano plots of differential gene expression between in vitro differentiated SMARCA4 WT vs. SMARCA4 cKO ETP and DN2-DN3 thymocytes (n = 2 each) across actively transcribed T effector genes. Marginal rugs (blue lines) indicate distribution of values along each axis.
Extended Data Figure 7. Runx1 perturbation in early T cell development.
a, Representative gating strategy for FACS of ETP-DN3 thymocytes with or without Cre activity from OP9-DL4 in vitro differentiation co-cultures derived from Lin−Sca-1+c-Kithi hematopoietic progenitors of Runx1f/fRosaCreERT2/nTnG mice. b-d, Fraction of transcriptionally active RUNX1-induced loci in ETP (b), DN2a (c) and DN3 (d) thymocytes (n=2). e-g, Volcano plot of differential gene expression between in vitro differentiated RUNX1 WT vs. RUNX1 cKO ETP (e), DN2a (f) and DN3 (g) thymocytes (n=2) across actively transcribed T effector genes. Marginal rugs (blue lines) indicate distribution of values along each axis.
Extended Data Figure 8. SMARCA4 and BCL11B cooperate indirectly to promote chromatin accessibility at T effector loci in DN thymocytes.
a, Representative gating strategy for FACS of DN2-DN3 thymocytes from sex-matched littermates of Vav1-iCre+Bcl11bf/f or Bcl11bf/f mice. b, Top: Scatter plot depicting the log2 fold-change of normalized ATAC-seq fragments at TEFF loci between sorted BCL11B WT vs. BCL11B cKO primary DN2a thymocytes (n=2; horizontal axis) and in vitro differentiated SMARCA4 WT vs. SMARCA4 cKO DN2a thymocytes (n=3; vertical axis). SMARCA4-induced TEFF loci (Benjamini-Hochberg-corrected FDR < 0.1) peaks highlighted in orange. Number and statistical enrichment of SMARCA4-induced T effector loci (determined by one-sided Fisher’s exact test) within each Cartesian quadrant shown in orange. Bottom: Same as above between sorted BCL11B WT vs. BCL11B cKO DN3 primary thymocytes (n=2; horizontal axis) and in vitro differentiated SMARCA4 WT vs. SMARCA4 cKO DN3 thymocytes (n=2; vertical axis). c, Fraction of transcriptionally active jointly SMARCA4-induced BCL11B-induced TEFF loci in DN2-DN3 thymocytes (left; n=2) and of transcriptionally active jointly SMARCA4-induced BCL11B-repressed loci in DN2-DN3 thymocytes (right; n=2). d, Volcano plots of differential gene expression between sorted BCL11B WT vs. BCL11B cKO ETP-DN3 primary thymocytes (n=2) across actively transcribed T effector genes. Marginal rugs (blue lines) indicate distribution of values along each axis. e, MA plot depicting the log2 fold-change of normalized ATAC-seq fragments at TEFF loci between sorted BCL11B WT vs. BCL11B cKO DN2-DN3 primary thymocytes (n=2). Statistically significant differentially expressed peaks (Benjamini-Hochberg-corrected FDR < 0.1) are highlighted in orange. f, Representative aggregate histograms of ATAC-seq at jointly SMARCA4-induced BCL11B-induced vs. jointly SMARCA4-induced BCL11B-repressed TEFF loci in sorted BCL11B WT primary thymocytes (1 of n=2). g, Bar plots representing the fraction of jointly SMARCA4-induced BCL11B-induced vs. jointly SMARCA4-induced BCL11B-repressed TEFF loci in DN2-DN3 thymocytes that are also accessible in NK cells and ILCs (merged ILC1, ILC2, ILC3)11. h, Reciprocal co-immunoprecipitations of IgG, SMARCA4, BCL11B and PBRM1 (columns) from nuclear extracts (1mg/mL) of CCRF-CEM human T cell line and immunoblots of co-immunoprecipitating SMARCA4, PBRM1 and BCL11B (rows). (Input sample, immunoprecipitant (IP), flow-through fraction of non-interacting proteins (FT), molecular weight markers (M)). i, Density sedimentation (glycerol gradient; horizontal axis) and immunoblot of SMARCA4, PBRM1 and BCL11B (rows) from nuclear extracts of CCRF-CEM human T cell line. 1mg total extract loaded onto gradient. j, Density sedimentations (glycerol gradient; horizontal axes) and immunoblots of SMARCA4, PBRM1 and BCL11B (rows) from untreated nuclear extracts (left) and benzonase-treated nuclear extracts (right) of total thymocytes from WT mice. 1mg total extract loaded onto each gradient. k, Reciprocal co-immunoprecipitations of IgG, SMARCA4, BCL11B and PBRM1 (columns) from high-concentration nuclear extracts (10mg/mL) of total thymocytes from wild-type mice and immunoblots of co-immunoprecipitating SMARCA4, PBRM1 and BCL11B (rows). (Input sample, immunoprecipitant (IP), flow-through fraction of non-interacting proteins (FT), molecular weight markers (M)). l, Representative aggregate histograms of BAF155 occupancy (CUT&RUN) at jointly SMARCA4-induced, BCL11B-induced (left) vs. jointly SMARCA4-induced, BCL11B-repressed (right) T effector loci in sorted BCL11B WT vs. BCL11B cKO primary DN2-DN3 thymocytes (1 of n=2). m, Cumulative distribution functions of the log2 fold-change in RUNX1 occupancy (ChIP-seq32) between sorted BCL11B WT and BCL11B cKO primary DN2-DN3 thymocytes at BCL11B-induced, BCL11B-independent and BCL11B-repressed (n=2) TEFF loci. P-values from one-sided Wilcoxon signed-rank tests (using BCL11B-independent distribution as the null) are displayed.
Extended Data Figure 9. mSWI/SNF-associated RUNX1 complexes are a subset of a heterogeneous pool of RUNX1 complexes in the nucleus.
a, Representative heatmaps of RUNX1 occupancy (ChIP-seq32) (left; 1 of n=2) and BAF155 occupancy (CUT&RUN) (right; 1 of n = 3) across all RUNX1 ChIP-seq peaks in DN2-DN3 thymocytes partitioned by BAF155 fragment density decile (rows).
Extended Data Figure 10. Working model of transcription factor relay for specification of T effector potential.
a, Fraction of transcriptionally active jointly SMARCA4-induced, PU.1-induced loci in in vitro differentiated DN2a thymocytes (n=3). b, Volcano plot of differential gene expression between in vitro differentiated PU.1 WT vs. PU.1 cKO DN2a thymocytes (n=2) across actively transcribed T effector genes. Marginal rugs (blue lines) indicate distribution of values along each axis. c, Schematic of cooperative transcription factor relay that recruits and maintains mSWI/SNF occupancy at TEFF loci to equip thymocytes for T effector potential.
Supplementary Material
ACKNOWLEDGMENTS
We are grateful to M. Leid (Oregon State University) for Bcl11b f/f mice; P. Liu (NIH/NHGRI) for Runx1 f/f mice; J.C. Zúñiga-Pflücker (University of Toronto) for OP9-DL4 cell line; S. Henikoff (Fred Hutchinson Cancer Center) for protein A-MNase; and C. Chang, B. Shin, V. Cismasiu, D. Avram for CUT&RUN troubleshooting. We thank S. Smale, A. Weinmann, C. Kadoch and members of the Koh Lab for critical reading of the manuscript. This work was supported by grants from the National Institute of Health (R35-GM138150, 2UL1TR002389-06, 5UL1TR002389-04 to A.S.K.; CA-163915 to G.R.C., T32-EB009412, T32-AI07090 to N.G.; T32-CA009594 to J.M.; and T32-GM139782 to O.B.); the Howard Hughes Medical Institute (to G.R.C.); and the Chan Zuckerberg Biohub (to W.J.G.). Fellowship support was provided by: The Stamps Scholarship (to A.B.); University of Chicago Women’s Board (to C.K.); Stanford Immunology Baker Fellowship and Korea Foundation for Advanced Studies Overseas PhD Scholarship (to Y.K.); JIMB/NIST training program (to B.P.); and The Stanford Genome Training Program (NIH/NHGRI) (to S.K.). Flow cytometry was supported by the University of Chicago Human Disease and Immune Discovery Facility (RRID:SCR_022936), the Cytometry and Antibody Technology Facility (RRID:SCR_017760); and the Stanford Shared FACS Facility (NIH S10RR025518). Genomics sequencing was supported by the University of Chicago Genomics Facility (RRID:SCR_019196), which receives support from the Cancer Center Support Grant (P30-CA014599).
Footnotes
DECLARATION OF INTERESTS
G.R.C. is a founder and stockholder in Foghorn Therapeutics. W.J.G. is a consultant and equity holder for 10X Genomics, Guardant Health, Quantapore and Ultima Genomics. W.J.G. is a co-founder of Protillion Biosciences and named on patents describing ATAC-seq. The other authors declare no conflict of interest.
DATA AVAILABILITY
Original raw ATAC-seq and CUT&RUN data have been deposited to the National Center for Biotechnology Information (NCBI) Gene Expression Omnibus, Accession: GSE234331. Additional Gene Expression Omnibus accession numbers for published datasets used in this study include GSE132531, GSE140187, GSE118112, GSE127768, GSE100738, GSE118189, GSE90958, GSE77695, GSE94039, GSE31233, GSE110305, GSE93755, GSE110020, GSE103953, GSE88967, GSE115744, GSE116204, GSE123198, GSE98412, GSE64409, GSE172358 and GSE40463. Raw immunoblot images from Figs. 5a, 5b, 6c, 6d and Extended Data Figs. 8h, 8i, 8j, 8k were deposited to Mendeley at doi:10.17632/zws5pvcyzp.1 and are included in Supplementary Information. All sequencing data was aligned using the mm10 mouse genome assembly.
CODE AVAILABILITY
This study did not generate new code.
REFERENCES
- 1.Mosmann TR & Coffman RL TH1 and TH2 cells: different patterns of lymphokine secretion lead to different functional properties. Annu Rev Immunol 7, 145–173 (1989). [DOI] [PubMed] [Google Scholar]
- 2.Williams MA & Bevan MJ Effector and memory CTL differentiation. Annu Rev Immunol 25, 171–192 (2007). [DOI] [PubMed] [Google Scholar]
- 3.van Panhuys N, Klauschen F & Germain RN T-cell-receptor-dependent signal intensity dominantly controls CD4(+) T cell polarization In Vivo. Immunity 41, 63–74 (2014). [DOI] [PMC free article] [PubMed] [Google Scholar]
- 4.Fazilleau N, McHeyzer-Williams LJ, Rosen H & McHeyzer-Williams MG The function of follicular helper T cells is regulated by the strength of T cell antigen receptor binding. Nat Immunol 10, 375–384 (2009). [DOI] [PMC free article] [PubMed] [Google Scholar]
- 5.Tubo NJ et al. Single naive CD4+ T cells from a diverse repertoire produce different effector cell types during infection. Cell 153, 785–796 (2013). [DOI] [PMC free article] [PubMed] [Google Scholar]
- 6.Scott-Browne JP et al. Dynamic Changes in Chromatin Accessibility Occur in CD8+ T Cells Responding to Viral Infection. Immunity 45, 1327–1340 (2016). [DOI] [PMC free article] [PubMed] [Google Scholar]
- 7.Zhong Y. et al. Hierarchical regulation of the resting and activated T cell epigenome by major transcription factor families. Nat Immunol 23, 122–134 (2022). [DOI] [PMC free article] [PubMed] [Google Scholar]
- 8.Shih HY et al. Developmental Acquisition of Regulomes Underlies Innate Lymphoid Cell Functionality. Cell 165, 1120–1133 (2016). [DOI] [PMC free article] [PubMed] [Google Scholar]
- 9.Pandey S, Kawai T & Akira S Microbial sensing by Toll-like receptors and intracellular nucleic acid sensors. Cold Spring Harbor perspectives in biology 7, a016246 (2014). [DOI] [PMC free article] [PubMed] [Google Scholar]
- 10.Taniguchi K & Karin M NF-κB, inflammation, immunity and cancer: coming of age. Nature Reviews Immunology 18, 309–324 (2018). [DOI] [PubMed] [Google Scholar]
- 11.Desai DM, Newton ME, Kadlecek T & Weiss A Stimulation of the phosphatidylinositol pathway can induce T-cell activation. Nature 348, 66–69 (1990). [DOI] [PubMed] [Google Scholar]
- 12.Calderon D. et al. Landscape of stimulation-responsive chromatin across diverse human immune cells. Nat Genet 51, 1494–1505 (2019). [DOI] [PMC free article] [PubMed] [Google Scholar]
- 13.Buck MD, Sowell RT, Kaech SM & Pearce EL Metabolic Instruction of Immunity. Cell 169, 570–586 (2017). [DOI] [PMC free article] [PubMed] [Google Scholar]
- 14.Rothenberg EV & Ward SB A dynamic assembly of diverse transcription factors integrates activation and cell-type information for interleukin 2 gene regulation. Proc Natl Acad Sci U S A 93, 9358–9365 (1996). [DOI] [PMC free article] [PubMed] [Google Scholar]
- 15.Samstein Robert M. et al. Foxp3 Exploits a Pre-Existent Enhancer Landscape for Regulatory T Cell Lineage Specification. Cell 151, 153–166 (2012). [DOI] [PMC free article] [PubMed] [Google Scholar]
- 16.Buenrostro JD, Wu B, Chang HY & Greenleaf WJ ATAC-seq: A Method for Assaying Chromatin Accessibility Genome-Wide. Current protocols in molecular biology 109, 21.29.21–29 (2015). [DOI] [PMC free article] [PubMed] [Google Scholar]
- 17.Yoshida H. et al. The cis-Regulatory Atlas of the Mouse Immune System. Cell 176, 897–912.e820 (2019). [DOI] [PMC free article] [PubMed] [Google Scholar]
- 18.Petermann F. et al. The Magnitude of IFN-γ Responses Is Fine-Tuned by DNA Architecture and the Non-coding Transcript of Ifng-as1. Mol Cell 75, 1229–1242.e1225 (2019). [DOI] [PMC free article] [PubMed] [Google Scholar]
- 19.Choi J. et al. Bcl-6 is the nexus transcription factor of T follicular helper cells via repressor-of-repressor circuits. Nat Immunol 21, 777–789 (2020). [DOI] [PMC free article] [PubMed] [Google Scholar]
- 20.Hayward SL et al. Environmental cues regulate epigenetic reprogramming of airway-resident memory CD8(+) T cells. Nat Immunol 21, 309–320 (2020). [DOI] [PMC free article] [PubMed] [Google Scholar]
- 21.Qiu R. et al. Inhibition of Glycolysis in Pathogenic T(H)17 Cells through Targeting a miR −21-Peli1-c-Rel Pathway Prevents Autoimmunity. J Immunol 204, 3160–3170 (2020). [DOI] [PubMed] [Google Scholar]
- 22.Lio CJ et al. TET enzymes augment activation-induced deaminase (AID) expression via 5-hydroxymethylcytosine modifications at the Aicda superenhancer. Sci Immunol 4 (2019). [DOI] [PMC free article] [PubMed] [Google Scholar]
- 23.Open-source ImmGen: mononuclear phagocytes. Nat Immunol 17, 741 (2016). [DOI] [PubMed] [Google Scholar]
- 24.Miller EL et al. TOP2 synergizes with BAF chromatin remodeling for both resolution and formation of facultative heterochromatin. Nat Struct Mol Biol advance online publication (2017). [DOI] [PMC free article] [PubMed] [Google Scholar]
- 25.Gallo EM, Ho L, Winslow MM, Staton TL & Crabtree GR Selective role of calcineurin in haematopoiesis and lymphopoiesis. EMBO reports 9, 1141–1148 (2008). [DOI] [PMC free article] [PubMed] [Google Scholar]
- 26.Isoda T. et al. Non-coding Transcription Instructs Chromatin Folding and Compartmentalization to Dictate Enhancer-Promoter Communication and T Cell Fate. Cell 171, 103–119.e118 (2017). [DOI] [PMC free article] [PubMed] [Google Scholar]
- 27.Hosokawa H. et al. Bcl11b sets pro-T cell fate by site-specific cofactor recruitment and by repressing Id2 and Zbtb16. Nat Immunol 19, 1427–1440 (2018). [DOI] [PMC free article] [PubMed] [Google Scholar]
- 28.Calo E & Wysocka J Modification of Enhancer Chromatin: What, How, and Why? Molecular Cell 49, 825–837 (2013). [DOI] [PMC free article] [PubMed] [Google Scholar]
- 29.Buecker C & Wysocka J Enhancers as information integration hubs in development: lessons from genomics. Trends in Genetics 28, 276–284 (2012). [DOI] [PMC free article] [PubMed] [Google Scholar]
- 30.Pham D. et al. Batf stabilizes Th17 cell development via impaired Stat5 recruitment of Ets1-Runx1 complexes. The EMBO journal 42, e109803 (2023). [DOI] [PMC free article] [PubMed] [Google Scholar]
- 31.Carr TM, Wheaton JD, Houtz GM & Ciofani M JunB promotes Th17 cell identity and restrains alternative CD4(+) T-cell programs during inflammation. Nature communications 8, 301 (2017). [DOI] [PMC free article] [PubMed] [Google Scholar]
- 32.Martinez GJ et al. The transcription factor NFAT promotes exhaustion of activated CD8+ T cells. Immunity 42, 265–278 (2015). [DOI] [PMC free article] [PubMed] [Google Scholar]
- 33.Tsao HW et al. Batf-mediated epigenetic control of effector CD8(+) T cell differentiation. Sci Immunol 7, eabi4919 (2022). [DOI] [PubMed] [Google Scholar]
- 34.Oh H. et al. An NF-κB Transcription-Factor-Dependent Lineage-Specific Transcriptional Program Promotes Regulatory T Cell Identity and Function. Immunity 47, 450–465.e455 (2017). [DOI] [PMC free article] [PubMed] [Google Scholar]
- 35.Fang D. et al. Differential regulation of transcription factor T-bet induction during NK cell development and T helper-1 cell differentiation. Immunity 55, 639–655.e637 (2022). [DOI] [PMC free article] [PubMed] [Google Scholar]
- 36.Hsieh T. et al. JunB Is Critical for Survival of T Helper Cells. Frontiers in immunology 13, 901030 (2022). [DOI] [PMC free article] [PubMed] [Google Scholar]
- 37.Vahedi G. et al. STATs shape the active enhancer landscape of T cell populations. Cell 151, 981–993 (2012). [DOI] [PMC free article] [PubMed] [Google Scholar]
- 38.Kingston RE & Tamkun JW Transcriptional regulation by trithorax-group proteins. Cold Spring Harbor perspectives in biology 6, a019349 (2014). [DOI] [PMC free article] [PubMed] [Google Scholar]
- 39.Zhang JA, Mortazavi A, Williams BA, Wold BJ & Rothenberg EV Dynamic transformations of genome-wide epigenetic marking and transcriptional control establish T cell identity. Cell 149, 467–482 (2012). [DOI] [PMC free article] [PubMed] [Google Scholar]
- 40.Schmitt TM & Zúñiga-Pflücker JC Induction of T cell development from hematopoietic progenitor cells by delta-like-1 in vitro. Immunity 17, 749–756 (2002). [DOI] [PubMed] [Google Scholar]
- 41.Skene PJ & Henikoff S An efficient targeted nuclease strategy for high-resolution mapping of DNA binding sites. eLife 6 (2017). [DOI] [PMC free article] [PubMed] [Google Scholar]
- 42.Shin B et al. Runx1 and Runx3 drive progenitor to T-lineage transcriptome conversion in mouse T cell commitment via dynamic genomic site switching. Proc Natl Acad Sci U S A 118 (2021). [DOI] [PMC free article] [PubMed] [Google Scholar]
- 43.Ho L & Crabtree GR Chromatin remodelling during development. Nature 463, 474–484 (2010). [DOI] [PMC free article] [PubMed] [Google Scholar]
- 44.Ikawa T. et al. An essential developmental checkpoint for production of the T cell lineage. Science 329, 93–96 (2010). [DOI] [PubMed] [Google Scholar]
- 45.Li L, Leid M & Rothenberg EV An early T cell lineage commitment checkpoint dependent on the transcription factor Bcl11b. Science 329, 89–93 (2010). [DOI] [PMC free article] [PubMed] [Google Scholar]
- 46.Li P et al. Reprogramming of T cells to natural killer-like cells upon Bcl11b deletion. Science 329, 85–89 (2010). [DOI] [PMC free article] [PubMed] [Google Scholar]
- 47.Kadoch C. et al. Proteomic and bioinformatic analysis of mammalian SWI/SNF complexes identifies extensive roles in human malignancy. Nat Genet 45, 592–601 (2013). [DOI] [PMC free article] [PubMed] [Google Scholar]
- 48.Hosokawa H. et al. Bcl11b sets pro-T cell fate by site-specific cofactor recruitment and by repressing Id2 and Zbtb16. Nat Immunol 19, 1427–1440 (2018). [DOI] [PMC free article] [PubMed] [Google Scholar]
- 49.Califano D. et al. Transcription Factor Bcl11b Controls Identity and Function of Mature Type 2 Innate Lymphoid Cells. Immunity 43, 354–368 (2015). [DOI] [PMC free article] [PubMed] [Google Scholar]
- 50.Voss TC et al. Dynamic exchange at regulatory elements during chromatin remodeling underlies assisted loading mechanism. Cell 146, 544–554 (2011). [DOI] [PMC free article] [PubMed] [Google Scholar]
- 51.Miller JA & Widom J Collaborative Competition Mechanism for Gene Activation In Vivo. Molecular and cellular biology 23, 1623–1632 (2003). [DOI] [PMC free article] [PubMed] [Google Scholar]
- 52.Bakshi R. et al. The human SWI/SNF complex associates with RUNX1 to control transcription of hematopoietic target genes. Journal of Cellular Physiology 225, 569–576 (2010). [DOI] [PMC free article] [PubMed] [Google Scholar]
- 53.Hosokawa H. et al. Transcription Factor PU.1 Represses and Activates Gene Expression in Early T Cells by Redirecting Partner Transcription Factor Binding. Immunity 48, 1119–1134.e1117 (2018). [DOI] [PMC free article] [PubMed] [Google Scholar]
- 54.Minderjahn J. et al. Mechanisms governing the pioneering and redistribution capabilities of the non-classical pioneer PU.1. Nature communications 11, 402 (2020). [DOI] [PMC free article] [PubMed] [Google Scholar]
- 55.Wu J. et al. Requisite Chromatin Remodeling for Myeloid and Erythroid Lineage Differentiation from Erythromyeloid Progenitors. Cell Rep 33, 108395 (2020). [DOI] [PMC free article] [PubMed] [Google Scholar]
- 56.Shin B, Zhou W, Wang J, Gao F & Rothenberg EV Runx factors launch T cell and innate lymphoid programs via direct and gene network-based mechanisms. Nature Immunology 24, 1458–1472 (2023). [DOI] [PMC free article] [PubMed] [Google Scholar]
METHODS REFERENCES
- 57.Sumi-Ichinose C, Ichinose H, Metzger D & Chambon P SNF2beta-BRG1 is essential for the viability of F9 murine embryonal carcinoma cells. Mol.Cell Biol 17, 5976–5986 (1997). [DOI] [PMC free article] [PubMed] [Google Scholar]
- 58.Golonzhka O. et al. Dual role of COUP-TF-interacting protein 2 in epidermal homeostasis and permeability barrier formation. J Invest Dermatol 129, 1459–1470 (2009). [DOI] [PMC free article] [PubMed] [Google Scholar]
- 59.Taniuchi I. et al. Differential requirements for Runx proteins in CD4 repression and epigenetic silencing during T lymphocyte development. Cell 111, 621–633 (2002). [DOI] [PubMed] [Google Scholar]
- 60.Holmes R & Zuniga-Pflucker JC The OP9-DL1 system: generation of T-lymphocytes from embryonic or hematopoietic stem cells in vitro. Cold Spring Harbor protocols 2009, pdb.prot5156 (2009). [DOI] [PubMed] [Google Scholar]
- 61.Buenrostro JD, Giresi PG, Zaba LC, Chang HY & Greenleaf WJ Transposition of native chromatin for fast and sensitive epigenomic profiling of open chromatin, DNA-binding proteins and nucleosome position. Nat Methods 10, 1213–1218 (2013). [DOI] [PMC free article] [PubMed] [Google Scholar]
- 62.Zhou W, Gao F, Romero-Wolf M, Jo S & Rothenberg EV Single-cell deletion analyses show control of pro-T cell developmental speed and pathways by Tcf7, Spi1, Gata3, Bcl11a, Erg, and Bcl11b. Sci Immunol 7, eabm1920 (2022). [DOI] [PMC free article] [PubMed] [Google Scholar]
- 63.Romero-Wolf M. et al. Notch2 complements Notch1 to mediate inductive signaling that initiates early T cell development. The Journal of cell biology 219 (2020). [DOI] [PMC free article] [PubMed] [Google Scholar]
- 64.Hosokawa H. et al. Stage-specific action of Runx1 and GATA3 controls silencing of PU.1 expression in mouse pro-T cells. J Exp Med 218 (2021). [DOI] [PMC free article] [PubMed] [Google Scholar]
Associated Data
This section collects any data citations, data availability statements, or supplementary materials included in this article.
Supplementary Materials
Data Availability Statement
Original raw ATAC-seq and CUT&RUN data have been deposited to the National Center for Biotechnology Information (NCBI) Gene Expression Omnibus, Accession: GSE234331. Additional Gene Expression Omnibus accession numbers for published datasets used in this study include GSE132531, GSE140187, GSE118112, GSE127768, GSE100738, GSE118189, GSE90958, GSE77695, GSE94039, GSE31233, GSE110305, GSE93755, GSE110020, GSE103953, GSE88967, GSE115744, GSE116204, GSE123198, GSE98412, GSE64409, GSE172358 and GSE40463. Raw immunoblot images from Figs. 5a, 5b, 6c, 6d and Extended Data Figs. 8h, 8i, 8j, 8k were deposited to Mendeley at doi:10.17632/zws5pvcyzp.1 and are included in Supplementary Information. All sequencing data was aligned using the mm10 mouse genome assembly.
This study did not generate new code.


