

Abstract
Microbial growth emerges from coordinated synthesis of various cellular components from limited resources. In Saccharomyces cerevisiae, cyclic AMP (cAMP)-mediated signaling is shown to orchestrate cellular metabolism; however, it remains unclear quantitatively how the controlling circuit drives resource partition and subsequently shapes biomass growth. Here we combined experiment with mathematical modeling to dissect the signaling-mediated growth optimization of S. cerevisiae. We showed that, through cAMP-mediated control, the organism achieves maximal or nearly maximal steady-state growth during the utilization of multiple tested substrates as well as under perturbations impairing glucose uptake. However, the optimal cAMP concentration varies across cases, suggesting that different modes of resource allocation are adopted for varied conditions. Under settings with nutrient alterations, S. cerevisiae tunes its cAMP level to dynamically reprogram itself to realize rapid adaptation. Moreover, to achieve growth maximization, cells employ additional regulatory systems such as the Gcn2-mediated amino acid control. This study establishes a systematic understanding of global resource allocation in S. cerevisiae, providing insights into quantitative yeast physiology as well as metabolic strain engineering for biotechnological applications.
Keywords: Systems biology, growth optimality, resource allocation, cAMP, mathematical modeling
Introduction
One prevalent hypothesis in microbiology is that organisms have evolved to maximize their growth1,2. As cellular proliferation involves concurrent production of diverse cellular contents, including proteins, lipids, carbohydrates, and nucleic acids, the hypothesis demands that microbes wisely allocate their limited but indispensable resources. In Saccharomyces cerevisiae, protein is the primary resource, which constitutes 50% of the total dry biomass3,4,5 and dictates almost all biochemical processes including substrate uptake, metabolite conversion, and gene expression6,7. To achieve maximal growth, the proteome of S. cerevisiae thus should be optimally partitioned to support a maximal metabolic flux towards biomass synthesis. From a supply and demand point of view, this requires that the organism balances its catabolic enzymes, which are responsible for transporting and converting substrates into amino acids and ATP, and translational machineries, which assemble amino acids into proteins (Fig. 1a). Supporting this notion, the proteome balance—cellular growth relationship was experimentally confirmed recently in E. coli, leading to the establishment of the bacterial growth law8,9 and igniting the development of theoretical models and experimental explorations10–15.
Figure 1 |. A resource allocation view of S. cerevisiae growth.
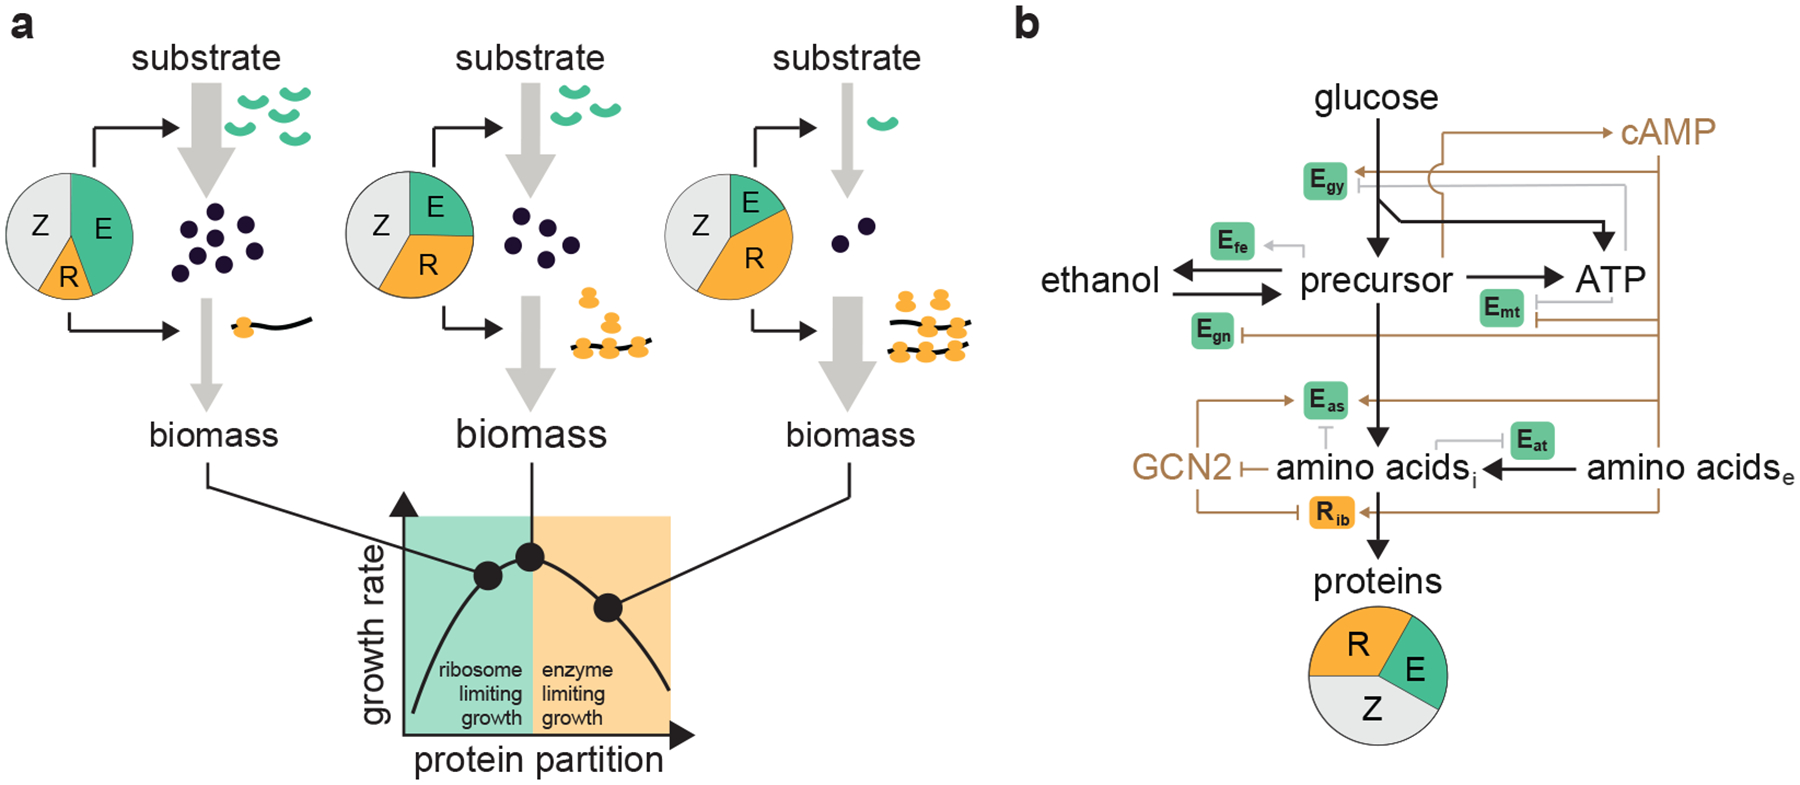
a, Schematic of cellular growth as a function of proteome allocation. The cellular proteome can be coarse-grained into three groups, namely cytosolic ribosomal and ribosome-affiliated proteins (R), transporters and metabolic enzymes (E), and the rest of proteome (Z). When the E fraction is excessive, but the R fraction is inadequate (left), translation becomes a bottleneck step. Conversely, when the E fraction is scarce, but the R fraction is excessive (right), the substrate-to-amino acid conversion becomes rate-limiting. The maximal growth is achieved only when the two protein sectors are balanced (middle). b, Coarse-grained, systems illustration of S. cerevisiae metabolism. Carbon (glucose or ethanol) is taken up by the cell and converted to metabolic precursors (upper and lower glycolysis intermediates) that are subsequently used to produce amino acids, ATP, or ethanol. Amino acids are further used as building blocks to synthesize proteins through the process of translation involving ribosomes, which confers protein production and, hence, biomass accumulation. cAMP is a coarse-grained signaling molecule activated by glucose; GCN2 is another coarse-grained signaling molecule whose activity is repressed by intracellular amino acids. The orchestration of metabolic reactions, signaling, and gene regulation leads to dynamic resource partition which in turn determines cellular growth.
Studies showed that S. cerevisiae holds a set of resource regulation mechanisms, including local feedback inhibition of metabolic products and global signaling-mediated flux programming16–21 (Fig. 1b). Notably, the latter is comprised of global remodeling of gene expression profiles and control of metabolic enzyme activities, thereby making leading contributions to resource allocation. One such global regulator is the controlling circuit involving the glucose-trigged, second messenger cyclic AMP (cAMP)21,22. Another global regulator is the eIF2 kinase GCN2 that senses amino acid availability through uncharged tRNA23. Upon induction, these systems alter both the abundance and activities of ribosomal proteins and metabolic enzymes to maintain efficient biomass accumulation18.
The existence of these global signaling circuits suggests that S. cerevisiae may have an innate ability to adjust its resource partitioning for growth; however, it remains unclear quantitatively and dynamically how these controlling circuits drive resource partition and, subsequently, dictates biomass growth. Accordingly, it also remains excluded if the prevalent hypothesis of growth optimization is valid for the yeast. More specifically, remaining unclear a series of specific questions underpinning resource partition and cellular growth: i) Is the cAMP-mediated controlling circuit optimized for the partitioning of cellular resources needed for maximal growth? ii) How well does the circuit perform in the presence of different carbon sources? iii) Does the circuit find different optima or use a single level of cAMP for resource partition? iv) Is the circuit capable of maximizing growth upon chemical perturbations that alter key metabolic processes? v) Extending from static to dynamic contexts, is the circuit capable of optimizing growth in changing environments, such as nutrient-shifting settings or batch fermentations? vi) Is the circuit alone sufficient to produce optimal growth or do cells require optimized functioning of multiple regulatory programs?
Here, we combine wet-lab experiment with mathematical modeling to dissect the resource allocation underlying S. cerevisiae growth. We show that through the cAMP-mediated controlling circuit, S. cerevisiae manages to achieve maximal or nearly maximal steady-state growth during glucose, fructose, sucrose, and ethanol utilization as well as in the presence of drug perturbations that impair glucose uptake. One key difference across these cases is, however, the specific optimum of cAMP that specifies resource allocation and confers maximal growth, which suggests that differential allocation modes are adopted for varied conditions. Under complex settings with nutrient variations, the organism alters its cAMP level to dynamically reprogram its resource allocation and metabolic flux to realize rapid adaptation and growth maximization. Moreover, in addition to cAMP-mediated control, cells employ additional regulatory systems, such as the Gcn2-mediated amino acid control, to achieve growth maximization. Together, this study establishes a systematic understanding of signaling-mediated resource allocation and growth optimization of S. cerevisiae, providing insights into quantitative yeast physiology as well as strain metabolic engineering for biotechnological applications.
Results
S. cerevisiae maximizes growth during glucose utilization.
Rapid growth requires the proper distribution of resources to diverse cellular processes via different allocation mechanisms, for which the cAMP-mediated, innate allocation control (cIAC) plays a central role for S. cerevisiae18,24. cAMP is a second messenger whose synthesis is activated by glucose through intracellular signaling involving the glycolytic intermediate fructose 1,6-bisphosphate25,26 and extracellular signaling mediated by the GPR1 glucose sensor24,27,28. In turn, it activates the global regulator PKA that directly controls ribosome biogenesis and glycolytic enzyme activities and, through regulation of the inversely correlated global regulator SNF129–31, indirectly inhibits alternative carbon use, gluconeogenesis, and respiration. Additionally, glucose employs alternative routes to signal SNF1 to regulate the downstream genes31,32. Through this intertwined regulation, glucose regulation promotes the abundance and activity of ribosomal proteins (R proteins), increases the activity of glycolytic enzymes (Egy), and inhibits the expression of gluconeogenesis (Egn) and respiration (Emt) enzymes to balance carbon flux towards biomass accumulation17–19,33 (Fig. 2a). We lumped these regulatory details into a coarse-grained step named cAMP-mediated allocation control. To assess if S. cerevisiae is optimized for growth via this regulation, we proposed to replace the native regulatory loop with an exogeneous cAMP supply for external allocation control (cEAC) (Fig. 2b). The resulting mutant shall become solely subjected to control by external cAMP, and the level of external cAMP can be arbitrarily controlled. Comparison of the growth rate of the wildtype (WT) (cIAC strain) with the maximal growth rate of the mutant (cEAC strain) under various cAMP levels could have two possible outcomes. First, the former equals the latter, corresponding to S. cerevisiae growth maximization. Second, the former is lower than the latter, which suggests growth sub-optimality. Notably, the former could not exceed the latter because the range of cAMP levels examined for cEAC includes the value of cIAC. Such a comparison provides a systematic strategy to examine the optimality of S. cerevisiae growth as in the case of E. coli15.
Figure 2 |. S. cerevisiae growth optimization during glucose utilization.

a,b, Native and engineered controlling circuits. a, cAMP-mediated, innate allocation control (cIAC) in the WT which contains native regulation that senses glucose. b, cAMP-mediated, external allocation control (cEAC) in a mutant which is abolished in native regulation but subjective to external cAMP. c-d, Comparison of simulated growths of the cEAC mutant with different levels of external cAMP (circles) and the cIAC strain without external cAMP (dashed lines) in terms of the growth rate (c), and remanent glucose and ethanol production at hour 7.5 (d) respectively. e, Design of an in vivo reporter that informs the endogenous cAMP level. Integrated downstream of the hsp12 gene, the enhanced green fluorescence protein (EGFP) gene is regulated by cAMP via MSN2. f, Validation of the reporter system in the cEAC strain. g-h, Comparison of experimentally measured growths of the cEAC mutant with different levels of external cAMP and the cIAC strain without external cAMP in terms of the growth rate (h), and remanent glucose and ethanol production at hour 12 (j) respectively. For panels c-d and g-h, dashed lines correspond to cIAC and circles with darker colors are the maxima of the variables of cEAC under varied cAMP levels. Simulation details can be found in Supplementary Method 1.2.
To provide quantitative and systems insight into the cAMP-mediated control and its connection to growth optimality, we leveraged a mathematical framework we recently developed34. Our framework involves a coarse-grained, system-level description of WT S. cerevisiae metabolism. The model explicitly incorporating metabolic reactions, gene regulation, and signaling, thereby providing a quantitative testbed to link molecular resource allocation to cellular growth. Using our framework, we created a computational cEAC mutant to compare with the WT (cIAC system) (Methods). Our simulations (Fig. 2c) showed that, with the alteration of the model cAMP equivalent, the growth rate of the in silico mutant exhibits a bell shape with the maximum (black circle) equal to that of the cIAC system (dashed line). Accordingly, the cIAC system is identical to the cEAC mutant at the optimal cAMP level which yields the fastest temporal growth dynamics (Supplementary Fig. 1a) and the largest ethanol accumulation and lowest remanent glucose at a given time (hour 7.5) (Fig. 2d). These results suggest that the cIAC system is optimized for resource partitioning for maximal growth.
In parallel, we experimentally constructed the cEAC mutant by knocking out cdc2535,36 and pde237, the genes responsible for cAMP production and degradation respectively (Supplementary Fig. 2, Methods). We supplemented the mutant with the membrane-permeable cAMP analog 8-bromo-cAMP (Methods). With this design, the cAMP analog enters the cell cytoplasm to activate PKA, which subsequently alters cellular resource partitioning via multiple paths. For example, PKA phosphorylates the transcriptional activator MSN238,39 to suppress the expression of the general stress response genes. To readout the regulatory effect of cAMP, we inserted in both the cIAC system and cEAC mutant an enhanced green fluorescence protein (EGFP) reporter gene downstream of the MSN2-regulated heat shock protein gene hsp1240 (Fig. 2e). We confirmed that the EGFP level of the cEAC mutant indeed declines with increasing supplementation of the external cAMP analog (Fig. 2f). Using the two strains, we performed growth experiments with glucose as the carbon source. The cIAC system shows a growth rate equal to the maximum of cEAC (Fig. 2g and Supplementary Table 4). It matched the cEAC mutant at the optimal cAMP level (1.45 mM) in terms of the temporal biomass dynamics (Supplementary Fig. 1b) and the ethanol produced and the residual glucose at hour 12 (Fig. 2h). These results illustrate two points. First, cAMP-mediated control of resource allocation has a profound impact on cell growth. Second, innate cAMP control confers maximal growth on S. cerevisiae during glucose utilization.
We used our mathematical framework to explain the relationship between cAMP-mediated resource allocation and growth (Supplementary Methods 1.2). Our simulations showed that at low levels of cAMP, the synthesis of R proteins is repressed (Supplementary Fig. 3a). Therefore, translation is suppressed, and growth is inhibited. By contrast, when the cAMP concentration is excessive, too many resources are channeled towards the production of R proteins and away from the production of proteins for respiration (Emt) (Supplementary Fig. 3b). Consequently, ATP is limiting, and cells cannot fuel amino acid uptake or protein synthesis.
Growth maximization for different carbon sources.
To evaluate the robustness of growth rate maximization by S. cerevisiae, we conducted growth experiments with three additional carbon sources, namely fructose, sucrose, and ethanol. In the presence of fructose, the cIAC system has a growth rate comparable to the maximum measured for the cEAC mutant (Fig. 3a and Supplementary Table 4). Consistently, it yields a residual fructose level and total ethanol concentration at hour 12 that matches the corresponding optima of the cEAC mutant (Fig. 3b). Similarly, the cIAC system exhibits a maximized growth rate (Fig. 3c and Supplementary Table 4) along with the fastest sucrose uptake (i.e., least residue) and ethanol production (Fig. 3d) during sucrose utilization. Interestingly, for the case of ethanol, the growth rate of the cIAC system is slightly lower (3.65% lower and Supplementary Table 4) than that of the cEAC mutant when the external cAMP level was 0.039, 0.078 or 0.15 mM (Fig. 3e); accordingly, the corresponding residual ethanol concentration is lower (Fig. 3f and Supplementary Fig. 4a) and cell accumulation is higher (Supplementary Fig. 4b) than those of the cIAC system. This suggests that the organism is not fully but nearly optimized for growth on ethanol. This set of experiments thus suggested that cAMP-mediated control is robust for S. cerevisiae growth maximization, although we do not rule out the possibility of sub-optimality during the consumption of other carbon sources.
Figure 3 |. Cellular growth on different carbon sources.
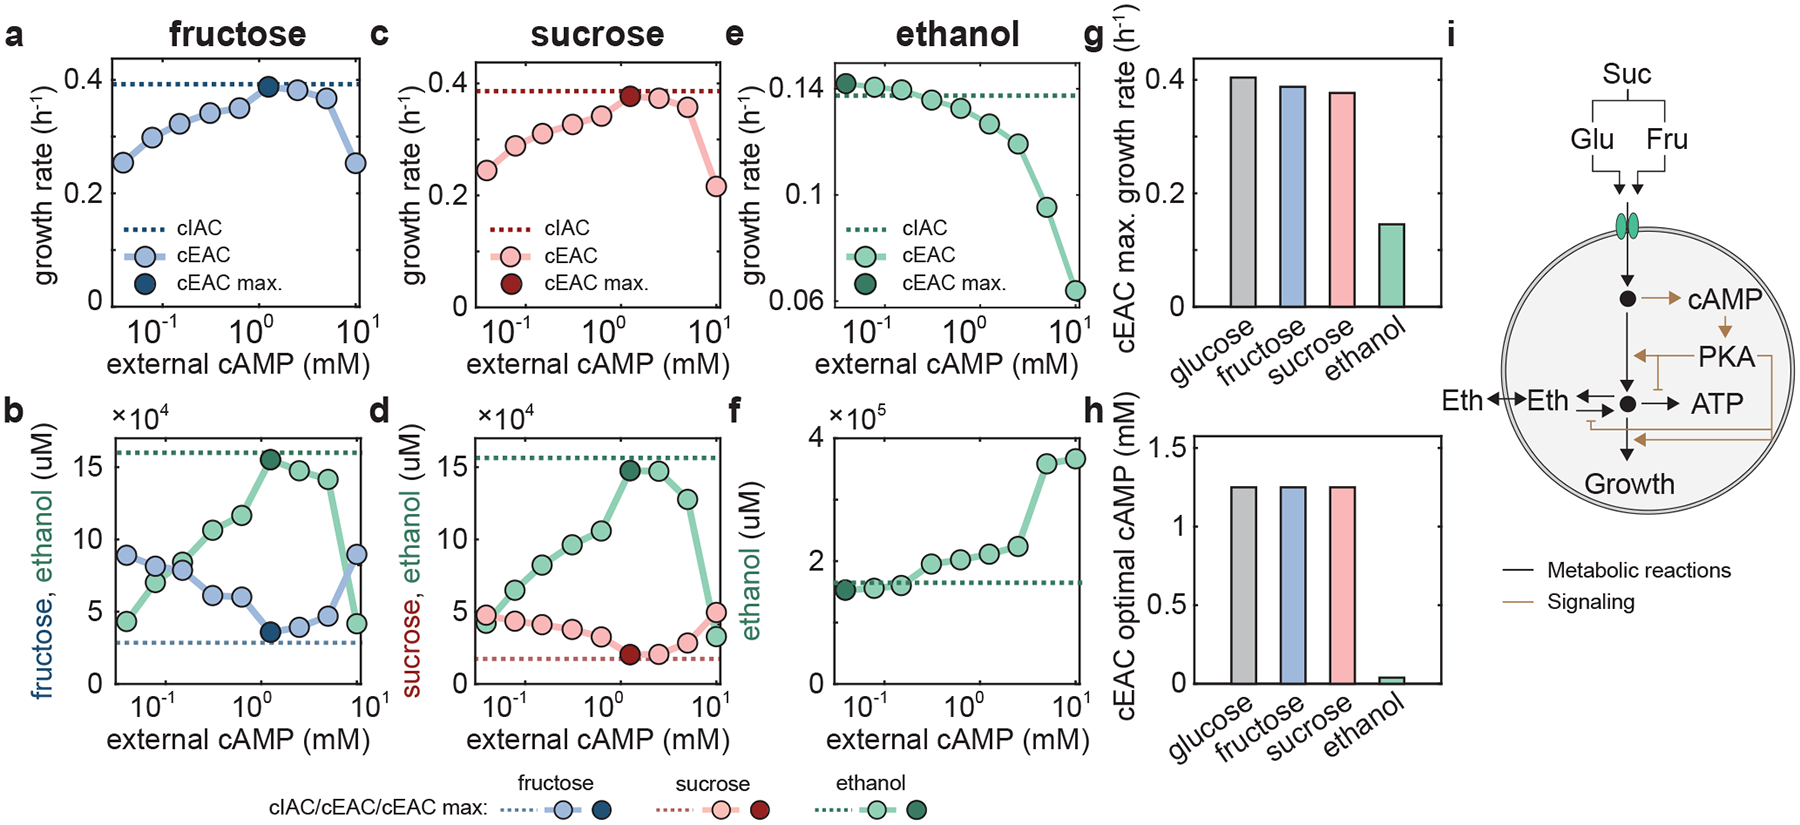
a,b, Comparison of the growths of cEAC with different levels of external cAMP (circles) and cIAC without external cAMP (dashed lines) in terms of the growth rate (a) and remanent glucose and ethanol production at hour 12 (b) during fructose utilization. c,d, Comparison of the growths of cEAC with different levels of external cAMP (circles) and cIAC without external cAMP (dashed lines) in terms of the growth rate (c) and remanent glucose and ethanol production at hour 12 (d) during sucrose utilization. e,f, Comparison of the growths of cEAC with different levels of external cAMP (circles) and cIAC without external cAMP (dashed lines) in terms of the growth rate (e) and remanent ethanol at hour 36 (f) during ethanol utilization. For panels a-f, dashed lines correspond to the WT (cIAC) and circles with darker colors are the maxima of the variables of cEAC under varied cAMP levels. g, Maximal growth rate of cEAC on different carbon sources. h, Optimal external cAMP levels that maximize cEAC growth on the carbon sources. i, Schematic illustration of the metabolic paths for different carbon sources. Glucose, fructose, and, sucrose undergo glycolysis while ethanol metabolism involves gluconeogenesis and respiration.
Although across the four substrates the yeast largely achieves ubiquitous growth maximization, the specific value of the growth rate is not constant. Those for glucose, fructose, and sucrose utilization are comparable to each other but that for ethanol is much smaller (Fig. 3g). Additionally, the optima of external cAMP that maximizes growth shows a similar pattern (Fig. 3h). We argue that this observed phenomenon is rooted in the similarities and differences between the metabolic pathways utilized for these carbon sources. Such growth rate and cAMP patterns are also observed for the cIAC strain (Supplementary Fig. 5). As illustrated in Fig. 3i and Supplementary Fig. 6, glucose, fructose, and sucrose all enter the cell at the top of the central carbon metabolism and are processed through glycolysis (Egy proteins)41. As cAMP synthesis is triggered by an intermediate metabolite in upper glycolysis25,26, the metabolism of these carbon sources all results in a comparable, high level of cAMP42 that specifies the enzyme (Egy) activities and ribosome (R protein) abundance43 needed for accommodating the carbon flux from glycolysis. By contrast, ethanol enters at a lower point in the central carbon metabolism and is metabolized through respiration (Emt) and gluconeogenesis (Egn) instead of glycolysis44. In this case, the intermediate metabolites in upper glycolysis are low, leading to a much lower level of cAMP.
The ability to maximize growth declines marginally with glucose uptake inhibition.
To further probe the growth optimality of S. cerevisiae, we investigated how the organism grows in the presence of external perturbations over key metabolic processes such as glucose uptake. Specifically, we used methylglyoxal as a chemical agent to inhibit glucose uptake. Methylglyoxal promotes the degradation of the cell surface glucose receptors RGT2 and SNF3 that regulate the gene expression of hexose transporters45 (Methods) (Fig. 4a). Because cAMP synthesis is induced upon initial glucose metabolism, supplementing methylglyoxal should decrease the intracellular cAMP level and subsequently the PKA activity. Consistent with this line of reasoning, the EGFP level of the cIAC system, which is inversely correlated with cAMP availability, increases with methylglyoxal addition (Fig. 4b). Concurrently, the growth rate monotonically declines (Fig. 4c), owing to the reduction in carbon influx and subsequent decrease in ribosome abundance trigged by the cAMP drop. These results confirmed the functionality of methylglyoxal.
Figure 4 |. Cellular growth in the presence of glucose uptake perturbations.
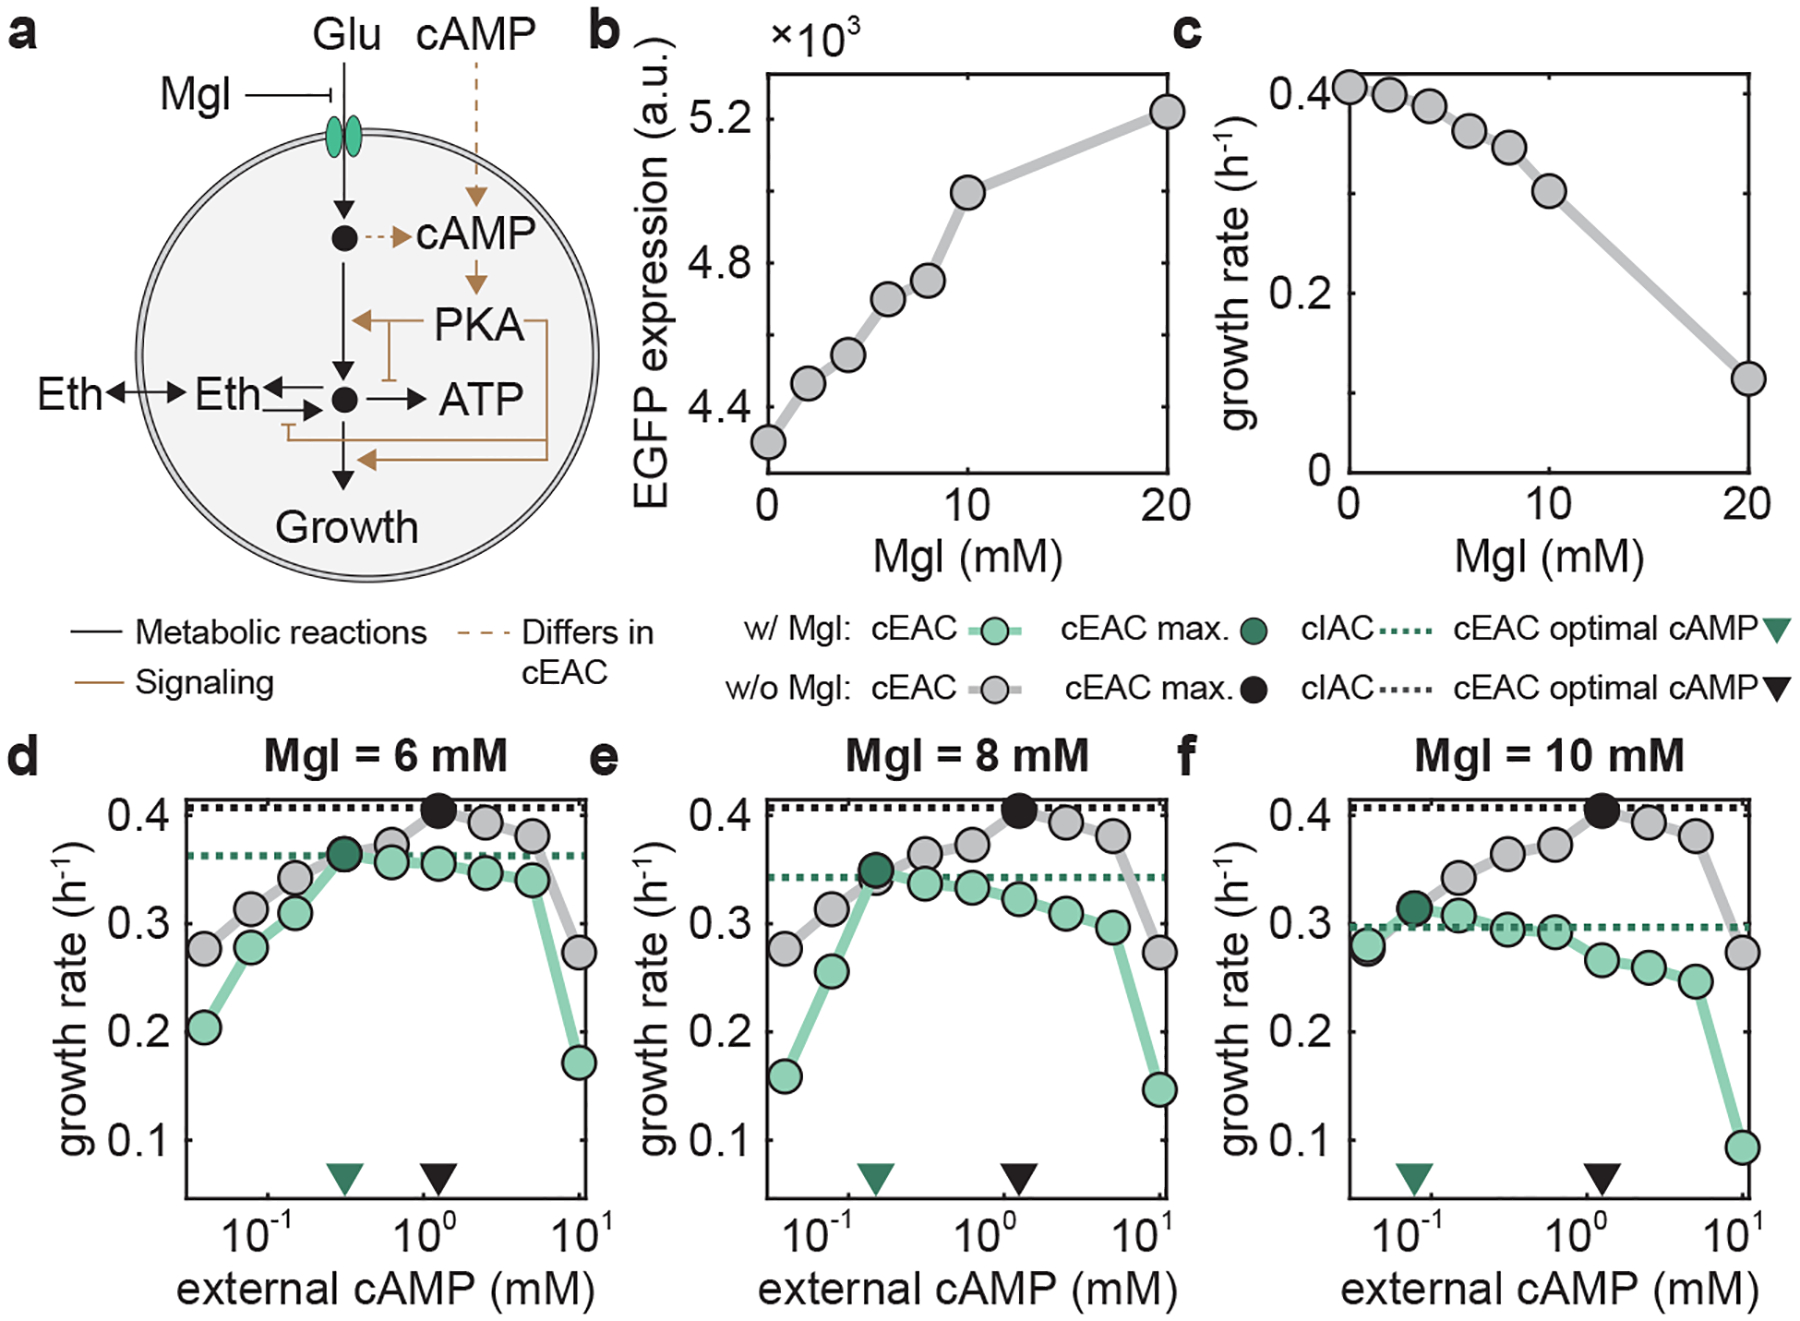
a, Schematic illustration for the inhibition of S. cerevisiae glucose uptake by methylglyoxal. b,c, Enhanced green fluorescence protein (EGFP) level (b) and growth rate (c) of the WT (cIAC) as functions of external methylglyoxal (Mgl). d-f, Growth rate of the mutant cEAC under various levels of external cAMP in the presence of 6 mM (d), 8 mM (e), and 10 mM (f) concentrations of methylglyoxal (green circles) and in the absence of methylglyoxal (gray circles). For each panel, the dark green and black circles are the maxima of the growth rates in the corresponding settings and the dark green and black inverse triangles mark the corresponding optima of external cAMP that maximizes growth. The dashed green and black lines are the growth rates of cIAC in the presence and absence of methylglyoxal respectively. With the increase of methylglyoxal from 6 to 8 and then 10 mM, the maximal growth rate and optimal cAMP level both decrease monotonically. Concurrently, the ratio of the maximal growth rate of cEAC (dark green circles) and the growth rate of cIAC (dark green lines) increases from 0.28% to 1.75% and 5.72%.
We proceeded to quantify growth maximization by supplementing various concentrations of methylglyoxal to glucose batch fermentations involving the cIAC and cEAC strains. Fig. 4d–f shows that the growth rate of the cIAC system (dark green dash lines) remains largely comparable to but slightly lower than the maxima of the cEAC mutant for various levels of external cAMP analog (dark green circles) (Supplementary Table 4). Specifically, the difference increases from 0.28% to 1.75% and 5.72% as the methylglyoxal level changes from 6 mM to 8 mM and 10 mM. Consistent with this pattern, the difference in EGFP expression of the cIAC and cEAC systems also increases accordingly (Supplementary Figs. 7 and 8). Therefore, the cAMP-mediated control continues to largely fulfill the function of resource allocation for maximal growth, but its ability declines slightly with the increase of glucose uptake perturbations.
Additionally, we noticed that both the optimal cAMP and the maximal growth rate of the cEAC mutant (dark green inverse triangle and circle) decreases with increasing methylglyoxal concentrations when compared with the optimal cAMP and growth rate of cEAC mutant in the absence of methylglyoxal (black inverse triangle and circle). This trend could be understood from the perspective of cAMP-mediated resource allocation control and the associated flux towards protein synthesis. The increase in methylglyoxal supplementation reduces glucose uptake, which subsequently leads to a drop in the cAMP level. Regarding growth rate, this reduction in cAMP causes a global proteome reprograming, including a decrease in ribosomal proteins, thereby lowering the overall protein synthesis capacity. Meanwhile, the inhibition of glucose uptake caused by methylglyoxal directly reduces the total amount of carbon entering the cell. As a result, cellular growth rate declines with the increase of methylglyoxal.
Changing environments need dynamic resource allocation for growth maximization.
Natural habitats are often highly dynamic, requiring microbes to quickly adapt to environmental variations. To elucidate how S. cerevisiae responds to these conditions through cAMP-mediated resource allocation, we set out to study the growth dynamics of the cIAC system and cEAC mutant during a nutrient shift from YPD (glucose) to YPE (ethanol) media. Using our model, we compared the growth of the cIAC system to that of the cEAC mutant under three specific external cAMP profiles, namely a constant high level that confers maximal growth in YPD, a constant low level favoring growth maximization in YPE, and a dynamic profile involving the transition from a high to a low level suiting the two corresponding conditions. Our simulations (Fig. 5a–d) predicted that it is the dynamic cAMP shift (Fig. 5d), not either of the constant profiles (Fig. 5b,c), that leads to a biomass accumulation of the cEAC mutant comparable to that of the cIAC system (Fig. 5a). Notably, in principle, transient growth rate is a straightforward output to directly illustrate the effectiveness of different control modes; total cell number was used here because of its ease for direct experimental comparison. To test these predictions, we performed the YPD-to-YPE shift experiments. Here, cells were pre-grown in glucose to a steady state before starting the YPD fermentation to eliminate the initial lag phase from inoculation and were transferred to the YPE media before glucose was depleted to avoid diauxic growth. Encouragingly, the results (Fig. 5e–h and Supplementary Fig. 9a,b) confirm the model predictions.
Figure 5 |. Cellular growth in changing environments with different modes of cAMP control.
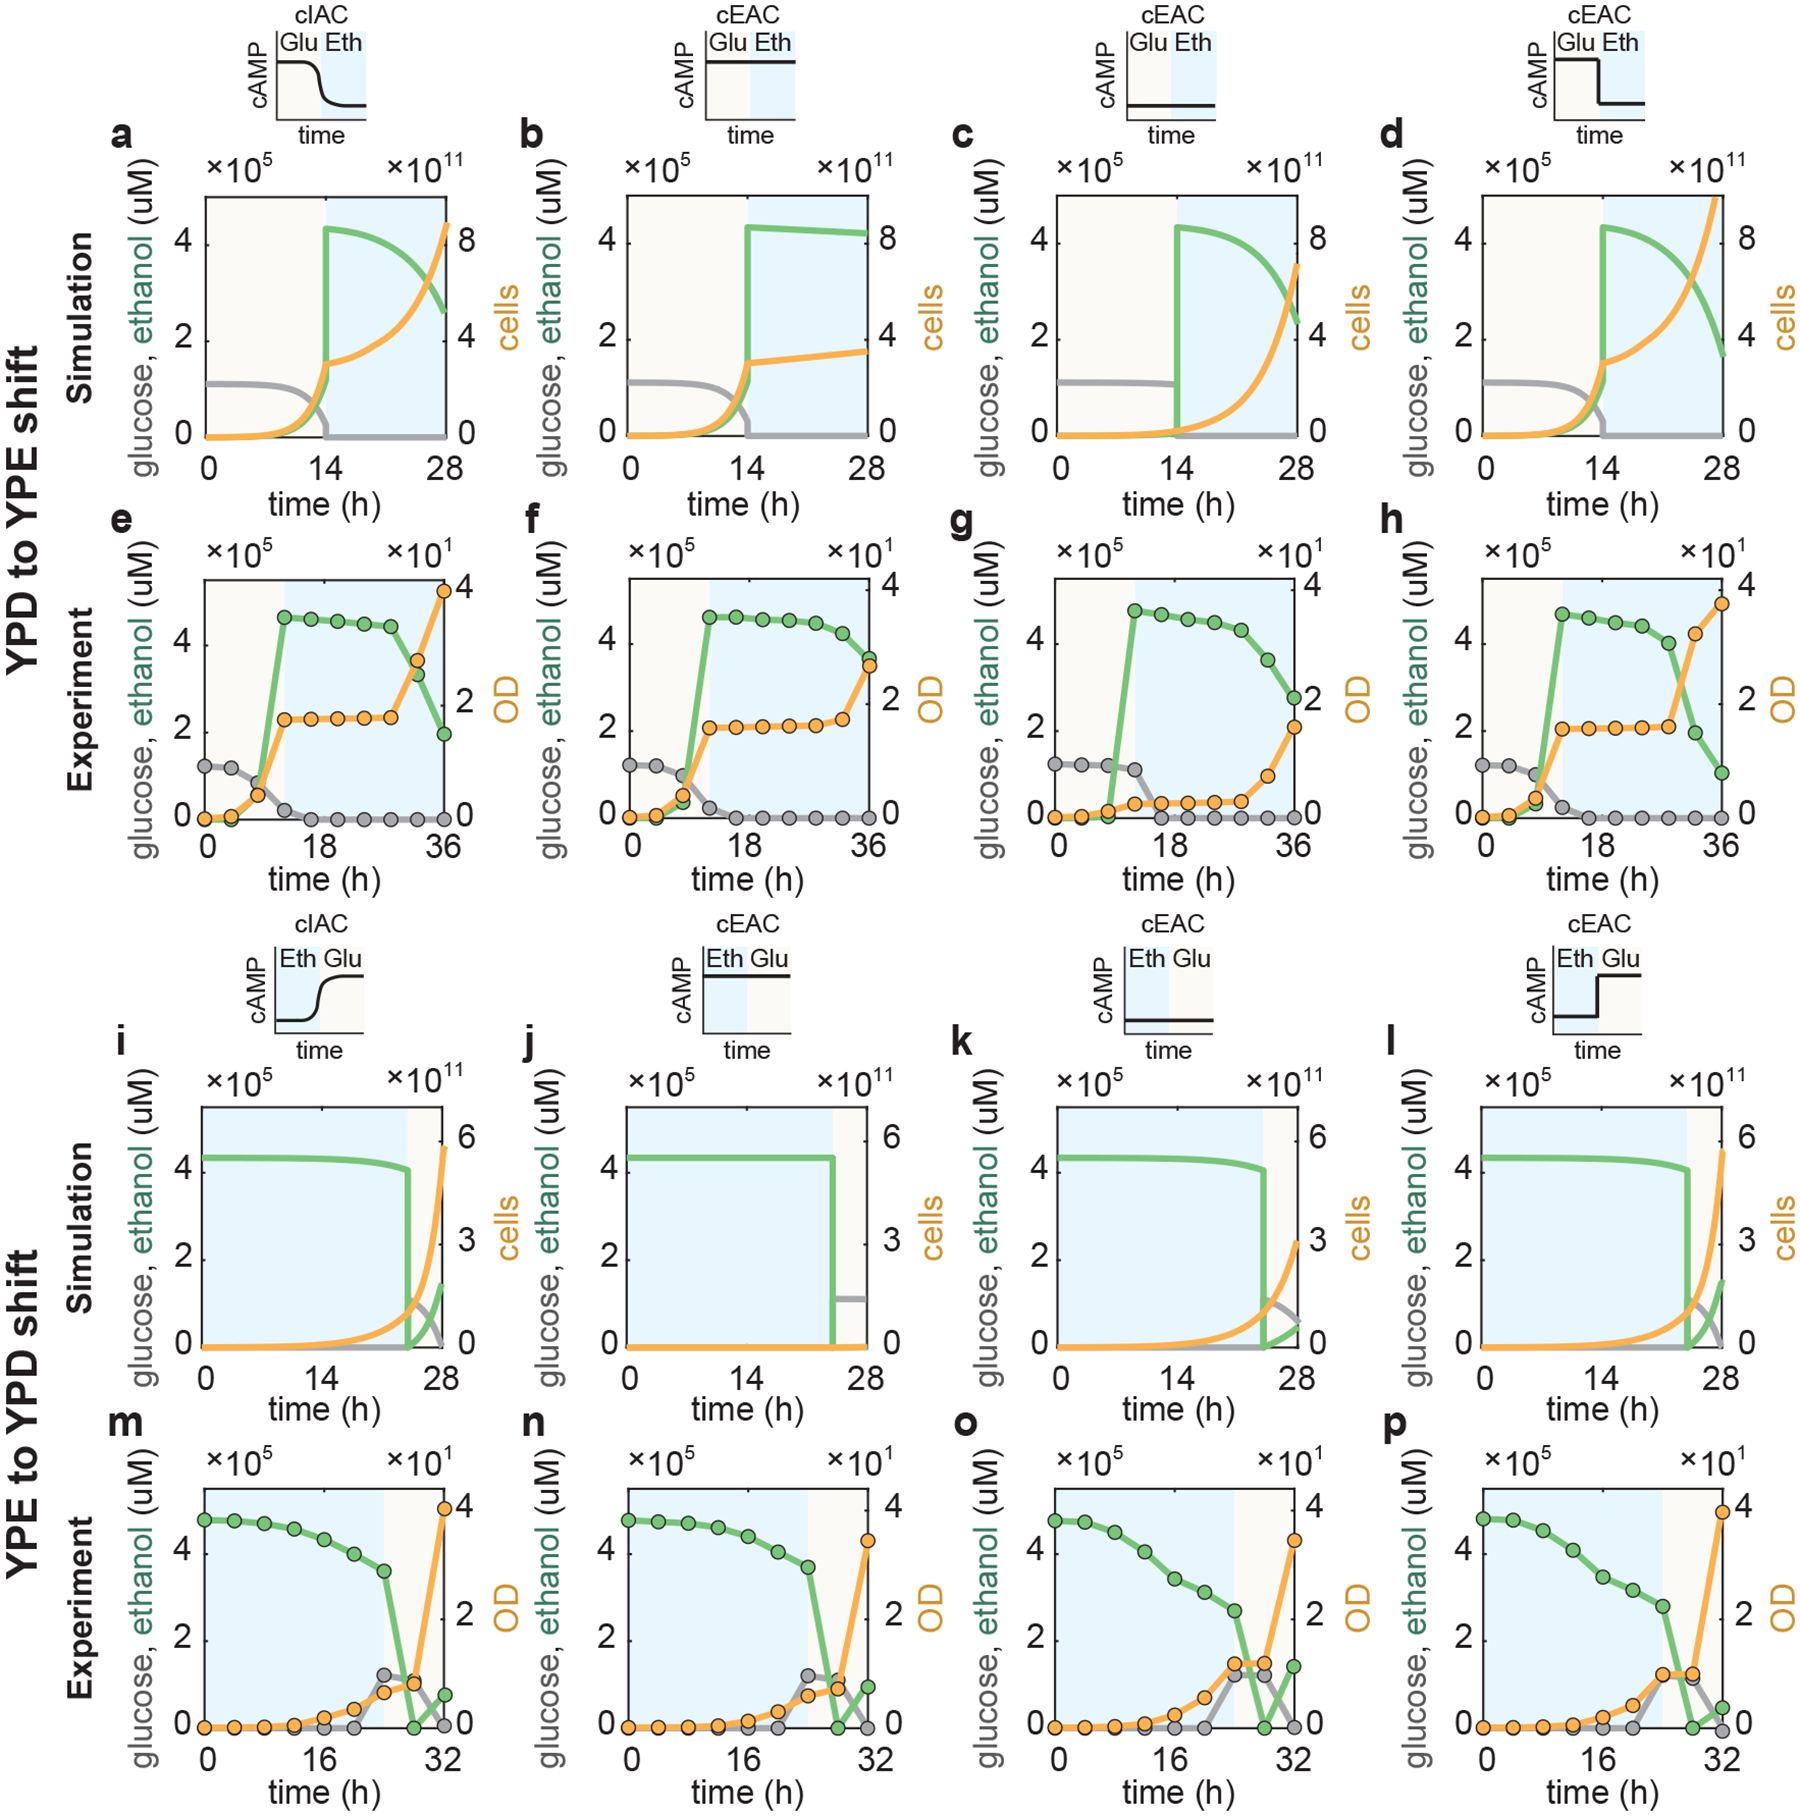
a-h, Simulations (a-d) and experiments (e-h) of S. cerevisiae growth dynamics and associated glucose and ethanol profiles during a nutrient shift from YPD (glucose) to YPE (ethanol) media under four cAMP controls. a,e, cIAC without any external cAMP; b,f, cEAC with a high level of external cAMP that optimizes the growth on YPD; c,g, cEAC with a low level of external cAMP that suits YPE medium; d,h, cEAC with a dynamic control of cAMP that is high initially when the media is YPD but is later shifted to a low level when the media is altered to YPE. I-p, Simulations (i-l) and experiments (m-p) of S. cerevisiae growth dynamics and associated glucose and ethanol profiles during the nutrient shift from YPE (ethanol) to YPD (glucose) media under four cAMP controls. i,m, cIAC without any external cAMP; j,n, cEAC with a constant high level of external cAMP that optimizes the growth on YPD; k,o, cEAC with a constant low level of external cAMP that suits YPE medium; l,p, cEAC with a dynamic control of cAMP that remains low initially when the media is YPE but is shifted to a high level when the media is later changed to YPD. For each panel, the light yellow and blue background colors indicate the YPD and YPE media respectively. Gray lines and circles: glucose concentration; green lines and circles: ethanol level; yellow lines and circles: cell number and OD. Simulation details can be found in Supplementary Method 1.2.
Similarly, we combined simulation with experiment to assess cellular resource allocation and growth maximization when the nutrient is shifted from YPE to YPD media (Fig. 5i–p). Here, we compared the growth of the cIAC and cEAC systems for a constant high level, a constant low level, and a dynamic low-to-high shift of external cAMP. Compared to the cIAC system (Fig. 5i,m and Supplementary Fig. 9c,d, gray bars), the mutant with a constant high or low cAMP level generates a lower biomass because it grows poorly on either ethanol (Fig. 5j,n and Supplementary Fig. 9c,d, blue bars) or glucose (Fig. 5k,o and Supplementary Fig. 9c,d, red bars). By contrast, the mutant with the dynamic cAMP shift achieves a comparable final biomass (Fig. 5l,p and Supplementary Fig. 9c,d, green bars). From these results, we drew two conclusions. First, there is no single cAMP level that optimizes growth in changing environments such as YPD-to-YPE or YPE-to-YPD shifts; instead, a dynamic cAMP alteration that echoes the nutrient shift is required. Second, the native cAMP-mediated control in the WT S. cerevisiae is optimized for resource allocation and growth maximization at least for the changing environments we tested.
To determine if these conclusions remain valid in natural contexts, we simulated and experimentally performed glucose-based batch fermentations (Methods). During this process, S. cerevisiae begins by consuming glucose and concurrently producing a prodigious amount of ethanol. Once the glucose is depleted, the cells assimilate the ethanol to enable a second phase of growth46,47. The cIAC system exhibits two modes of growth due to the diauxic shift (Fig. 6a,e and Supplementary Fig. 10a). The cEAC mutant with the high cAMP level grows on glucose as rapidly as the cIAC system but grows much slower after switching to ethanol utilization (Fig. 6b,f and Supplementary Fig. 10b). When supplied with the low level of cAMP, the cEAC mutant grows much slower on glucose and takes longer to deplete the glucose before it is able to grow relatively quickly on ethanol (Fig. 6c,g and Supplementary Fig. 10c). With the dynamic cAMP control, the mutant grows efficiently both on glucose and ethanol and accumulates a high biomass like the WT (Fig. 6d,h and Supplementary Fig. 10d). This study demonstrated that S. cerevisiae dynamically alters its intracellular cAMP level to reallocate its resources when its carbon source changes from glucose to ethanol. Additionally, Fig. 6h shows that the lag phase remains significant even though the cAMP shift was instantaneous, implying that the lag time does not arise from cAMP-mediated signal transduction but instead from downstream steps, such as the reprograming of gene expression for gluconeogenesis and respiration48–52.
Figure 6 |. Cellular growth in a glucose-based batch fermentation with different modes of cAMP control.
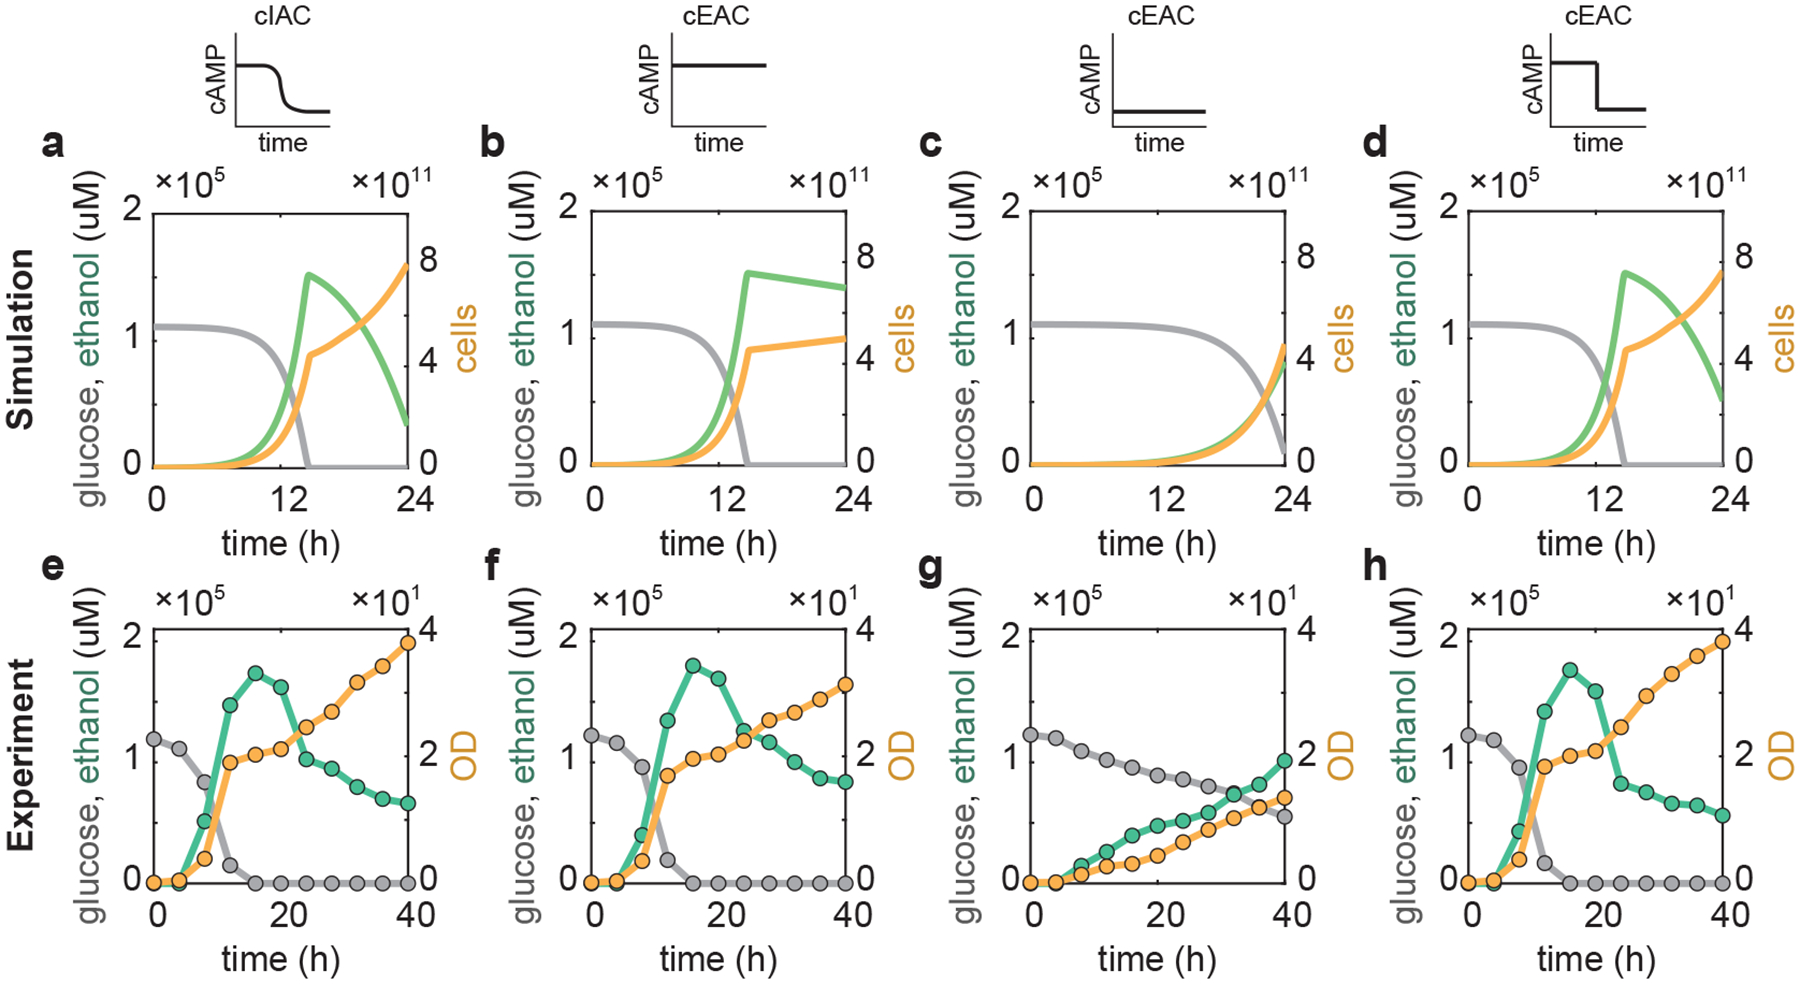
a-d, Simulations of the fermentation with four different cAMP controls. a, cIAC without any external cAMP; b, cEAC with a constant high external cAMP level that optimizes the growth on glucose; c, cEAC with a constant low external cAMP concentration that suits ethanol utilization; d, cEAC with a dynamic control of cAMP that is high when glucose is the carbon source but is shifted to a low level when glucose is depleted and secreted ethanol becomes the carbon source. e-h, Experiments of the fermentation with four different cAMP controls. e, cIAC without any external cAMP; f, cEAC with a constant high external cAMP level that optimizes the growth on glucose; g, cEAC with a constant low external cAMP concentration that suits ethanol utilization; h, cEAC with a dynamic control of cAMP that is high when glucose is the carbon source but is shifted to a low level when glucose is depleted and secreted ethanol becomes the carbon source. For all panels, dashed lines indicate the time when glucose is depleted; in panels c and g, glucose is not depleted throughout the experiment. Gray lines and circles: glucose concentration; green lines and circles: ethanol level; yellow lines and circles: cell number and OD. Simulation details can be found in Supplementary Method 1.2.
Additional allocation control participates in growth optimization.
S. cerevisiae holds multiple regulatory systems for directing cellular resource partition. For example, besides the cAMP-mediated pathway that responds to glucose availability, there is another well-recognized circuit that centers on the protein kinase GCN2 that acts to maintain intracellular amino acid homeostasis23. During amino acid starvation, uncharged tRNA rapidly accumulates inside the cell and binds to and activates GCN223,53. Active GCN2 then phosphorylates the eukaryotic translation initiation factor 2 (eIF2) to reduce ternary complex formation, thereby inhibiting the general efficiency of protein translation. As the reduction in the abundance of this complex also promotes the translation of GCN454,55, a transcriptional activator that upregulates the genes encoding enzymes in amino acid biosynthesis, active GCN2 simultaneously augments amino acid influx (Supplementary Fig. 11a). From a control perspective, the controlling circuit utilizes GCN2 as a sensing and actuating core to generate negative feedback on influx and feedforward control on outflux to maintain amino acid homeostasis (Fig. 7a).
Figure 7 |. GCN2-mediated resource allocation contributes to growth optimization.
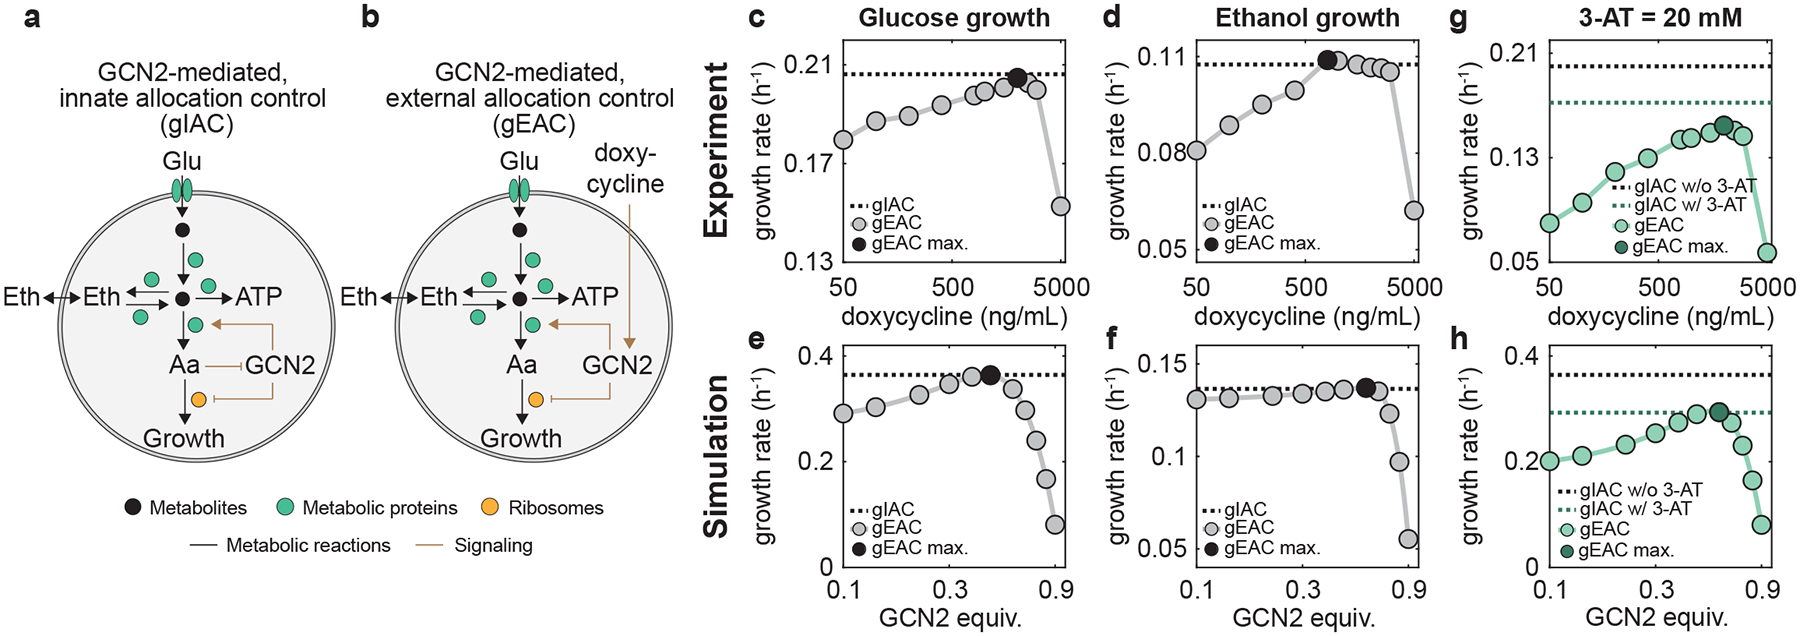
a, GCN2-mediated, innate allocation control (gIAC) in the WT which contains native regulation that senses free amino acid availability. b, GCN2-mediated, external allocation control (gEAC) in a mutant which is abolished in native regulation but subject to external doxycycline. c-h, Experimentally measured and simulated growth rates of gEAC under different doxycycline levels (circles) and gIAC without external doxycycline (dashed line) when growing on glucose (c,e) and ethanol (e,f). g-h, Experimentally measured (g) and simulated (h) growth rates of gEAC under different doxycycline levels (light green circles) and gIAC without external doxycycline (green dashed line) when growing on glucose and supplemented with 20 mM of 3-AT. The black dashed lines indicate the growth rate of gIAC without supplemented 3-AT. For panels c-h, black and dark green circles indicate the maximal growth rate of gEAC under corresponding conditions. Simulation details can be found in Supplementary Method 1.2.
To dissect the role of the GCN2-mediated controlling system for growth, we created a mutant by replacing the native promoter of gcn2 with an inducible promoter PTetO7 that is controllable with doxycycline (Methods) (Fig. 7b). This mutant allowed us to use doxycycline to externally modulate the GCN2 level, which in turn alters the expression of downstream genes and the distribution of metabolic fluxes. For both the WT and the mutant, we inserted EGFP downstream of arg1, a gene whose expression is negatively correlated with the GCN2 level56 to encode a fluorescence reporter (Supplementary Fig. 11b). The resulting strains were named gIAC (GCN2-mediated, innate allocation control) and gEAC (GCN2-mediated, external allocation control) respectively. During a batch fermentation with minimal media that contains glucose as a sole carbon source, the growth rate of gIAC overlaps with the maximal growth rate of gEAC under various doxycycline concentrations (Fig. 7 and Supplementary Table 4). Consistently, gIAC shows comparable glucose uptake, ethanol production, and biomass accumulation to gEAC at the optimal doxycycline level (Supplementary Fig. 12). Thus, the GCN2-mediated controlling system of the cell is optimized for glucose utilization. However, gEAC still grows universally slower than gIAC except for the single specific case when doxycycline equals ng/mL (Fig. 7c). This demonstrates that a single circuit is not sufficient to achieve growth maximization. Instead, growth maximization requires optimal functioning of multiple regulatory mechanisms including both the cAMP- and GCN2-mediated circuits.
Meanwhile, when growing on ethanol, the gIAC strain shows 3.06% less in growth rate than the gEAC strain supplemented with its optimal doxycycline concentration (1000 ng/mL) (Fig. 7d and Supplementary Table 4). The corresponding ethanol uptake rate and biomass accumulation of gIAC are also lower than those of gEAC (Supplementary Fig. 13). Thus, similar to cAMP-mediated regulation, GCN2-mediated control is nearly but not fully optimized for growth maximization during ethanol consumption.
We used our mathematical model to further elucidate the quantitative details of the GCN2-mediated allocation and its relationship to growth (Methods). Our simulations show that at a low level of GCN2, protein translation in general—which is negatively controlled by GCN2—is efficient and not repressed by GCN2 (Supplementary Fig. 14a) but that of amino acid biosynthesis enzymes is suppressed (Supplementary Fig. 14b), leading to the shortage in amino acid supply. On the other hand, when GCN2 is over-abundant, the general efficiency of protein translation becomes significantly reduced but the translation of amino acid biosynthesis enzymes increases through GCN4-mediated activation (Supplementary Fig. 14b). In this case, translation becomes a bottleneck that limits cell growth. Thus, both inadequate and excessive GCN2 regulation result in an imbalanced protein partitioning which, in turn, causes a reduction in the carbon flux towards protein synthesis and hence in growth for both glucose and ethanol metabolism (Fig. 7e,f).
Furthermore, we investigated the GCN2-mediated growth maximization of S. cerevisiae in the presence of perturbations of key metabolic reactions. We used 3-aminotriazole (3-AT), which inhibits histidine biosynthesis and hence causes a shortage in amino acid influx57. As GCN2 senses amino acid shortage, 3-AT supplementation should trigger the activity of GCN2 to differentially reprogram protein translation to alter metabolism (Supplementary Fig. 15). Our simulations and experiments (Fig. 7g,h) both show that, although its absolute value is reduced upon the addition of 20 mM 3-AT (green vs. black dash lines), the growth rate of gIAC shows to be larger than the maximum of gEAC under various doxycycline levels (Supplementary Table 4), suggesting that GCN2-mediated control remains functional for growth maximization during 3-AT perturbations. Meanwhile, the same fact also implies that a high level of doxycycline may cause growth inhibition; thus, we cannot fully rule out the possibility that the toxicity of doxycycline resulted in the inaccuracy of experimental measure.
Discussion
Through experiment and modeling, we showed here that S. cerevisiae achieves maximal or nearly maximal steady-state growth during the utilization of glucose, fructose, sucrose, and ethanol as well as in the presence of perturbations on glucose uptake. We also found differential optima for the global regulator cAMP, suggesting that the organism undergoes different resource partitioning for different environmental conditions and perturbations. Additionally, we showed that S. cerevisiae leverages its regulatory circuitry to dynamically reprogram its translation and metabolic flux for rapid adaptation in changing environments involving substrate variations, and further demonstrated that optimal growth requires collective functioning of multiple controlling mechanisms. These findings advance our fundamental understanding of cellular resource allocation and the quantitative characteristics of S. cerevisiae metabolism. The study also yields valuable implications for metabolic engineering and synthetic biology research. For example, acknowledging their profound roles in global proteome and metabolic flux, the global regulatory circuits involving cAMP and GCN2 can be potentially reprogrammed to optimize metabolic flux distribution for the overproduction of heterologous proteins or the introduction of de novo biosynthetic pathways for production of fuels, chemicals, and materials.
Although our study focuses on proteome allocation, it is important to note that cAMP- and GCN2-mediated control drives the modulation of a variety of biomolecules and processes. In addition to altering the abundance of ribosomes and enzymes, it tunes enzyme activities, signaling transduction, metabolic characteristics, and cell cycle along with other molecules and processes that are directly or indirectly regulated by the global signaling molecules. Accordingly, the observed phenomena represent collective response emerged from the alteration of a number of related molecules and processes. In addition, although in our tests S. cerevisiae seems robust in maximizing growth for the four carbon sources and in both static and dynamic settings, we do not rule out the possibility that the organism may grow sub-optimally during the consumption of other substrates. In fact, for E. coli, a recent elegant study reported sub-optimal growth in certain cases15. Ultimately, the optimization ability of S. cerevisiae growth is an emergent cellular property that is determined by the underlying metabolic reactions, signal transduction, and gene expression and by their orchestration at the systems level. Nevertheless, the growth maximization of S. cerevisiae observed here, along with the reported maximal growth of E. coli in most settings15, suggests that global signaling-mediated resource allocation is a potentially generalizable controlling strategy that confers proper flux distribution and optimal growth across species despite their variations in molecular details. In that regard, this study sets the stage for exploring the transferability and generalizability of the design principles of such molecular networks in a broader context.
Methods
Mathematical modeling of S. cerevisiae metabolism and growth.
We adopted our previously developed mathematical framework of S. cerevisiae metabolism34 as a quantitative tool to elucidate the signaling-mediated resource allocation and its relationship to S. cerevisiae growth. Briefly, as illustrated in Fig. 1b, the model is composed of three coarse-grained functional parts: metabolic reactions, signaling, and gene regulation. The metabolic reactions module describes the conversion of carbon to metabolic precursors which are further processed into amino acids, ATP, ethanol, and storage carbohydrates. The signaling module utilizes a coarse-grained description for the cAMP-mediated regulation and GCN2-mediated regulation to lump together regulatory mechanisms that sense glucose and amino acids respectively and regulate the abundances and activities of cellular proteins (e.g., enzymes and ribosomes). The gene regulation module involves the transcription and translation of three coarse-grained sectors of the entire proteome, including ribosomal and ribosome-affiliated proteins (R), metabolic enzymes (E), and the remainder of the proteome (Z). The E sector is further divided into ten subsectors that correspond to enzymes for different coarse-grained steps of metabolic reactions. Each module was characterized individually and integrated together by connecting their inputs and outputs. The model was parametrized using data from literature as well as through data fitting.
The model was used directly to describe cellular resource allocation and biomass growth for the WT strains cIAC and gIAC. The cEAC mutant was computationally created by substituting the expression for the active SNF1 concentration ([]), which is related to the intracellular cAMP concentration, with an externally tunable parameter whose value varies from 0 to [] (the total SNF1 concentration). The cAMP equivalent, defined as, was then used to reflect the effective level of external cAMP analog used in the experiment. The gEAC mutant was computationally established by replacing the expression for the active TORC1 concentration ([]) with an externally tunable parameter whose value varies from 0 to [] (the total TORC1 concentration). The GCN2 equivalent, defined as , was used to describe different concentrations of external doxycycline used in the experiment. With these in silico descriptions of the strains cIAC, cEAC, gIAC, and gEAC, we performed a set of computational growth assays that align with the experimental fermentations with corresponding parameters and implementation detailed in Supplementary Method 1.2.
Strains and Cultivation Conditions.
Escherichia coli DH5α strains were cultured at 37°C in Luria Broth (LB) medium supplemented with 100 μg/mL ampicillin or kanamycin, depending on the antibiotic markers inside the plasmids. S. cerevisiae BY4741 strains were propagated at 30°C in YPD medium (10 g/L yeast extract, 20 g/L peptone, 20 g/L glucose). Besides glucose, carbon sources used in the study were 20 g/L fructose, 20 g/L sucrose, and 20 g/L ethanol. To select strains with the integration of hsp12-yoEGFP-adh1-KanMX or arg1-yoEGFP-adh1-KanMX, 100 μg/mL G418 (KSE Scientific, Durham, NC) was supplemented to the growth media. For the cEAC mutant, BY4741 transformants with cdc25Δpde2Δ were cultured and selected in Synthetic Complete (SC) dropout medium lacking uracil (SC-URA). Exogenous cAMP analog with various concentrations (0, 0.039, 0.078, 0.15, 0.31, 0.625, 1.25, 2.5, 5 or 10 mM) were used in the study of the cEAC strain. For the gEAC mutant, BY4741 transformants with an inducible promoter upstream of gcn2 (linearized pRS403-TetO7p-gcn2 plasmid by NheI) and linearized pRS406-rtTA plasmid by StuI were co-transformed, cultured, and selected in the SC dropout medium lacking histidine and uracil (SC-HIS-URA). Exogenous inducer doxycycline with various concentrations (0, 0.05, 0.1, 0.2, 0.4, 0.8, 1, 1.5, 2, 2.5, 3 or 5 μg/mL) were used for the control of the gEAC strain. DNA Q5 polymerase and all restriction enzymes were purchased from New England Biolabs (Ipswich, MA). DNA extraction and purification kits were purchased from Qiagen (Valencia, CA). All other chemicals such as 8-bromoadenosine 3’,5’-cyclic monophosphate (cAMP analog), doxycycline, methylglyoxal, and 3-amino-1,2,4-triazole (3-AT) were purchased from Sigma-Aldrich (St. Louis, MO). All oligonucleotides such as primers, guide RNAs (gRNAs) and gene blocks (gBlocks) were synthesized by Integrated DNA Technologies (Coralville, IA).
Plasmid Construction.
To construct the cAMP and GCN2 reporter systems, hsp12 (for cAMP) and arg1 (for GCN2) gene cassettes were directly PCR amplified from the BY4741 WT strain genomic sequence with downstream reverse primers containing 40 bp overhang homology to the starting region of adh1 (terminator), respectively. The yoEGFP-adh1-KanMX was PCR amplified from plasmid pFA6a-link-yoEGFP-Kan (Addgene#4490058) with 40 bp upstream forward primer overhang homology to the end of hsp12 or arg1 gene. The stop codons of hsp12 and arg1 were removed to enable the expression of downstream EGFP cassette. To construct the cEAC mutant, genes encoding proteins that produce (cdc25) and degrade (pde2) cAMP were removed. The Homology-Integrated type II Clustered Regularly Interspaced Short Palindromic Repeats (HI-CRISPR) method59,60 was used to construct the plasmids containing cdc25 or pde2 homology arms. Both cdc25 and pde2 genes were PCR amplified from the BY4741 WT strain genomic sequence directly. The guide RNAs (gRNAs) for CRISPR cutting were designed using the online software CHOPCHOP (https://chopchop.cbu.uib.no/). The linearized plasmid pCRCT backbone by BsaI (from previous study)59,60 was used for the cloning of cdc25- or pde2-containing gBlock before yeast transformation. To construct the gEAC mutant, a gcn2 gene cassette was directly PCR amplified from the BY4741 WT strain genomic sequence without the endogenous promoter. The upstream forward and downstream reverse primers of gcn2 had 40 bp overhang homologies to the backbone TetO7p repeated region of the the linearized pRS403-TetO7p-MCS plasmid (from previous study)61. The DNA fragments were then assembled via Gibson Assembly62 to construct a Tet-inducible promoter for driving gcn2 expression. Linearized pRS406-rtTA61 was also introduced to achieve the control of gcn2 expression by doxycycline61. All the plasmids used in this study are listed in Supplementary Table 1. All the primers, gRNAs, and gBlocks used in this study are listed in Supplementary Table 2. All strains used in this study are listed in Supplementary Table 3.
Strain Construction.
For the cEAC mutant, yoEGFP-adh1-KanMX with hsp12 gene were co-transformed into BY4741 WT strain, colonies were selected by G418 antibiotic marker. Ten percent of the transformants were then spread onto YPD + G418 agar plates and single colonies were randomly picked with sterilized pipet tips. The Phire Tissue Direct PCR master mix kit from ThermoFisher Scientific (Waltham, MA) was used for colony PCR to verify the final constructs. Next, the cdc25Δpde2Δ BY4741 strain was constructed by HI-CRISPR method59,60. The plasmid contained cdc25 or pde2 gBlock was transformed into the above engineered hsp12-yoEGFP-adh1-KanMX strain and selected in SC-URA medium. Ten percent of the transformants were then spread onto SC-URA agar plates and single colonies were randomly picked with sterilized pipet tips for genotyping. For the gEAC mutant, yoEGFP-adh1-KanMX with arg1 gene were co-transformed into BY4741 WT strain, colonies were selected by G418 antibiotic marker. Ten percent of the transformants were then spread into YPD + G418 agar plates and single colonies were randomly picked. Similarly, colony PCR and DNA sequencing were applied to confirm the knockout. Next, the BY4741 with TetO7p inducible promoter strain was transformed into the above engineered arg1-yoEGFP-adh1-KanMX strain and selected in SC-HIS-URA medium. Transformants were plated and single colonies were picked for genotyping. All the strains used in this study are listed in Supplementary Table 3.
Transformation of S. cerevisiae.
Transformation was performed to enable in vivo DNA assembly63. The WT S. cerevisiae BY4741 and the engineered strains were cultured in 2 mL YPD overnight. On the following day, the culture was diluted to an initial optical density at 600 nm (OD600) of 0.2. To achieve the best transformation time-point, cells were continuously grown for ~4 h until they reached an OD600 of 0.8. Cells were centrifuged for 10 min at 2773 relative centrifugal force (rcf) and washed twice with deionized water. Next, 240 μL of 50% (wt/vol) polyethylene glycol (PEG) 3350, 50 μL of 2 mg/mL DNA from salmon testes (SS-DNA) that was boiled at 100°C for 10 min and quickly chilled on ice, 34 μL of deionized water with 1 μg linearized plasmid or PCR product, and 36 μL of 1 M lithium acetate were added in order to form a 360 μL transformation mixture. After mixing thoroughly by vortex, the suspension was subjected to heat shock for 1 h at 42°C. Cells were washed by deionized water and collected by centrifugation. Appropriate dilution was applied to the mixture before spreading on selection plates.
Fluorescence intensity measurement.
Strains were precultured in selected medium for 2 days and then inoculated into the fresh synthetic media with an initial OD600 of 0.1. Mid-log phase yeast cells were diluted 2-fold in water and EGFP fluorescence was measured with an excitation wavelength at 488 nm and an emission wavelength at 509 nm, respectively. Tecan Infinite M1000 PRO multimode reader (Tecan Trading AG, Switzerland) and Corning 96-well black flat bottom clear plate (Corning, NY) were used. The fluorescence intensity was normalized to the cell density (OD600) measured using the same microplate reader.
Cultures for HPLC analysis.
Yeast cells were precultured at 30°C, 250 rpm in 2 mL culture medium with glucose, fructose, sucrose, or ethanol as a carbon source until reaching the stationary phase. On the following day, the sample was adjusted to 0.1 OD600 units/mL and inoculated into 5 mL fresh culture medium for shaking 96 h at 30°C, 250 rpm. At each time point, 100 μL cells were centrifuged down for 15 min at 2773 rcf, the supernatant was diluted into 900 μL water for high-performance liquid chromatography (HPLC) analysis. A refractive index detector (Agilent Technologies, Santa Clara, CA) with an Aminex HPX-87H column (Bio-Rad, Hercules, CA) was used. The column temperature was maintained at 65°C, and 0.005% sulfuric acid was used as the mobile phase with a flow rate of 0.6 mL/min. If there was a change in carbon source such as from YPD (glucose) to YPE (ethanol) at certain time points, cells were centrifuged down for 15 min at 2773 rcf and transferred into fresh culture medium with new conditions. If only the cAMP analog concentration was changed, WT cells were cultured in YPD in parallel at the beginning of fermentation. At the time point for changing the cAMP analog concentration, WT cells and engineered cells were both centrifuged down for 15 min at 2773 rcf. The collected engineered cells were then transferred into the supernatant of WT YPD culture. At the same time, the new amount of the cAMP analog was added to the fresh culture.
Supplementary Material
Acknowledgements
This work was supported by the DOE Center for Advanced Bioenergy and Bioproducts Innovation (U.S. Department of Energy, Office of Science, Office of Biological and Environmental Research under Award Number DE-SC0018420) (HZ and TL) and the National Institute of General Medical Sciences (GM133579) (TL). Any opinions, findings, and conclusions or recommendations expressed in this publication are those of the author(s) and do not necessarily reflect the views of the U.S. Department of Energy.
Footnotes
Additional information
Supplementary information is available for this paper.
Competing interests
The authors declare no competing financial interests.
Data availability.
The data that support the conclusions of this study are available from the corresponding author upon request. The source code and the mathematical details of the model are available at GitHub (https://github.com/Lulabcodes/YGO).
References
- 1.Bruggeman FJ, Planqué R, Molenaar D, & Teusink B Searching for principles of microbial physiology. FEMS Microbiology Reviews 44, 821–844 (2020). [DOI] [PMC free article] [PubMed] [Google Scholar]
- 2.Bosdriesz E, Molenaar D, Teusink B, & Bruggeman FJ How fast-growing bacteria robustly tune their ribosome concentration to approximate growth-rate maximization. FEBS Journal 282, 2029–2044 (2015). [DOI] [PMC free article] [PubMed] [Google Scholar]
- 3.Nissen TL, Schulze U, Nielsen J, & Villadsen J Flux distributions in anaerobic, glucose-limited continuous cultures of Saccharomyces cerevisiae. Microbiology 143, 203–218 (1997). [DOI] [PubMed] [Google Scholar]
- 4.Frick O & Wittmann C Characterization of the metabolic shift between oxidative and fermentative growth in Saccharomyces cerevisiae by comparative 13C flux analysis. Microb. Cell Fact 4, 30 (2005). [DOI] [PMC free article] [PubMed] [Google Scholar]
- 5.Ertugay N & Hamamci H Continuous cultivation of bakers’ yeast: Change in cell composition at different dilution rates and effect of heat stress on trehalose level. Folia Microbiologica 42, 463–467 (1997). [DOI] [PubMed] [Google Scholar]
- 6.Alberts B, Johnson A, Lewis J, Raff M, Roberts K, & Walter P Molecular Biology of the Cell (4th ed.) (2002). [Google Scholar]
- 7.Klumpp S, Zhang Z, & Hwa T Growth rate-dependent global effects on gene expression in bacteria. Cell 139, 1366–1375 (2009). [DOI] [PMC free article] [PubMed] [Google Scholar]
- 8.Scott M, Gunderson CW, Mateescu EM, Zhang Z, & Hwa T Interdependence of cell growth and gene expression: Origins and consequences. Science 330, 1099–1102 (2010). [DOI] [PubMed] [Google Scholar]
- 9.Scott M & Hwa T Bacterial growth laws and their applications. Current Opinion in Biotechnology 22, 559–565 (2011). [DOI] [PMC free article] [PubMed] [Google Scholar]
- 10.Liao C, Blanchard AE, & Lu T An integrative circuit-host modelling framework for predicting synthetic gene network behaviours. Nature Microbiology 2, 1658–1666 (2017). [DOI] [PubMed] [Google Scholar]
- 11.You C et al. Coordination of bacterial proteome with metabolism by cyclic AMP signalling. Nature 500, 301–306 (2013). [DOI] [PMC free article] [PubMed] [Google Scholar]
- 12.Li GW, Burkhardt D, Gross C, & Weissman JS Quantifying absolute protein synthesis rates reveals principles underlying allocation of cellular resources. Cell 157, 624–635 (2014). [DOI] [PMC free article] [PubMed] [Google Scholar]
- 13.Peebo K et al. Proteome reallocation in Escherichia coli with increasing specific growth rate. Molecular BioSystems 11, 1184–1193 (2015). [DOI] [PubMed] [Google Scholar]
- 14.Metzl-Raz E et al. Principles of cellular resource allocation revealed by condition-dependent proteome profiling. eLife, 6, (2017). [DOI] [PMC free article] [PubMed] [Google Scholar]
- 15.Towbin BD et al. Optimality and sub-optimality in a bacterial growth law. Nature Communications 8, (2017). [DOI] [PMC free article] [PubMed] [Google Scholar]
- 16.Tripodi F, Nicastro R, Reghellin V, & Coccetti P Post-translational modifications on yeast carbon metabolism: Regulatory mechanisms beyond transcriptional control. Biochimica et Biophysica Acta – General Subjects 1850, 620–627 (2015). [DOI] [PubMed] [Google Scholar]
- 17.Conrad M et al. Nutrient sensing and signaling in the yeast Saccharomyces cerevisiae. FEMS Microbiology Reviews 38, 254–299 (2014). [DOI] [PMC free article] [PubMed] [Google Scholar]
- 18.Zaman S, Lippman SI, Zhao X, & Broach JR How Saccharomyces responds to nutrients. Annual Review of Genetics 42, 27–81 (2008). [DOI] [PubMed] [Google Scholar]
- 19.Broach JR Nutritional control of growth and development in yeast. Genetics 192, 73–105 (2012). [DOI] [PMC free article] [PubMed] [Google Scholar]
- 20.Hackett SR et al. Systems-level analysis of mechanisms regulating yeast metabolic flux. Science 354, (2016). [DOI] [PMC free article] [PubMed] [Google Scholar]
- 21.Rolland F, Winderickx J, & Thevelein JM Glucose-sensing and -signalling mechanisms in yeast. FEMS Yeast Research 2, 183–201 (2002). [DOI] [PubMed] [Google Scholar]
- 22.Tamaki H Glucose-stimulated cAMP-protein kinase a pathway in yeast Saccharomyces cerevisiae. Journal of Bioscience and Bioengineering 104, 245–250 (2007). [DOI] [PubMed] [Google Scholar]
- 23.Castilho BA et al. Keeping the eIF2 alpha kinase GCN2 in check. Biochimica et Biophysica Acta – Molecular Cell Research 1843, 1948–1968 (2014). [DOI] [PubMed] [Google Scholar]
- 24.Thevelein JM & De Winde JH Novel sensing mechanisms and targets for the cAMP-protein kinase A pathway in the yeast Saccharomyces cerevisiae. Molecular Microbiology 33, 904–918 (1999). [DOI] [PubMed] [Google Scholar]
- 25.Huberts DHEW, Niebel B, & Heinemann M A flux-sensing mechanism could regulate the switch between respiration and fermentation. FEMS Yeast Research 12, 118–128 (2012). [DOI] [PubMed] [Google Scholar]
- 26.Peeters K et al. Fructose-1,6-bisphosphate couples glycolytic flux to activation of Ras. Nature Communications 8, (2017). [DOI] [PMC free article] [PubMed] [Google Scholar]
- 27.Kraakman L et al. A Saccharomyces cerevisiae G-protein coupled receptor, Gpr1, is specifically required for glucose activation of the cAMP pathway during the transition to growth on glucose. Molecular Microbiology 32, 1002–1012 (1999). [DOI] [PubMed] [Google Scholar]
- 28.Xue Y, Batlle M, & Hirsch JP GPR1 encodes a putative G protein-coupled receptor that associates with the Gpa2p G(α) subunit and functions in a Ras-independent pathway. EMBO Journal 17, 1996–2007 (1998). [DOI] [PMC free article] [PubMed] [Google Scholar]
- 29.Thompson-Jaeger S, Francois J, Gaughran JP, & Tatchell K Deletion of SNF1 affects the nutrient response of yeast and resembles mutations which activate the adenylate cyclase pathway. Genetics 129, 697–706 (1991). [DOI] [PMC free article] [PubMed] [Google Scholar]
- 30.Shashkova S, Welkenhuysen N, & Hohmann S Molecular communication: Crosstalk between the SNF1 and other signaling pathways. FEMS Yeast Research 15, (2015). [DOI] [PubMed] [Google Scholar]
- 31.Sanz P, Viana R, & Garcia-Gimeno MA AMPK in Yeast: The SNF1 (sucrose non-fermenting 1) protein kinase complex. EXS 107, 353–374 (2016). [DOI] [PubMed] [Google Scholar]
- 32.Wilson WA, Hawley SA, & Hardie DG Glucose repression/derepression in budding yeast: SNF1 protein kinase is activated by phosphorylation under derepressing conditions, and this correlates with a high AMP:ATP ratio. Current Biology 6, 1426–1434 (1996). [DOI] [PubMed] [Google Scholar]
- 33.Santangelo GM Glucose signaling in Saccharomyces cerevisiae. Microbiology and Molecular Biology Reviews 70, 253–282 (2006). [DOI] [PMC free article] [PubMed] [Google Scholar]
- 34.Nguyen V, Li Y, & Lu T, Emergence of orchestrated and dynamic metabolism of Saccharomyces cerevisiae, in preparation. [DOI] [PMC free article] [PubMed] [Google Scholar]
- 35.Van Aelst L, Jans AWH, & Thevelein JM Involvement of the CDC25 gene product in signal transmission pathway of the glucose-induced RAS-mediated cAMP signal in the yeast Saccharomyces cerevisiae. Journal of General Microbiology 137, 341–349 (1991). [DOI] [PubMed] [Google Scholar]
- 36.Munder T & Küntzel H Glucose-induced cAMP signaling in Saccharomyces cerevisiae is mediated by the CDC25 protein. FEBS Letters 242, 341–345 (1989). [DOI] [PubMed] [Google Scholar]
- 37.Sass P, Field J, Nikawa J, Toda T & Wigler M Cloning and characterization of the high-affinity cAMP phosphodiesterase of Saccharomyces cerevisiae. Proc. Natl. Acad. Sci. USA 83, 9303–9307 (1986). [DOI] [PMC free article] [PubMed] [Google Scholar]
- 38.Boy-Marcotte E, Perrot M, Bussereau F, Boucherie H, & Jacquet M MSN2p and MSN4p control a large number of genes induced at the diauxic transition which are repressed by cyclic AMP in Saccharomyces cerevisiae. Journal of Bacteriology 180, 1044–1052 (1998). [DOI] [PMC free article] [PubMed] [Google Scholar]
- 39.Li S, Giardina DM, & Siegal ML Control of nongenetic heterogeneity in growth rate and stress tolerance of Saccharomyces cerevisiae by cyclic AMP-regulated transcription factors. PloS Genetics 14, (2018). [DOI] [PMC free article] [PubMed] [Google Scholar]
- 40.Sadeh A, Movshovich N, Volokh M, Gheber L, & Aharoni A Fine-tuning of the MSN2/4-mediated yeast stress responses as revealed by systematic deletion of MSN2/4 partners. Molecular Biology of the Cell 22, 3127–3138 (2011). [DOI] [PMC free article] [PubMed] [Google Scholar]
- 41.Badotti F et al. Switching the mode of sucrose utilization by Saccharomyces cerevisiae. Microbial Cell Factories 7, (2008). [DOI] [PMC free article] [PubMed] [Google Scholar]
- 42.Botman D et al. A yeast FRET biosensor enlightens cAMP signaling. Molecular Biology of the Cell 32, 1229–1240 (2021). [DOI] [PMC free article] [PubMed] [Google Scholar]
- 43.Paulo JA et al. Quantitative mass spectrometry-based multiplexing compares the abundance of 5000 S. cerevisiae proteins across 10 carbon sources. Journal of Proteomics 148, 85–93 (2016). [DOI] [PMC free article] [PubMed] [Google Scholar]
- 44.Wills C Regulation of sugar and ethanol metabolism in Saccharomyces cerevisiae. Critical Reviews in Biochemistry and Molecular Biology 25, 245–280 (1990). [DOI] [PubMed] [Google Scholar]
- 45.Roy A et al. The glucose metabolite methylglyoxal inhibits expression of the glucose transporter genes by inactivating the cell surface glucose sensors RGT2 and SNF3 in yeast. Molecular Biology of the Cell 27, 862–871 (2016). [DOI] [PMC free article] [PubMed] [Google Scholar]
- 46.Zampar GG et al. Temporal system-level organization of the switch from glycolytic to gluconeogenic operation in yeast. Molecular Systems Biology 9, (2013). [DOI] [PMC free article] [PubMed] [Google Scholar]
- 47.Brauer MJ, Saldanha AJ, Dolinski K, & Botstein D Homeostatic adjustment and metabolic remodeling in glucose-limited yeast cultures. Molecular Biology of the Cell 16, 2503–2517 (2005). [DOI] [PMC free article] [PubMed] [Google Scholar]
- 48.Murphy JP, Stepanova E, Everley RA, Paulo JA, & Gygi SP Comprehensive temporal protein dynamics during the diauxic shift in Saccharomyces cerevisiae. Molecular and Cellular Proteomics 14, 2454–2465 (2015). [DOI] [PMC free article] [PubMed] [Google Scholar]
- 49.Galdieri L, Mehrotra S, Yu S, & Vancura A Transcriptional regulation in yeast during diauxic shift and stationary phase. OMICS: A Journal of Integrative Biology 14, 629–638 (2010). [DOI] [PMC free article] [PubMed] [Google Scholar]
- 50.Di Bartolomeo F et al. Absolute yeast mitochondrial proteome quantification reveals trade-off between biosynthesis and energy generation during diauxic shift. Proc. Natl. Acad. Sci. USA 117, 7524–7535 (2020). [DOI] [PMC free article] [PubMed] [Google Scholar]
- 51.Perez-Samper G et al. The Crabtree effect shapes the Saccharomyces cerevisiae lag phase during the switch between different carbon sources. mBio 9, 1–18 (2018). [DOI] [PMC free article] [PubMed] [Google Scholar]
- 52.Cerulus B et al. Transition between fermentation and respiration determines history-dependent behavior in fluctuating carbon sources. eLife 7, (2018). [DOI] [PMC free article] [PubMed] [Google Scholar]
- 53.Zaborske JM, Wu X, Wek RC, & Pan T Selective control of amino acid metabolism by the GCN2 eIF2 kinase pathway in Saccharomyces cerevisiae. BMC Biochemistry 11, (2010). [DOI] [PMC free article] [PubMed] [Google Scholar]
- 54.Hinnebusch AG Translational regulation of GCN4 and the general amino acid control of yeast. Annual Review of Microbiology 59, 407–450 (2005). [DOI] [PubMed] [Google Scholar]
- 55.Hinnebusch AG Gene-specific translational control of the yeast GCN4 gene by phosphorylation of eukaryotic initiation factor 2. Molecular Microbiology 10, 215–223 (1993). [DOI] [PubMed] [Google Scholar]
- 56.Govind CK, Yoon S, Qiu H, Govind S, & Hinnebusch AG Simultaneous recruitment of coactivators by GCN4p stimulates multiple steps of transcription in vivo. Molecular and Cellular Biology 25, 5626–5638 (2005). [DOI] [PMC free article] [PubMed] [Google Scholar]
- 57.Kanazawa S, Driscoll M, & Struhl K ATR1, A Saccharomyces cerevisiae gene encoding a transmembrane protein required for aminotriazole resistance. Molecular and Cellular Biology 8, 664–673 (1988). [DOI] [PMC free article] [PubMed] [Google Scholar]
- 58.Lee S, Lim WA & Thorn KS Improved blue, green, and red fluorescent protein tagging vectors for S. cerevisiae. PLoS ONE 8, (2013). [DOI] [PMC free article] [PubMed] [Google Scholar]
- 59.Bao Z et al. Homology-integrated CRISPR-Cas (HI-CRISPR) system for one-step multigene disruption in Saccharomyces cerevisiae. ACS Synthetic Biology 4, 585–594 (2015). [DOI] [PubMed] [Google Scholar]
- 60.Bao Z et al. Genome-scale engineering of Saccharomyces cerevisiae with single-nucleotide precision. Nature Biotechnology 36, 505–508 (2018). [DOI] [PubMed] [Google Scholar]
- 61.Lane S et al. Xylose assimilation enhances the production of isobutanol in engineered Saccharomyces cerevisiae. Biotechnology and Bioengineering 117, 372–381 (2020). [DOI] [PubMed] [Google Scholar]
- 62.Gibson DG et al. Enzymatic assembly of DNA molecules up to several hundred kilobases. Nature Methods 6, 343–345 (2009). [DOI] [PubMed] [Google Scholar]
- 63.Shao Z, Zhao H, & Zhao H DNA assembler, an in vivo genetic method for rapid construction of biochemical pathways. Nucleic Acids Research 37, (2009). [DOI] [PMC free article] [PubMed] [Google Scholar]
Associated Data
This section collects any data citations, data availability statements, or supplementary materials included in this article.
Supplementary Materials
Data Availability Statement
The data that support the conclusions of this study are available from the corresponding author upon request. The source code and the mathematical details of the model are available at GitHub (https://github.com/Lulabcodes/YGO).