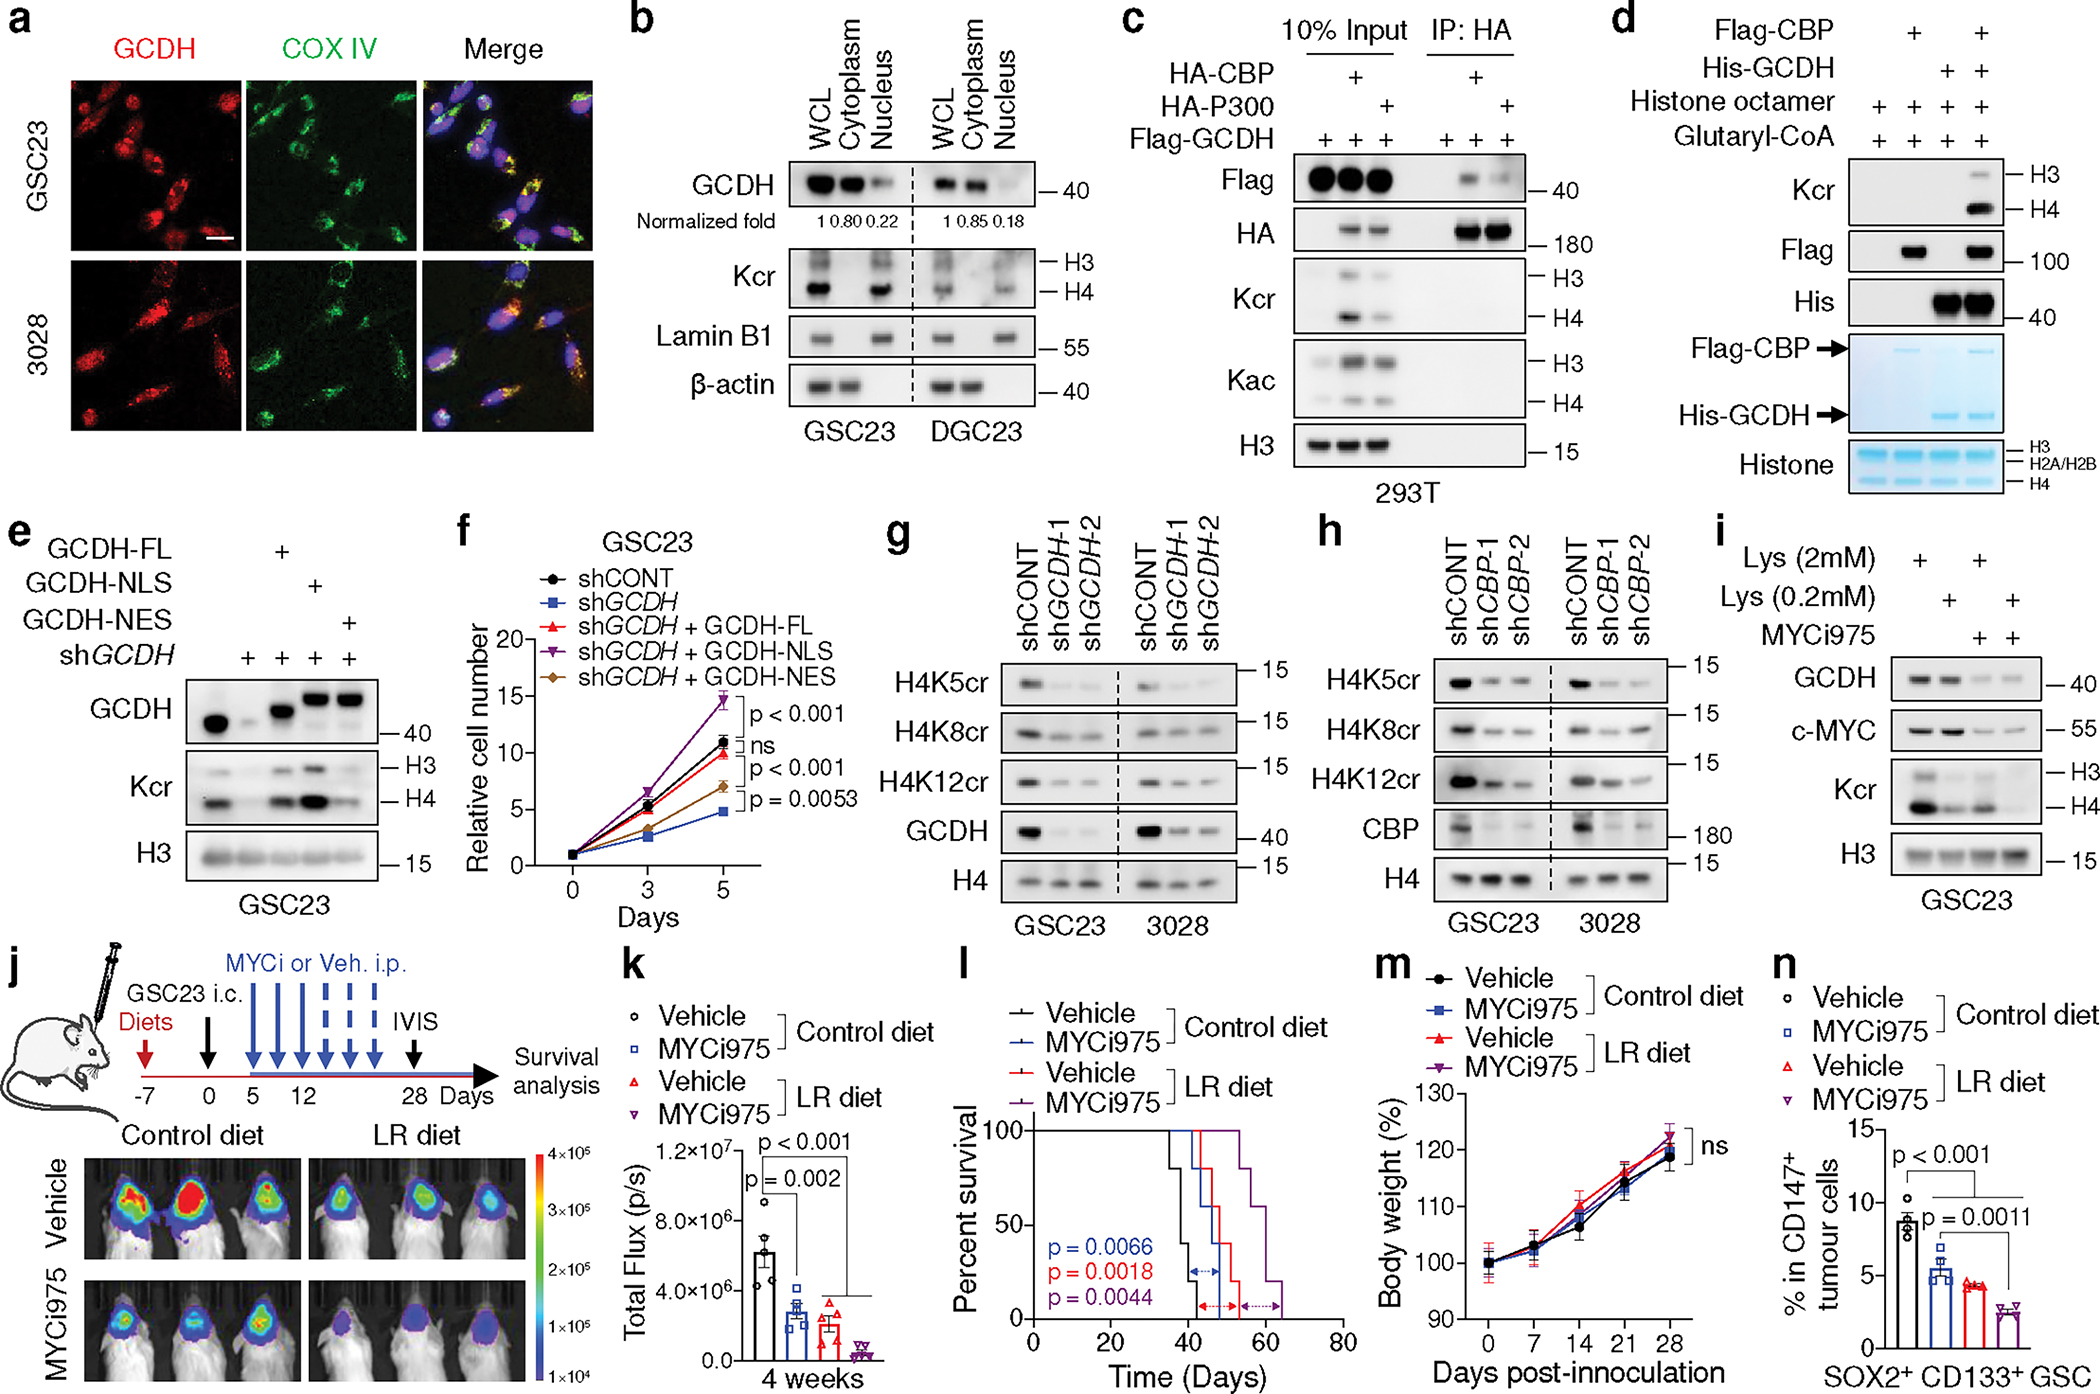
Fig. 4. GCDH interacts with CBP in nucleus to modulate Kcr and confer MYC-dependence.

a, IF staining of GCDH in GSCs. Scale bar, 20 μm.
b, Nuclear localization of GCDH in GSCs and DGCs. Band intensity of GCDH was measured and normalized to β-actin or Lamin B1 based on the intensity of each lane after background subtraction, and the ratios are shown. WCL, whole cell lysate.
c, IB analysis of WCLs and IP of 293T cells transfected with indicated plasmids.
d, IB analysis of Kcr by in vitro crotonylation assay.
e, f, IB (e) and cell proliferation (f) of control and 3’UTR-targeted shGCDH GSC23 with or without ectopic expression of WT, NLS-tagged and NES-tagged GCDH.
g, h, IB analysis of GSCs with or without GCDH (g) or CBP (h) KD.
i, IB analysis of GSCs cultured in media with indicated concentrations of L-lysine and treated with or without 0.2 μM MYCi975 for 5 days.
j-n, In vivo bioluminescence imaging at 4 weeks post-transplantation (j), quantification of total flux (n = 5 biologically independent mice, k), Kaplan-Meier survival curves (n = 5, l), weekly mice weight (n = 5 biologically independent mice, m) and percentages of SOX2+ CD133+ GSCs (n = 4 biologically independent mice, n) from immunodeficient mice bearing GSC23-derived intracranial tumours with MYCi975, LR diet or the combination treatment.
Representative of two independent experiments for a-e and g-i. Data are presented from three independent experiments in f. In f, k, m and n, data are presented as mean ± SEM. Two-way ANOVA followed by multiple comparisons with adjusted p values for f and m, one-way ANOVA followed by multiple comparisons with adjusted p values for k and n, log-rank test for l. ns, not significant.
