Abstract
SPECT systems distinguish radionuclides by using multiple energy windows. For CZT detectors, the energy spectrum has a low energy tail leading to additional crosstalk between the radionuclides. Previous work developed models to correct the scatter and crosstalk for CZT-based dedicated cardiac systems with similar 99mTc/123I tracer distributions. These models estimate the primary and scatter components by solving a set of equations employing the MLEM approach. A penalty term is applied to ensure convergence. The present work estimates the penalty term for any 99mTc/123I activity level. An iterative approach incorporating Monte Carlo into the iterative image reconstruction loops was developed to estimate the penalty terms. We used SIMIND and XCAT phantoms in this study. Distribution of tracers in the myocardial tissue and blood pool were varied to simulate a dynamic acquisition. Evaluations of the estimated and the real penalty terms were performed using simulations and large animal data. The myocardium to blood pool ratio was calculated using ROIs in the myocardial tissue and the blood pool for quantitative analysis. All corrected images yielded a good agreement with the gold standard images. In conclusion, we developed a CZT crosstalk correction method for quantitative imaging of 99mTc/123I activity levels by dynamically estimating the penalty terms.
Index Terms—: Dual-radionuclide, CZT detectors, penalty term estimation, iterative deconvolution model, self-scatter, down-scatter, tailing effect corrections
I. INTRODUCTION
ONe of the strengths of Single Photon Emission Computed Tomography (SPECT) is the possibility of performing simultaneous imaging of multiple tracers labeled with different radionuclides. This feature is possible because the radionuclides can be distinguished by setting up multiple energy windows that separate photons of different principal energies [1]. Dual-radionuclide SPECT studies have many promising applications, such as evaluating myocardial viability and perfusion [2–6].
The SPECT images showing cardiovascular diseases are commonly acquired using 99mTc-labeled agents, such as 99mTc-sestamibi or 99mTc-tetrofosmin, as well as 201Tl [7]. These images support identifying infarction size and location, besides assessing the viability of the myocardium [2]. The use of myocardial innervation imaging with 123I-mIBG has been increasing, especially for studying patients after myocardial infarction or with congestive heart failure [7–11]. In these diseases, the sympathetic nerves controlling myocardial function can be damaged, reducing cardiac innervation density, referred to as denervation [2]. A denervated region can lead to arrhythmia and ventricular fibrillation, and potentially sudden cardiac death [2]. Therefore, it is crucial to find mismatched regions between the infarcted myocardium and denervated region to provide appropriate medical or surgical intervention [12–14], ideally with simultaneous dual SPECT radionuclide imaging of 99mTc and 123I tracers.
When performing dual-radionuclide SPECT imaging, simultaneous acquisition has several advantages over sequential acquisition for conventional scintillation detectors, such as (i) perfect co-registration between the images of both radionuclides [1]; (ii) reduction of patient discomfort, which in turn reduces the likelihood of artifacts due to patient movement [1, 15, 16]; and (iii) simultaneous acquisition allows data for both radionuclides to be acquired under identical physiological conditions [1]. The disadvantage of this approach is the substantial cross-contamination in the energy spectral domain, or crosstalk, between the datasets of each radionuclide. The primary source of crosstalk is the down-scatter of the higher-energy radionuclide to the lower-energy radionuclide [1]. Several correction approaches addressing this contamination have been proposed. For conventional NaI-based SPECT cameras. Moore et al. [17], Hademenos et al.[18], and Yang et al. [19] developed similar techniques for simultaneous 201Tl and 99mTc that make use of a third energy window to estimate the 99mTc down-scatter to be subtracted from the 201TI energy window. However, this approach has a limitation on estimating the crosstalk fraction accurately. In addition, this approach would be impractical for dual-radionuclide images using 99mTc and 123I since the radionuclides’ main photopeaks are too close to each other. Knesaurek et al. [20] proposed a technique based on the spatial deconvolution technique using the 99mTc point spread function (PSF). This technique records the PSF at different depths in water and adds regularization procedures. Hannequin et al. [21] developed a spectral deconvolution technique denoted as photon energy recovery. It collects data from multiple sub-windows within the main energy windows. The method involves fitting a model with Gaussian energy response of the system to the measured data. Others model-based correction methods, such as effective source scatter estimation (ESSE) [22] and convolution forced detection (CFD) based on fast Monte Carlo simulation [23, 24], are also often used and have been proven to be accurate.
For the pixelated cadmium zinc telluride (CZT) systems, crosstalk corrections are more complex when using simultaneous dual-radionuclide imaging due to the incomplete charge collection and intercrystal scattering [25]. The energy deposited by the gamma-ray in a CZT detector is directly converted into electron-hole pairs between the anode and the cathode. Thereby, some charge cloud sharing between CZT detector pixels may appear, leading to a final collected charge smaller than the generated charge. Consequently, a low energy tail is present in CZT energy spectrum even without in-object scatter. Fig. 1 shows a Monte Carlo simulation of a 99mTc point source energy spectrum in the air detected by CZT and NaI(Tl) detectors, in which the tailing effect is observed for CZT detectors, leading to additional crosstalk. Consequently, conventional window-based methods such as dual-energy window (DEW) or triple-energy window (TEW) corrections tend to overestimate scatter and crosstalk projections [26].
Fig. 1.
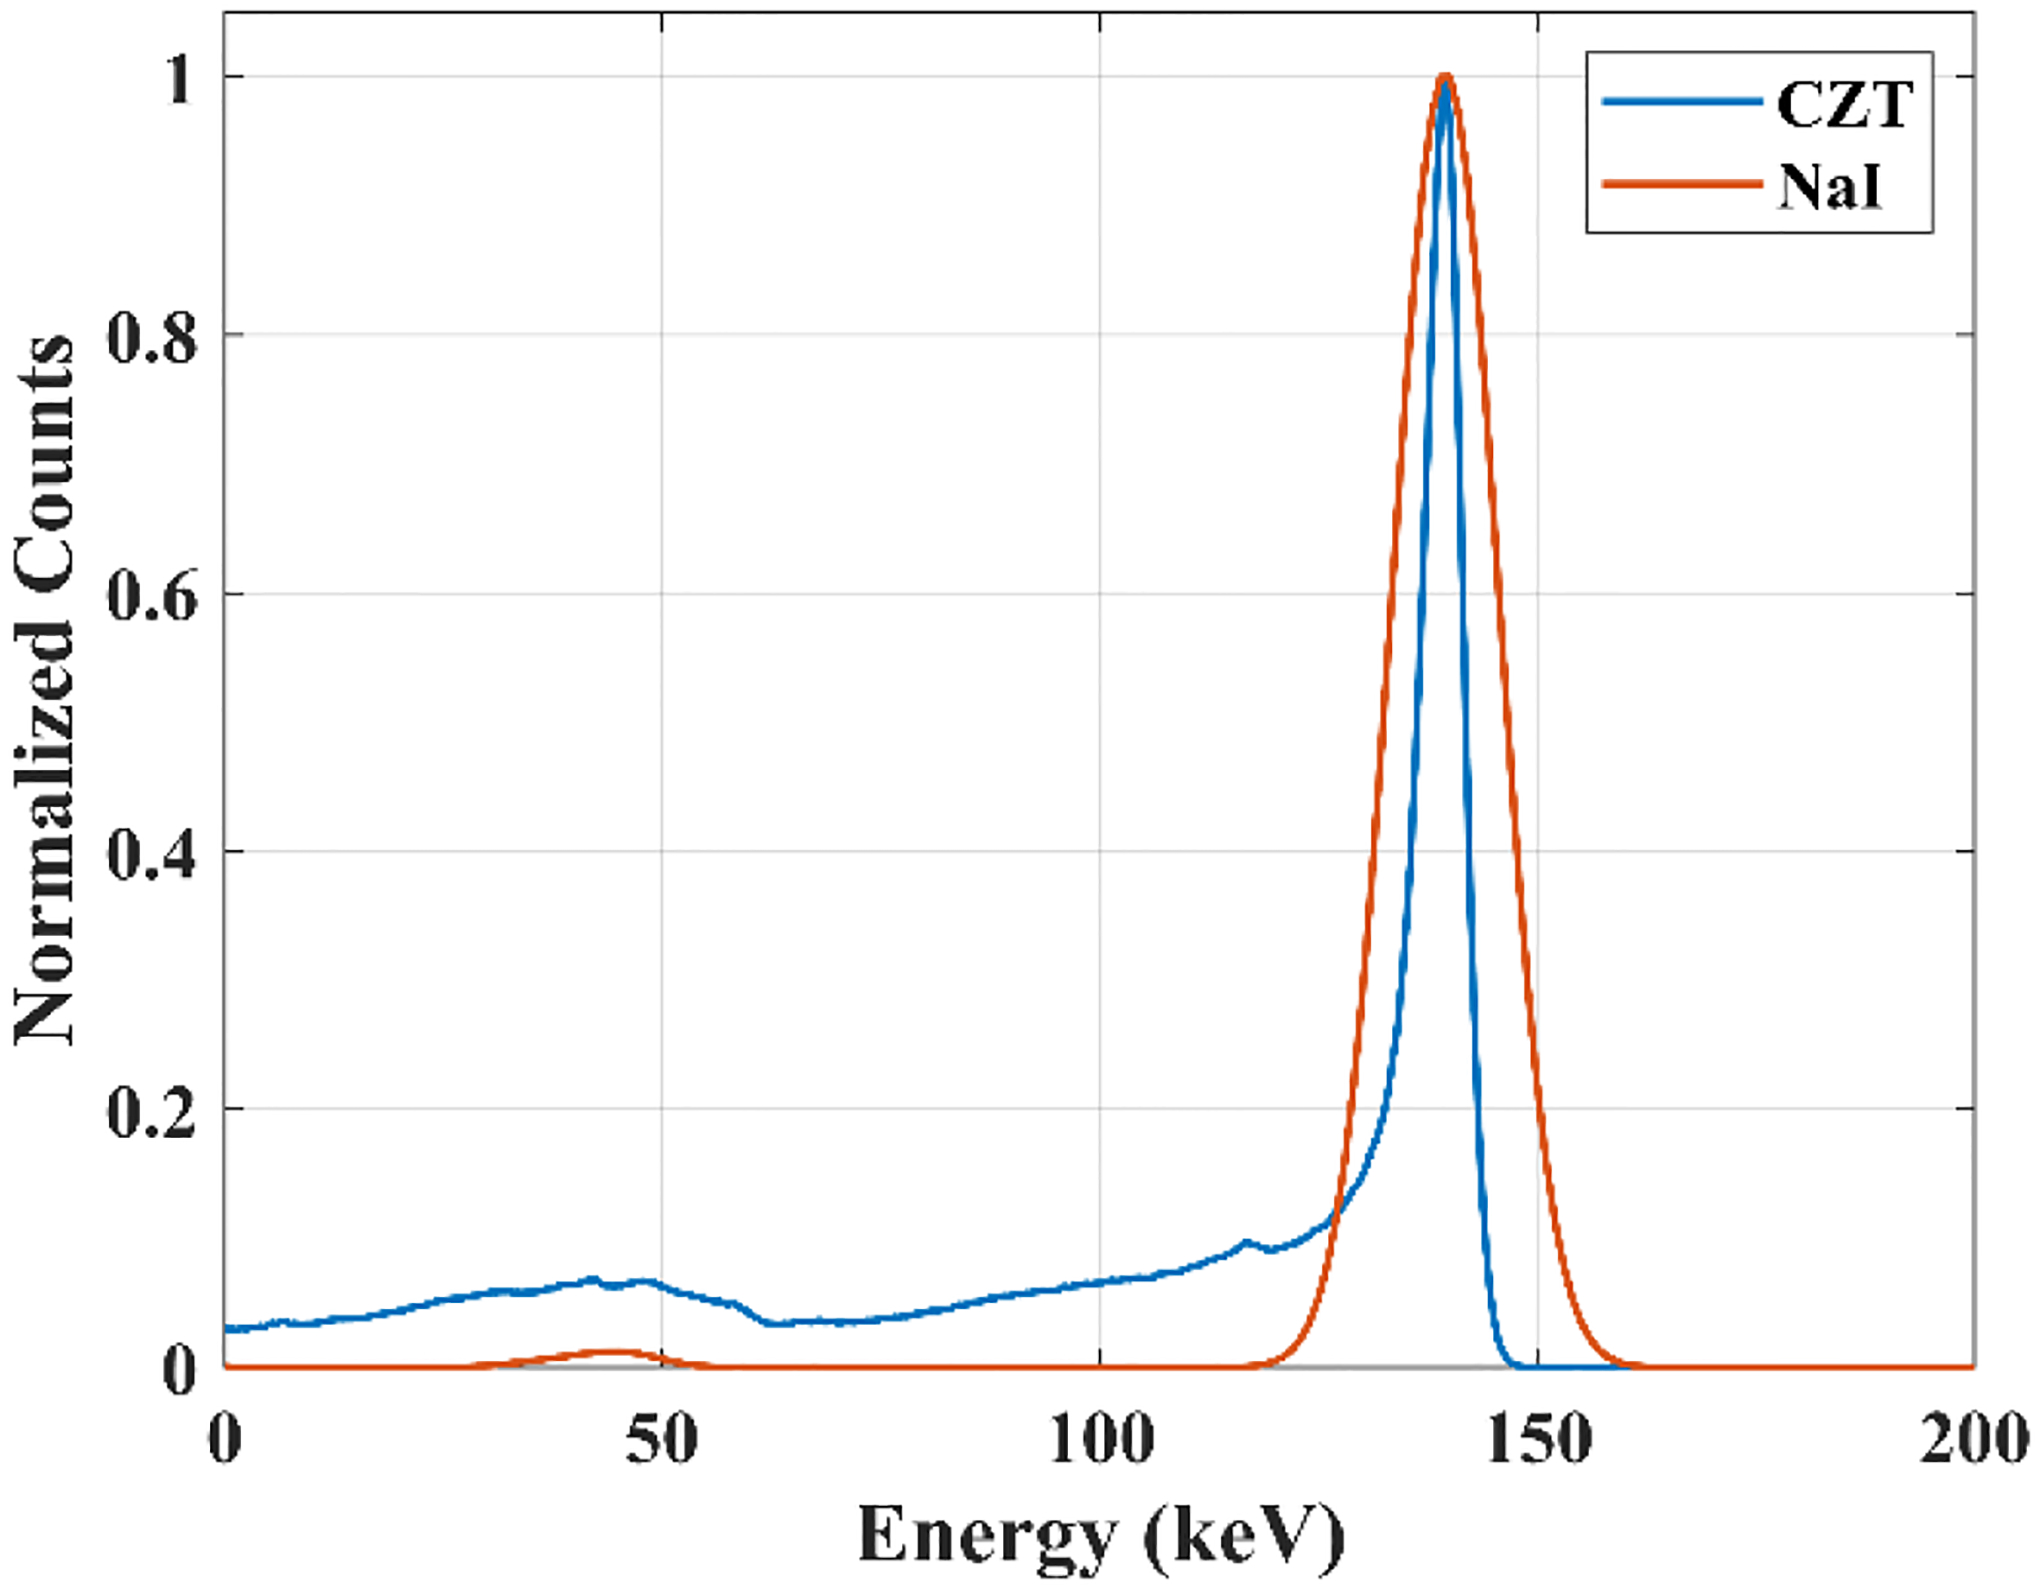
Energy spectra acquisitions in a CZT and NaI detectors of a 99mTc point source in air simulated by SIMIND Monte Carlo simulation.
Several previous studies have attempted to address the tailing effect by using models for charge sharing correction. Vealle et al. [27], Zannoni et al. [28], and Buttacavolli et al. [29] have applied charge sharing discrimination model and the charge sharing addition model. The charge sharing discrimination model removes shared events but has the limitation of reducing the collection efficiency of the detector. On the other hand, the charge sharing addition model recovers shared events, producing a uniform intensity across the detector.
For dedicated cardiac CZT SPECT systems, such as the GE Discovery 530c/570c, the cardiac camera has a small field of view (FOV) with a diameter of about 19 cm, and activities outside the FOV cannot be accurately reconstructed. That makes traditional model-based correction methods, such as ESSE, harder to be implemented. Therefore, for these dedicated cardiac CZT SPECT systems, Holstensson et al. [30] and Fan et al. [31] developed iterative deconvolution models for simultaneous 99mTc and 123I acquisitions in order to characterize the counts of primary, self-scatter (the scatter from the photopeak in its own energy window), down-scatter, and tailing effect. These models employ data from four energy windows to iteratively solve the unknown parameters using the Maximum Likelihood Expectation-Maximization (MLEM) method in the projection domain [30, 31]. The approach in Holstensson et al. [30] was developed for a parallel-hole collimator scanner (D-SPECT), while the approach in Fan et al. [31] was developed for a pinhole collimator system (GE Discovery NM530c/570c). Because the 99mTc (140 keV) and 123I (159 keV) photopeak energies are close to each other, the scatter window of 123I largely overlaps with the 99mTc photopeak window. To address this issue, the approaches in Holstensson et al. [30] and Fan et al. [31] require a constraint, denominated in this work as penalty term, to ensure convergence of MLEM estimation. This constraint (penalty term) characterizes the relationship between 99mTc and 123I activities in the heart. In these studies, Holstensson et al. [30] and Fan et al. [31] implemented a fixed penalty term for similar cardiac activity distributions between the two radionuclides (e.g., both tracers have high myocardium uptake and low blood pool uptake). However, in many cases, the activity levels of the two radionuclides in the heart are unknown and can be different due to: (i) the different spatial distributions of the two radionuclides (e.g., one tracer has high myocardium uptake and low blood pool uptake, but the other tracer has low myocardium uptake and high blood pool uptake), or (ii) in the case when one or both tracers undergo fast tracer kinetic change in dynamic imaging. In these circumstances, the published framework could not be applied directly as the penalty term changes depending on patient size, tracer kinetic change, and the activity distribution of both radionuclides. Thus, we propose to develop a framework comprising the iterative deconvolution model, previously established by Fan et al. [31], for the dedicated GE NM Discovery 530c/570c SPECT by leveraging Monte Carlo simulation to estimate the penalty term for any combinations of 99mTc and 123I activity distributions. We expect that this framework would work for a wide range of 99mTc/123I dual- radionuclide studies, such as 99mTc-PYP/123I-mIBG, or dynamic images using 99mTc-tetrofosmin, 99mTc-Sestamibi, 123I-mIBG, 123I-BMIPP.
II. Methods
A. Model Description
The model estimates the self-scatter, down-scatter, and tailing components of dual-radionuclide (99mTc/123I) acquisition by iteratively solving a set of equations employing multiple energy windows. The details of the model and energy window settings have been described in studies [30, 31], so we provide only a brief overview in this section.
The photons escaped from an object are either scattered or unscattered. The down-scatter component consists of events from photons scattered of large angular deflections (i.e., large loss of energy) inside the object detected in a lower energy window. The self-scatter component is from photons of small angular deflections (i.e., small energy loss) inside the object but detected in the photopeak window due to the limited energy resolution. Finally, the tailing component is from scattered and unscattered photons detected in a lower energy window due to the CZT solid-state detector (SSD) effect [31]. The primary, self-scatter, down-scatter, and tailing components for simultaneous 99mTc and 123I acquisition, along with the four energy windows used in the deconvolution model, are illustrated in Fig. 2. The energy window W1 comprises the down-scatter and tailing from 99mTc and 123I. Energy window W2 comprises the 99mTc primary and self-scatter, along with the 123I tailing and down-scatter. Energy window W3 includes the 123I primary and self-scatter photons, and energy window W4 includes the high energy contamination from 123I. The deconvolution model was established from these descriptions, comprising a tailing model and a scatter model.
Fig. 2.
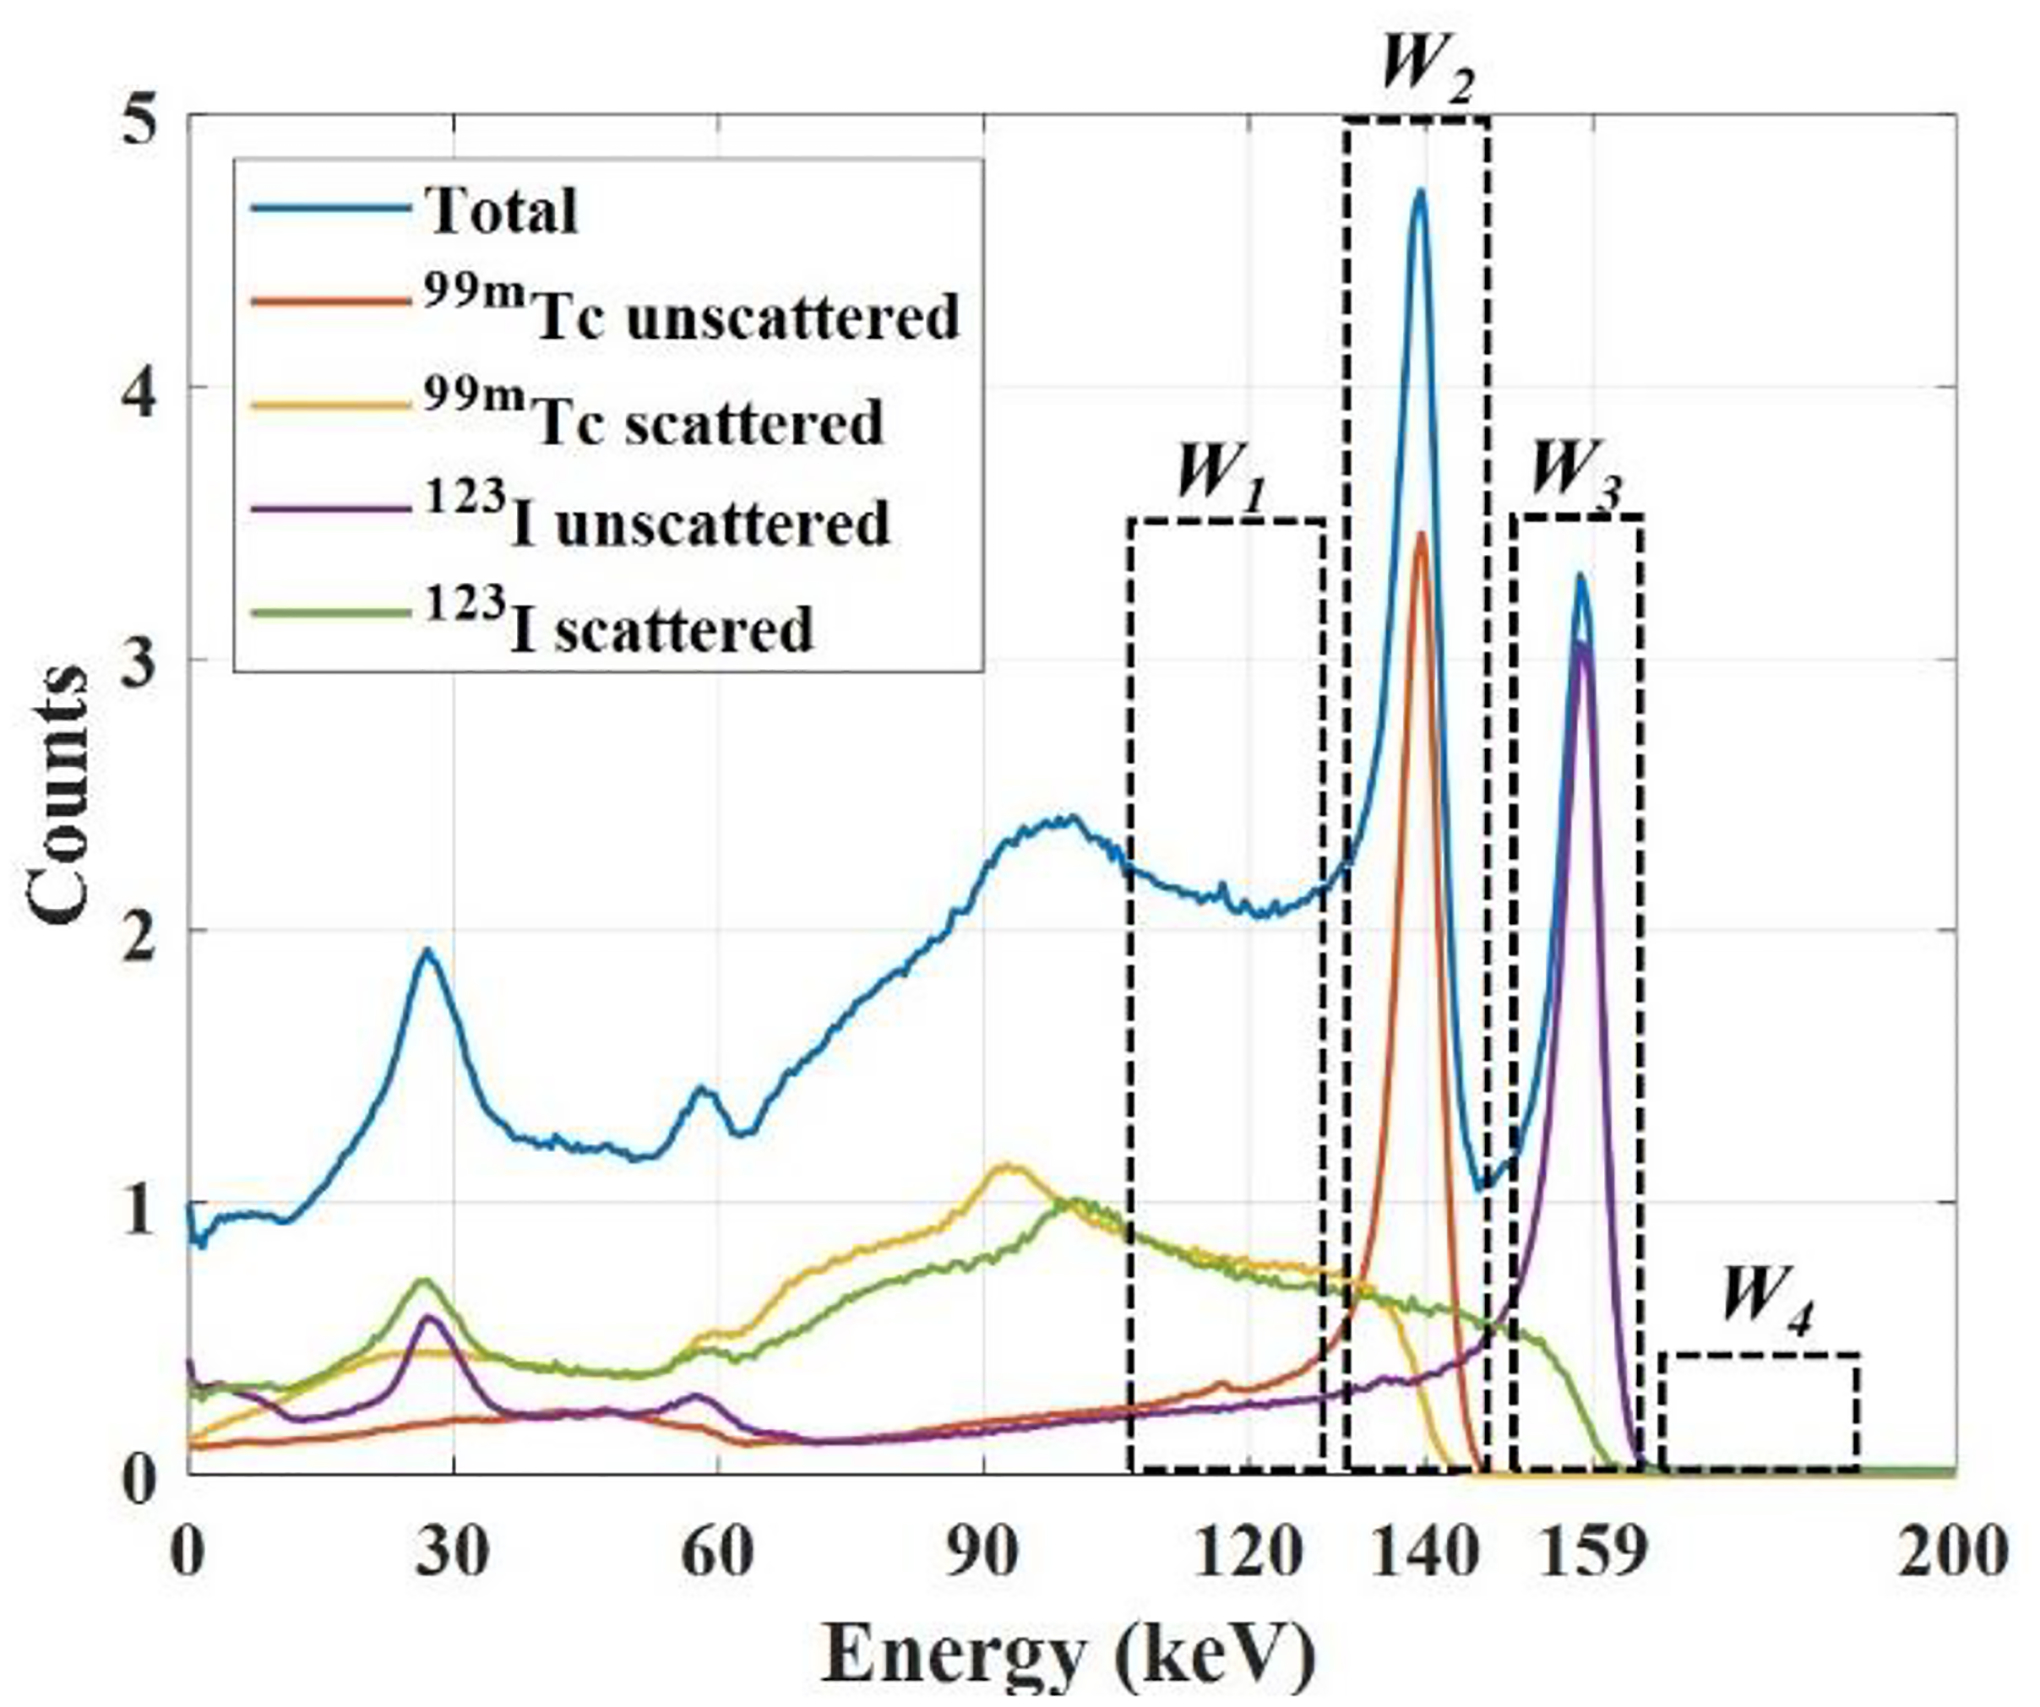
Illustration of energy windows used on the projection count model.
The tailing model describes the relationship between the tailing projection (Oij) and the corresponding primary projection (Pi) based on the SSD and collimator scatter effects that cause the low energy tail counts [31]. The SSD effect comprises the charge cloud sharing and the depth of interaction effects (electron and hole trapping) [31, 32], while the collimator scatter effect results from the gamma-ray interaction within the collimator [31]. For pinhole collimators, in addition to the effects mentioned above, the different photon incident angles should also be considered in the tailing model as the incident angle and subsequent penetration are different for each pixelated CZT detector. Therefore, Fan et al. [31] established an exponential obliquity kernel (M) to model the incident angle-dependent depth of interaction, which is a function of the detector attenuation coefficient (μij), the photon incident angle (θ), and the azimuthal angle (φ). Also, in the same study, Fan et. al. [31] established a Gaussian kernel to model the charge cloud sharing (Kij), and another Gaussian kernel to model the collimator scatter effect (Gij). Here, j is the energy window comprising photons that are originated from the photopeak energy window i (i = 2 for 99mTc and i = 3 for 123I). The established tailing model is shown in (1) and more details can be found in [31].
| (1) |
where Pi_pass denotes the contributions to the primary projection of unscattered gamma photons that directly pass the pinhole and Pi_pen represents those that penetrate the collimator. δ denotes the photons that did not undergo any collimator scatter process. M is an exponential obliquity kernel [31, 33] to model the depth of interaction effect. Kij is a Gaussian kernel to model the charge cloud sharing effect. Gij is a different Gaussian kernel to model the collimator scatter effect, and wij and βij are weighting factors [31].
The scatter model describes a relationship between the down-scatter and self-scatter projections. It is a combination of the δ function with a monoexponential kernel [1, 34], as shown in (2) [28].
| (2) |
where Sij is the down-scatter projection in window j from photopeak window i. Si is the self-scatter projection in photopeak window i. Cij, αij, and λij are scatter model parameters for the window pair i to j, and r is the distance in a radial direction. In this work, we fixed all parameter values based on the work presented by Fan et al. [31].
The overall approach implementation combines the models described above to iteratively solve the self-scatter, down-scatter, and tailing components using the MLEM. In order to ensure convergence, the penalty term is incorporated, similar to the approach proposed by Holstensson et al. [30]. The penalty term is extracted from the ratio of the results of the ratio between counts of the 99mTc and 123I primary and the self-scatter projections. In this work, the ratio between the primary and self-scatter was denoted as the primary-to-scatter ratio (PTS) [23]. Holstensson et al. [30] studied the PTS for four different sizes of breast tissue to simulate different patient sizes. This study showed that the PTS is highly dependent on the patient size, yet the penalty term is largely consistent. However, the study was only performed with similar activity distributions of the dual-radionuclides. In clinical cases, the dual-radionuclide spatial distributions occur differently, such as in a dynamic manner. Therefore, the penalty terms can be distinct, affecting the convergence of the components’ estimation previously mentioned. Therefore, an approach is needed to estimate the PTS and, afterward, the penalty term regardless of the dual-radionuclide activity distribution combinations.
In Section C below, we have developed an iterative loop incorporating Monte Carlo simulation with the iterative deconvolution model [31] to iteratively estimate the penalty terms for any 99mTc/123I dual-radionuclide distributions.
B. Data Generation
All data for this component of study were Monte Carlo-simulated using SIMIND [35, 36] and 4D Extended Cardiac-Torso (XCAT) phantom [30, 31].
The tailing effects of the CZT detector were already incorporated in the SIMIND simulation package [35]. This package includes precise information about the GE NM Discovery 530c/570c system, which is a CZT-based dedicated cardiac imaging system with 19 detectors with pinhole collimators arranged in an arc. Each pinhole is coupled with 4 CZT modules (2×2), each has a size of 39.06 × 39.06 mm2, with a pixel pitch of 2.46 × 2.46 mm2. All pinhole collimators are focused on the heart region for maximum sensitivity [36].
While we expect that the proposed approach can estimate the penalty terms for any dual-radionuclide spatial distribution combinations, four sample simulations were carried out with various spatial distributions of the dual-radionuclide in the myocardial tissue distribution and blood pool of the XCAT phantom. The activity and attenuation maps have matrices of 128 × 128 × 128 with a voxel size of 4.0 × 4.0 × 4.0 mm3. Simulations of the XCAT phantom for each radionuclide were performed separately and posteriorly combined to simulate a simultaneous acquisition while still maintaining the gold standard single radionuclide results. All simulations were performed using a maximum scatter order of 7 to ensure accuracy and histories of photons per projection of 3.0×10⁶.
For the first simulation, the 99mTc XCAT phantom was generated with the blood pool activity distribution higher than that of the myocardial tissue with a factor of 10:1, as shown in Fig. 3a. While for the 123I XCAT phantom, the myocardium had an activity distribution higher than that of the blood pool with a factor of 5:1, as shown in Fig. 3c. The simulation mimics the scenario of first injecting 123I radionuclide (e.g., 123I-mIBG). Then, after the 123I tracer is well distributed and stabilized in the myocardium, 99mTc radionuclide (e.g., 99mTc-sestamibi or tetrofosmin) is injected for dynamic imaging. In early frames, 99mTc activity in the blood pool is high, while the 99mTc activity in myocardial tissue is low.
Fig. 3.
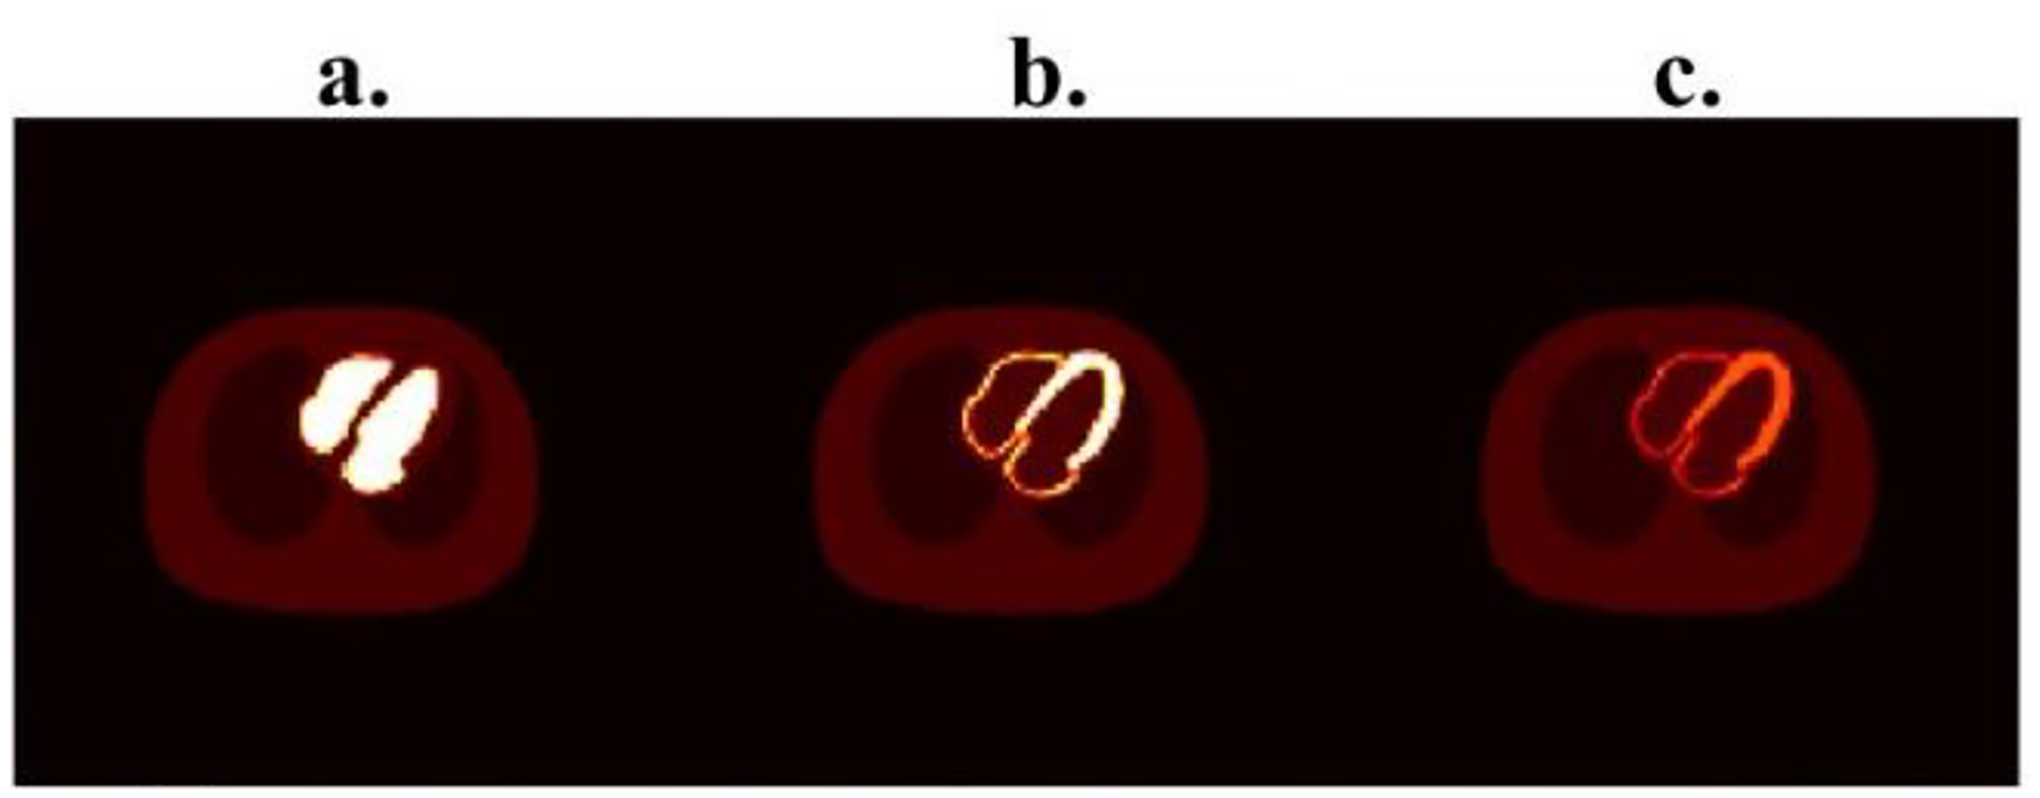
XCAT phantom used in SIMIND for the simulations. (a) high blood pool activity and low myocardial activity with a factor of 10:1; (b) high myocardial activity and low blood pool activity with a factor of 10:1; (c) high myocardial activity and low blood pool activity with a factor of 5:1.
In the second simulation, the 99mTc XCAT phantom was generated with the myocardial activity distribution higher than that of the blood pool with a factor of 10:1, as shown in Fig. 3b. While for the 123I XCAT phantom, the myocardial activity distribution was higher than the blood pool with a factor of 5:1, as shown in Fig. 3c. The simulation mimics the scenario of both 99mTc and 123I radionuclides reaching equilibrium.
In the third simulation, the myocardium of the 99mTc XCAT phantom had higher activity than that of the blood pool with a factor of 5:1, as shown in Figure 3c; while the blood pool of the 123I XCAT phantom had higher activity than that of the myocardium with a factor of 10:1, as shown in Figure 3a. The simulation could mimic the scenario of injecting 99mTc radionuclide first. Then, after the 99mTc tracer is well distributed and stabilized in the myocardium, 123I radionuclide is injected for dynamic imaging. In early frames, 123I activity in the blood pool is high, while the 123I activity in myocardium is low.
In the fourth simulation, the myocardium of the 99mTc XCAT phantom had higher activity distribution than that of the blood pool with a factor of 5:1, as shown in Fig. 3c; while the myocardium of the 123I XCAT phantom had higher activity distribution than the blood pool in a factor of 10:1, as shown in Fig. 3b. This is similar to the second simulation scenario but with different ratios. Table I shows the dual-radionuclide spatial distributions used for each of the four simulations. The energy spectra of the four simulations in this work are shown in Fig. 4. Each 99mTc/123I activity distribution combination requires different penalty terms, suggesting the need to develop a model to estimate the constraint regardless of the activity levels in order to ensure the proper convergence of the iterative deconvolution model.
TABLE I.
Dual-radionuclide distributions at the XCAT phantom myocardial tissue and the blood pool for the four simulations proposed.
| Simulation | 99mTc activity map | 123I activity map |
|---|---|---|
| 1 | High blood pool (10) / Low myocardium (1) | Low blood pool (1) / High myocardium (5) |
| 2 | Low blood pool (1) / High myocardium (10) | Low blood pool (1) / High myocardium (5) |
| 3 | Low blood pool (1) / High myocardium (5) | High blood pool (10) / Low myocardium (1) |
| 4 | Low blood pool (1) / High myocardium (5) | Low blood pool (1) / High myocardium (10) |
Fig. 4.
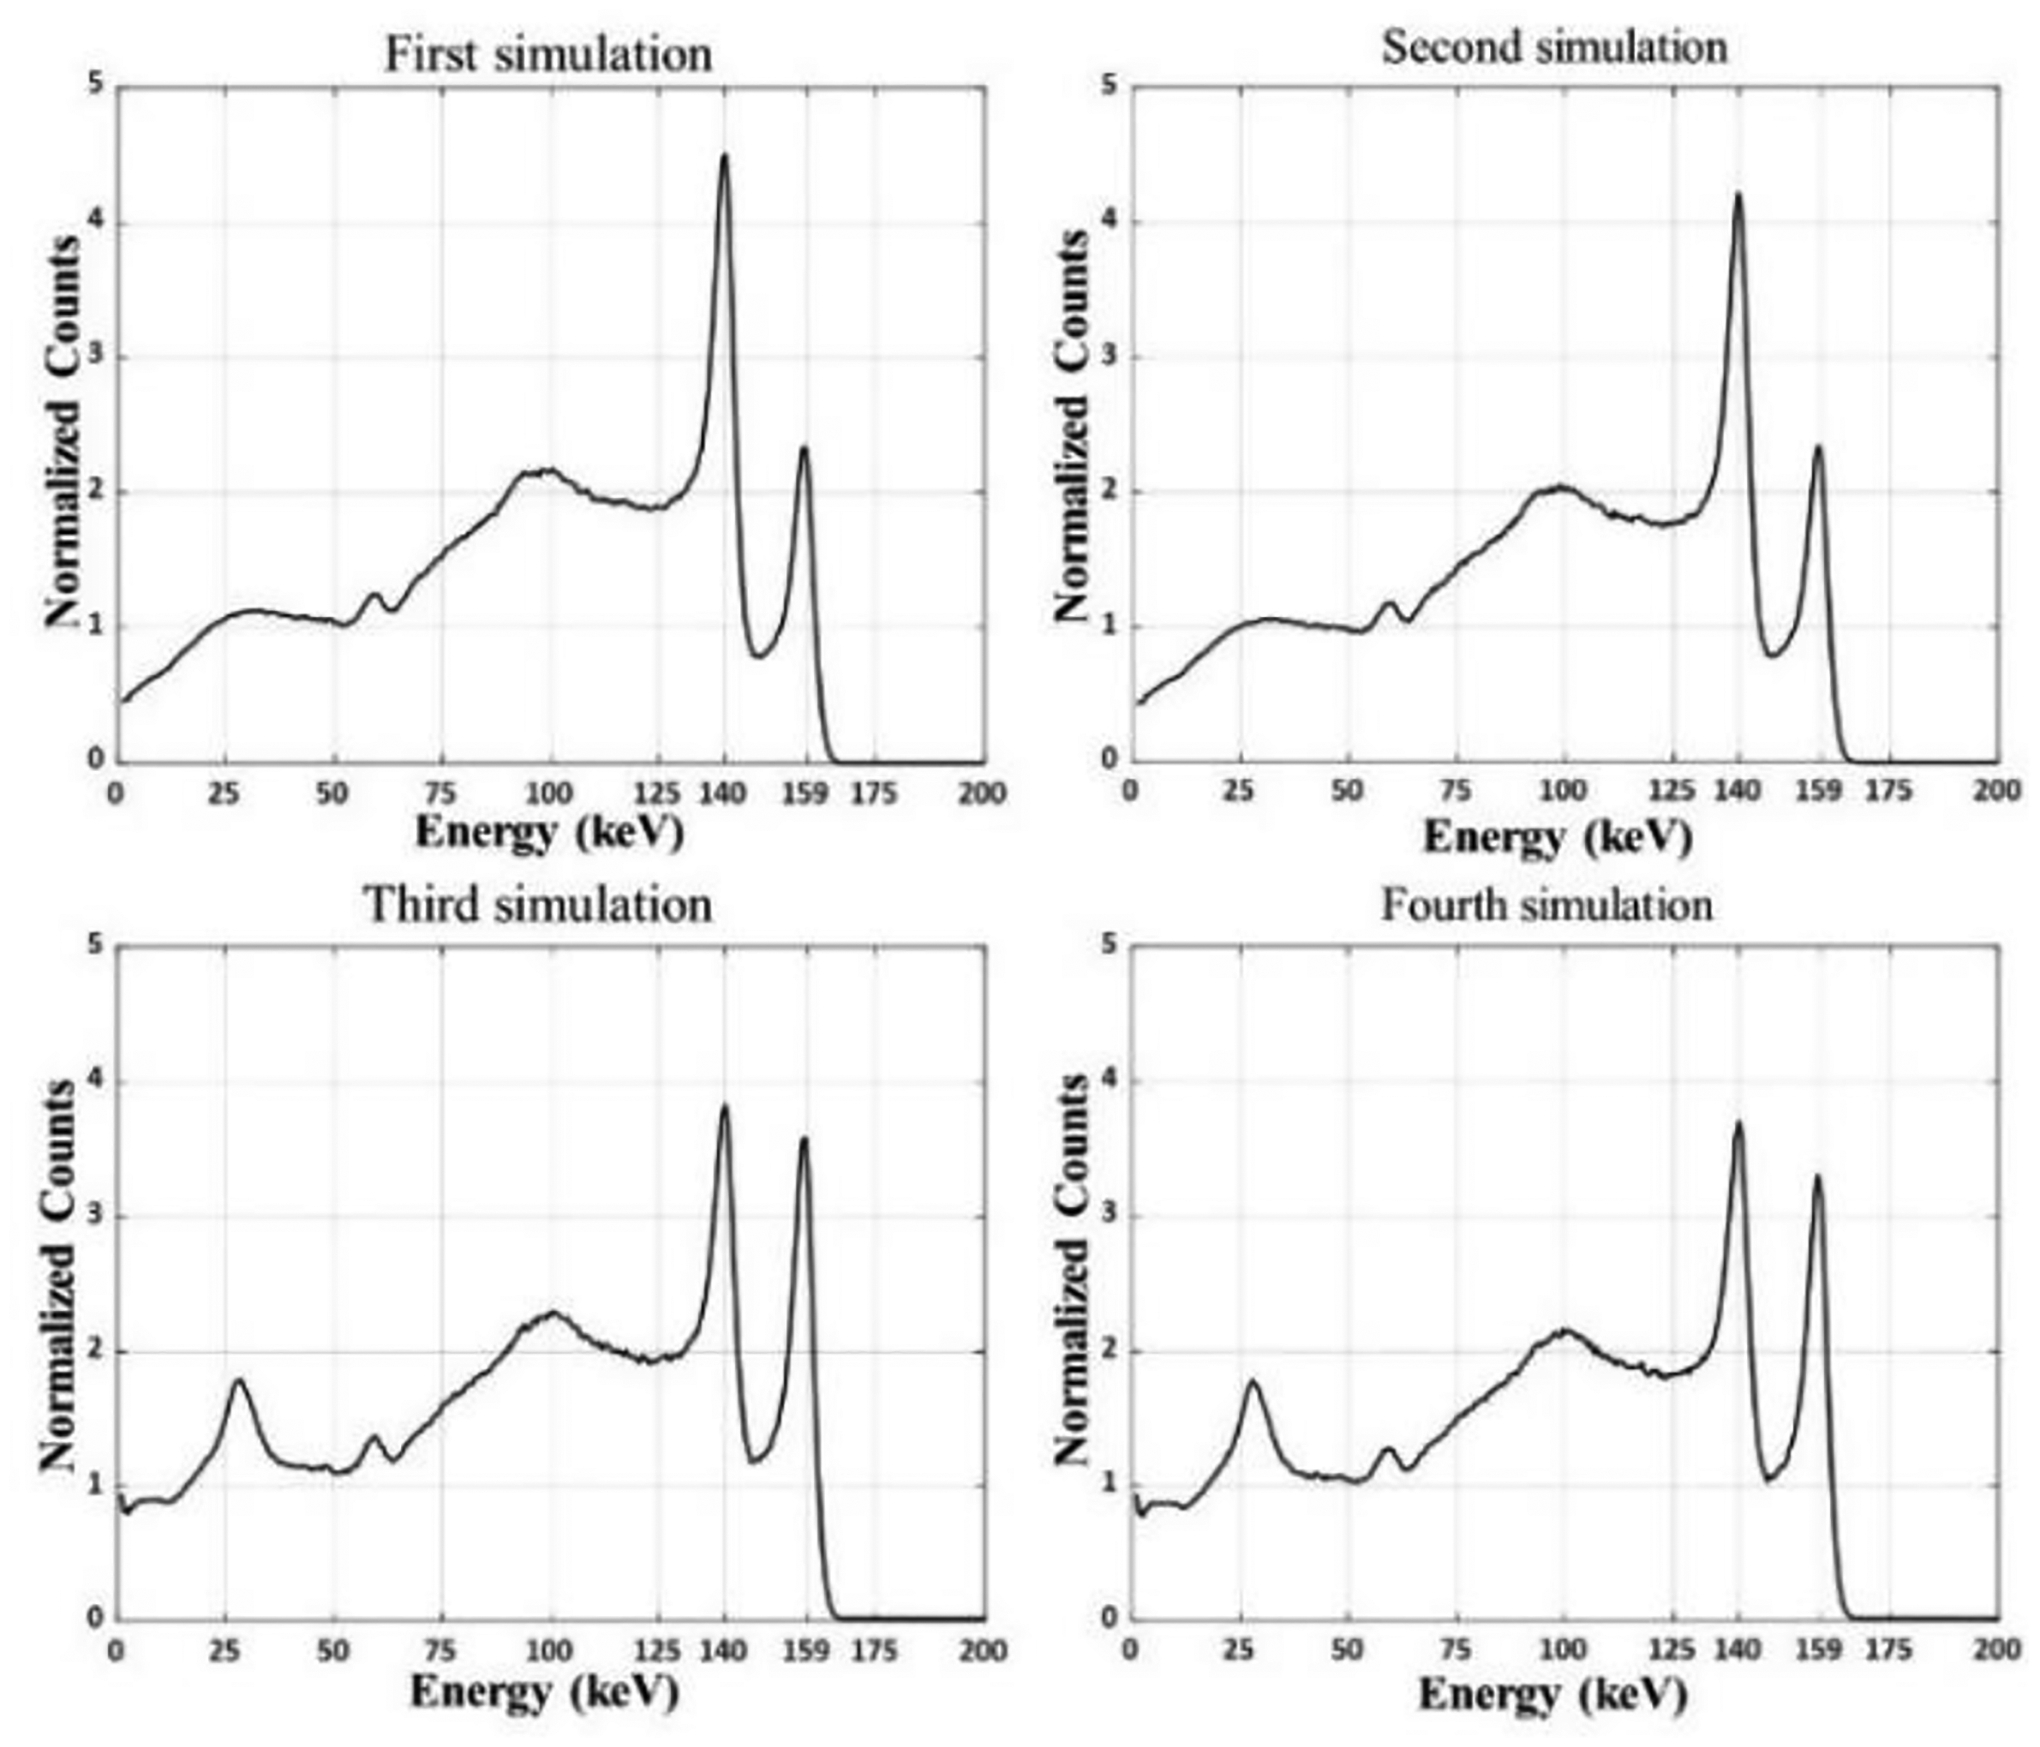
Dual-radionuclide spectra of the four simulations. Top spectra were simulated with XCAT phantom with higher 99mTc than 123I activities. Bottom spectra were simulated with higher 123I than 99mTc activities.
C. Correction Approach
Our proposal is to estimate the penalty terms iteratively comprising the previous model developed by Fan et al. [31] with Monte Carlo simulation using SIMIND. For all simulations performed in this work, projections from energy windows W2 (99mTc) and W3 (123I) were reconstructed using the MLEM with attenuation correction. At each iteration, the reconstructed images of each radionuclide provide a rough estimation of the tracer distribution. After the first iteration, new 99mTc and 123I activity maps are generated and used as source maps in SIMIND to simulate new projections. Posteriorly, the primary and self-scatter projections ratio is performed for each tracer’s photopeak energy window simulated to obtain the PTSs. Later, the penalty term is obtained by applying the ratio of the PTSs, and it is incorporated into the iterative model to estimate the tailing, down-scatter, and self-scatter projections, which were combined as an additive term in the forward projection in the MLEM approach for correction.At each iteration, the reconstructed images of each radionuclide provide a rough estimation of the tracer distribution. These images are used as new 99mTc and 123I activity maps and are included as source maps in SIMIND to simulate new projections. Posteriorly, the primary and self-scatter projections ratio is performed for each tracer’s photopeak energy window simulated to obtain the PTSs. Later, the penalty term is obtained by applying the ratio of the PTSs, and it is incorporated into the iterative model to estimate the tailing, down-scatter, and self-scatter projections, which were combined as an additive term in the forward projection in the MLEM approach for correction. This process was repeated within every iteration of the MLEM image reconstruction, as illustrated in Fig. 5.
Fig. 5:
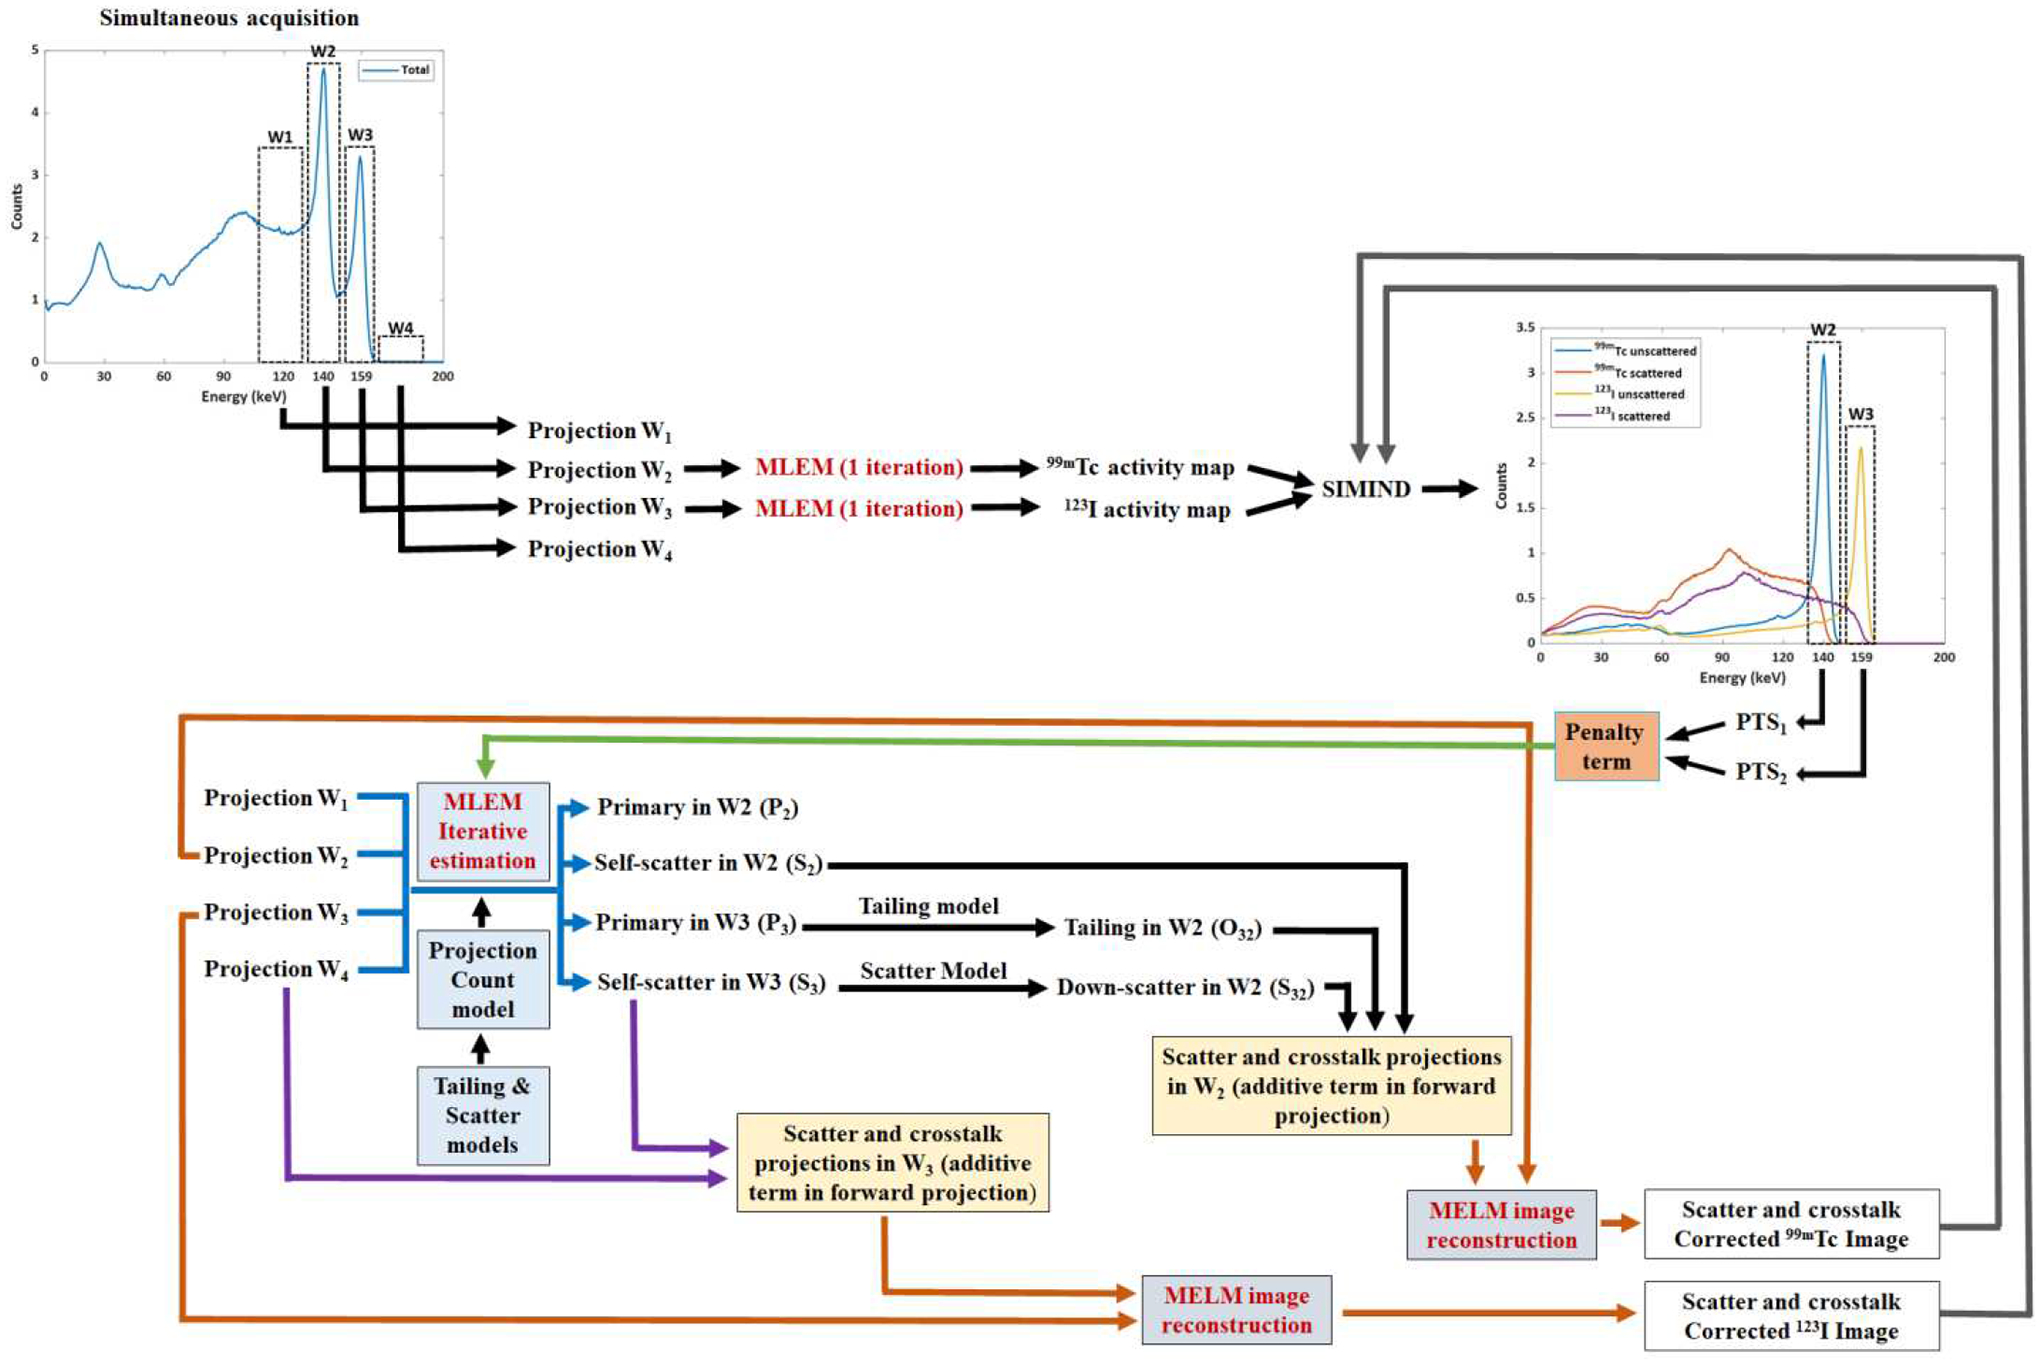
Framework of the proposed approach incorporating Monte Carlo simulation into MLEM reconstruction loops and dynamically determining the penalty terms.
Since the penalty terms are obtained from the PTS of each energy window, the simulated histories of photons per projection influence its estimation due to noise levels in the simulated projections. To investigate such influences, two different histories of photons per projection were simulated within each iterative loop: (i) factor of 1, which means that the simulation was carried out with a history of photons per projection of 1.0×10⁶; and (ii) factor of 5, which is five times the number of photons per projection of the previous simulation (5.0×10⁶). The projection would be less noisy for more simulated photons, but the whole process would be too time-consuming. Note that the model uses two simulations. The first simulation is to establish the dual-radionuclide acquisition using 99mTc and 123I, simulating a clinical acquisition. This first set of simulations was performed using the dual-radionuclide distribution shown in Table I to generate the data. The penalty term from these first simulations provides the gold standard used as reference values. The second set of simulations was performed within the iterative loop to estimate the penalty terms used in the deconvolution method explained in section A. The different histories of photons per projection are applied only for the second set of simulations to study the convergence of the penalty terms.
A study was conducted to investigate the impact of the number of iterations for generating activity maps to be included in the proposed model. The study compared 1 iteration versus 10 iterations using the history of photons per projection of a factor of 5. The aim was to determine the iteration number that yields the most accurate estimation of the penalty term, which would then be selected for the model.
The model was performed in Dell PowerEdge R720, which contains two Intel Xeon E5-2630 CPUs, 96GB memory, 2×1TB HDD, and 4×1gbps network. Simulations for 99mTc and 123I were executed in parallel.
D. Evaluation
The estimated penalty terms with different histories of photons per projection were analyzed in terms of average and standard deviation with the true penalty terms, which was named as the reference value in this work. The average and standard deviation for all simulations proposed were calculated after the convergency, from iteration 10 onwards. The reference penalty terms were determined by pre-computing the PTS values through Monte Carlo simulations of the phantom activity maps, as explained in Section C.
The 99mTc and 123I corrected images were compared with their corresponding gold standard and uncorrected images using profile lines. The gold standard images were obtained by reconstructing projections of the primary photons of single radionuclide Monte Carlo simulations. The myocardium to blood pool ratios was calculated for quantitative analysis within selected regions of interest (ROI) of the myocardium and blood pool of 99mTc and 123I images. The quantitative analysis was performed to compare the corrected, uncorrected, and gold standard images. Fig. 6 shows the ROI regions overlapping images with two relative blood pools and myocardial activities.
Fig. 6.
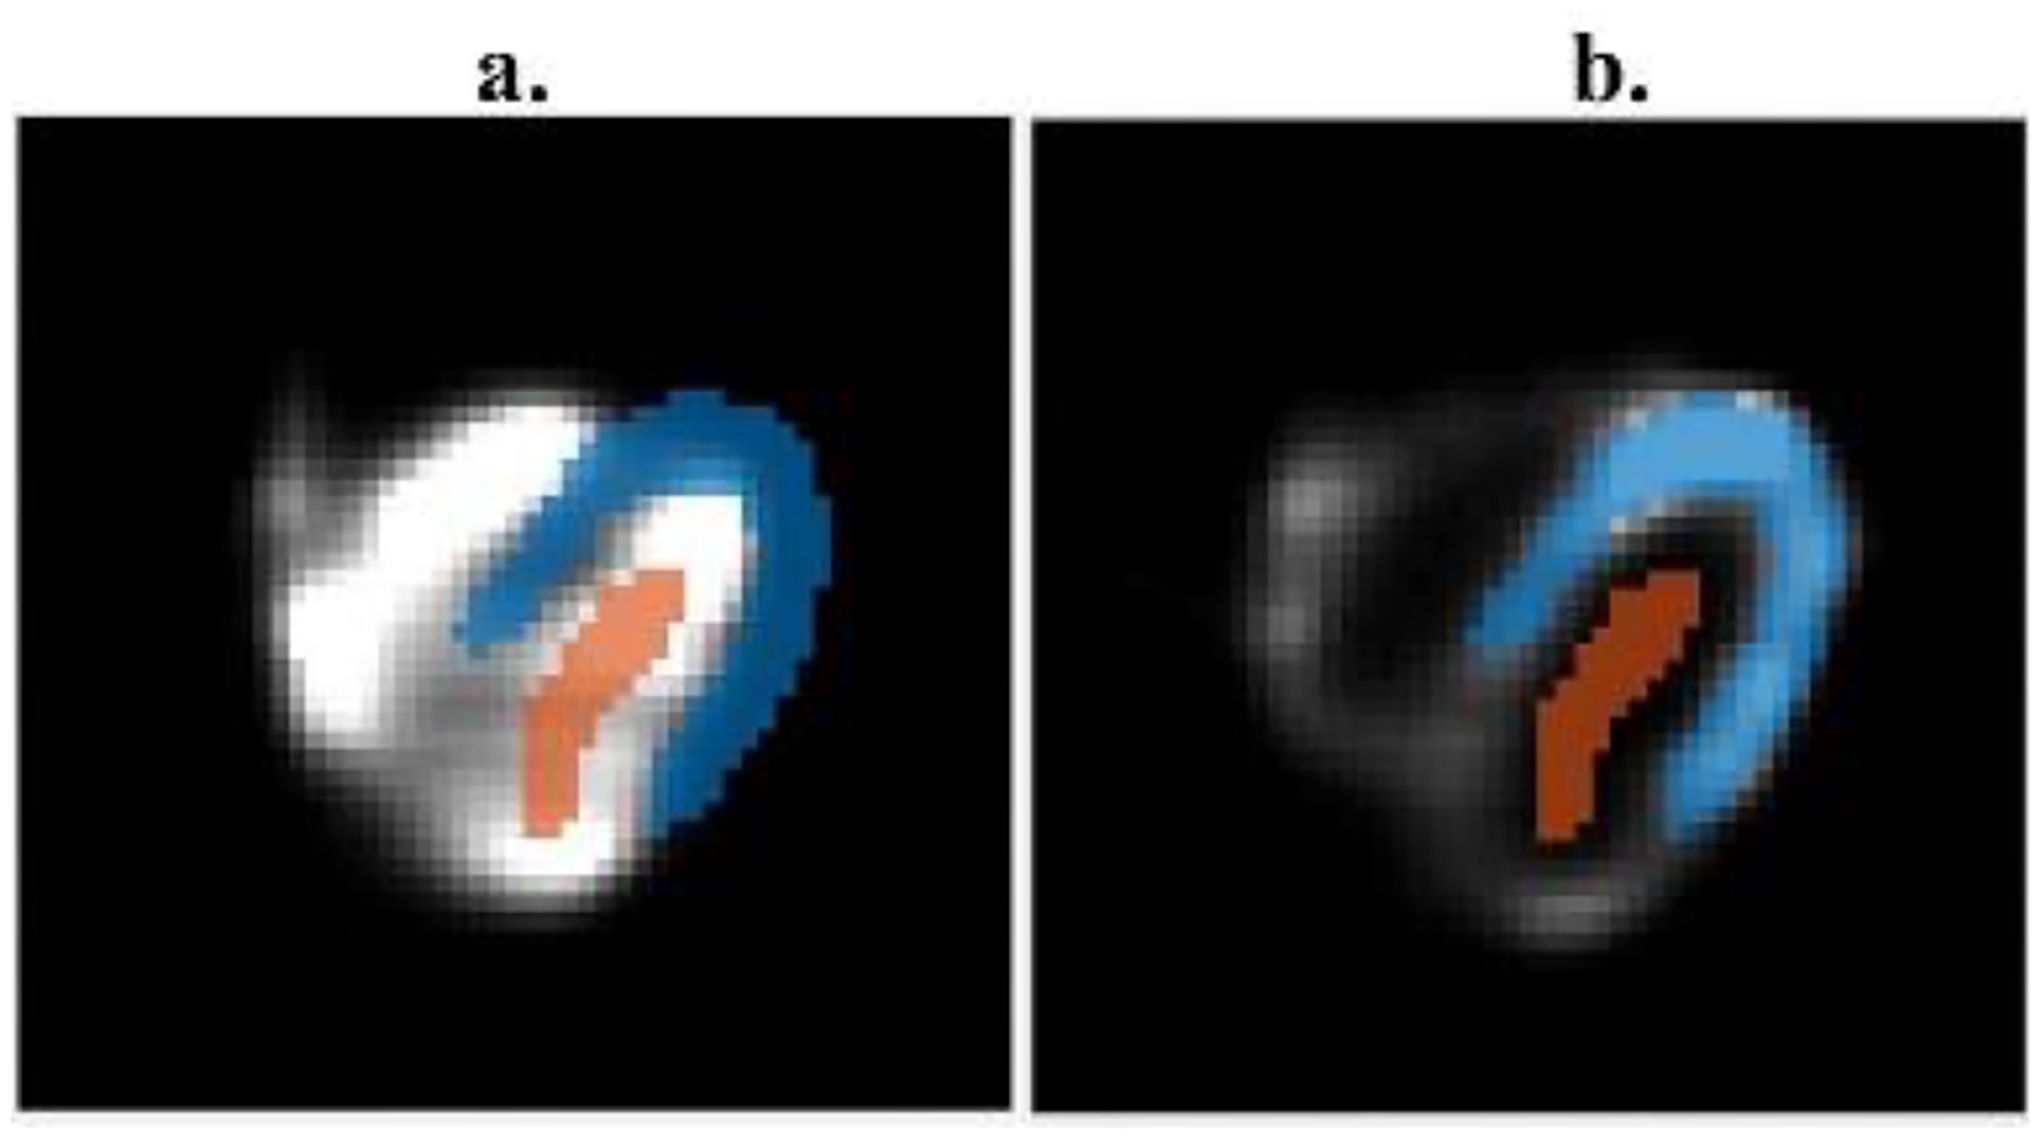
ROI definitions of myocardial tissue and blood pool. (a) ROI selection in the image with higher blood pool activity than the myocardium; (b) ROI selection in the image with higher myocardial tissue activity than the blood pool.
To analyze the performance of the proposed deconvolution model, the uncorrected and corrected images were compared to the corresponding gold standard images. A voxelwise scatterplot was created for this comparison, with a linear regression applied and the correlation coefficients calculated.
The root-mean-square error values were also calculated to measure the similarity of the uncorrected and corrected images to the gold standard and provide additional metrics for evaluating image quality.
E. In-vivo Study
All the imaging for this study was carried out on a Discovery NM 570c SPECT/CT camera from GE Healthcare. The canines were sedated, intubated, and anesthetized prior to imaging as previously reported in Feher et al 2020 [37] and then placed in a supine position on the imaging table. The protocol for this study included injecting 580 MBq (15 mCi) of 99mTc-RBC for blood pool imaging first as previously described in Mehy et al 2018 [38] and injecting 370 MBq (10 mCi) of 123I-mIBG for sympathetic imaging. The experiment was performed in accordance with Yale University Institutional Animal Care and Use Committee standards and approval, and according to the National Institutes of Health Guidelines for Care and Use of Laboratory Animals. After a 15-minute wait following the second injection, simultaneous data for the two radionuclides was acquired in list-mode.
II. Results
A. Penalty Term Accuracy
The pre-computed reference penalty terms (reference values) for each of the four simulations are shown in Table III.
TABLE III.
Reference penalty terms pre-computed
| Simulation | Reference values |
|---|---|
| 1 | 0.9344 |
| 2 | 0.9850 |
| 3 | 0.8522 |
| 4 | 0.8180 |
During the execution of the proposed iterative model with starting iteration numbers of 1 and 10, it was observed that after 50 iterations, both initial iteration numbers successfully estimated the reference penalty terms, as depicted in Fig. 7 for simulations 1, 2, and 4. It is worth noting that when using 10 iterations, the model promptly estimated the penalty term right from the beginning, particularly for simulations 1 and 2 (top row of Fig. 7), where the activity of 99mTc is higher than that of 123I. However, for simulations 3 and 4 (bottom row of Fig. 7), particularly simulation 3, characterized by a high 123I blood pool activity and low 99mTc myocardium activity, the estimation was not accurate. This discrepancy could be attributed to significant crosstalk contamination from the higher energy radionuclide to the lower energy radionuclide. Based on these results, it can be inferred that initiating the proposed model with 1 iteration provides more accurate estimates of the penalty terms compared to starting with 10 iterations, even though it may take longer to converge. Considering the findings of this study, we have determined that selecting 1 as the starting iteration number is preferred for this work. It is important to note that all subsequent results presented in this study were generated by running the model with 1 iteration as the initial starting point.
Fig. 7:
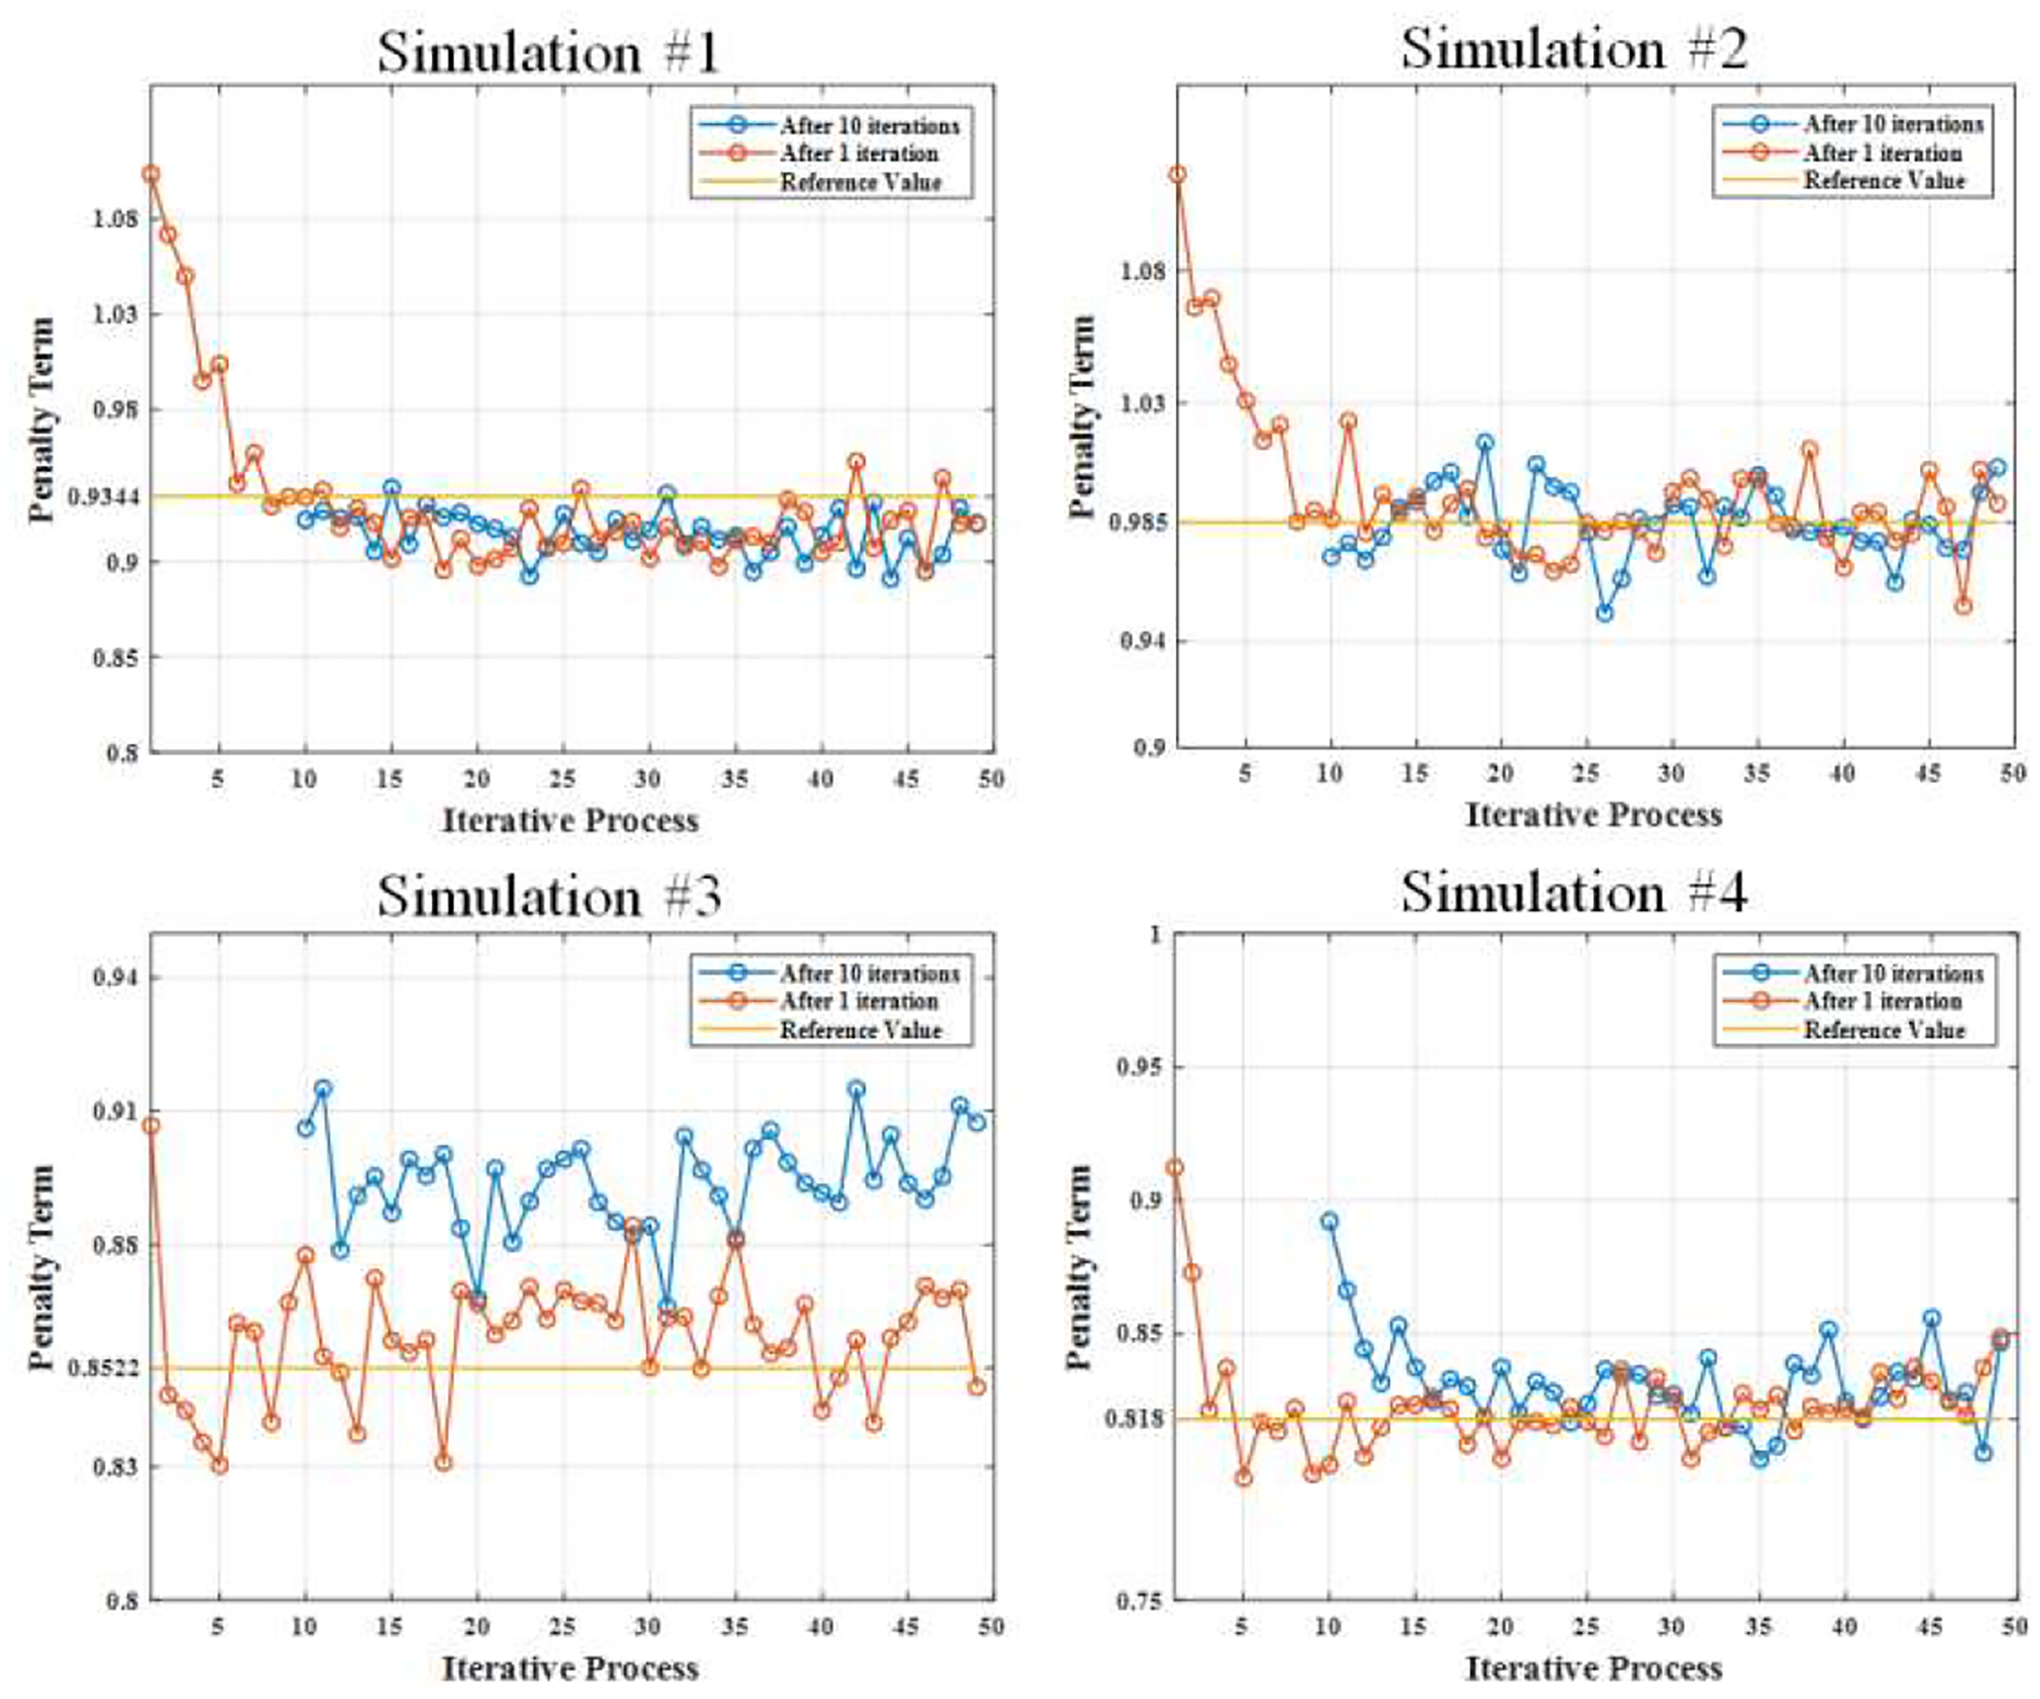
Penalty term estimation with the initial condition of 10 iterations and 1 iteration. Top row shows the estimations for the simulations 1 and 2, and bottom row shows the estimations for the simulations 3 and 4.
Table IV shows the estimated penalty terms’ average and standard deviations for the four simulations. All penalty term estimations converged to the reference value regardless of the histories of photons per projections (factor of 1 or 5), and the 99mTc and 123I activity distributions. Although the penalty terms’ estimation was very consistent with the reference values, simulations with a factor of 5 had a better agreement with the reference values than the simulations with a factor of 1. Also, the results of the standard deviations showed that the higher the number of photons, the better the statistics, providing lower fluctuations of the penalty term estimations in the whole iterative process.
TABLE IV.
Average and standard deviation of the estimated penalty term for photon histories per projection of a factor of one and five.
| Factor of one | Factor of five | ||||
|---|---|---|---|---|---|
| Sim | Reference | Average | Standard deviation | Average | Standard deviation |
| 1 | 0.9344 | 0.9080 | ±0.0287 | 0.9167 | ±0.0136 |
| 2 | 0.9850 | 0.9901 | ±0.0320 | 0.9867 | ±0.0135 |
| 3 | 0.8522 | 0.8717 | ±0.0237 | 0.8608 | ±0.0113 |
| 4 | 0.8180 | 0.8125 | ±0.0217 | 0.8209 | ±0.0104 |
Fig. 8 shows the penalty values estimation results compared to the reference values for the four simulations with factor of 1 and 5 histories of photons after 50 iterations. The estimated penalty terms with higher histories of photons per projection presented lower fluctuations compared to the reference value than simulations with lower histories of photons per projection due to the statistics of photons collection. However, it was time-consuming to complete the whole iterative loop. For a factor of 5, it took about 12 hours for all evaluations, while for a factor of 1, it took about 2 hours to finish. In clinical adoption, various acceleration strategies such as GPU implementation could reduce computational time to an acceptable clinical range.
Fig. 8.
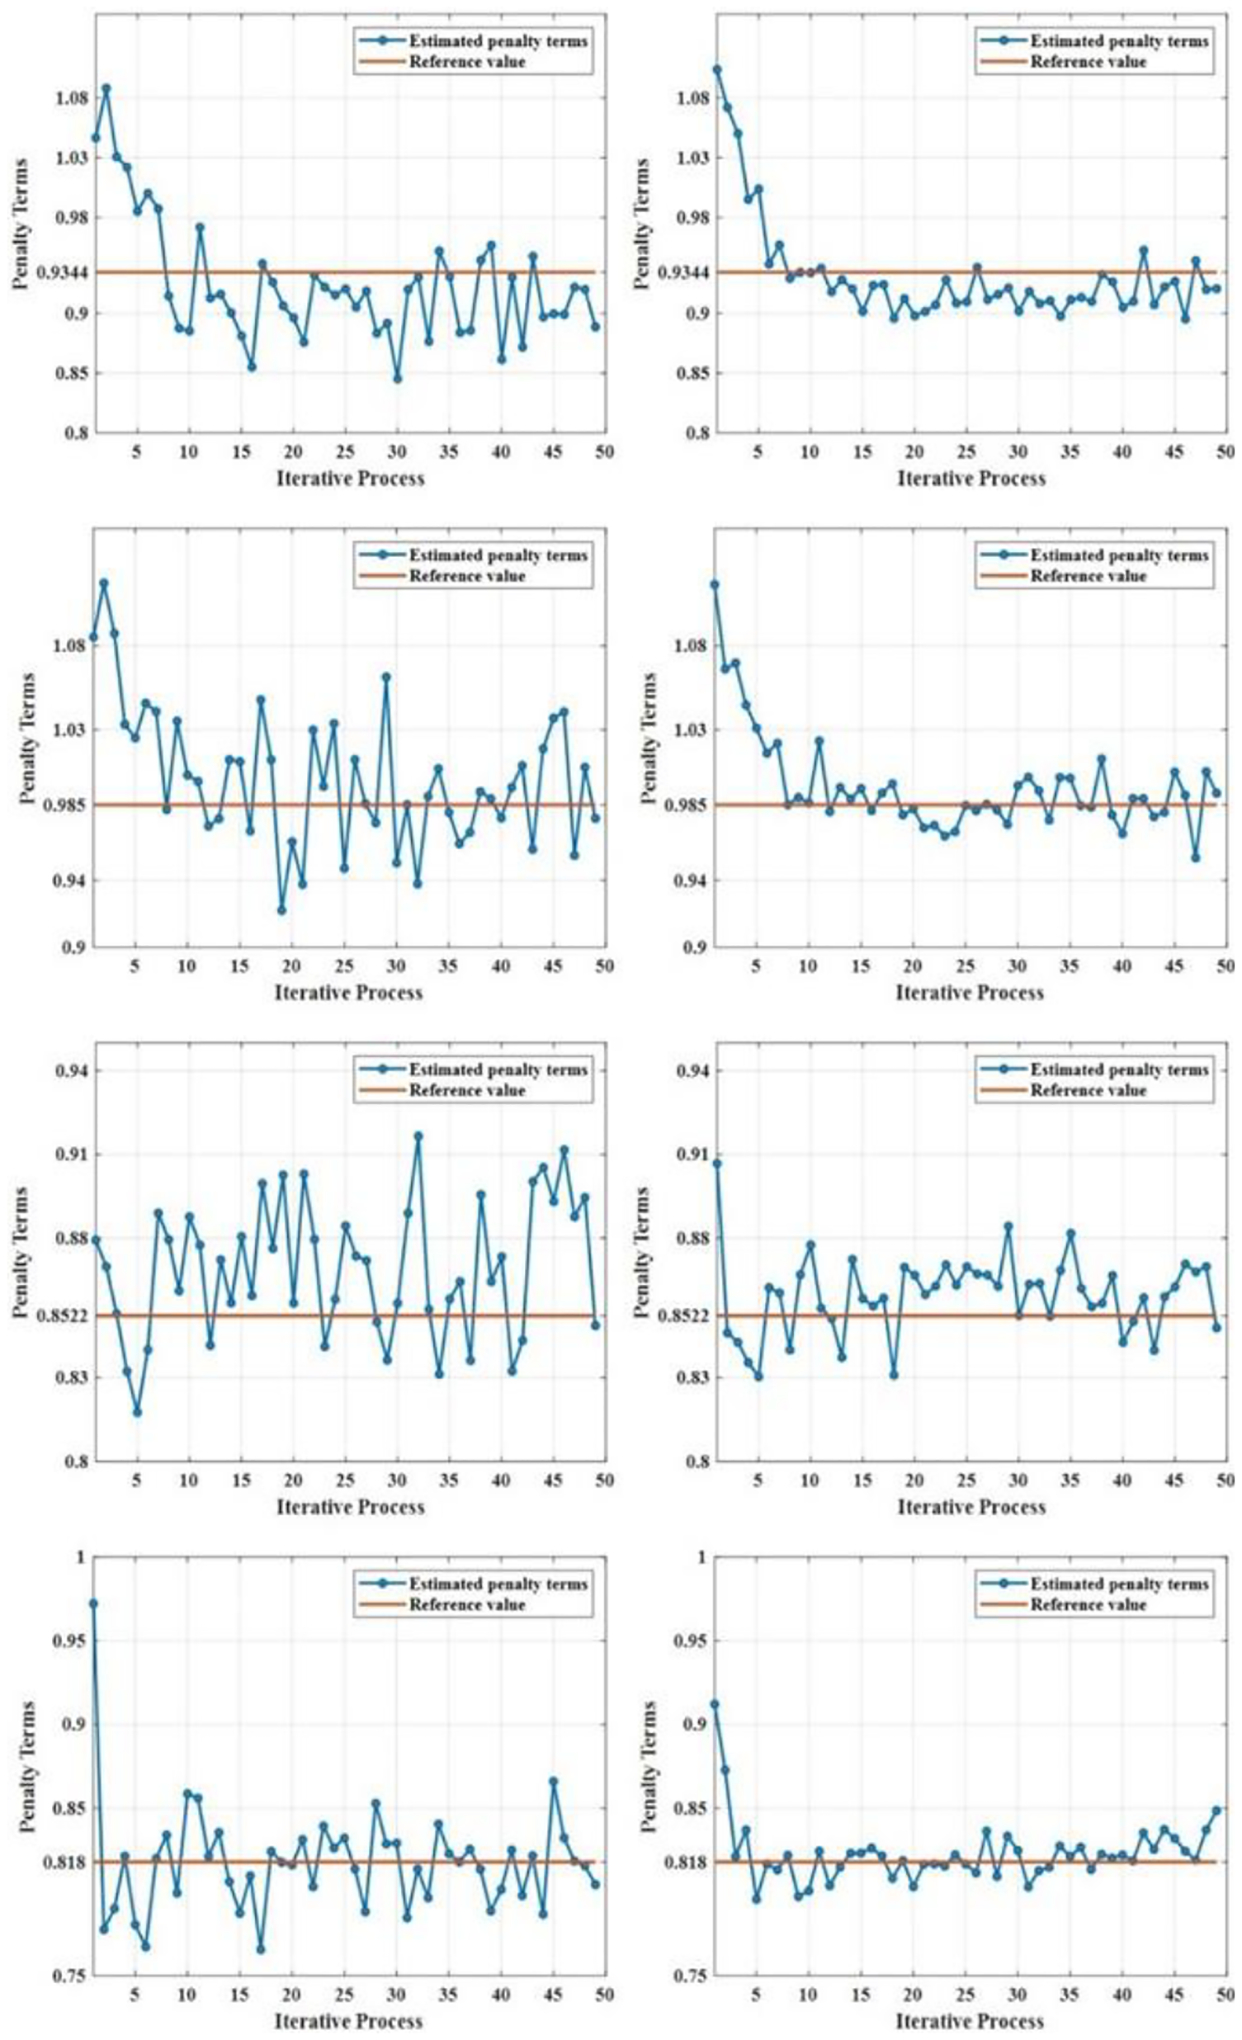
Penalty term estimation for the four simulations proposed. The left column includes the penalty terms estimations for a factor of one (1.0×10⁶ histories of photons per projection). The right column includes the penalty term estimation for a factor of five (5.0×10⁶ histories of photons per projection). Each row represents the four simulations. Top 2 plots are the first and second simulations proposed, and the bottom 2 plots are the third and the fourth simulations.
B. Image Corrections
Fig. 9 shows the samples’ uncorrected, corrected, and gold standard axial images for 99mTc and 123I. The first and the second rows are the results of simulations performed with higher 99mTc activity than 123I. The third and fourth rows show the results for simulations performed with higher 123I activity than 99mTc. The line profiles show that the corrected images are more consistent with the gold standard images for 99mTc and 123I. With higher 123I activity distribution, the down-scatter and tailing of the 123I into the 99mTc photopeak energy window are high, which leads to huge contamination in the 99mTc energy window for the third simulation. Similarly, the proposed approach effectively corrected the self-scatter, down-scatter, and tailing effect obtaining a better agreement with the gold standard.
Fig. 9:
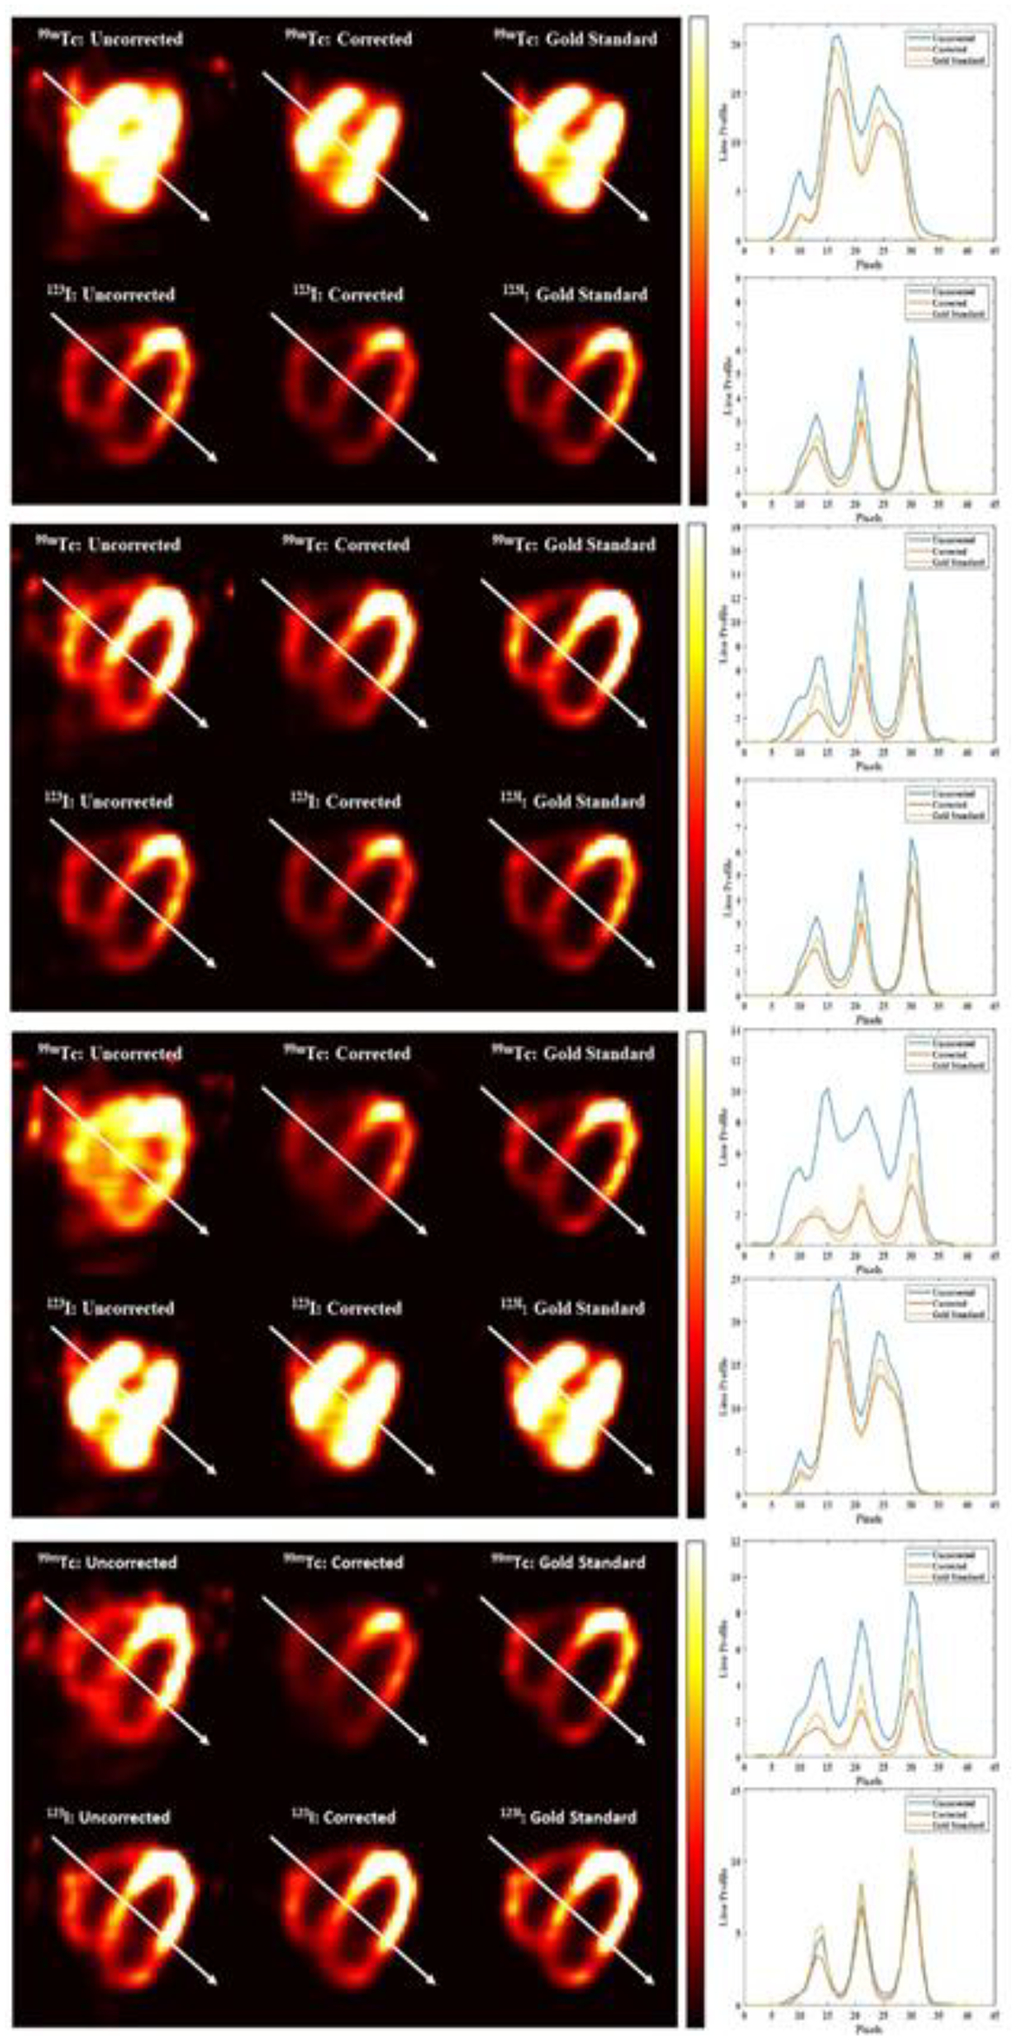
Samples of uncorrected, corrected, and gold standard axial images for the four simulations. The top 2 images are the results of the first and second simulation proposed, and the bottom 2 images are the results for the third and fourth simulations. For every one of the results, the top images are the axial image samples of 99mTc, and the bottom is the axial images of 123I. Columns 1, 2 and 3 are the uncorrected, corrected and gold standard respectively, with associated line profiles.
As shown in Table V, the average voxel values in the ROI of the corrected images generally had a better agreement with the gold standard values when compared to the uncorrected images for both 99mTc and 123I. Although both history of photons simulated presented good agreement with the gold standard images, we are presenting the results with higher number of photons simulated in Table V. The results of Table V are consistent with visual observation and line profiles in Fig. 9. After using the iterative model, the corrected images were found to be more consistent with the gold standard images in all the proposed simulations.
TABLE V.
Roi region averages and blood pool to myocardium ratios for 99mTc and 123I images
| 99mTc | |||||||||
|---|---|---|---|---|---|---|---|---|---|
| Uncorrected | Corrected | Gold Standard | |||||||
| Sim | Blood Pool | Myocardium | Ratio | Blood Pool | Myocardium | Ratio | Blood Pool | Myocardium | Ratio |
| 1 | 17.25 | 6.90 | 2.49 | 14.14 | 2.90 | 4.87 | 14.08 | 3.60 | 3.40 |
| 2 | 1.39 | 17.67 | 0.08 | 0.76 | 10.75 | 0.07 | 0.44 | 14.27 | 0.03 |
| 3 | 5.41 | 10.92 | 0.50 | 0.76 | 5.28 | 0.14 | 0.22 | 7.72 | 0.03 |
| 4 | 1.32 | 13.30 | 0.10 | 0.58 | 5.07 | 0.11 | 0.32 | 7.65 | 0.04 |
| 123I | |||||||||
| Uncorrected | Corrected | Gold Standard | |||||||
| Sim | Blood Pool | Myocardium | Ratio | Blood Pool | Myocardium | Ratio | Blood Pool | Myocardium | Ratio |
| 1 | 0.46 | 7.20 | 0.06 | 0.10 | 5.46 | 0.02 | 0.24 | 6.93 | 0.03 |
| 2 | 0.46 | 7.18 | 0.06 | 0.30 | 4.82 | 0.06 | 0.23 | 6.97 | 0.03 |
| 3 | 15.82 | 4.13 | 3.83 | 14.36 | 3.04 | 4.71 | 14.19 | 3.56 | 3.98 |
| 4 | 0.99 | 14.12 | 0.07 | 0.72 | 11.97 | 0.06 | 0.50 | 14.48 | 0.03 |
Fig. 10 presents scatterplots comparing the gold standard images with the respective uncorrected and corrected images. The scatterplots show that the corrected images have better agreement with the gold standard images compared to the uncorrected ones, particularly for the images reconstructed using the 99mTc window when the simulation is performed with higher 123I activity than the 99mTc (simulations 3 and 4). This significant discrepancy is due to the high level of crosstalk contamination caused by the higher energy of the 123I, which adds 123I downscatter and low energy tail to the 99mTc energy window, leading to degradation of the 99mTc image. However, after applying the proposed model, the corrected 99mTc images were more consistent with the gold standard, demonstrating the effectiveness of the model.
Fig. 10:
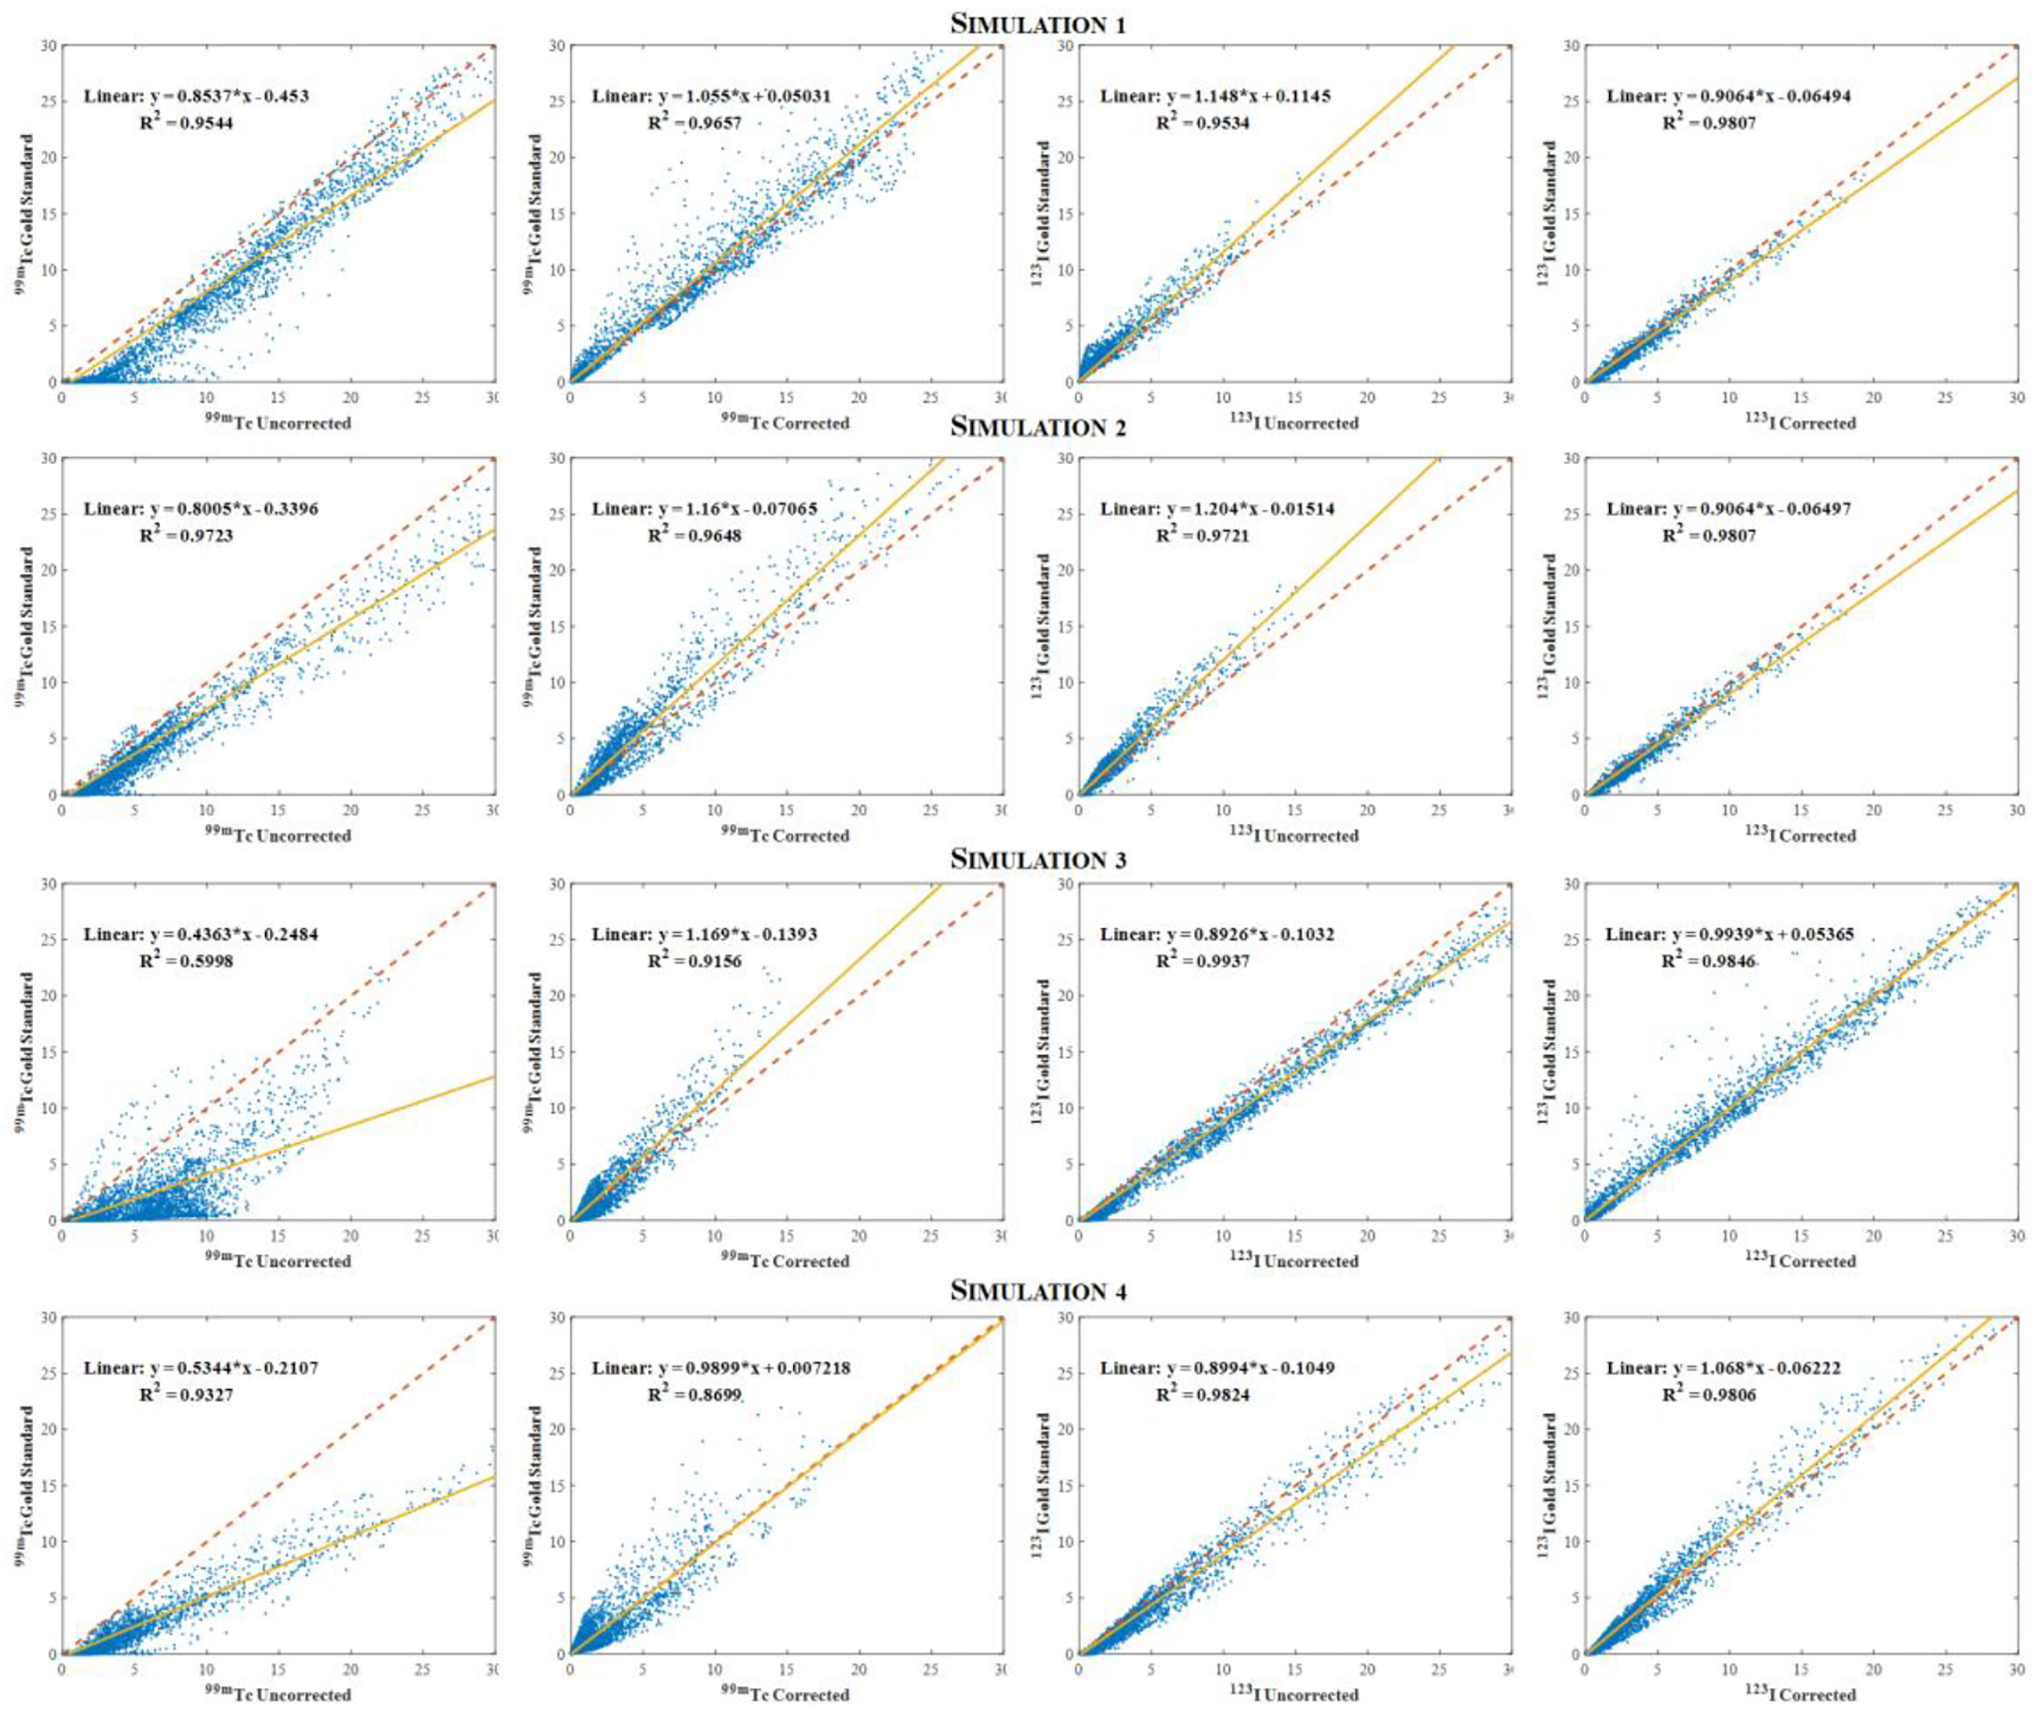
Voxelwise scatterplots comparing the uncorrected images with the gold standard one for all simulations proposed.
Also, the similarity between images obtained after calculating the RMSE is presented in Table VI. This Table shows that the corrected images have a higher similarity with the gold standard images compared to the uncorrected images. All the metrics used in this paper have showed that the proposed deconvolution model is able to effectively correct the self-scatter and crosstalk contamination for various 99mTc/123I distribution combinations.
TABLE VI.
Root-mean-square error relative to gold standard images for all simulations
| 99mTc | 123I | |||
|---|---|---|---|---|
| Simulations | Uncorrected | Corrected | Uncorrected | Corrected |
| 1 | 2.8961 | 1.0600 | 0.2405 | 0.1180 |
| 2 | 2.2457 | 0.9984 | 0.2911 | 0.1940 |
| 3 | 4.2141 | 0.4757 | 0.5147 | 0.3027 |
| 4 | 7.9792 | 0.4233 | 0.7571 | 0.3940 |
Comparing the iterative approach proposed in this work with the model previously described by Fan et. al [31] with a fixed penalty term, the major difference lays on the dual-radionuclide studies with higher 123I activity than the 99mTc, presented in simulations 3 and 4. As previously discussed, the 99mTc window includes the down-scatter and tailing from the 123I window, and with a higher 123I activity, the contribution of these crosstalk contamination over the 99mTc will be higher. That means the relationship between primary-to-scatter will suffer from a significant change, then a good estimation of the penalty term for these situations must be performed when applying the iterative model. When the studies are performed otherwise (simulations 1 and 2), there are still contributions from the higher energy, however the model might not demonstrate much difference when compared with the fixed penalty term. Fig. 11 shows sample image reconstructions under the 99mTc window for a simultaneous dual-radionuclide acquisition similar to simulation 3. The proposed method led to images more consistent with the gold standard images as compared to the ones with a fixed penalty term.
Fig. 11:
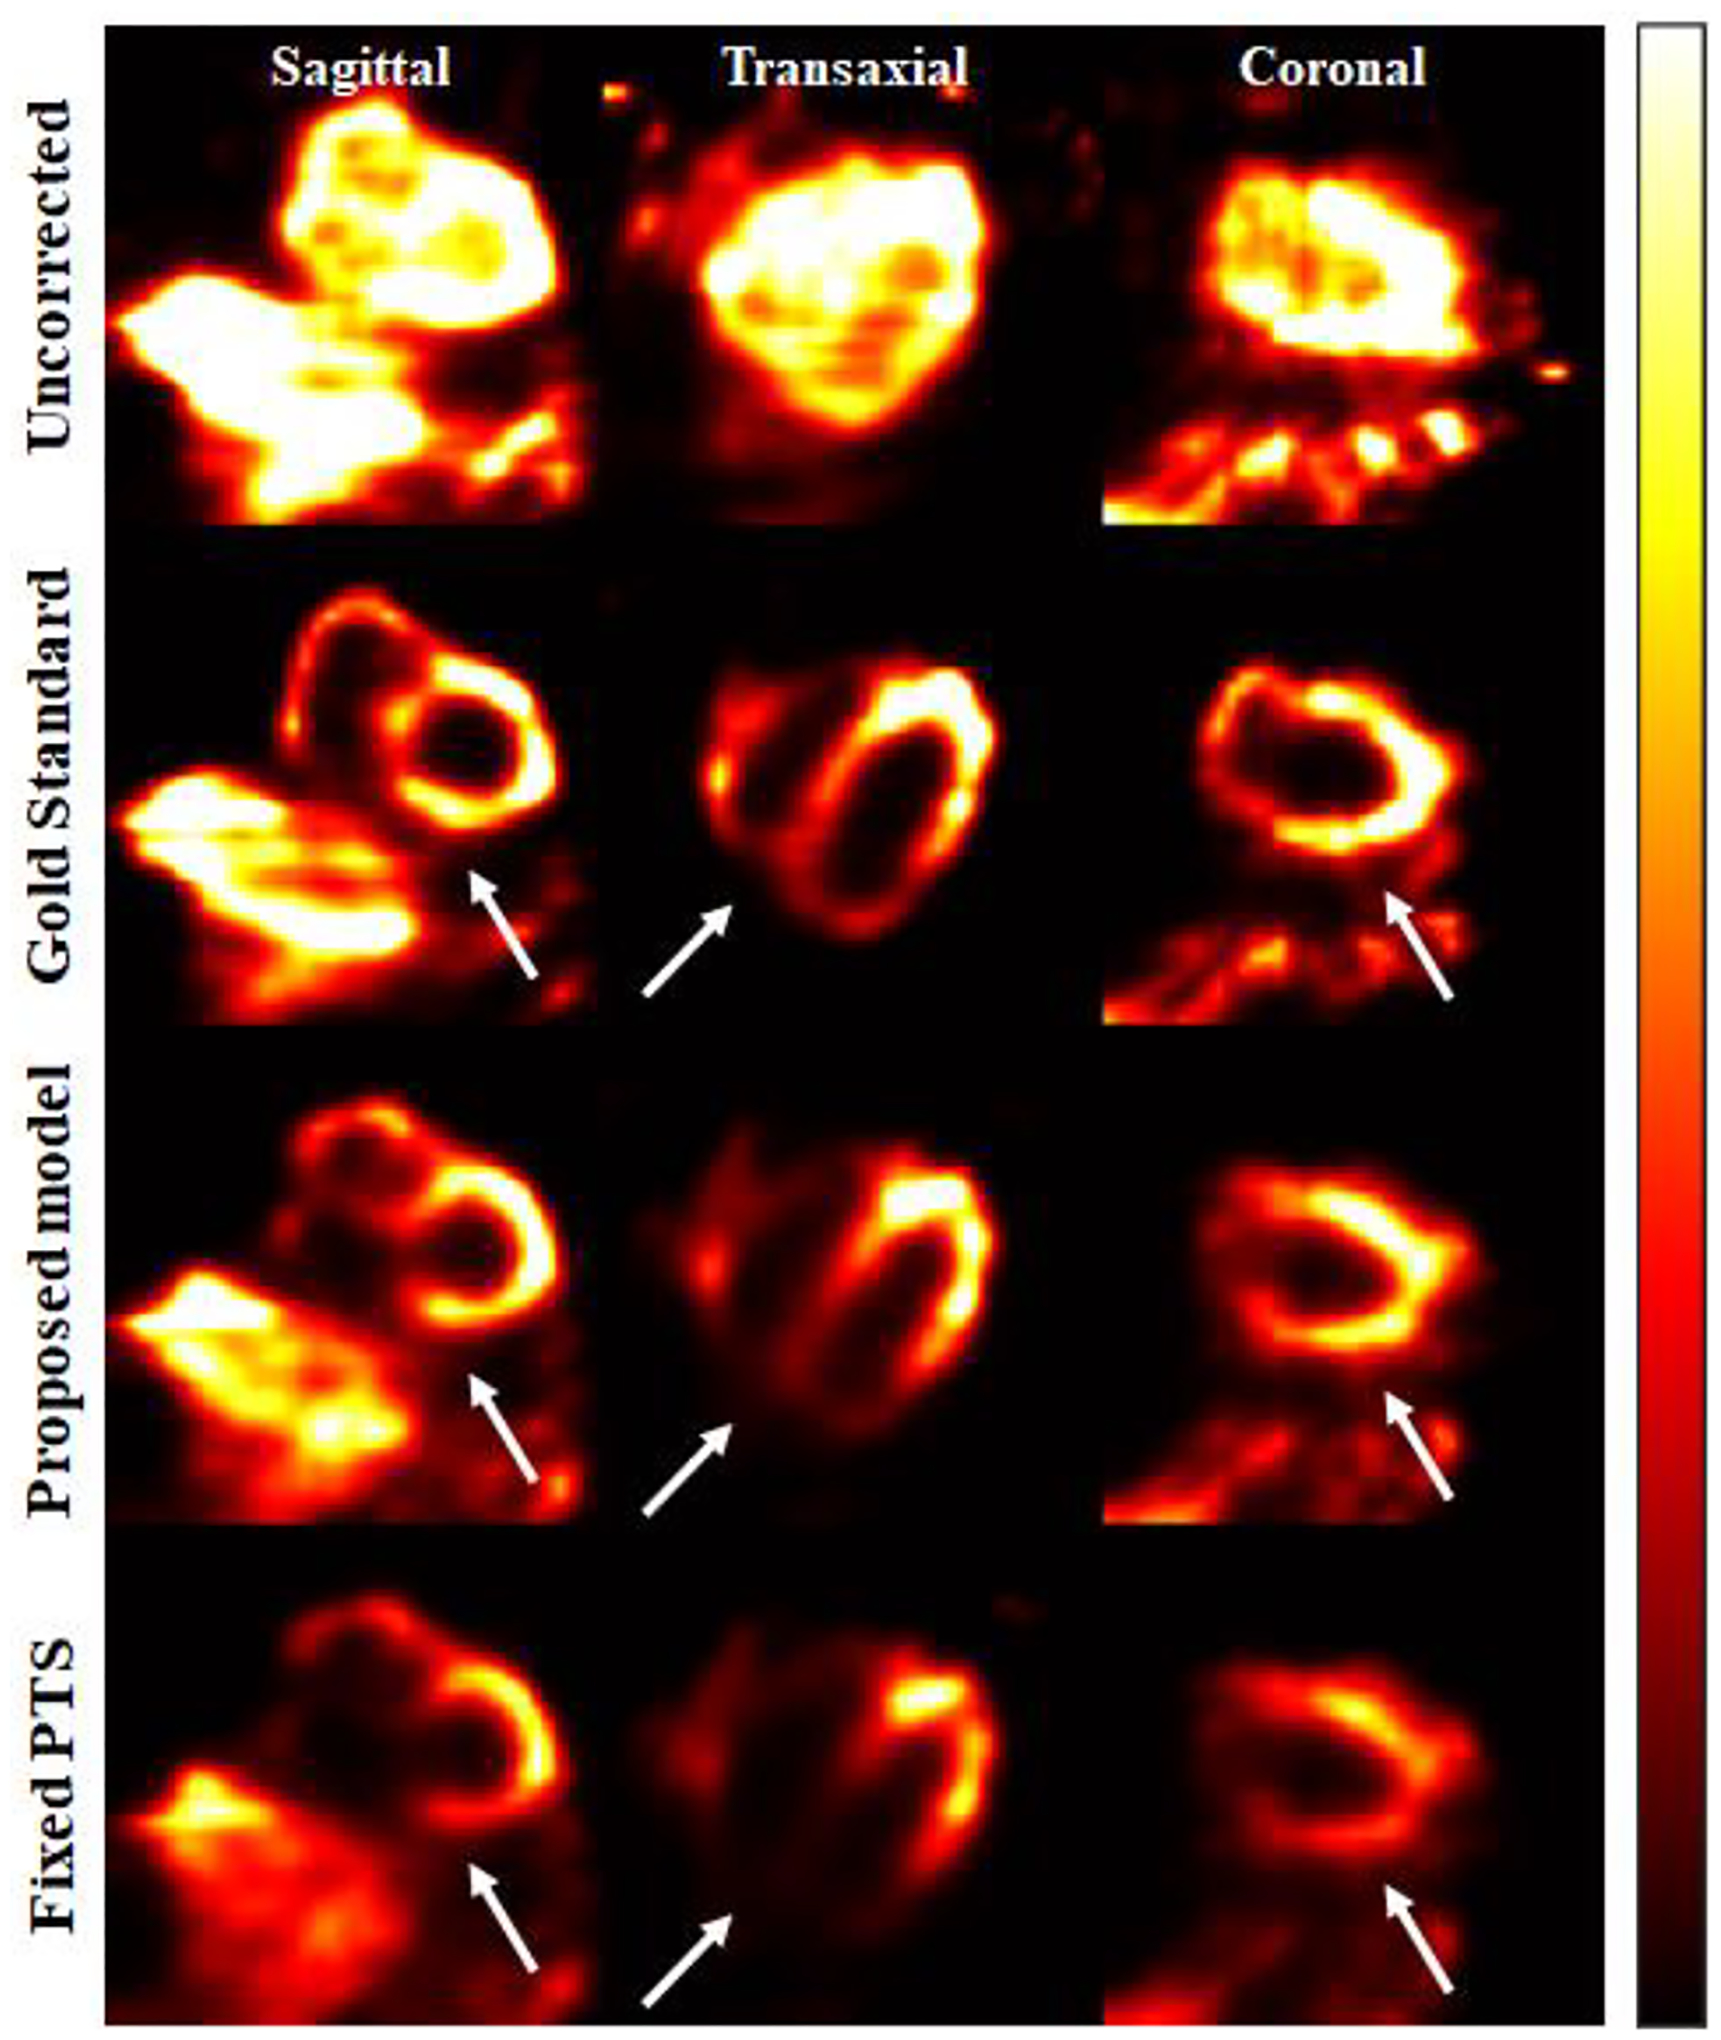
Simulation 3 images reconstructions under the 99mTc window. Top row shows the uncorrected images, second row the gold standard, third row the images reconstructed applying the proposed iterative model, and fourth row the images with fixed penalty term.
Fig. 12 shows the results of the large animal data for 123I-mIBG, with the top row being the uncorrected images and the bottom images being the corrected images. In the case of simultaneous acquisition of 99mTc and 123I, most of the corrections for the 123I energy window are for self-scatter. It can be observed that the image contrast improved after correction for 123I-mIBG. Fig. 13 displays the large animal results for 99mTc-RBC, with the top row representing the uncorrected images and the bottom row representing the corrected images. The crosstalk due to downscatter and low energy tail from 123I leads to the contamination in the 99mTc energy window. The corrected images show that crosstalk contamination has been effectively corrected with improved contrast and separation between blood pools of the left ventricle and right ventricle.
Fig. 12:
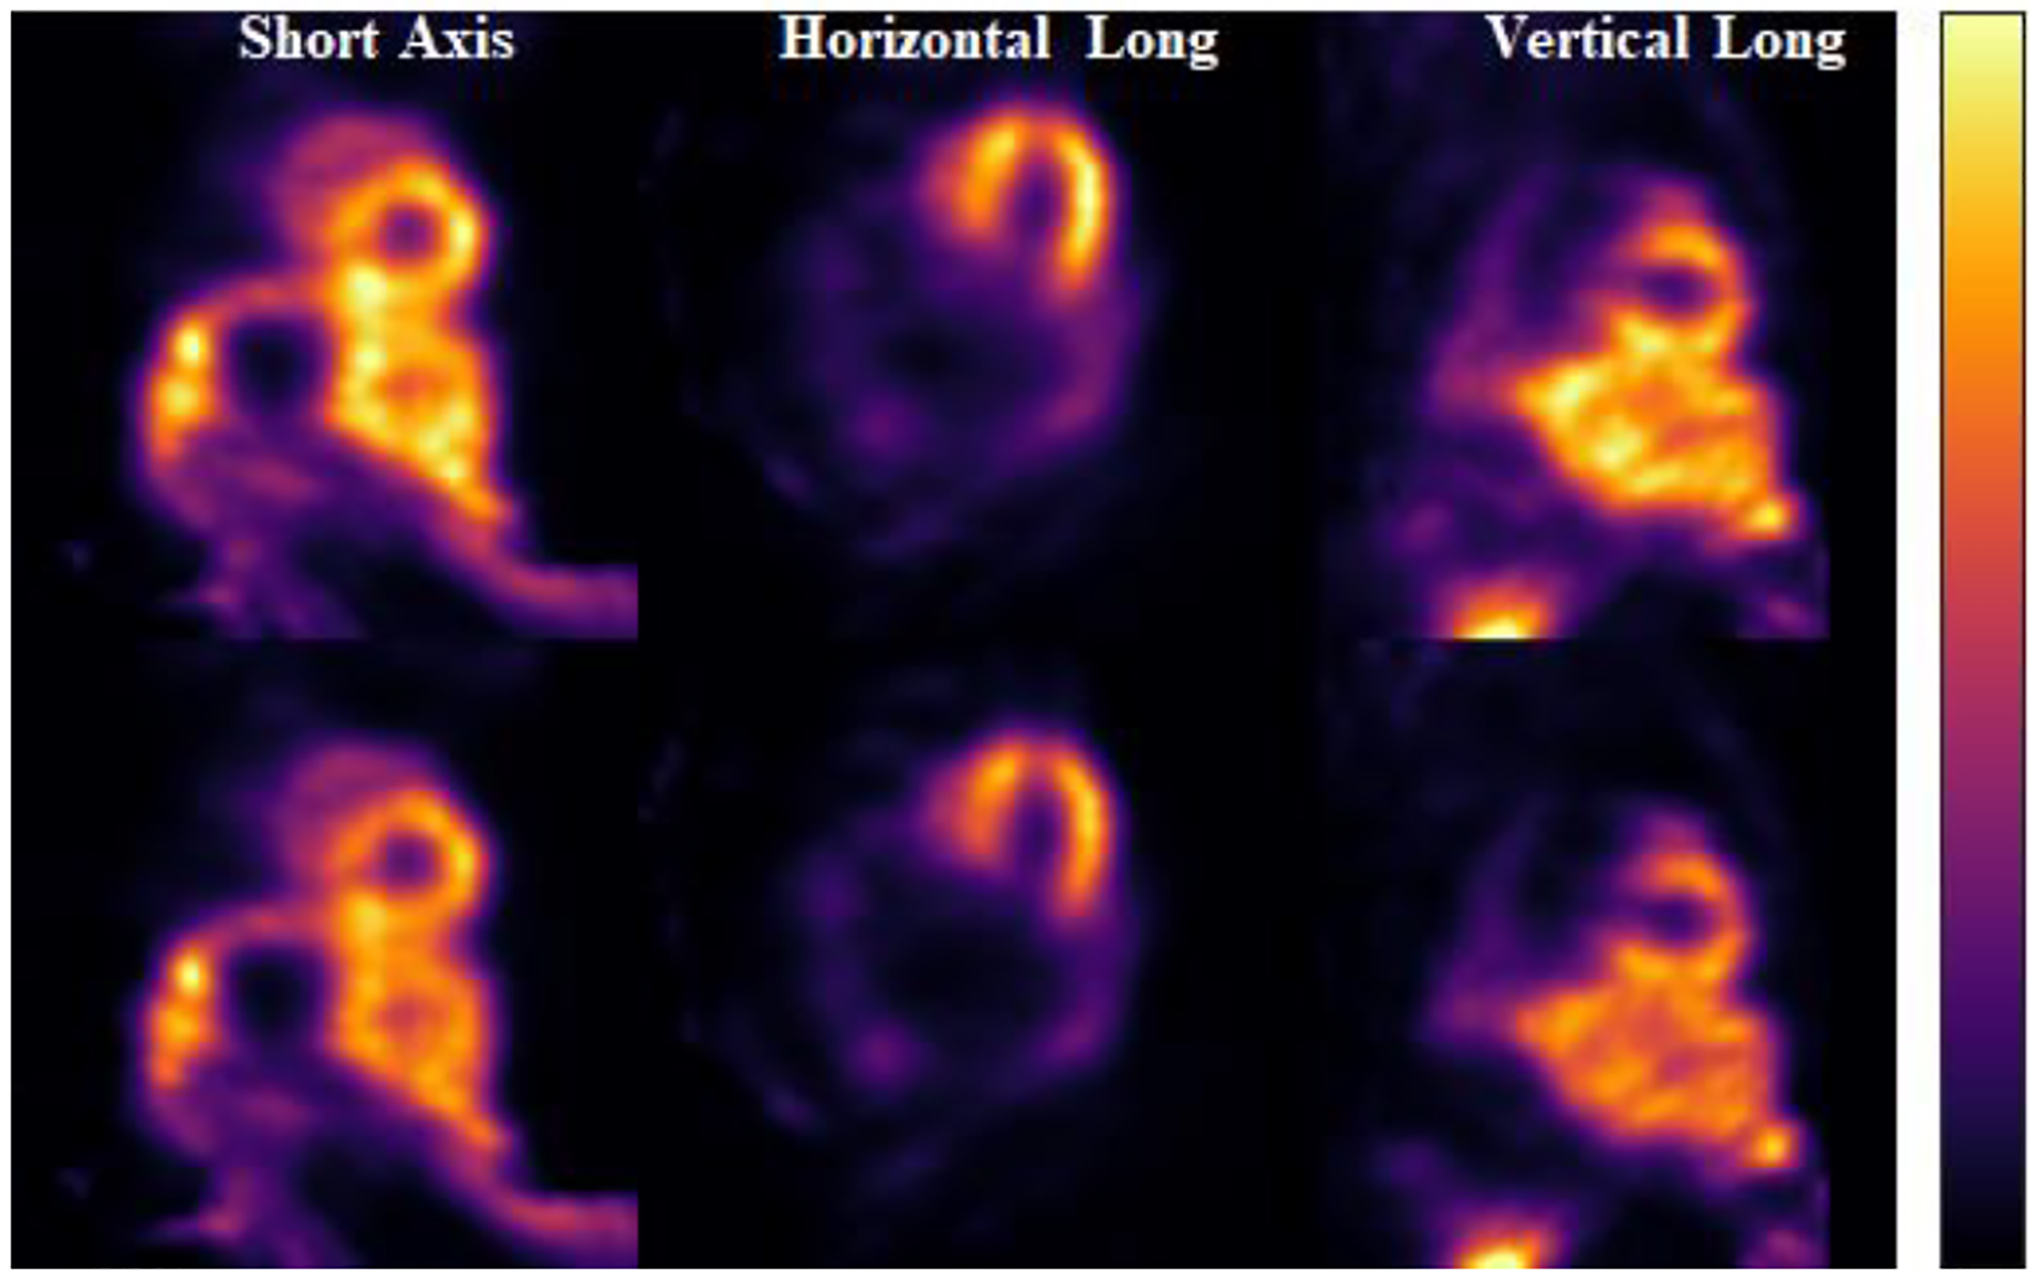
123I reconstructed images of canine data. Top images are the uncorrected images, and the bottom images are the corrected ones.
Fig. 13:
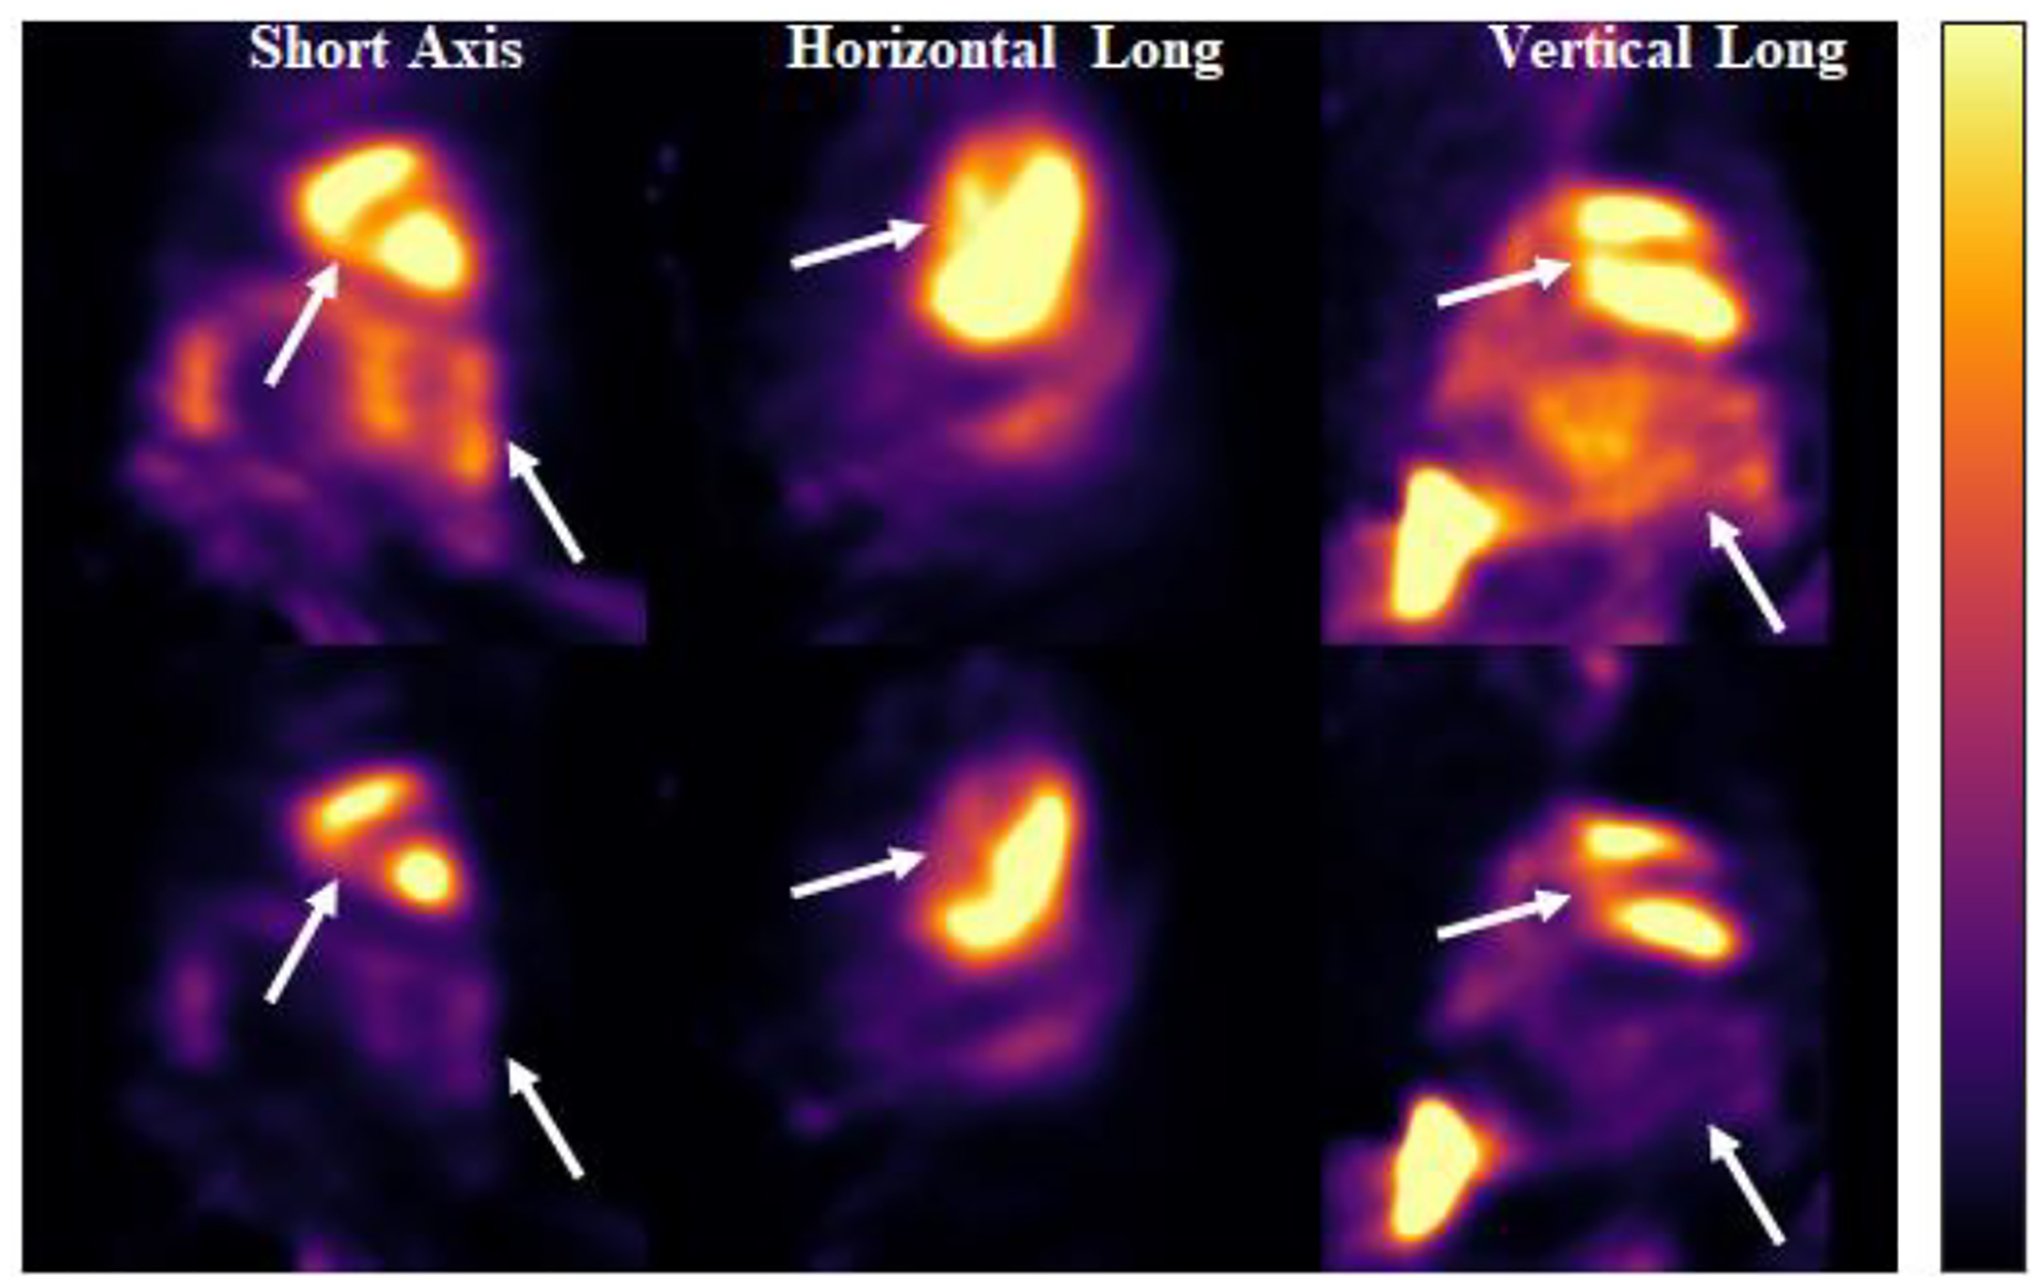
99mTc reconstructed images of canine data. Top images are the uncorrected images, and the bottom images are the corrected ones.
IIII. Discussion
The proposed scatter correction approach extended the previous iterative deconvolution approach developed by Fan et al. [31]. The previous iterative deconvolution approach uses a fixed penalty term for similar dual-radionuclide distributions to obtain the self-scatter, down-scatter and tailing components. The main objective of the current approach was to develop a model that estimates the penalty terms independent of the dual-radionuclide spatial distribution. As shown in Fig. 5, an iterative framework was developed comprising the previous iterative deconvolution method with SIMIND to estimate the penalty terms within each MLEM reconstruction iteration loop.
The estimated penalty terms were highly consistent with the reference values. For fewer histories photons per projection (factor of one), the estimation had a good agreement with the reference values. Even though few histories of photons per projection took significantly less time than the higher history counterparts (2 hours versus 12 hours), it presented higher fluctuations than those of higher histories of photons per projection. The fluctuations over the reference value are due to the photon’s emission and detection statistics. When increasing the histories of photons per projection, better counting statistics are presented. Thereby the calculation of the penalty term from the ratio of the PTS will be more robust than the case of fewer histories of photons per projection.
As shown in Fig. 8, the model effectively corrects for self-scatter, down-scatter, and tailing effects at the end of the iterative loop. While the penalty terms converge to the reference value at iteration 10, continuing the loop up to 50 iterations slightly improves convergency. Once validated, the iteration can be stopped early in future works once convergence is achieved, making the process less time-consuming.
Due to the high contamination of the 123I tailing and down-scatter into the 99mTc energy window in our simulations, images reconstruction of 99mTc presented many artifacts when the dual-radionuclide simulation was performed with higher 123I activity distribution than the 99mTc. Some residual errors remained when compared to the gold standard. Future investigations are needed to further improve the model accuracy. According to all the metrics proposed in this study, the results showed that the corrected images had more consistent quantification accuracy to the gold standard images as compared to the uncorrected images.
This work based on Monte Carlo simulations and application to a large animal imaging study demonstrated the promise of our proposed approach and framework using 99mTc/123I. We will modify the current approach for other dual-radionuclide tracers in future studies, such as 201Tl/99mTc.
IV. Conclusion
We have developed an effective self-scatter, down-scatter, and tailing effect correction approach for various spatial distribution combinations of dual-radionuclide 99mTc/123I studies. The method is an extension of the previous iterative deconvolution method. The current iterative approach can estimate the penalty terms independent of the dual-radionuclide distributions by integrating Monte Carlo simulations into the MLEM iterative reconstruction loops.
Acknowledgements
The authors would like to thank the Foundation for the National Institutes of Health under grants R01HL154345, R01HL123949, T32HL098069, and S10RR025555.
This work was supported by the Foundation for the National Institutes of Health under Grants R01HL154345, R01HL123949, T32HL098069, and S10RR025555.
Footnotes
Color versions of one or more of the figures in this article are available online at http://ieeexplore.ieee.org
All authors declare that they have no known conflicts of interest in terms of competing financial interests or personal relationships that could have an influence or are relevant to the work reported in this paper.
Contributor Information
Alexandre F. Velo, Department of Radiology and Biomedical Imaging, Yale University, New Haven, CT 06510 USA
Peng Fan, Beijing Institute of Spacecraft System Engineering, Beijing, China.
Huidong Xie, Department of Radiology and Biomedical Imaging, Yale University, New Haven, CT 06510 USA.
Xiongchao Chen, Department of Radiology and Biomedical Imaging, Yale University, New Haven, CT 06510 USA.
Nabil Boutagy, Department of Internal Medicine (Cardiology), Yale University, New Haven, CT 06510 USA.
Attila Feher, Department of Internal Medicine (Cardiology), Yale University, New Haven, CT 06510 USA.
Albert J. Sinusas, Department of Internal Medicine (Cardiology), Yale University, New Haven, CT 06510 USA
Michael Ljungberg, Medical Radiation Physics, Lund University, Lund, Sweden.
Chi Liu, Department of Radiology and Biomedical Imaging, Yale University, New Haven, CT 06510 USA.
References
- [1].Kacperski K, Erlandsson K, Ben-Haim S, and Hutton BF, “Iterative deconvolution of simultaneous 99mTc and 201Tl projection data measured on a CdZnTe-based cardiac SPECT scanner,” Phys Med Biol, vol. 56, n. (5), p. 1397–414, 2011, DOI: 10.1088/0031-9155/56/5/012. [DOI] [PMC free article] [PubMed] [Google Scholar]
- [2].Kadrmas DJ, Frey EC, and Tsui BM, “Simultaneous technetium-99m/thallium-201 SPECT imaging with model-based compensation for cross-contaminating effects,” Phys Med Biol, vol. 44, n. (7), p. 1843–60, 1999, DOI: 10.1088/0031-9155/44/7/319. [DOI] [PMC free article] [PubMed] [Google Scholar]
- [3].Liu P, Burns RJ, Houle S, Warbick-Cerone A, Johnston L, Gilday D, el-Maraghi N, and McLaughlin PR, “Validation of cardiac single photon emission tomography of labeled intracoronary microspheres as a method to measure changes in distribution of coronary blood flow,” Can J Cardiol, vol. 2, n. (6), p. 362–7, 1986. [PubMed] [Google Scholar]
- [4].Johnson LL, Lerrick KS, Coromilas J, Seldin DW, Esser PD, Zimmerman JM, Keller AM, Alderson PO, Bigger JT Jr., and Cannon PJ, “Measurement of infarct size and percentage myocardium infarcted in a dog preparation with single photon-emission computed tomography, thallium-201, and indium 111-monoclonal antimyosin Fab,” Circulation, vol. 76, n. (1), p. 181–90, 1987, DOI: 10.1161/01.cir.76.1.181. [DOI] [PubMed] [Google Scholar]
- [5].Alexander C and Oberhausen E, “Myocardial Scintigraphy,” Seminars in Nuclear Medicine, vol. 25, n. (2), p. 195–201, 1995, DOI: Doi 10.1016/S0001-2998(95)80026-3. [DOI] [PubMed] [Google Scholar]
- [6].Du Y, Bhattacharya M, and Frey EC, “Simultaneous Tc-99m/I-123 dual-radionuclide myocardial perfusion/innervation imaging using Siemens IQ-SPECT with SMARTZOOM collimator,” Phys Med Biol, vol. 59, n. (11), p. 2813–28, 2014, DOI: 10.1088/0031-9155/59/11/2813. [DOI] [PMC free article] [PubMed] [Google Scholar]
- [7].Zaret BL and Beller GA, Clinical Nuclear Cardiology. Clinical Nuclear Cardiology. 2010. [Google Scholar]
- [8].Miyamoto K, Nakata T, Yuda S, Uno K, Wakabayashi T, Tsuchihashi K, and Shimamoto K. Mechanisms of impaired cardiac sympathetic innervation assessed by MIBG responsible for long-term cardiac death probability in patients with left ventricular dysfunction. in Circulation. 1999. LIPPINCOTT WILLIAMS & WILKINS; 530 WALNUT ST, PHILADELPHIA, PA 19106–3621 USA. [Google Scholar]
- [9].Pace L, Betocchi S, Losi MA, Della Morte AM, Ciampi Q, Nugnez R, Chiariello M, and Salvatore M, “Sympathetic nervous function in patients with hypertrophic cardiomyopathy assessed by [123I]-MIBG: relationship with left ventricular perfusion and function,” Q J Nucl Med Mol Imaging, vol. 48, n. (1), p. 20–5, 2004. [PubMed] [Google Scholar]
- [10].Raffel DM and Wieland DM, “Development of mIBG as a cardiac innervation imaging agent,” JACC Cardiovasc Imaging, vol. 3, n. (1), p. 111–6, 2010, DOI: 10.1016/j.jcmg.2009.09.015. [DOI] [PubMed] [Google Scholar]
- [11].Sakata K, Iida K, Mochizuki N, Ito M, and Nakaya Y, “Physiological changes in human cardiac sympathetic innervation and activity assessed by (123)I-metaiodobenzylguanidine (MIGB) imaging,” Circ J, vol. 73, n. (2), p. 310–5, 2009, DOI: 10.1253/circj.cj-08-0614. [DOI] [PubMed] [Google Scholar]
- [12].Zhao C, Shuke N, Yamamoto W, Okizaki A, Sato J, Ishikawa Y, Ohta T, Hasebe N, Kikuchi K, and Aburano T, “Comparison of cardiac sympathetic nervous function with left ventricular function and perfusion in cardiomyopathies by (123)I-MIBG SPECT and (99m)Tc-tetrofosmin electrocardiographically gated SPECT,” J Nucl Med, vol. 42, n. (7), p. 1017–24, 2001. [PubMed] [Google Scholar]
- [13].Yukinaka M, Nomura M, Ito S, and Nakaya Y, “Mismatch between myocardial accumulation of 123I-MIBG and 99mTc-MIBI and late ventricular potentials in patients after myocardial infarction: association with the development of ventricular arrhythmias,” Am Heart J, vol. 136, n. (5), p. 859–67, 1998, DOI: 10.1016/s0002-8703(98)70132-2. [DOI] [PubMed] [Google Scholar]
- [14].Agostini D, Dronne F, Mulder P, Thulliez C, and Bouvard G. Mismatch between cardiac neuronal and perfusion uptakes using a dual I-123-MIBG and Tl-201 kinetic study in rat with myocardial infarction. in JOURNAL OF NUCLEAR MEDICINE. 2002. SOC NUCLEAR MEDICINE INC; 1850 SAMUEL MORSE DR, RESTON, VA 20190-5316 USA. [Google Scholar]
- [15].Hutton BF, Buvat I, and Beekman FJ, “Review and current status of SPECT scatter correction,” Phys Med Biol, vol. 56, n. (14), p. R85–112, 2011, DOI: 10.1088/0031-9155/56/14/R01. [DOI] [PubMed] [Google Scholar]
- [16].Buvat I, Benali H, Todd-Pokropek A, and Di Paola R, “Scatter correction in scintigraphy: the state of the art,” Eur J Nucl Med, vol. 21, n. (7), p. 675–94, 1994, DOI: 10.1007/BF00285592. [DOI] [PubMed] [Google Scholar]
- [17].Moore SC, English RJ, Syravanh C, Tow DE, Zimmerman RE, Chan KH, and Kijewski MF, “Simultaneous Tc-99m/Tl-201 imaging using energy-based estimation of the spatial distributions of contaminant photons,” IEEE Transactions on Nuclear Science, vol. 42, n. (4), p. 1189–1195, 1995, DOI: 10.1109/23.467879. [DOI] [Google Scholar]
- [18].Hademenos GJ, Dahlbom M, and Hoffman EJ, “Simultaneous dual-isotope technetium-99m/thallium-201 cardiac SPET imaging using a projection-dependent spilldown correction factor,” European Journal of Nuclear Medicine, vol. 22, n. (5), p. 465–472, 1995, DOI: 10.1007/BF00839061. [DOI] [PubMed] [Google Scholar]
- [19].Yang DC, Ragasa E, Gould L, Huang M, Reddy CV, Saul B, Schifter D, Rainaldi D, Feld C, Tank RA, et al. , “Radionuclide simultaneous dual-isotope stress myocardial perfusion study using the “three window technique”,” Clin Nucl Med, vol. 18, n. (10), p. 852–7, 1993, DOI: 10.1097/00003072-199310000-00006. [DOI] [PubMed] [Google Scholar]
- [20].Knesaurek K and Machac J, “Enhanced cross-talk correction technique for simultaneous dual-isotope imaging: a TL-201/Tc-99m myocardial perfusion SPECT dog study,” Med Phys, vol. 24, n. (12), p. 1914–23, 1997, DOI: 10.1118/1.598105. [DOI] [PubMed] [Google Scholar]
- [21].Hannequin P, Mas J, and Germano G, “Photon energy recovery for crosstalk correction in simultaneous 99mTc/201Tl imaging,” J Nucl Med, vol. 41, n. (4), p. 728–36, 2000. [PubMed] [Google Scholar]
- [22].Frey EC and Tsui BMW. A new method for modeling the spatially-variant, object-dependent scatter response function in SPECT. in 1996 IEEE Nuclear Science Symposium. Conference Record. 1996. [Google Scholar]
- [23].Beekman FJ, de Jong HW, and van Geloven S, “Efficient fully 3-D iterative SPECT reconstruction with Monte Carlo-based scatter compensation,” IEEE Trans Med Imaging, vol. 21, n. (8), p. 867–77, 2002, DOI: 10.1109/TMI.2002.803130. [DOI] [PubMed] [Google Scholar]
- [24].Jong H.W.A.M.d., Slijpen ETP, and Beekman FJ, “Acceleration of Monte Carlo SPECT simulation using convolution-based forced detection,” IEEE Transactions on Nuclear Science, vol. 48, n. (1), p. 58–64, 2001, DOI: 10.1109/23.910833. [DOI] [Google Scholar]
- [25].Wernick MN and Aarsvold JN, Emission Tomography: The Fundamentals of PET and SPECT. 2004: Elsevier Academic Press. [Google Scholar]
- [26].Ogawa K, “Simulation study of triple-energy-window scatter correction in combined Tl-201, Tc-99m SPECT,” Ann Nucl Med, vol. 8, n. (4), p. 277–81, 1994, DOI: 10.1007/BF03165031. [DOI] [PubMed] [Google Scholar]
- [27].Veale MC, Bell SJ, Duarte DD, Schneider A, Seller P, Wilson MD, and Iniewski K, “Measurements of charge sharing in small pixel CdTe detectors,” Nuclear Instruments and Methods in Physics Research Section A: Accelerators, Spectrometers, Detectors and Associated Equipment, vol. 767, n., p. 218–226, 2014, DOI: 10.1016/j.nima.2014.08.036. [DOI] [Google Scholar]
- [28].Zannoni EM, Wilson MD, Bolz K, Goede M, Lauba F, Schöne D, Zhang J, Veale MC, Verhoeven M, and Meng L-J, “Development of a multi-detector readout circuitry for ultrahigh energy resolution single-photon imaging applications,” Nuclear Instruments and Methods in Physics Research Section A: Accelerators, Spectrometers, Detectors and Associated Equipment, vol. 981, n., p. 164531, 2020, DOI: 10.1016/j.nima.2020.164531. [DOI] [PMC free article] [PubMed] [Google Scholar]
- [29].Buttacavoli A, Gerardi G, Principato F, Mirabello M, Cascio D, Raso G, Bettelli M, Zappettini A, Seller P, Veale MC, et al. , “Energy Recovery of Multiple Charge Sharing Events in Room Temperature Semiconductor Pixel Detectors,” Sensors, vol. 21, n. (11), 2021, DOI: 10.3390/s21113669. [DOI] [PMC free article] [PubMed] [Google Scholar]
- [30].Holstensson M, Erlandsson K, Poludniowski G, Ben-Haim S, and Hutton BF, “Model-based correction for scatter and tailing effects in simultaneous 99mTc and 123I imaging for a CdZnTe cardiac SPECT camera,” Phys Med Biol, vol. 60, n. (8), p. 3045–63, 2015, DOI: 10.1088/0031-9155/60/8/3045. [DOI] [PubMed] [Google Scholar]
- [31].Fan P, Hutton BF, Holstensson M, Ljungberg M, Pretorius PH, Prasad R, Ma T, Liu Y, Wang S, Thorn SL, et al. , “Scatter and crosstalk corrections for (99m)Tc/(123)I dual-radionuclide imaging using a CZT SPECT system with pinhole collimators,” Med Phys, vol. 42, n. (12), p. 6895–911, 2015, DOI: 10.1118/1.4934830. [DOI] [PubMed] [Google Scholar]
- [32].Takahashi T and Watanabe S, “Recent progress in CdTe and CdZnTe detectors,” IEEE Transactions on Nuclear Science, vol. 48, n. (4), p. 950–959, 2001, DOI: 10.1109/23.958705. [DOI] [Google Scholar]
- [33].Metzler SD, Bowsher JE, Greer KL, and Jaszczak RJ, “Analytic determination of the pinhole collimator’s point-spread function and RMS resolution with penetration,” IEEE Trans Med Imaging, vol. 21, n. (8), p. 878–87, 2002, DOI: 10.1109/tmi.2002.803129. [DOI] [PubMed] [Google Scholar]
- [34].Meikle SR, Hutton B, Bailey DL, Fulton RR, and Schindhelm K. SPECT scatter correction in non-homogeneous media. in Biennial International Conference on Information Processing in Medical Imaging. 1991. Springer. [Google Scholar]
- [35].Ljungberg M and Strand S-E, “A Monte Carlo program for the simulation of scintillation camera characteristics,” Computer Methods and Programs in Biomedicine, vol. 29, n. (4), p. 257–272, 1989, DOI: 10.1016/0169-2607(89)90111-9. [DOI] [PubMed] [Google Scholar]
- [36].Pretorius PH, Liu C, Fan P, Peterson M, and Ljungberg M, “Monte Carlo Simulations of the GE Discovery Alcyone CZT SPECT Systems,” IEEE Transactions on Nuclear Science, vol. 62, n. (3), p. 832–839, 2015, DOI: 10.1109/TNS.2015.2433533. [DOI] [Google Scholar]
- [37].Feher A, Boutagy NE, Stendahl JC, Hawley C, Guerrera N, Booth CJ, Romito E, Wilson S, Liu C, and Sinusas AJ, “Computed Tomographic Angiography Assessment of Epicardial Coronary Vasoreactivity for Early Detection of Doxorubicin-Induced Cardiotoxicity,” JACC CardioOncol, vol. 2, n. (2), p. 207–219, 2020, DOI: 10.1016/j.jaccao.2020.05.007. [DOI] [PMC free article] [PubMed] [Google Scholar]
- [38].Mohy-Ud-Din H, Boutagy NE, Stendahl JC, Zhuang ZW, Sinusas AJ, and Liu C, “Quantification of intramyocardial blood volume with (99m)Tc-RBC SPECT-CT imaging: A preclinical study,” J Nucl Cardiol, vol. 25, n. (6), p. 2096–2111, 2018, DOI: 10.1007/s12350-017-0970-4. [DOI] [PMC free article] [PubMed] [Google Scholar]


