Abstract
Purpose
Carpal tunnel syndrome (CTS) is a common condition characterized by compression of the median nerve (MN) within the carpal tunnel. Accurate diagnosis and assessment of CTS severity are crucial for appropriate management decisions. This study aimed to investigate the combined diagnostic utility of B-mode ultrasound (US) and shear wave elastography (SWE) for assessing the severity of CTS in comparison to electrodiagnostic tests (EDT).
Materials and Methods
This prospective observational study was conducted over 9-month periods at a tertiary care hospital. A total of 48 patients (36 females, 12 males; mean age 44 ± 10.9 years; age range 28–57 years) with clinically suspected CTS were enrolled. All patients underwent EDT, US, and SWE. Based on the EDT results, CTS cases were categorized into four groups: mild, moderate, severe, and negative. The cross-sectional area (CSA) and elasticity (E) of the MN were measured at the tunnel inlet (CSAu and Eu) and pronator quadratus region (CSAo and Eo). The differences (CSAu-CSAo and Eu-Eo) were calculated. The primary outcomes were the diagnostic performance of CSAu, CSAu-CSAo, Eu, and Eu-Eo in differentiating moderate/severe from mild/negative CTS compared to EDT findings. Secondary outcomes included a correlation of US/SWE parameters with EDT grades and between each other. ANOVA, correlation, regression, and receiver operating characteristic (ROC) curve analyses were performed.
Results
CSAu and CSAu–CSAo increased progressively with worsening CTS severity. E measurements were significantly higher in moderate-to-severe CTS compared to mild or negative cases. The combined metric of CSAu-CSAo at a 5 mm threshold exhibited enhanced performance, with a higher sensitivity (83.3%), specificity (100%), and area under the curve (AUC) (0.98), surpassing the results of CSAu when used independently. Similarly, the SWE measurements indicated that Eu-Eo at a 56.1kPa cutoff achieved an AUC of 0.95, with a sensitivity of 93.3% and specificity of 94.4%, outperforming the metrics for Eu when used alone, which had an AUC of 0.93, with identical sensitivity and specificity values (93.3% and 94.4%, respectively).
Conclusion
The integration of ultrasound, shear wave elastography, and electrodiagnostic tests provides a comprehensive approach to evaluate anatomical and neurological changes and guide management decisions for CTS.
Keywords: carpal tunnel syndrome, median never, ultrasound, shear wave elastography
Introduction
Carpal tunnel syndrome (CTS) is the most common form of peripheral entrapment neuropathy, characterized by compression of the median nerve (MN) within the narrow, rigid carpal tunnel at the wrist.1 This entrapment leads to demyelination and ultimately axonal degeneration, manifesting as numbness, paresthesia, and pain in the lateral three-and-a-half digits innervated by the MN.2 Accurate diagnosis and staging of CTS severity are crucial for optimizing management decisions between conservative and surgical interventions.1 Electrodiagnostic tests (EDT), including nerve conduction studies and electromyography, are the current gold standard for confirming CTS diagnosis and grading severity. However, EDT has notable limitations of being invasive, causing patient discomfort, and relatively costly, time-consuming, and limited availability, especially in resource-constrained settings.3–5 This has driven research into alternative non-invasive diagnostic modalities like ultrasonography (US).
US enables direct visualization of the MN and detection of pathological changes such as nerve swelling, flattening, and increased cross-sectional area (CSA) at standardized locations within the carpal tunnel.6,7 More recently, shear wave elastography (SWE), an ultrasound-based elasticity imaging technique, has demonstrated potential for evaluating CTS. SWE allows quantitative measurement of tissue stiffness or elasticity by tracking the propagation of shear waves generated by the US transducer.8–10 Studies have reported increased MN stiffness or elasticity correlating with CTS severity, as the nerve undergoes biomechanical changes due to compression.10–13 While both US and SWE have shown promise individually in CTS diagnosis, there is a paucity of research investigating their combined diagnostic performance in comprehensively evaluating CTS. Previous studies have explored US and SWE metrics in isolation or made limited comparisons to EDT findings.8,11 However, the complementary strengths of these modalities in assessing different pathological aspects of CTS - anatomical changes by US and biomechanical alterations by SWE - remain limited.13
Integrating these techniques could provide a multi-parametric approach to enhance diagnostic accuracy while avoiding the invasiveness of EDT. Such a multimodal US/SWE strategy has significant potential to improve the clinical management of CTS. For researchers, it could elucidate the synergistic diagnostic value of combining anatomical and biomechanical metrics. For clinicians, it offers a comprehensive, patient-friendly tool to distinguish CTS severities and guide appropriate treatment reliably. Most importantly, it provides patients with an accessible, less invasive option for accurate diagnosis and monitoring of their condition. This prospective study aims to bridge the existing knowledge gap by investigating the combined diagnostic utility of B-mode US and SWE in assessing the severity of CTS, using EDT as the reference standard. By evaluating their complementary performance metrics, this research could establish an optimized multimodal approach to enhance diagnostic accuracy and clinical decision-making in CTS management.
Materials and Methods
Study Design and Setting
This was a prospective observational study conducted at the Zagazig University Hospital in Egypt over 9 months between October 2022 and June 2023. The study received ethical approval from the Institutional Review Board (Approval Number: ZU-9645) on July 7, 2022. The study was performed in accordance with the ethical standards outlined in the 1964 Declaration of Helsinki and its later amendments.
Study Participants
The study initially included 65 patients, each presenting with clinically suspected CTS (symptoms such as pain, numbness, and paresthesias in the MN distribution, which worsened with repetitive activities). Each patient contributed one wrist for examination and the specific ICD-10 code for CTS (G56.0) was used for identification. To ensure the reliability of the findings, specific exclusion criteria were applied. Patients who had previously undergone interventions (n= 4), surgeries (n= 3), or had fractures involving the wrist (n= 8) were excluded. Additionally, patients with anatomical variations, such as a bifid MN or a persistent median artery within the MN (n=2), were also excluded. This exclusion process resulted in a final cohort composed of 48 patients. Each participant underwent a comprehensive evaluation, which included obtaining a detailed medical history, conducting a thorough clinical examination, and performing various diagnostic examinations. These imaging techniques included EDT, B-mode US, and SWE. To maintain consistency and accuracy, we ensured that the time interval between these diagnostic examinations did not exceed 15 days for any patient.
EDT
The EDT was performed using a Neuropack 53 MEB-9600 device (Nihon Kohden, Tokyo, Japan). The detailed techniques included:
- Sensory Nerve Conduction Study:
- Antidromic technique.
- Stimulate the MN at the wrist and record from the proper digital nerve of the thumb.
- Measure peak sensory nerve action potential (SNAP) amplitude (normal >20 μV), onset latency (normal <3.5 ms), and conduction velocity (normal >50 m/s).
- Motor Nerve Conduction Study:
- Record compound muscle action potential (CMAP) from the abductor pollicis brevis (APB) muscle.
- Stimulate the MN at the wrist (distal) and above the elbow (proximal).
- Measure CMAP amplitude (normal >4 mV), distal motor latency (normal <4.2 ms), and conduction velocity (normal >49 m/s).
- Needle Electromyography (EMG):
- Perform needle EMG examination of the APB muscle.
- Assess for the presence of spontaneous activity (fibrillation potentials, positive sharp waves) indicating acute/chronic denervation.
- Assess for the presence of large, polyphasic motor unit action potentials indicating chronic reinnervation.
Based on the EDT results, the patients were classified into four categories of increasing severity:
EDT negative: All test results are normal.
Mild: Only sensory abnormalities.
Moderate: Sensory abnormalities + delayed distal motor latency ± mild chronic neurogenic changes.
Severe: Sensory abnormalities + delayed distal motor latency + low CMAP amplitude + chronic neurogenic changes.
US and SWE
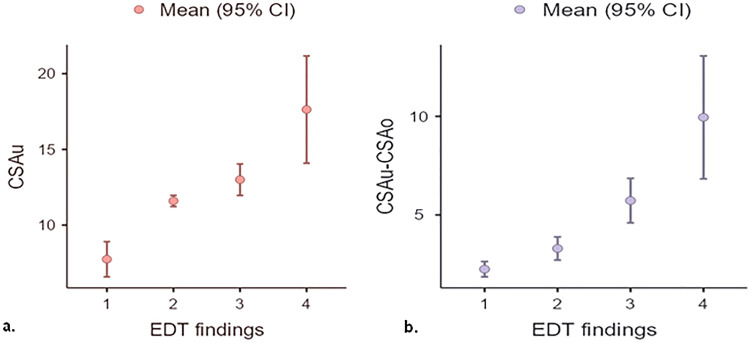
US and SWE examinations were conducted using a Toshiba Aplio 500 US scanner, equipped with a multifrequency 8–14 MHz linear probe. One radiologist with over 10 years of experience in musculoskeletal imaging performed all the examinations. To ensure objectivity, the radiologist was not informed of the patients’ EDT results. During the examination, the patients were positioned facing the radiologist with their elbows flexed and forearm supine. They rested their wrists on a flat surface while keeping their fingers semi-extended. Throughout the elastographic study, the patients were advised to maintain this hand position consistently. The MN CSA was measured using transverse US images. These images were captured at two specific points: the carpal tunnel inlet, identified by the bony landmarks of the scaphoid and pisiform bones, labeled as CSA at the tunnel inlet (CSAu), and at the proximal third of the pronator quadratus muscle, labeled as CSA in the pronator quadratus (CSAo), as illustrated in Figure 1. To determine CSA, we employed a freehand continuous boundary tracing technique. Measurements were meticulously recorded at these defined points, and the difference between the two areas (CSAu–CSAo) was subsequently calculated.
Figure 1.
Plots showing (a) mean CSAu and (b) mean CSAu-CSAo of MN among patients classified by EDT findings.
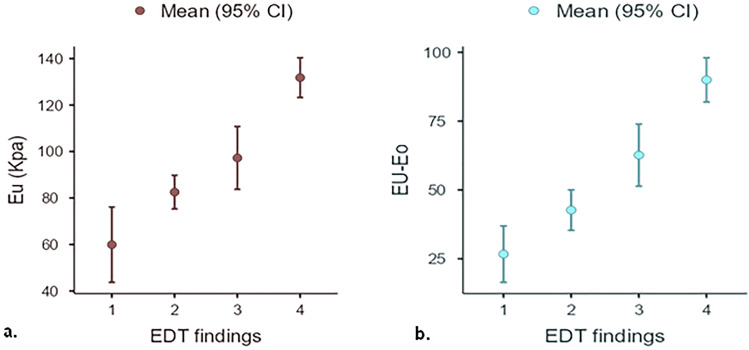
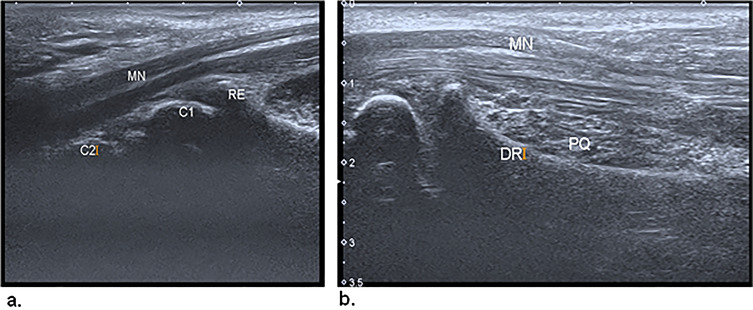
For SWE measurements, abundant US gel was applied to the wrist. Elastographic measurements were obtained in the sagittal plane oriented parallel to the MN. E was measured in two regions: the tunnel inlet (Eu) and the pronator quadratus region (Eo). Bony landmarks, including the radial epiphysis and first and second carpal rows for the carpal tunnel and the volar cortex of the distal radial diaphysis of the pronator quadratus region, were precisely used to identify the locations (Figure 2).
Figure 2.
Plots showing (a) mean Eu and (b) mean Eu-Eo of the MN among patients classified by EDT findings.
The elastograms were displayed by the equipment software in dual mode and superimposed on the grayscale images. To visualize the stiffness of the tissues, an electronic rectangular box was activated to generate a color-coded elastogram. In this color scheme, blue represents areas with the least stiffness, whereas red indicates regions with the highest stiffness, in accordance with the settings of our equipment. In addition, the equipment provided another elastogram that showed the propagation of shear waves. For the accurate measurement of E, circular ROIs were carefully placed over the MN. It is crucial to ensure that the entire ROI is confined to the boundaries of the nerve. Once positioned, the equipment automatically calculated the E value, which was expressed in kilopascals. In the process of measuring E within the carpal tunnel, we selected four distinct ROIs at the tunnel inlet. Similarly, another set of four ROIs was chosen for the pronator zone. The equipment was programmed to automatically calculate and provide the mean and standard deviation (SD) of the E values for each ROI, both at the carpal tunnel inlet and in the pronator zone. To derive comprehensive data, we calculated the average E values from the four ROIs in the carpal tunnel, referred to as the mean Eu. Similarly, we computed the mean E values from the four ROIs in the pronator zone, designated as the mean Eo. The difference in E between the two regions was determined by calculating the difference between Eu and Eo (Eu–Eo).
Sample Size Calculation
The sample size calculation for this study was based on several parameters. These include the desired statistical significance level (α), set at 0.05 for a two-sided test, and the desired statistical power (1-β), set at 0.80. The expected sensitivity and specificity of the combined US and SWE approach were also considered, as well as the prevalence of moderate/severe CTS in the target population. The sample size was calculated based on the findings reported in the reference study by Moran et al.13 Assuming an expected sensitivity of 83.3% and specificity of 100%, and a prevalence of 62.5% for moderate/severe CTS, the calculated sample size would be approximately 48 patients. This sample size estimation is based on a formula for sample size calculation for diagnostic accuracy studies, such as the one proposed by Obuchowski.14
Statistical Analysis
The data collected in this study were systematically entered into a computer for statistical analysis. We utilized IBM SPSS 23.0 for Windows (SPSS Inc., Chicago, IL, USA) and the Jamovi project (2022) (Version 2.3) as our primary analytical tools. For the representation of qualitative data, we used numbers and percentages (n, %). Quantitative data were initially tested for normality using the Shapiro–Wilk test. Based on this test, normally distributed data were reported as mean ± SD, while skewed data were presented as median (range). In terms of inferential statistics, we set the significance level at P > 0.05 for non-significant results and P ≤ 0.05 for significant results. For analyzing normally distributed quantitative data, the ANOVA test was applied. For skewed data, the Mann–Whitney and Kruskal–Wallis tests were used. Pearson’s correlation coefficient was employed to assess the relationship between two continuous variables. Spearman’s rank correlation coefficient was utilized to evaluate the correlation between EDT grades and US measurements. We also conducted simple linear regression to explore the relationship between the CSA and SWE measurements. Finally, the receiver operating characteristic (ROC) curve analysis was used to differentiate between the two proposed diagnostic groups: negative/mild and moderate/severe.
Results
Study Participants
The study encompassed a total of 48 patients who were clinically suspected of having CTS. The ages of these patients ranged from 28 to 57 years, with a mean age of 44 ± 10.9 years. In terms of gender distribution among the participants, the majority (75%) were female, while 25% were male. Regarding occupational distribution, most patients had occupations involving repetitive hand and wrist movements, including line work (n=12), computer/desk work (n=13), construction (n=15), and healthcare professions (n=8). In terms of comorbidities, 11 patients were obese (body mass index above 30), 8 patients had diabetes mellitus, and 2 patients had hypothyroidism.
EDT Findings
EDT, specifically electroneurography, confirmed CTS in 40 out of the 48 hands (83.3%). Based on the EDT results, the CTS cases were categorized into four groups: mild (10 hands, 20.8%), moderate (11 hands, 22.9%), severe (19 hands, 39.6%), and negative (8 hands, 16.7%). Thirty hands (62.5%) were diagnosed with either moderate or severe CTS and were thus considered suitable candidates for surgical intervention. The remaining 18 hands (37.5%) were either diagnosed with mild CTS or were negative for the condition, leading to referral for non-surgical rehabilitation.
US and SWE Findings
Table 1 highlights a significant difference in the CSA measurements of the MN among the patients when categorized according to their EDT results (P <0.001). Notably, there was a gradual increase in CSA corresponding to varying grades of EDT severity. Tables 2a and b reveal significant differences in CSA measurements at the carpal tunnel inlet (CSAu) between the various groups. A significant difference was observed in the CSAu measurements when comparing the severe group with both the mild and negative groups. Similar significant differences were noted between the moderate and negative groups and between the mild and negative groups. However, no significant differences were found when comparing the severe and moderate groups or the moderate and mild groups. Additionally, when evaluating the difference between CSA measurements at the carpal tunnel inlet and at the pronator quadratus (CSAu-CSAo), a statistically significant difference was found specifically between the moderate and mild groups. Table 3 demonstrates a significant correlation between the EDT grades and E measurements, revealing that higher EDT grades were associated with increased E measurements. In Tables 4a and b, the data revealed statistically significant differences in E measurements when comparing the severe group to the moderate, mild, and negative groups for both Eu and Eu-Eo. Furthermore, the Eu-Eo measurements also displayed a statistically significant variation between the moderate and mild groups.
Table 1.
Measurements of CSA of MN Among Studied Groups
| Groups | P-value* | ||||
|---|---|---|---|---|---|
| Negative (n=8) | Mild (n=10) | Moderate (n=11) | Severe (n=19) | ||
| CSAu | 7.75±1.39 | 11.6±0.52 | 13±1.55 | 17.6±7.35 | <0.001 |
| CSAo | 5.5±0.93 | 8.3±0.94 | 7.3±1 | 7.7±1.7 | <0.001 |
| CSAu-CSAo | 2.25±0.5 | 3.3±0.8 | 5.7±1.7 | 9.9±6.5 | <0.001 |
Notes: Values represent mean ± SD; SD, standard deviation; *ANOVA test.
Abbreviations: CSA, cross-sectional area; CSAo, cross-sectional area in the pronator quadratus; CSAu, cross-sectional area at the tunnel inlet; MN, median nerve.
Table 2.
Post-Hoc Analysis of CSA Measurements Among Studied Groups
| a. CSAu | Severe | Moderate | Mild | Negative | |
|---|---|---|---|---|---|
| Severe | Mean difference | — | 4.63 | 6.03 | 9.88 |
| P-value | — | 0.098 | 0.016 | <.001 | |
| Moderate | Mean difference | — | 1.40 | 5.25 | |
| P-value | — | 0.089 | <.001 | ||
| Mild | Mean difference | — | 3.85 | ||
| P-value | — | <.001 | |||
| Negative | Mean difference | — | |||
| P-value | — | ||||
| b. CSAu-CSAo | Severe | Moderate | Mild | Negative | |
| Severe | Mean difference | — | 4.22 | 6.65 | 7.70 |
| P-value | — | 0.088 | 0.002 | <.001 | |
| Moderate | Mean difference | — | 2.43 | 3.48 | |
| P-value | — | 0.005 | <.001 | ||
| Mild | Mean difference | — | 1.05 | ||
| P-value | — | 0.028 | |||
| Negative | Mean difference | — | |||
Abbreviations: CSA, cross-sectional area; CSAo, cross-sectional area in the pronator quadratus; CSAu, cross-sectional area at the tunnel inlet.
Table 3.
Measurements of E of MN Among Studied Groups
| Groups | P-value* | ||||
|---|---|---|---|---|---|
| Negative (n=8) | Mild (n=10) | Moderate (n=11) | Severe (n=19) | ||
| Eu | 59.9±19.37 | 85.5±10.1 | 97.3±20.1 | 131.8±17.8 | <0.001 |
| Eo | 33.2±8.8 | 39.9±10 | 34.6±8.9 | 41.8±9.8 | 0.05 |
| Eu-Eo | 26.7±12.2 | 42.7±10.3 | 62.6±16.8 | 90±16.7 | <0.001 |
Notes: Values represent the mean ± SD; SD, standard deviation; *ANOVA test.
Abbreviations: E, elasticity; Eo, elasticity in the pronator quadratus; Eu, elasticity at the tunnel inlet; MN, median nerve.
Table 4.
Post-Hoc Analysis of E Measurements Among Studied Groups
| a. Eu | Severe | Moderate | Mild | Negative | |
|---|---|---|---|---|---|
| Severe | Mean difference | — | 34.5 | 49.3 | 71.9 |
| P-value | — | 0.001 | <.001 | <.001 | |
| Moderate | Mean difference | — | 14.7 | 37.3 | |
| P-value | — | 0.252 | 0.007 | ||
| Mild | Mean difference | — | 22.6 | ||
| P-value | — | 0.079 | |||
| Negative | Mean difference | — | |||
| P-value | — | ||||
| b. Eu-Eo | Severe | Moderate | Mild | Negative | |
| Severe | Mean difference | — | 27.3 | 47.3 | 63.3 |
| P-value | — | 0.003 | <.001 | <.001 | |
| Moderate | Mean difference | — | 20.0 | 35.9 | |
| P-value | — | 0.029 | <.001 | ||
| Mild | Mean difference | — | 16.0 | ||
| P-value | — | 0.068 | |||
| Negative | Mean difference | — | |||
| P-value | — | ||||
Abbreviations: E, elasticity; Eo, elasticity in the pronator quadratus; Eu, elasticity at the tunnel inlet.
ROC Curve Analysis
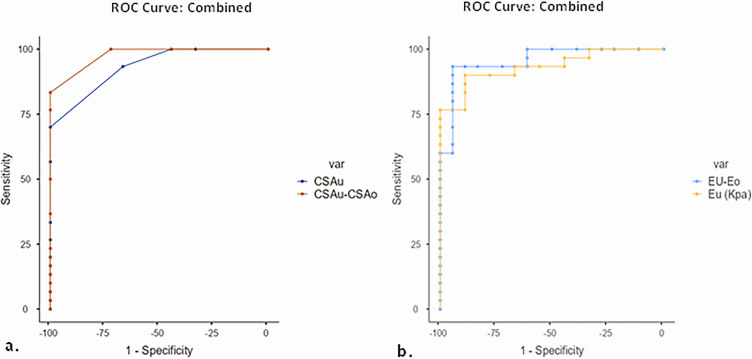
To identify the most effective cutoff value for distinguishing the two proposed groups, an analysis using the ROC curve was conducted (Figure 3). The combined metric of CSAu-CSAo at a 5 mm threshold exhibited enhanced performance, with a higher sensitivity (83.3%), specificity (100%), and area under the curve (AUC) of 0.98, surpassing the results of CSAu when used independently. Similarly, the SWE measurements indicated that Eu-Eo at a 56.1kPa cutoff achieved an AUC of 0.95, with a sensitivity of 93.3% and specificity of 94.4%, outperforming the metrics for Eu when used alone, which had an AUC of 0.93, with identical sensitivity and specificity values (93.3% and 94.4%, respectively) (Table 5).
Figure 3.
ROC curve of US measurements to discriminate between patients with severe/moderate CTS and those with mild/no CTS. (a) ROC curve for the CSAu-CSAo measurement. (b) ROC curve for the Eu-Eo measurement.
Table 5.
Validity Data of US Findings to Discriminate Between Patients with Severe/Moderate CTS and Those with Mild/No CTS
| Cut off | Sensitivity | Specificity | PPV | NPV | AUC | |
|---|---|---|---|---|---|---|
| CSAu | 13 mm | 70% | 100% | 100% | 66.67% | 0.93 |
| CSAu-CSAo | 5 mm | 83.3% | 100% | 100% | 78.3% | 0.98 |
| Eu | 94 kpa | 90% | 88.9% | 93.1% | 84.2% | 0.93 |
| Eu-Eo | 56.1 kpa | 93.3% | 94.4% | 96.5% | 89.5% | 0.95 |
Abbreviations: CSA, cross-sectional area; CSAo, cross-sectional area in the pronator quadratus; CSAu, cross-sectional area at the tunnel inlet; CTS, carpal tunnel syndrome; E, elasticity; Eo, elasticity in the pronator quadratus; Eu, elasticity at the tunnel inlet; US, ultrasound.
Logistic Regression Analysis
Logistic regression analysis was performed using the CSAu-CSAo measurement at a 5 mm2 threshold and the Eu-Eo measurement at a 56.1 kPa threshold as predictors. This model demonstrated excellent diagnostic performance, with an AUC of 0.99, sensitivity of 94%, and specificity of 100% (Table 6).
Table 6.
Logistic Regression of the Cutoff Points of E and CSA of the MN with the Two Proposed Groups of Patients with CTS
| Eu-Eo and CSAu-CSAo cutoff points | ||||
|---|---|---|---|---|
| ≥5 mm2 | ≥5 mm2 | <5 mm2 | <5 mm2 | |
| ≥56.1 Kpa | <56.1Kpa | ≥56.1 kpa | <56.1 Kpa | |
| Negative and mild (n=18) | 0 (0%) | 1 (5.6%) | 0 (0%) | 17 (94.4%) |
| Moderate and Severe (n=30) | 23 (76.7) | 5 (16.7%) | 2 (6.7%) | 0 (0%) |
Notes: Data are presented as the number of patients, with percentages in parentheses.
Abbreviations: CSA, cross-sectional area; CSAo, cross-sectional area in the pronator quadratus; CSAu, cross-sectional area at the tunnel inlet; CTS, carpal tunnel syndrome; E, elasticity; Eo, elasticity in the pronator quadratus; Eu, elasticity at the tunnel inlet; MN, median nerve.
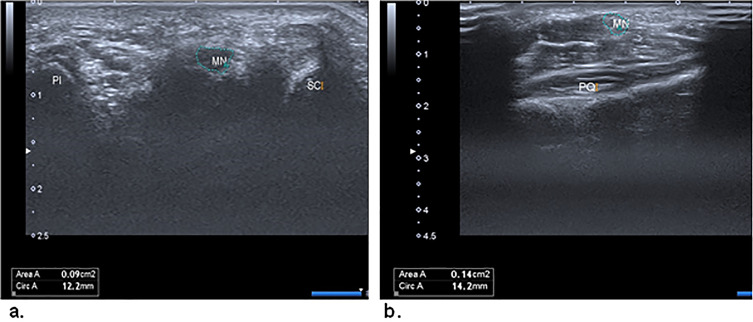
Figures 4 and 5 show representative cases from our study.
Figure 4.
(a) Transverse US image of the median nerve (MN) at the carpal tunnel inlet. The landmarks are the scaphoid (SC) and pisiform (PI). (b) Transverse US image of the MN at the proximal third of the pronator quadratus (PQ).
Figure 5.
(a) Sagittal US image of the median nerve (MN) in the carpal tunnel. The transducer is parallel to the nerve, and the landmarks are the distal radial epiphysis (RE) and the first (C1) and second (C2) carpal rows. (b) Sagittal US image of the MN in the pronator quadratus (PQ).
Discussion
The current study revealed a statistically significant variation in the cross-sectional area (CSA) measurements of the median nerve (MN) among patients with different carpal tunnel syndrome (CTS) severity categories as determined by electrodiagnostic tests (EDT) (P < 0.001). CSA measurements increased progressively across the severity categories. This finding is consistent with a study by Klauser et al,15 where distinct CSA measurements were observed in patients with mild, moderate, and severe CTS categorized based on nerve conduction studies. In our study, the mean delta CSA (the difference between MN CSA at the level of the carpal tunnel and the pronator quadratus muscle) was 4.2 ± 2.6 mm², 6.95 ± 2.2 mm², and 10.7 ± 4.9 mm² for mild, moderate, and severe CTS groups, respectively, and the differences were significant between all groups (P < 0.001). Similarly, Moran et al13 reported a progressive increase in the MN area (CSAu and CSAu-CSAo) with CTS severity as determined by EDT, ranging from negative to severe cases. Kantarci et al11 also demonstrated significantly increased MN stiffness measured by shear wave elastography (SWE) in CTS patients compared to healthy controls, even in mild CTS. A recent systematic review and meta-analysis by Asghar et al16 reported a mean normative value of 9.1 ± 1.8 mm² for CSA at the carpal tunnel inlet. Our study demonstrated a progressive increase in CSA from the negative/mild CTS group to the moderate/severe CTS groups, with the severe CTS group exhibiting a mean CSA of 15.8 ± 4.5 mm² at the carpal tunnel inlet, which aligns with the normative CSA data from the meta-analysis and supports the utility of this parameter in differentiating CTS severity stages.
In our study, 48 patients with suspected CTS were enrolled, with the majority (75%) being female, consistent with the higher incidence of CTS in females reported by Moran et al13 and Arslan et al.17
Regarding the diagnostic thresholds, the optimal threshold value for the Eu-Eo stiffness ratio using SWE was 56.1 kPa for differentiating mild from moderate CTS groups, with a sensitivity of 93.3% and specificity of 94.4%. These results are in line with the findings of Arslan et al,17 who identified a cutoff value of 57 kPa for Eu-Eo, achieving a specificity of 89.6% for distinguishing between mild and moderate CTS. However, Wee et al18 established a higher cutoff point of 84 kPa, which could be attributed to the inclusion of slightly older patients in their study, potentially influencing the measured stiffness values. The optimal cutoff values for CSAu and CSAu-CSAo in our study to distinguish between mild and moderate CTS stages were 13 mm² and 5 mm², respectively. The sensitivity and specificity were 70% and 100%, respectively, for CSAu, and 83.3% and 100%, respectively, for CSAu-CSAo. These findings are consistent with those reported by Klauser et al,15 who identified a cutoff value of 6 mm² for delta CSA to differentiate mild from moderate CTS. Additionally, our results align with those of Moran et al,13 who suggested a similar cutoff value of 14 mm² for CSAu measured by ultrasound.
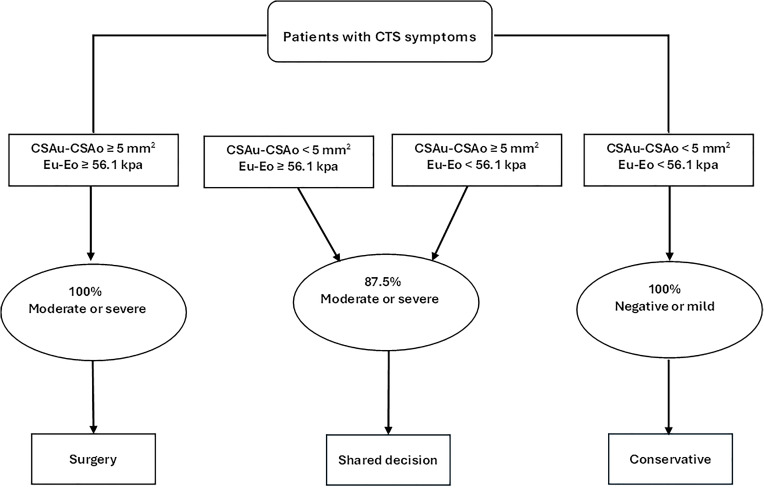
Statistically significant differences were observed in the stiffness measurements (Eu and Eu-Eo) when comparing severe CTS cases with moderate, mild, and negative cases. Furthermore, significant differences in Eu-Eo were noted between the moderate and mild groups. These findings are consistent with those of Arslan et al,17 who reported elevated Eu-Eo in patients with moderate and severe EDT findings compared to those with mild and negative results. Thus, when both US and SWE measurements exceed the established cutoff points in clinical practice, the findings consistently correspond to moderate or severe CTS, as per the EDT results. Conversely, when both the area and stiffness of the nerve fall below the cutoff points, the findings invariably indicate negative or mild CTS according to the EDT results.
Based on our findings, we proposed a decision algorithm (Figure 6) to guide the treatment of patients with suspected CTS. The algorithm aims to provide a practical approach for identifying patients who would benefit from rehabilitation alone and those who may require surgery. The protocol involves initial US and SWE measurements, and if both CSAu-CSAo and Eu-Eo measurements are above 5 mm² and 56.1 kPa, respectively, moderate or severe CTS would be suspected, indicating the need for surgery. In cases where a single measurement is above the cutoff value while the other falls below it, further evaluation is recommended. In such instances, the decision to proceed with surgery or conservative treatment should be based on clinical judgment, considering factors such as symptom severity, functional impairment, and patient preference. It is important to note that this proposed algorithm should be validated in larger prospective studies to assess its accuracy and generalizability.
Figure 6.
Algorithm proposed for the therapeutic decisions of patients with clinically suspected CTS.
In summary, our study showed that US and SWE measurements are closely associated with the severity of CTS as determined by EDT. These imaging modalities provide complementary information about CTS. The findings indicate that US and SWE are complementary to EDT, rather than replacing it. EDT offers insights into the underlying pathophysiology of CTS, while US evaluation provides anatomical details of the carpal tunnel. Integrating the data from both modalities can help clinicians make informed treatment decisions. Further research should focus on optimizing the combined use of EDT and US to enhance the management and long-term outcomes for CTS patients.
The study acknowledged several limitations. First, the operator-dependent nature of US techniques, as accurate US imaging requires skilled and experienced radiologists to minimize the risk of misinterpretation and reduce false-positive and false-negative results. Second, the relatively small number of participants involved in our study. This was primarily due to the constraints imposed by the limited duration of the study, which restricted our ability to include a larger sample size. These factors should be considered when interpreting the results and conclusions of the present study. While the results are promising, extrapolating broad clinical recommendations from this modest sample may not be appropriate, and larger multicenter studies with greater sample sizes are needed to validate and strengthen the findings before widespread implementation of the proposed decision algorithm. Additionally, the study relies upon EDT as the reference standard for determining CTS severity, despite the limitations of EDT, such as being invasive and causing patient discomfort. Furthermore, the study included only patients with clinically suspected CTS, which may have introduced a selection bias and may not represent the full spectrum of CTS severity in the general population. Finally, the lack of long-term follow-up of the patients is a limitation, as it could have provided valuable information on the clinical outcomes and the sustained utility of the proposed diagnostic approach.
Conclusions
The results of this study demonstrate that the concurrent use of ultrasound imaging and shear wave elastography, in conjunction with electrodiagnostic tests, provides a comprehensive diagnostic approach for patients with suspected carpal tunnel syndrome. This multimodal strategy can accurately characterize the anatomical changes and nerve dysfunction associated with varying severities of carpal tunnel syndrome, without the risk of overestimation that may occur with reliance on a single modality. However, further large-scale validation is needed to establish the optimal integration of these modalities and their long-term impact on patient outcomes.
Acknowledgments
The authors are thankful to the Deanship of Scientific Research at Najran University for funding this work under the Research Groups Funding program (Grant code: NU/RG/MRC/12/1).
Funding Statement
This research was funded by the Deanship of Scientific Research, Najran University, Kingdom of Saudi Arabia (grant code: NU/RG/MRC/12/1).
Institutional Review Board Statement
This study was approved by the Institutional Review Board of Zagazig University Hospitals in Egypt (Approval No: ZU-9645; approved on 07 July 2022).
Informed Consent Statement
Informed consent was obtained from all the participants.
Data Sharing Statement
The clinical and imaging datasets used and/or analyzed during the current study are available from the corresponding author upon reasonable request.
Disclosure
The authors declare no relevant conflicts of interest and no relationships with any companies whose products or services may be related to the subject matter of this article.
References
- 1.Tulipan JE, Ilyas AM. Carpal Tunnel Syndrome Surgery: what You Should Know. Plast Reconstr Surg Glob Open. 2020;8(3):e2692. doi: 10.1097/GOX.0000000000002692 [DOI] [PMC free article] [PubMed] [Google Scholar]
- 2.Joshi A, Patel K, Mohamed A, et al. Carpal tunnel syndrome: pathophysiology and comprehensive guidelines for clinical evaluation and treatment. Cureus. 2022;14(7):1. [DOI] [PMC free article] [PubMed] [Google Scholar]
- 3.Carlson H, Colbert A, Frydl J, Arnall E, Elliot M, Carlson N. Current options for nonsurgical management of carpal tunnel syndrome. Int J Clin Rheumatol. 2010;5(1):129–142. doi: 10.2217/ijr.09.63 [DOI] [PMC free article] [PubMed] [Google Scholar]
- 4.Fowler JR, Munsch M, Tosti R, Hagberg WC, Imbriglia JE. Comparison of ultrasound and electrodiagnostic testing for diagnosis of carpal tunnel syndrome: study using a validated clinical tool as the reference standard. J Bone Joint Surg Am. 2014;96(17):e148. doi: 10.2106/JBJS.M.01250 [DOI] [PubMed] [Google Scholar]
- 5.Zaki HA, Shaban E, Salem W, et al. A comparative analysis between ultrasound and electromyographic and nerve conduction studies in diagnosing carpal tunnel syndrome (CTS): a systematic review and meta-analysis. Cureus. 2022;14(10):e30476. doi: 10.7759/cureus.30476 [DOI] [PMC free article] [PubMed] [Google Scholar]
- 6.Perţea M, Ursu S, Veliceasa B, Grosu OM, Velenciuc N, Luncă S. Value of ultrasonography in the diagnosis of carpal tunnel syndrome-a new ultrasonographic index in carpal tunnel syndrome diagnosis: a clinical study. Medicine. 2020;99(29):e20903. doi: 10.1097/MD.0000000000020903 [DOI] [PMC free article] [PubMed] [Google Scholar]
- 7.Ratasvuori M, Sormaala M, Kinnunen A, Lindfors N. Ultrasonography for the diagnosis of carpal tunnel syndrome: correlation of clinical symptoms, cross-sectional areas and electroneuromyography. J Hand Surg Eur. 2022;47(4):369–374. doi: 10.1177/17531934211059808 [DOI] [PubMed] [Google Scholar]
- 8.Park EJ, Hahn S, Yi J, Shin KJ, Lee Y, Lee HJ. Comparison of the diagnostic performance of strain elastography and shear wave elastography for the diagnosis of carpal tunnel syndrome. J Ultrasound Med. 2021;40(5):1011–1021. doi: 10.1002/jum.15478 [DOI] [PubMed] [Google Scholar]
- 9.Mohammadi A, Afshar A, Mirza-Aghazadeh-Attari M, Mokhtari SAS. Application of shear wave elastography and median nerve cross-section area in the diagnosis and staging of carpal tunnel syndrome: a case-control study. Pol J Radiol. 2021;86:e638–e643. [DOI] [PMC free article] [PubMed] [Google Scholar]
- 10.Sernik RA, Pereira RFB, Cerri GG, Damasceno RS, Bastos BB, Leão RV. Shear wave elastography is a valuable tool for diagnosing and grading carpal tunnel syndrome. Skeletal Radiol. 2023;52(1):67–72. doi: 10.1007/s00256-022-04143-0 [DOI] [PubMed] [Google Scholar]
- 11.Kantarci F, Ustabasioglu FE, Delil S, et al. Median nerve stiffness measurement by shear wave elastography: a potential sonographic method in the diagnosis of carpal tunnel syndrome. Eur Radiol. 2014;24(2):434–440. doi: 10.1007/s00330-013-3023-7 [DOI] [PubMed] [Google Scholar]
- 12.Wu H, Yang K, Chang X, et al. Evaluation of the transverse carpal ligament in carpal tunnel syndrome by shear wave elastography: a non-invasive approach of diagnosis and management. Front Neurol. 2022;13:901104. doi: 10.3389/fneur.2022.901104 [DOI] [PMC free article] [PubMed] [Google Scholar]
- 13.Moran L, Royuela A, de Vargas AP, Lopez A, Cepeda Y, Martinelli G. Carpal tunnel syndrome: diagnostic usefulness of ultrasound measurement of the median nerve area and quantitative elastographic measurement of the median nerve stiffness. J Ultrasound Med. 2020;39(2):331–339. doi: 10.1002/jum.15111 [DOI] [PubMed] [Google Scholar]
- 14.Obuchowski NA. Sample size calculations in studies of test accuracy. Stat Methods Med Res. 1998;7(4):371–392. doi: 10.1177/096228029800700405 [DOI] [PubMed] [Google Scholar]
- 15.Klauser AS, Abd Ellah MM, Halpern EJ, et al. Sonographic cross-sectional area measurement in carpal tunnel syndrome patients: can delta and ratio calculations predict severity compared to nerve conduction studies? Eur Radiol. 2015;25(8):2419–2427. doi: 10.1007/s00330-015-3649-8 [DOI] [PubMed] [Google Scholar]
- 16.Asghar A, Naaz S, Ansari S, Kumar A, Singh V. The cross-sectional morphology of median nerve in carpal tunnel of healthy, adult population: a systematic review and meta-analysis. Morphologie. 2023;107(356):99–115. doi: 10.1016/j.morpho.2022.05.005 [DOI] [PubMed] [Google Scholar]
- 17.Arslan H, Yavuz A, Ilgen F, et al. The efficiency of acoustic radiation force impulse (ARFI) elastography in the diagnosis and staging of carpal tunnel syndrome. J Med Ultrason. 2018;45:453–459. doi: 10.1007/s10396-017-0857-7 [DOI] [PubMed] [Google Scholar]
- 18.Wee TC, Simon NG. Shearwave elastography in the differentiation of carpal tunnel syndrome severity. Pm&r. 2020;12(11):1134–1139. doi: 10.1002/pmrj.12334 [DOI] [PubMed] [Google Scholar]


