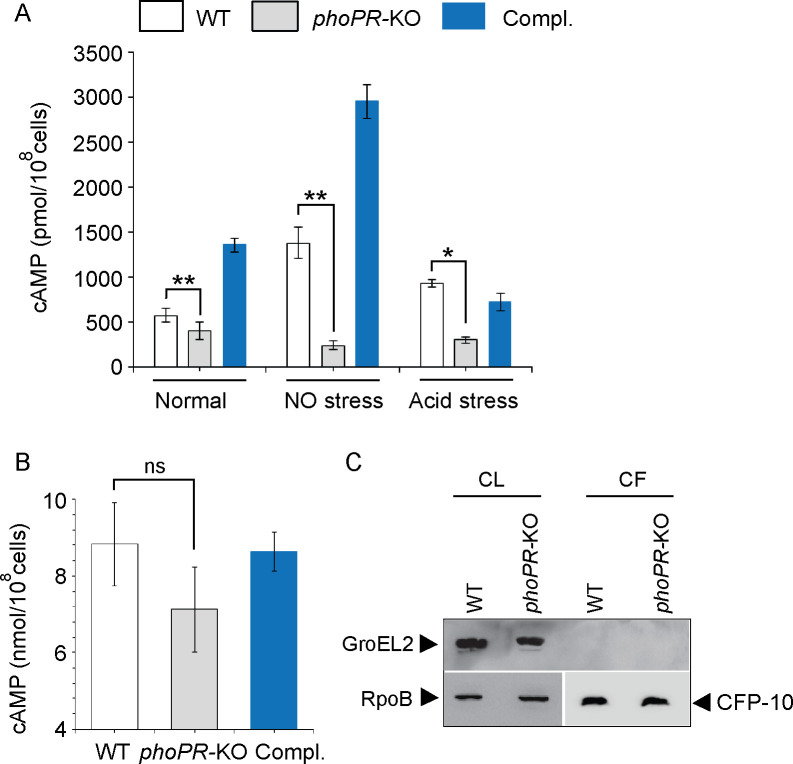
Figure 1. PhoP contributes to the maintenance of mycobacterial 3′,5-cyclic adenosine monophosphate (cAMP) level.
(A) Intra-mycobacterial cAMP levels were determined by a fluorescence-based assay as described in ‘Materials and methods’, and compared for indicated mycobacterial strains, grown under normal or specific stress conditions. For acid stress, mycobacterial strains were initially grown to the mid-log phase (OD600 0.4–0.6), and then transferred to acidic pH (7H9 media, pH 4.5) for further 2 hr of growth at 37°C. For NO stress, cells grown to the mid-log phase were exposed to 0.5 mM DetaNonoate for 40 min. The data represent average values from three biological repeats (*p≤0.05, **p≤0.01). (B) To compare the secretion of cAMP by WT and phoPR-KO, cAMP levels were also determined in the corresponding culture filtrates (CF) (ns., non- significant). (C) Immunoblotting analysis of 10 µg of cell lysates (CL) and 20 µg of CF of indicated M. tuberculosis strains. α-GroEL2 was used as a control to verify cytolysis of cells, CFP-10 detected as a secreted mycobacterial protein in the CFs, and RpoB used as the loading control.


