Abstract
Adult liver malignancies, including intrahepatic cholangiocarcinoma and hepatocellular carcinoma, are the 2nd leading cause of cancer-related death worldwide. Most patients are treated with either combination chemotherapy or immunotherapy, respectively, without specific biomarkers for patient selection. Here, using high-throughput screens, proteomics, and in vitro resistance models, we identify the small molecule, YC-1, as selectively active against a defined subset of cell lines derived from both liver cancer types. We demonstrate that selectivity is determined by expression of the liver resident cytosolic sulfotransferase enzyme, SULT1A1, which sulfonates YC-1. Sulfonation stimulates covalent binding of YC-1 to lysine residues in protein targets, enriching for RNA binding factors. Computational analysis defined a wider group of structurally related SULT1A1-activated small molecules with distinct target profiles, which together constitute an untapped small molecule class. These studies provide a foundation for pre-clinical development of these agents and point to the broader potential of exploiting SULT1A1 activity for selective targeting strategies.
Keywords: hepatocellular carcinoma, cholangiocarcinoma, biology-based drug discovery, SULT1A1, chemical proteomics
INTRODUCTION
Liver cancer is one of the greatest challenges in oncology, with an annual worldwide burden of >800,000 new diagnoses and >700,000 deaths, and an incidence rate that has been rising for several decades1, 2. The main types of primary adult liver malignancy are intrahepatic cholangiocarcinomas (ICCs) and hepatocellular carcinomas (HCCs), classified by morphological and molecular similarity to bile duct cells and hepatocytes, respectively. The standard treatments in the advanced setting are combination chemotherapy for ICC3 and combined immunotherapy/multi-kinase inhibition for HCC4. While response rates and overall survival have improved, outcomes remain poor, and no molecular stratification is used to guide first-line treatment decisions.
The identification of genomic alterations across different subsets of liver cancer patients has led to the recent exploration of precision medicine strategies. In ICC, targeted therapies against Isocitrate Dehydrogenase 1 (IDH1) mutations, Fibroblast Growth Factor Receptor 2 (FGFR2) fusions, and BRAF mutations show benefit3. However, response rates remain relatively low and disease progression inevitably occurs. Moreover, > half of patients with ICC lack presently actionable mutations. Likewise, a subset of patients with HCC have genomic alterations suggesting response to targeted therapies, although it is not clear whether these approaches represent improvements over standard of care4. Thus, complementary exploration of combination or alternative treatment modalities is warranted.
While ICC and HCC have different genetic and clinicopathological features, there may be opportunities to harness overlaps in biology relating to liver cell lineage states. In particular, the presence of mixed histological subtypes and the expression of common lineage markers suggest that liver tumors may comprise a continuous spectrum between hepatocyte-like and bile duct-like phenotypes5–9, observations consistent with the capacity of hepatocytes and bile duct cells to transdifferentiate via bipotential intermediates10, 11.
Here, by conducting high-throughput pharmacologic screens, functional studies, and proteomics analysis, we defined synthetic lethal interactions with the small molecule, YC-1 (lificiguat) in specific liver cancer subsets. We showed that YC-1 is metabolically activated by the hepatocyte lineage cytosolic phenol sulfotransferase, SULT1A1, which is highly expressed in significant subset of HCCs and in ICCs with dual hepatocyte/bile duct features. SULT1A1 converts YC-1 to a strong alkylator with a target profile enriched for RNA binding proteins. Subsequent pharmacogenomic analysis, secondary screens and molecular modeling revealed a broader class of SULT1A1-dependent anticancer compounds with a common chemical motif. These studies suggest opportunities to harness this class of activatable alkylators against SULT1A1+ liver cancers of different genotypes.
RESULTS
YC-1 is selectively active against liver cancer cells
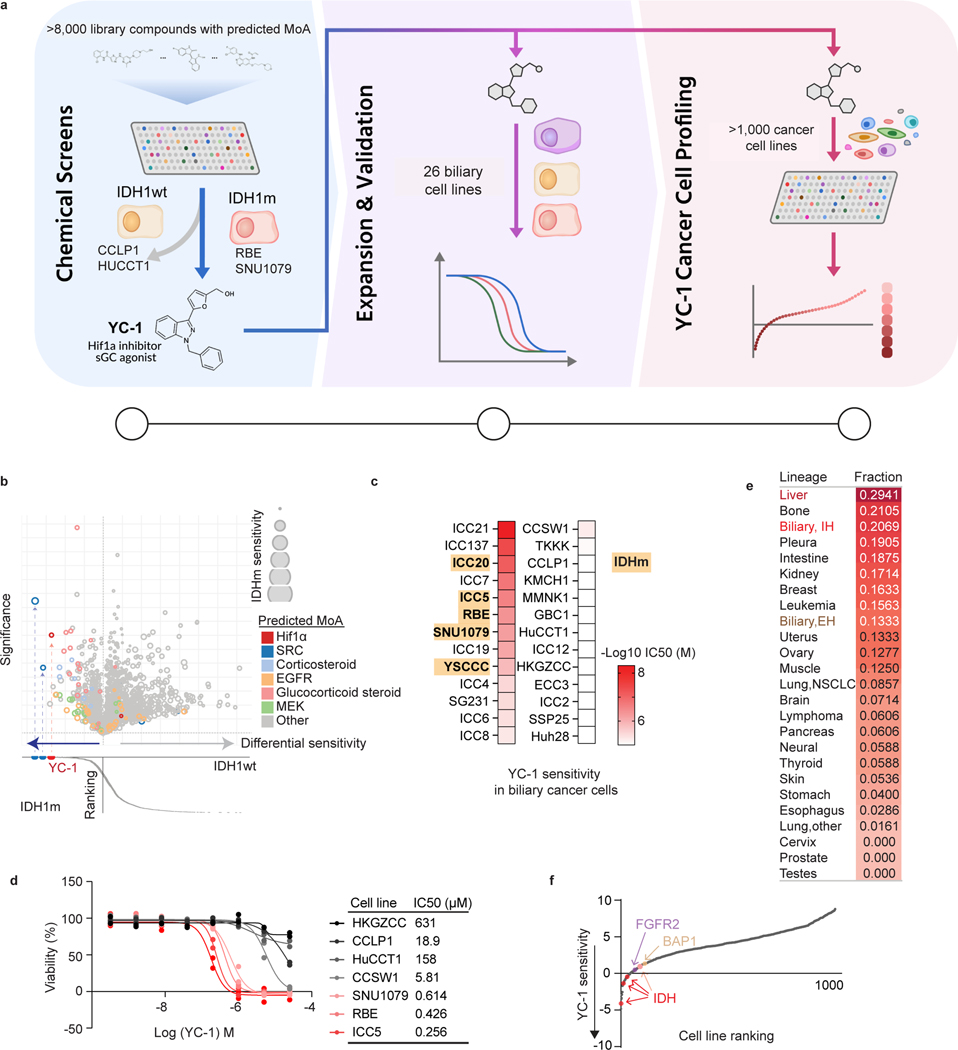
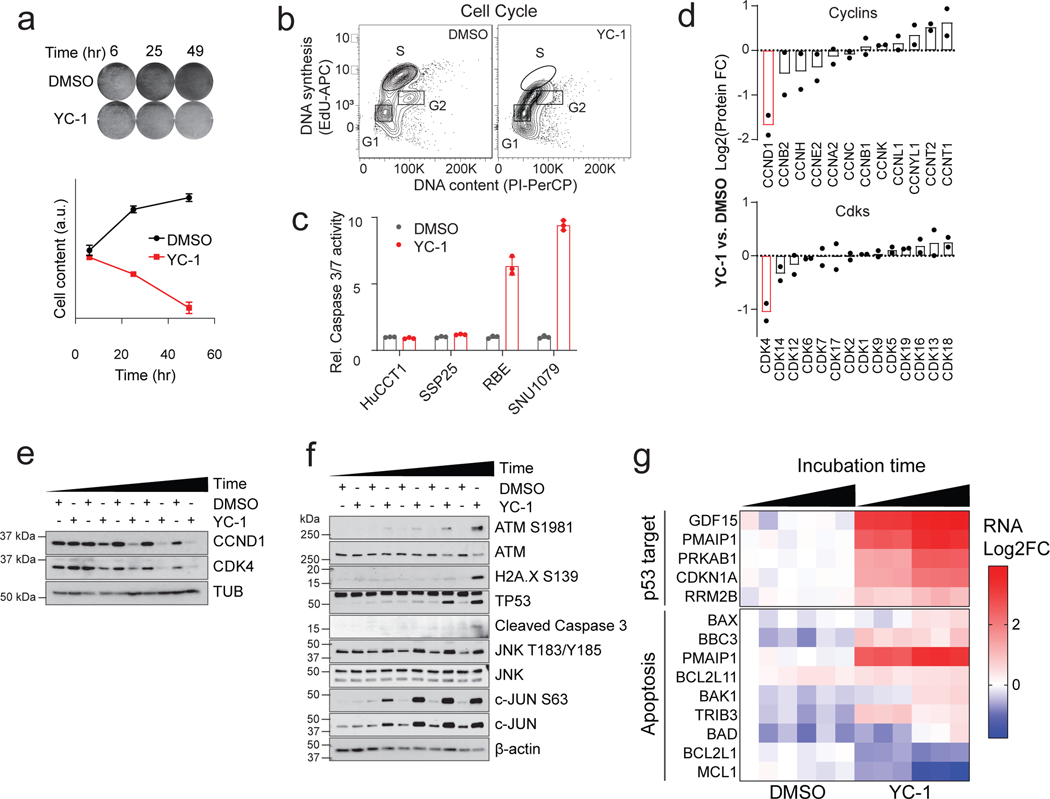
We initially sought to identify synthetic lethal therapeutic interactions in IDH1 mutant (IDHm) ICC by conducting a screen on two IDHm (RBE and SNU1079) and two IDH WT (CCLP1 and HUCCT1) ICC cell lines against the National Center for Advancing Translational Sciences (NCATS) Mechanism Interrogation PlatE (MIPE)12, consisting of 1912 oncology-focused compounds including those with a predicted mode of action as well as those without established targets (Fig. 1a and Supplementary Table 1). We also screened three of these lines against the NCATS Pharmacologically Active Chemical Toolbox (NPACT)13, and Kinase Targeting libraries, totaling an additional 6076 annotated clinical and preclinical compounds. Comparing ranked differential sensitivity scores (area under the curve, AUC) between IDHm and IDH WT groups, we identified 36 compounds (1.9% of MIPE library) that were selectively active against IDHm ICC cells (Fig. 1b; Z < −1.65, p < 0.05), of which 14 (39%) had well defined mechanisms of action. The most significant outliers against IDHm ICC were SRC family kinase (SFK) inhibitors and 3-(5’-hydroxymethyl-2’-furyl)-1-benzylindazole (or YC-1, Fig. 1b). We previously reported characterization of the sensitivity of IDHm ICC to SFK inhibitors based on a prior screen14 and hence focused on YC-1 for further analysis. Scaled up experiments demonstrated that YC-1 selectively induced apoptosis marked by activation of p53 and caspase 3/7, which was preceded by cell cycle arrest at the G1/S phase transition (Extended Data Fig. 1a–g).
Figure 1. Identification of selective YC-1 activity against liver cancer subsets.
a, Schematic of drug screening and validation studies. b, Graphs of results of small molecule screen with MIPe library in IDHm ICC cell lines (SNU1079 and RBE) and IDH1 WT ICC cell lines (HUCCT1 and CCLP1). Upper graph: differential sensitivity (x-axis) and significance (y-axis; -logP) of compounds towards IDHm versus IDH1 WT lines. Relative sensitivity of the IDHm cells is denoted by size of the bubble. Lower graph: ranking of individual compounds according to differential sensitivity. Significance was analyzed using two-tailed Student’s t-test. P < 0.05 was considered statistically significant. The screen was performed once using a concentration-response profile (stepwise 5-fold dilutions of drug between 92.1 μM and 0.006 μM).
c, Heatmap of YC-1 sensitivity in 25 biliary cancer cell lines and in MMNK1 cells (immortalized bile duct). IDHm cell lines are highlighted. d, IC50 measurements for YC-1 in select IDHm (red) and IDH WT (black/grey) ICC cell lines. Two biologically independent experiments are shown. e, Compiled results of YC-1 sensitivity in 1022 cancer cell lines. The data show the ranked fraction of YC-1-sensitive cell lines in each cancer type. The screen was performed once using 9-point two-fold dilution series of YC-1. f, Graph showing that ICC cell lines with IDH1/IDH2, FGFR2 and BAP1 genomic alterations rank among the most sensitive in the screen. “YC-1 sensitivity” (y-axis) denotes Log10 transformed YC-1 IC50s in μM. Red dots represent RBE, SNU1079 and ICC5 cells (IDH1-R132C/S/L mutant), and the pink dot represents YSCCC cells (IDH1-R100Q mutant).
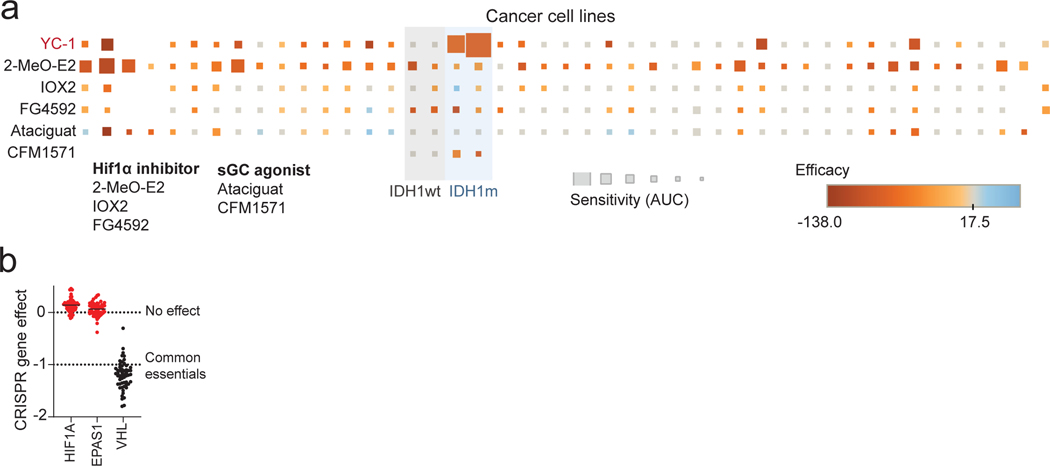
YC-1 lacks an established mechanism of action mediating its cytotoxicity, although it has been reported to function as an inhibitor of hypoxia-inducible factor 1α (HIF1α)15 and, at high concentrations (>50 μM), an agonist of soluble guanylyl cyclase (sGC)16. However, we failed to observe specific activity against IDHm ICC cells by multiple selective HIF1α inhibitors or sGC agonists tested in the screen or in subsequent studies using a larger cell line panel (Extended Data Fig. 2a). Moreover, CRISPR screens indicated that HIF1A and HIF2A are dispensable for the growth of IDHm ICC cells in vitro (Extended Data Fig. 2b). Therefore, we concluded that YC-1 decreases cell viability through a distinct mechanism.
We defined the profile of YC-1 activity across an expanded set of biliary cell lines representing diverse genomic features and biology (Fig. 1a middle and Supplementary Table 2, N = 26 cell lines, including ICC, extrahepatic cholangiocarcinoma [ECC], gallbladder carcinoma, and the immortalized bile duct line, MMNK1). Calculation of the half maximal growth inhibitory concentration for each cell line (IC50, Fig. 1c, d) revealed a >130,000-fold range of sensitivity (4.77 nM to >631 μM). Each IDHm ICC cell line tested (N = 5) ranked as highly sensitive. However, several IDH WT cell lines showed comparable responsiveness, prompting us to consider determinants for YC-1 sensitivity beyond IDH status.
To further define contexts for YC-1 sensitivity, we tested this compound against a panel of 1022 cancer cell lines derived from >25 tumor types, which we have profiled extensively as part of our genomics of drug sensitivity program17, 18 (Fig. 1a right). In total, we identified 101 YC-1-responsive cell lines across cancer types (9.7%, Supplementary Table 3, see Methods). There were broad trends in response, with particular enrichment of sensitivity in primary liver cancers (ICC and HCC) as well as bone and pleural tumors, whereas prostate, stomach, skin, and esophageal cancer cell lines (among others) were largely resistant (Fig. 1e). Multiple ICC cell lines, including those with IDH mutations and other genotypes (FGFR2 fusion, BAP1 inactivation) ranked among the most sensitive (Fig. 1f). Cell lines derived from other anatomical subtypes of biliary cancer—ECC and gall bladder carcinoma—were not highly responsive to YC-1 (Fig. 1e). Thus, YC-1 responsiveness varies widely among human cancer cell lines, with enriched sensitivity in both major liver malignancies.
SULT1A1 expression confers YC-1 sensitivity
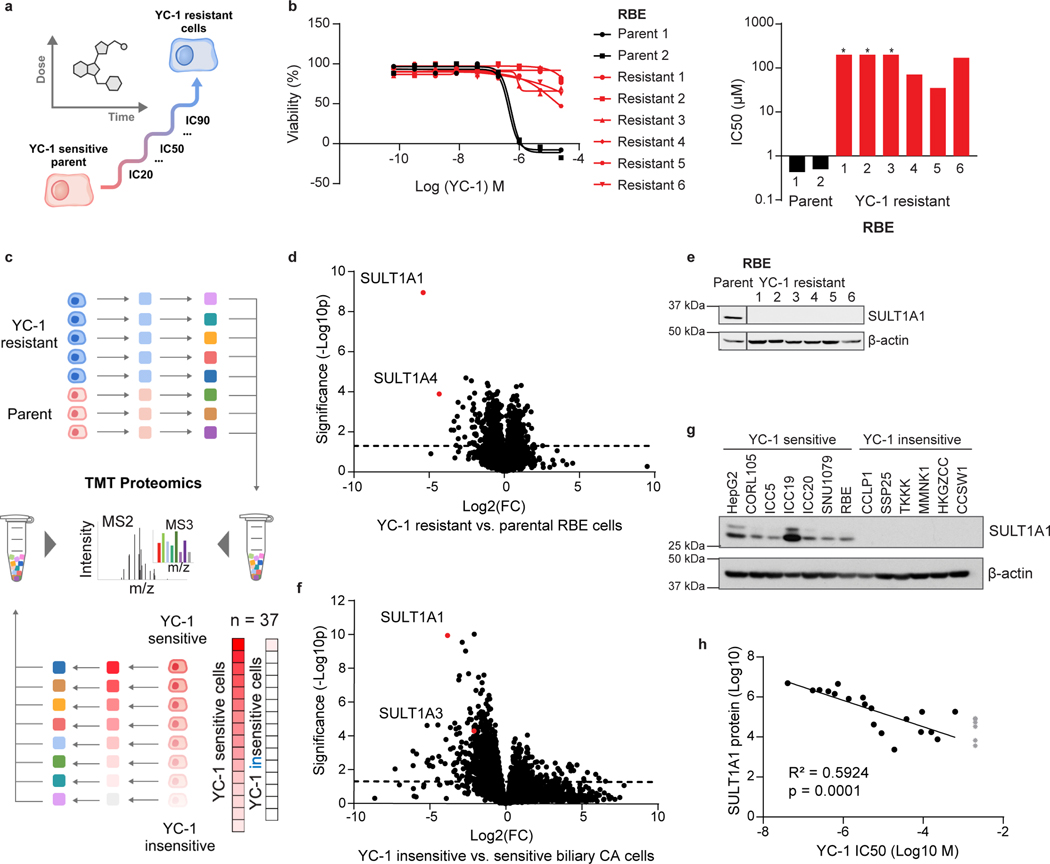
To study the basis for YC-1 selectivity, we developed acquired resistance models by subjecting RBE cells to gradually increasing concentrations of YC-1 (Fig. 2a, see Methods). Six YC-1 resistant clones were isolated, and each was insensitive at concentrations >25 μM compared to an IC50 of 0.426 μM for parental RBE cells (Fig. 2b). The resistant phenotype was stable upon culturing without YC-1 and then re-challenging with drug. We used tandem mass tag (TMT) labeling-based quantitative mass spectrometry to identify proteome changes associated with acquired resistance to YC-1 (Fig. 2c upper). Compared to parental RBE cells, all six resistant lines showed striking changes of levels of a single protein among 9895 proteins detected—depletion of the cytosolic sulfotransferase enzyme, SULT1A1 (Fig. 2d and Supplementary Table 4). The related sulfotransferase, SULT1A4, exhibited a similar, although less pronounced, trend in depletion. Immunoblot analysis confirmed marked deletion of SULT1A1 in resistant clones (Fig. 2e).
Figure 2. YC-1 sensitivity correlates to SULT1A1 expression levels.
a, Schematic of acquired YC-1 resistance experiment. b, Sensitivity (IC50) to YC-1 of parental RBE cells and acquired resistance models. IC50 curves (b) and computed values (c) are shown. Asterisk indicates IC50 too high to calculate based on (b). Graphs show means of technical replicates.
c, Schematic of TMT proteomics analysis of parental and YC-1-resistant RBE cells (upper portion, corresponds with panel [d]), and of a large panel of ICC cell lines (lower, corresponds with panel [f]). d, Volcano plot of proteomics data comparing parental and resistant RBE cell lines, highlighting significant depletion of SULT1A1 in resistant lines (two-tailed, unpaired Student’s t-test). e, Immunoblot validating SULT1A1 loss in resistant cells. Samples are from the same gel and exposure. The cropping removes an irrelevant lane. f, TMT proteomics comparing 5 YC-1-sensitive (IC50 median = 0.256 μM) and 32 YC-1-insensitive (IC50 median = 18.9 μM, not including cell lines with no response) biliary cell lines (two-tailed, unpaired Student’s t-test). g, Immunoblot for SULT1A1 in the indicated cell lines. Each is biliary, with the exception of HepG2 (HCC) and CORL105 (SULT1A1-high lung cancer). h, Graph of correlation between SULT1A1 protein levels and YC-1 IC50 across a set of 19 biliary tract cell lines. Asterisk indicates no response to YC-1. The linear regression line is shown. Immunoblots (e, g) were from one of the two performed experiments with similar results.
To further explore the association between SULT1A1 levels and YC-1 response, we analyzed a panel of biliary cancer cell lines (N = 37) with multiplexed quantitative proteomics and calculated differential protein expression and significance between YC-1-sensitive and -insensitive groups (IC50 = 0.04 – 2.14 μM and IC50 > 3.00 μM, respectively; Fig. 2c lower, 2f and Supplementary Table 5). Reduced expression of SULT1A1 was again the top outlier across this heterogeneous set of cell lines. Immunoblot analysis showed nearly binary differences in expression of SULT1A1 in YC-1-sensitive versus -insensitive groups (Fig. 2g). Furthermore, strong linear correlation was observed between YC-1 sensitivity (IC50) and SULT1A1 protein expression after log10 normalization (Fig. 2h). Examination of SULT1A1 mRNA expression indicated that the differences in protein expression were due to transcriptional regulation (Extended Data Fig. 3a).
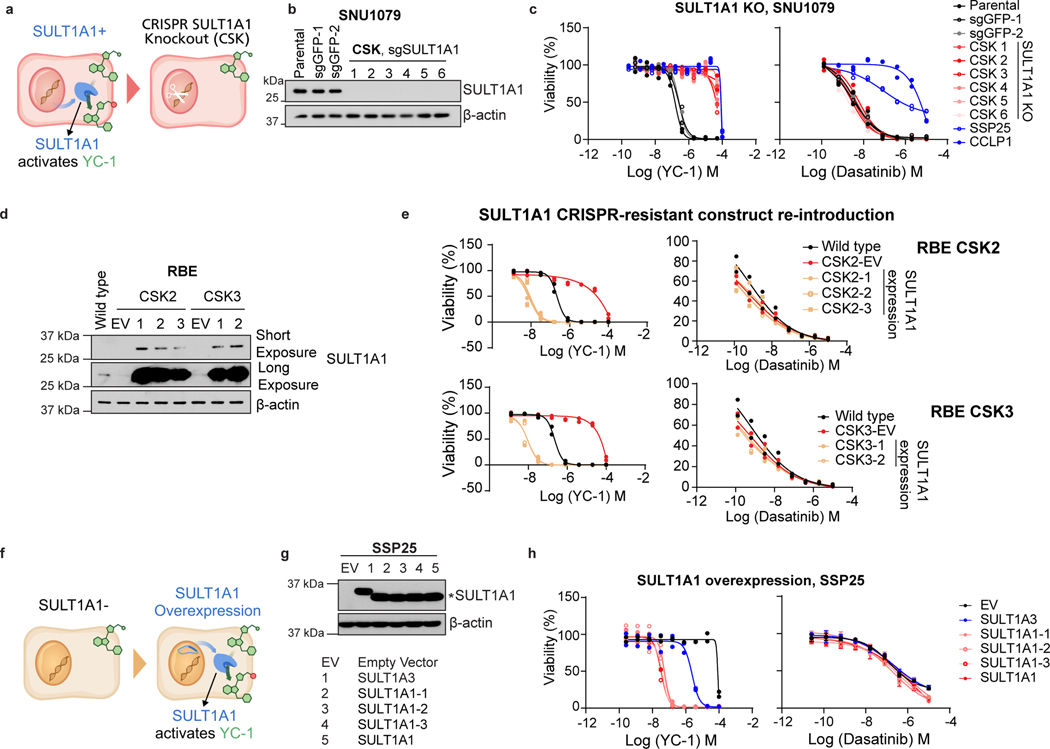
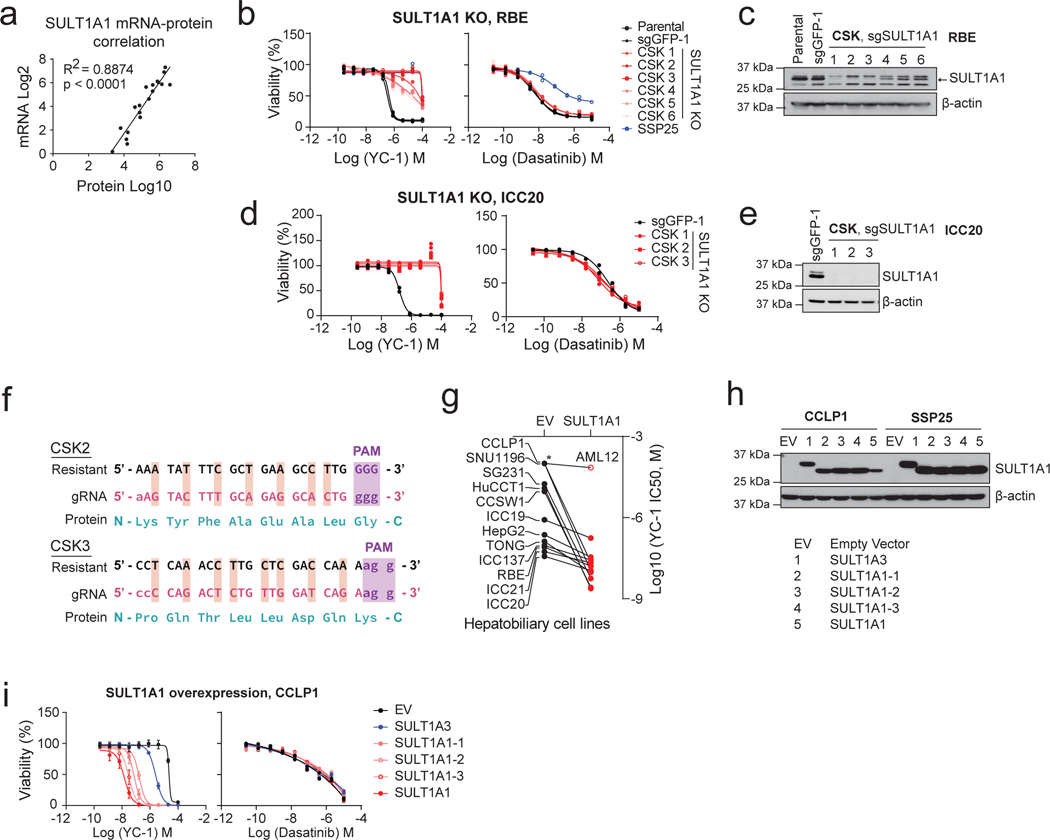
Human SULT1A1 is a cytosolic phenol sulfotransferase participating in xenobiotic metabolism and hormonal regulation19. We used CRISPR-Cas9-mediated knockout to test the functional role of SULT1A1 in YC-1 response (Fig. 3a). SULT1A1 knockout (CSK) in SNU1079 cells with six distinct short guide RNAs (sgRNAs) caused marked resistance to YC-1 (>100-fold increase in IC50) relative to parental cells and those CRISPR targeting with sgRNA against GFP (Fig. 3b, c), whereas response to the SFK inhibitor, dasatinib14 (Fig. 1b) was unaffected (Fig. 3c). Comparable results were observed in two other YC-1 hypersensitive cell lines, RBE and ICC20 (Extended Data Fig. 3b–e). Expression of CRISPR-resistant SULT1A1 (Extended Data Fig. 3f) restored responsiveness of SULT1A1 knock-out cells to YC-1 treatment, confirming specificity (Fig. 3d, e). Conversely, exogenous viral expression of common polymorphic variants of SULT1A1 was sufficient to engender YC-1 sensitivity in all six SULT1A1-low (YC-1-insensitive) cholangiocarcinoma cell lines tested, reducing the IC50 by 1000 to 10,000-fold, whereas proliferation of the murine hepatocyte cell line, AML12 was unaffected (Fig. 3f–h and Extended Data Fig. 3g–i). By contrast, overexpression of SULT1A3 resulted in only ~10-fold increased sensitivity to YC-1 (Fig. 3g, h and Extended Data Fig. 3h, i). Thus, we conclude that SULT1A1 expression determines sensitivity to YC-1.
Figure 3. SULT1A1 determines YC-1 sensitivity.
a, Schematic for genetic knockout of SULT1A1 in ICC cells. b, Immunoblot for SULT1A1 in SNU1079 parental cells or CRISPR engineered derivatives with control sgGFP or sgSULT1A1 KO (CSK1–6). c, SNU1079 parental cells or the engineered derivatives were tested for sensitivity to YC-1 (left) or dasatinib (right). SSP25 and CCLP1 are ICC cell lines that are insensitive to both drugs and shown for reference. Two biologically independent experiments are shown. d, Immunoblot demonstrating restored expression of SULT1A1 using a CRISPR-resistant construct in RBE SULT1A1 KO cells. e, Re-expression of CRISPR-resistant SULT1A1 re-sensitizes SULT1A1 KO RBE cells to YC-1. Data shows mean measurements from two biologically independent experiments.
f, Schematic for ectopic overexpression of SULT1A1 in ICC cells. g, Immunoblot confirming overexpression of SULT1A1 (denoted by *), corresponding to panel h. Several common germline variants of SULT1A1 were tested: SULT1A1–1 (V220M, V223M, F247L), SULT1A1–2 (S44N, V164A, V223M) and SULT1A1–3 (V223M). h, Ectopic expression of SULT1A1 sensitizes SSP25 cells to YC-1. Two biologically independent experiments are shown on the left panel. Error bars in the right panel are mean ± SD, n=4 biologically independent experiments. SULT1A3 only modestly increases sensitivity. Immunoblots (b, d, g) were from one of the two performed experiments with similar results.
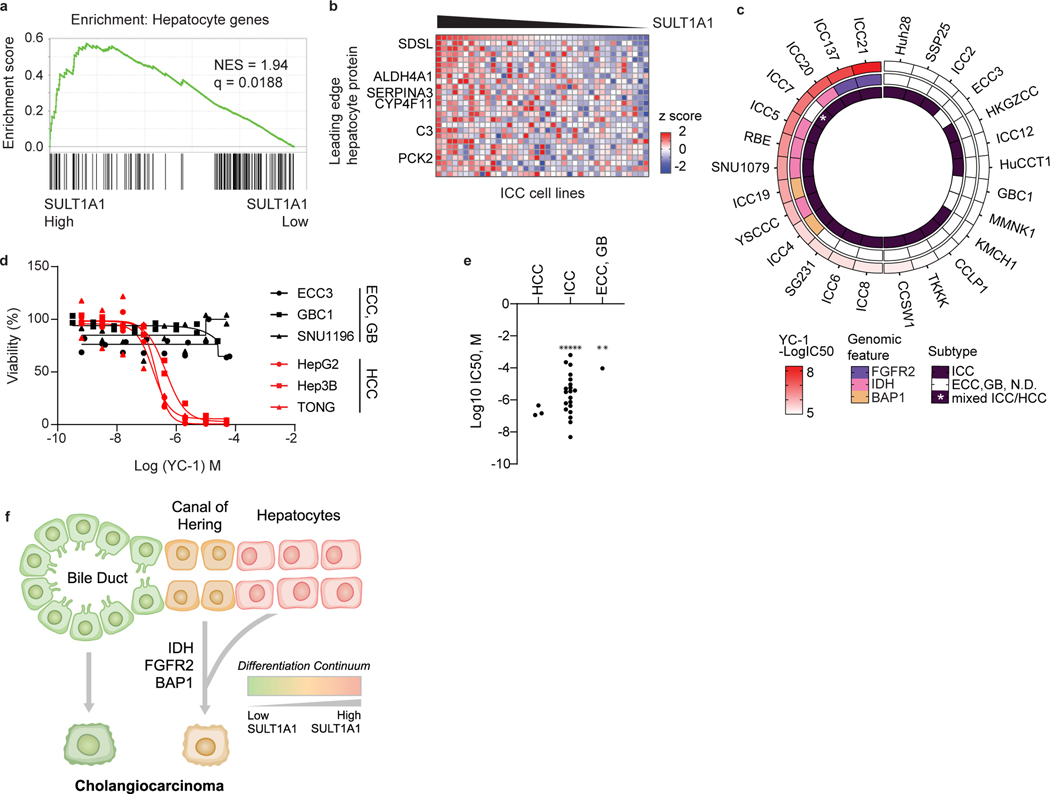
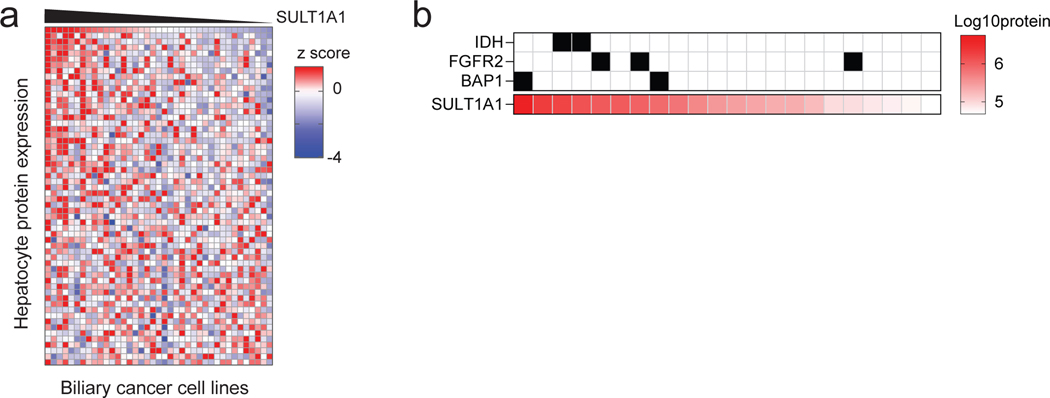
Human SULT1A1 is selectively expressed in hepatocytes. In this regard, re-examination of the YC-1 response profiles indicated that YC-1 sensitivity and SULT1A1 levels in ICC cells correlated with a distinct protein expression signature. This signature consists of enrichment for hepatocyte markers with concurrent expression of bile duct markers, whereas SULT1A1-negative biliary cancer cell lines lack significant expression of hepatocyte markers (Fig. 4a, b and Extended Data Fig. 4a). This ‘bi-lineage’ signature is associated with specific genomic features (IDH mutation, FGFR2 fusion, and BAP1 loss; Fig. 4c). Notably, in patient samples, these genomic alterations correlate with the small duct histological subtype of ICC, resembling the cholangioles (canals of Hering)—channels at the junction of the hepatocytes and biliary tree and lined serially by cells of either lineage20–26. ICCs lacking these mutations show similarity to the large, mature bile ducts (i.e., large duct subtype). YC-1 responsiveness is depicted in relation to these genotypes and to hepatobiliary cancer subtype (HCC, ICC, ECC, gallbladder carcinoma, or mixed ICC/HCC) in Fig. 4c–e. Analysis of 23 patient-derived xenograft models also showed associated of SULT1A1 protein expression with IDH mutations, FGFR2 fusions, and BAP1 mutation (Extended Data Fig. 4b). Thus, SULT1A1 expression defines YC-1 sensitive cells and is enriched in ICC cells exhibiting a bi-lineage expression signature (Fig. 4f) and in HCC.
Figure 4. SULT1A1 expression associates with hepatocyte lineage.
a, b, GSEA (a) and heatmap (b) of hepatocyte protein expression in ICC cell lines according to SULT1A1 protein levels. Significance was calculated as false discovery rate by the GSEA package. Q < 0.25 was considered statistically significant. c, Circos plot of 28 biliary tract cell lines depicting YC-1 sensitivity, biliary cancer type, and specific molecular features (i.e., IDH1 mutation, FGFR2 fusion, and absence of BAP1 protein expression). Asterisk indicates mixed ICC/HCC histology. ECC, extrahepatic cholangiocarcinoma; GB, gallbladder carcinoma; N.D., normal duct. d, YC-1 sensitivity measurement in representative HCC, ECC, and GB cell lines. Two biologically independent experiments are shown. e, Scatter plot comparing YC-1 IC50s of cell lines between liver cancer subtypes. Asterisks indicate cell lines exhibiting no response to YC-1 (IC50 not calculable). f, Model relating SULT1A1 expression, liver lineage marker expression, and genomic alterations in ICC.
Furfuryl alcohol moiety determines YC-1 toxicity
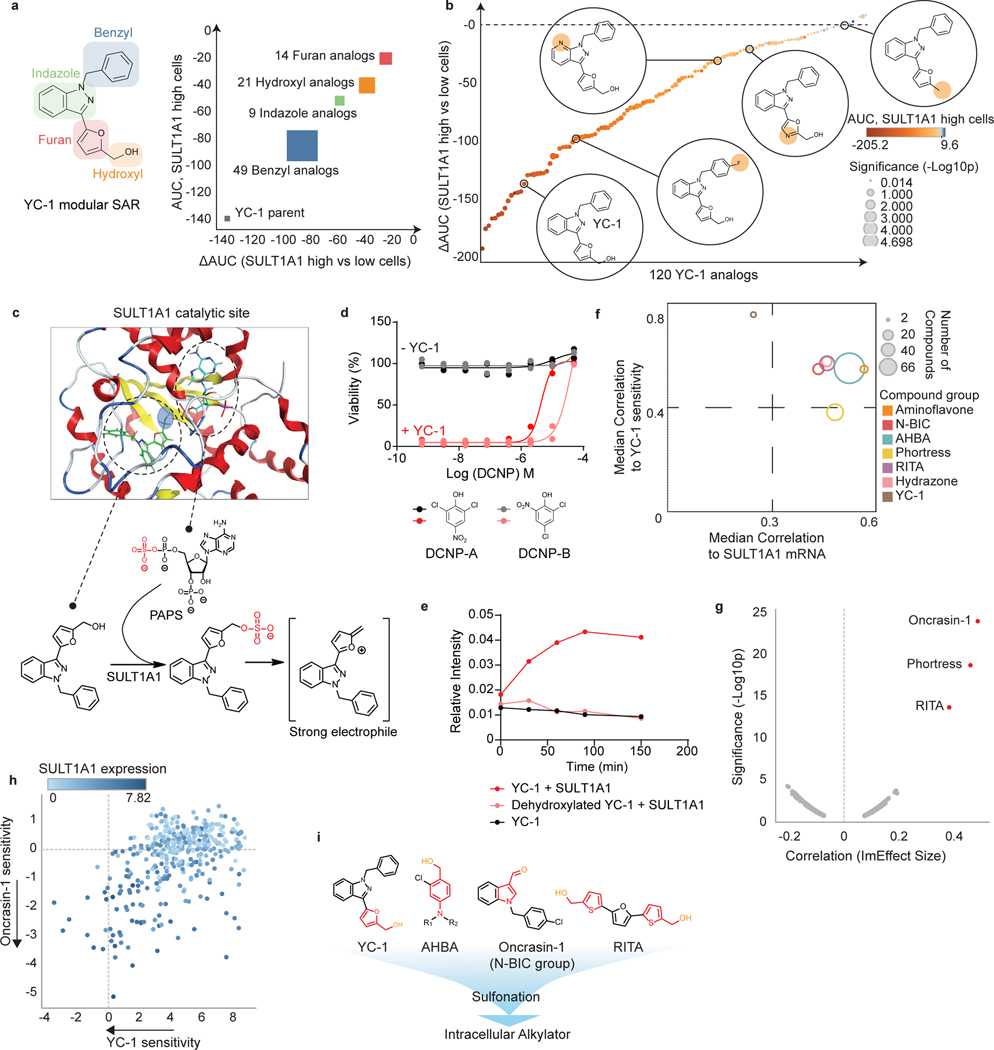
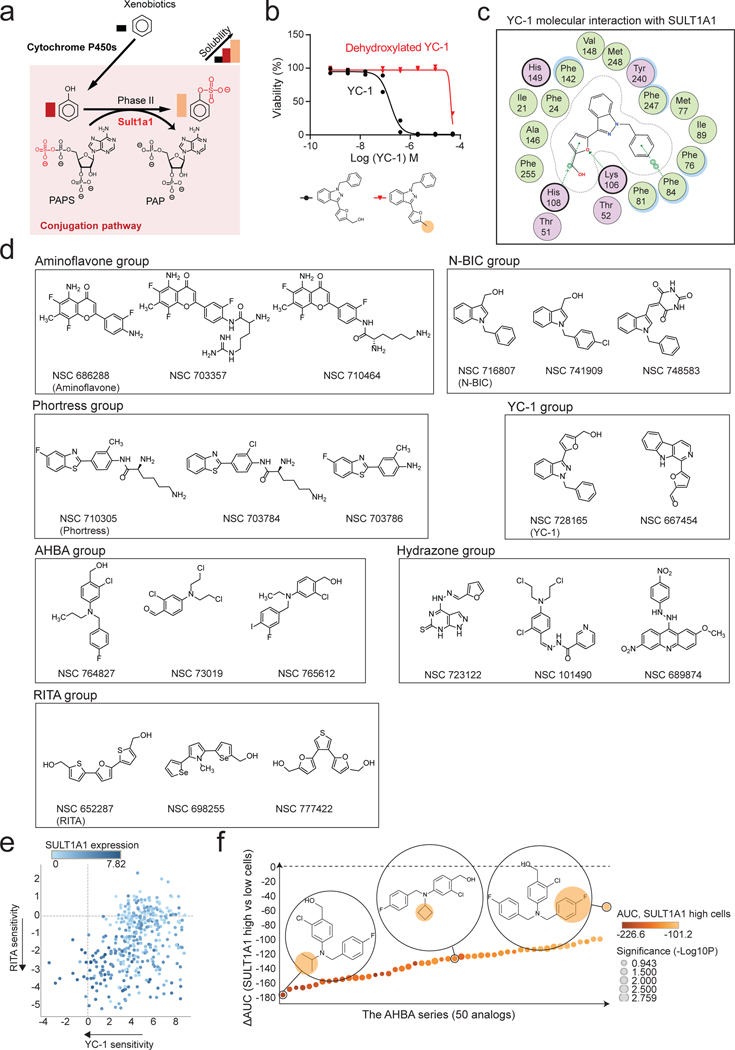
SULT1A1 uses the co-substrate 3’-phosphoadenosine-5’-phosphosulfate (PAPS) to transfer a high energy sulfate to the hydroxy moiety of phenol groups within target molecules (metabolites, xenobiotics, hormones). Sulfonation increases aqueous solubility of xenobiotics and alters the binding properties of hormones (Extended Data Fig. 5a). YC-1 is comprised of a furfuryl alcohol, indazole core, and benzyl group (Fig. 5a). The furfuryl alcohol of YC-1 structurally mimics phenol, suggesting that this group may be a substrate for SULT1A1 phenol sulfotransferase activity and that YC-1 sulfonation may underlie its cytotoxicity. In this regard, crystal structures of SULT1A1 with known substrates reveal plasticity within the catalytic site, permitting a range in substrate specificity27.
Figure 5. Benzyl alcohol moiety determines YC-1 toxicity and defines a class of SULT1A1-activatable compounds.
a, b, A set of 120 analogs of YC-1 were generated and screened for activity against two SULT1A1-high cell lines (RBE and SNU1079) and two SULT1A1-low cell lines (CCLP1 and SSP25). a, Schematic of chemical moieties of YC-1 (left) and summary of SAR data for the YC-1 analogs grouped according to modifications in the indicated chemical groups. The y-axis represents shifts in AUC of the specific YC-1 analogs versus parental YC-1 in SULT1A1-high cell lines. The x-axis compares the activity of the analogs versus parental YC-1 in terms of differential sensitivity toward SULT1A1-high cell lines relative SULT1A1-low lines. b, Graph showing the ranked activity of YC-1 analogs (or parent compound) in terms of differential sensitivity toward SULT1A1-high cells versus SULT1A1-low cells (y-axis). The color code represents that relative sensitivity of SULT1A1-high cells to each analog. Bubble sizes denote significance (p-value). c, Structural modeling analysis showing docking of YC-1 in the SULT1A1 crystal structure (PDB: 3U3M). The lower panel show schematic of predicted sulfonation of YC-1 by SULT1A1. d, Treatment of RBE cells with YC-1 in the presence or absence of a potent (DCNP-A) or less potent (DCNP-B) SULT1A1 inhibitor. Two biologically independent experiments are shown. e, In vitro enzymatic assay showing that SULT1A1 modifies YC-1 but not its dehydroxylated analog. YC-1 or dehydroxylated YC-1 were incubated with recombinant SULT1A1 protein in the presence of p-nitrophenylsulfate and 5′-phosphoadenosine-3′-phosphosulfate (for an additional control, YC-1 was incubated in the reaction buffer without SULT1A1). The reaction was monitored by released p-nitrophenol with UV absorbance at 405nm. Data shown are mean measurements from one of the two performed experiments with similar results.
f, Results of computational analysis of NCI-60 database using CellMiner showing compound groups whose activity profiles are highly correlated with that of YC-1 (y-axis) and with SULT1A1 mRNA levels (x-axis). The bubble size represents number of compounds with a given group. g, Volcano plot of computational analysis of the PRISM database showing correlation of sensitivity profiles of compounds with YC-1 profiles. Pearson correlations (ImEffect size on x axis) were computed between the sensitivity profile of YC-1 (Supplementary Table 3 and Fig. 1f) and the DepMap PRISM Drug Sensitivity data. For visualization purpose, only drugs with Pearson correlation > 0.07 are shown. h, Scatter plot showing correlation between YC-1 and Oncrasin-1 sensitivity profiles across 398 cancer cell lines. Relative SULT1A1 mRNA levels are depicted by the color scheme. i, Chemical structures of representative SULT1A1 activatable compounds. Note the common benzyl alcohol moieties. Significance (b, f) was analyzed using two-tailed Student’s t-test. P < 0.05 was considered statistically significant.
We surveyed structure-activity relationships by systematically modifying each structural component of YC-1 (Fig. 5a). A set of 118 analogs was synthesized and screened against two YC-1 sensitive and two insensitive ICC cell lines, with high and low SULT1A1 expression, respectively. This analysis indicated that the furan group and hydroxymethyl on the furfuryl alcohol were most important for YC-1 selectivity (differential AUC) and efficacy (average AUC relative to the SULT1A1-high group) (Fig. 5a right). Notably, loss of the hydroxy group within the furfuryl alcohol abolished YC-1 activity (273-fold increase in IC50, Fig. 5b and Extended Data Fig. 5b), consistent with the importance of sulfonation of this group. By contrast, several analogs containing modifications to the benzyl group exhibited increased selectivity towards SULT1A1- high cells (Fig. 5b and Supplementary Table 6). We computationally modeled the interaction of YC-1 with the crystal structures of human SULT1A127 (Fig. 5c; see Methods). The co-substrate PAPS (represented by the non-sulfated form, PAP, in the crystal structure) is coordinated at one side of the catalytic pocket. YC-1 fits opposingly on the other side in a branched conformation, with its hydroxy pointing toward the high-energy sulfate from PAPS. Molecular interactions specifically coordinating SULT1A1 and YC-1 include cation-π interaction from His108 to the furan, and π-π stacking from Phe84 to the benzyl, and a hydrogen bond between Lys106 and the oxygen of furan (Extended Data Fig. 5c). Thus, structural modeling supports YC-1 as a SULT1A1 substrate. Accordingly, we tested whether SULT1A1 enzymatic activity was required for YC-1 efficacy by employing the phenol-mimicking SULT1A1 inhibitor, 2,6-dichloro-4-nitrophenol (DCNP-A)19, and its analog, 2,4-dichloro-6-nitrophenol (DCNP-B). YC-1 treated cells were completely rescued by increasing concentrations of DCNP-A, whereas DCNP-B produced a milder rescue (Fig. 5d). Importantly, an in vitro reconstituted enzymatic assay showed that recombinant SULT1A1 sulfonates YC-1, but not its dehydroxylated form (Fig. 5e). Collectively, the data demonstrate the requirement of SULT1A1 sulfotransferase activity for YC-1 efficacy and indicate that the furfuryl alcohol moiety is the direct target of sulfonation (Fig. 5c, lower).
The highly specific mechanism of YC-1 activation prompted us to identify additional compounds potentially activatable by SULT1A1 via computational analysis of pharmacogenomic databases (see Methods). First, we queried the NCI Developmental Therapeutics Program database (NCI-60), which has annotated cytotoxicity of >22,000 compounds against 60 cancer cell lines. Using the CellMiner NCI-60 tool (https://discover.nci.nih.gov/cellminer/), we identified hundreds of compounds whose activity profiles showed high correlation with either SULT1A1 transcript levels or YC-1 sensitivity (designated NSC 728165 in the NCI-60 database). The top ~150 compounds were categorized into groups based on chemical structure (Fig. 5f, Extended Data Fig. 5d, and Supplementary Table 7), including analogs of Oncrasin-1 (N-BIC group), RITA, and aminoflavone — anti-cancer agents whose activity has been predicted or experimentally shown to depend on SULT1A128−31— as well as sets of molecules not previously linked to SULT1A1, namely Phortress analogs, and two additional groups of compounds. Query of the Broad Institute PRISM data platform32 representing >4000 small molecules tested against a 578-cancer cell line panel also revealed strong correlations between Oncrasin-1, RITA, and Phortress sensitivity profiles and both our YC-1 response data and SULT1A1 mRNA expression levels (Fig. 5g and h; Extended Data Fig. 5e).
The novel molecules identified by CellMiner NCI-60 analysis included 80 related compounds (Amino Halogenated Benzyl Alcohol [AHBA] series), of which 66 were highly similar to one another, sharing a core structure of 2-halogenated 4-amino benzyl alcohol, reminiscent of the furfuryl alcohol of YC-1 (Fig. 5f, i, and Extended Data Fig. 5d). Testing the AHBA series in our cell line panel (two SULT1A1+ and SULT1A1- lines) confirmed selective activity toward SULT1A1+ cells, comparable to that of YC-1 (Extended Data Fig. 5f and Supplementary Table 8). The other group includes compounds containing hydrazone derivatives of benzyl alcohols (Hydrazone group) (Fig. 5f and Extended Data Fig. 5d). Hydrazones—composed of an aldehyde or ketone capped by hydrazine—are susceptible to acid hydrolysis to expose the aldehyde33, which is likely the target of sulfonation. Thus, we demonstrate unexpected, critical roles for SULT1A1 in the activity of previously studied anti-cancer agents (YC-1 and Phortress) and we identify novel compound series whose activity correlates with SULT1A1 expression.
N-BIC (N-Benzyl Indole Carbinol) and RITA have been proposed to be converted to electrophilic alkylators by in-situ sulfonation of their hydroxymethyl groups28, 30. In addition, aminoflavone is thought to be hydroxylated by cytochrome P450 enzymes, enabling its subsequent sulfonation to become an electrophilic alkylator31. Examination of each group of SULT1A1-activated agents suggested a common chemical structure of electron-rich benzyl alcohol derivatives. Following sulfonation, the ring structure is presumably converted into a stabilized, electrophilic intermediate that, in turn, acts as an alkylating reagent. Thus, our elucidation of the YC-1 mechanism of action, together with identification of these additional compound groups (N-BIC, RITA, AHBA, and Hydrazone), defines a new antitumor compound class activatable by SULT1A1 and harboring a core benzyl alcohol structure that is present natively (Fig. 5i) or upon metabolic processing31.
Sulfonated YC-1 alkylates proteins
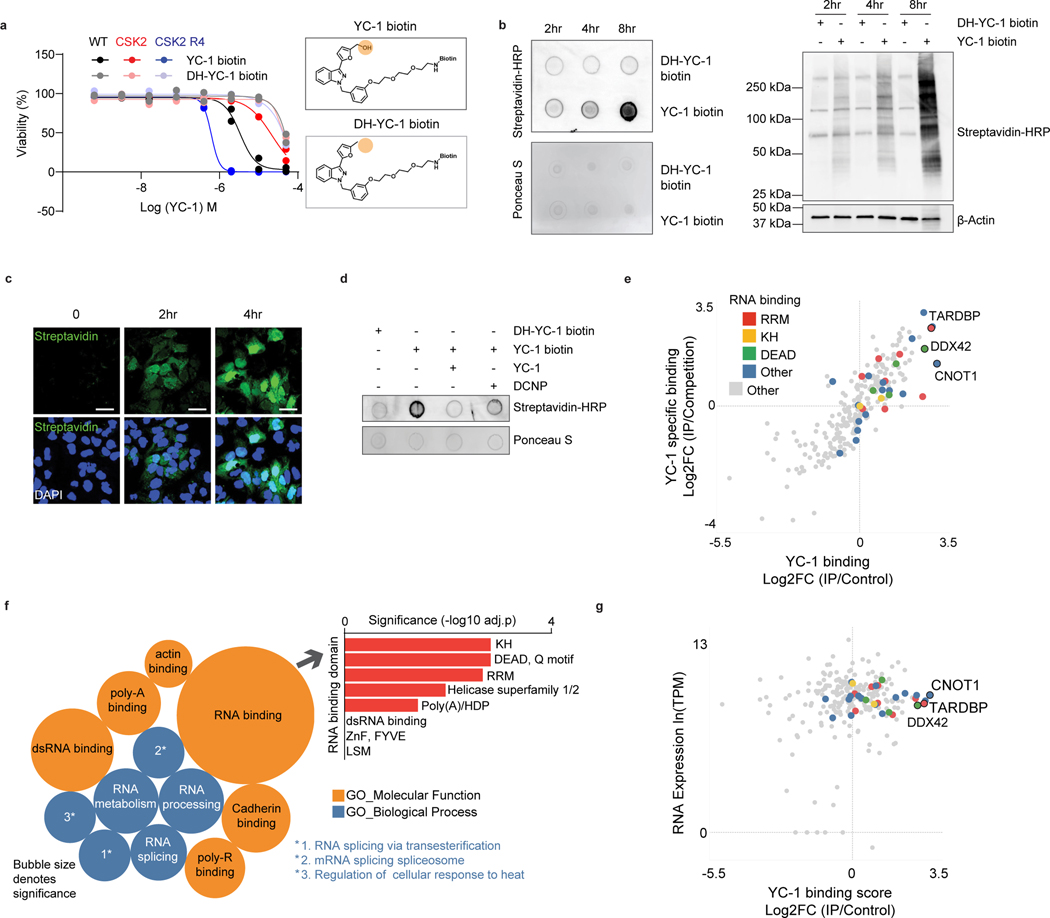
SULT1A1 activity can generate alkylators, suggesting that the aforementioned compounds may bind covalently to cellular targets. To explore the mechanism of YC-1 cytotoxicity, we developed YC-1 derivatives based on the structure-activity relationship (SAR) data. In particular, we generated affinity tags and click chemistry reagents by conjugating biotin with a PEG linker (YC-1 biotin) or an alkyne/azide, respectively, to the benzyl group (Fig. 6a), which we found to be amenable to modification (Fig. 5a). These compounds maintained SULT1A1-dependent efficacy, with meta-substituted YC-1 biotin showing highest selectivity against SULT1A1 expressing cells. As an inactive control, we also generated a dehydroxylated analog (DH-YC-1 biotin), which is incapable of being sulfonated and lacks efficacy (Fig. 6a).
Figure 6. Proteomic identification of YC-1 binding targets.
a, Activity of YC-1 biotin and dehydroxylated (DH) YC-1 biotin against parental RBE cells and derivative lines with SULT1A1 KO (CSK2) and SULT1A1 KO with SULT1A1 re-expression (CSK2 R4). Two biologically independent experiments are shown. b, Dot blot (upper) and western blot (lower) of protein lysates from RBE cells treated with YC-1 biotin or DH-YC-1 biotin for the indicated times. Blots were probed with HRP-conjugated streptavidin. Ponceau S staining for dot blot and β-actin for western blot serve as the total protein loading control. c, Immunofluorescence images of RBE cells treated with YC-1 biotin. Fixed cells were stained with Streptavidin-FITC to detect YC-1 biotin and with DAPI for visualization of the nucleus. Scale bar, 17 μm. d, Dot blot of protein lysates of RBE cells treated as indicated for specificity and SULT1A1 dependency. e, Scatterplot of results of YC-1 pulldown proteins. Enrichment is revealed by binding to YC-1 biotin relative to dehydroxylated inactive YC-1 biotin control (x-axis) and YC-1 biotin binding competed by parent YC-1 (y-axis). Proteins with specific RNA binding domains are color coded. f, Bubble chart of YC-1 binding proteins displaying enrichments based on the Gene Ontology Molecular Function and Biological Process databases (See Methods). The bar graph (right) depicts enrichment among different classes of RNA binding domains. Significance was calculated as adjusted p value using two-sided Fisher’s exact test and the Benjamini-Hochberg method for correction for multiple hypotheses testing. Adjusted p value < 0.05 was considered statistically significant. Immunoblot and immunofluorescence in (b) and (c) were performed two times with similar results. g, Graph showing correlation between specific YC-1 binding score for proteins detected in YC-1 pull-downs and mRNA expression of the associated gene. In (e and g), color code indicates proteins with common RNA binding domains identified by EnrichR analysis.
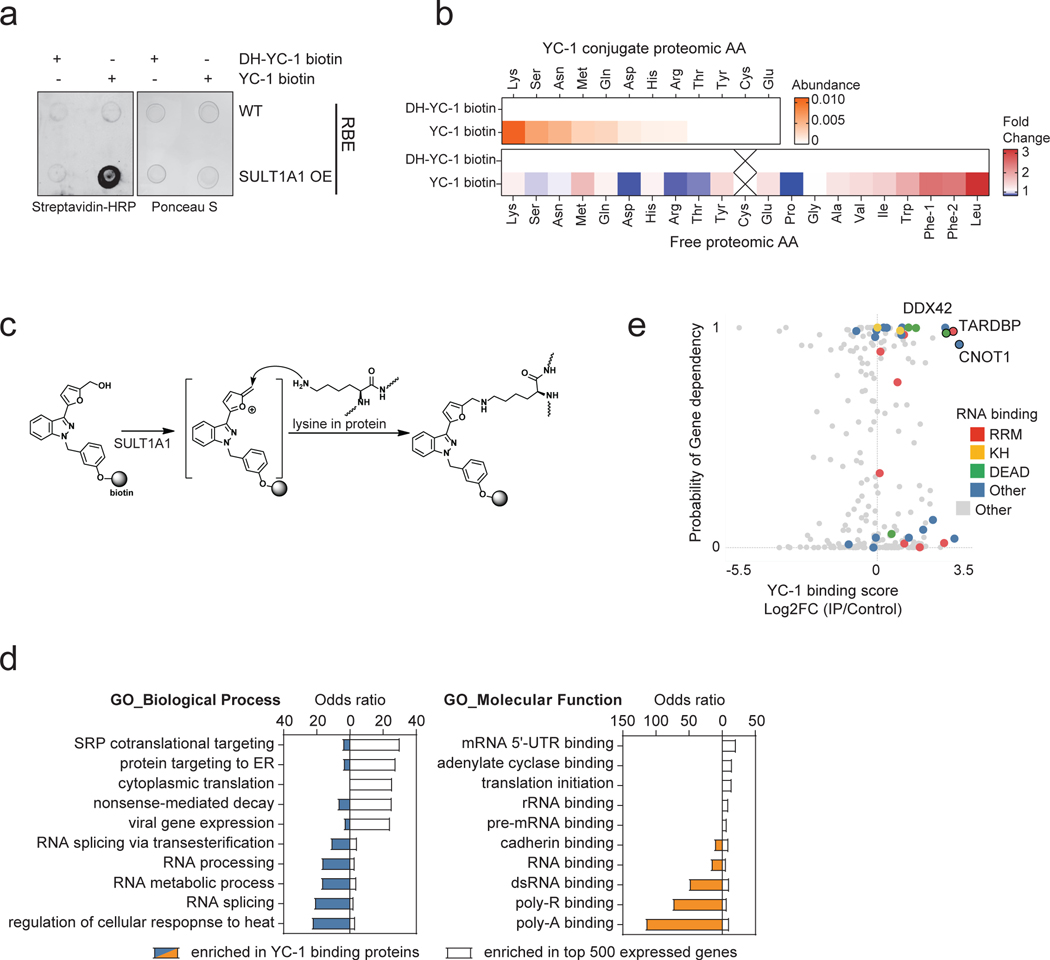
N-BIC was previously found to covalently bind to proteins in the cytosol29, RITA, to crosslink DNA and proteins34, and aminoflavone and Phortress, to form DNA adducts35, 36. Accordingly, we sought to determine whether YC-1 covalently binds intracellular molecules in a SULT1A1-dependent manner. First, we explored potential YC-1-protein adduct formation by dot blot analysis of nucleic acid-free protein extracts from cells treated with YC-1 biotin or DH-YC-1 biotin. Probing blots with streptavidin revealed enriched binding to YC-1 biotin, which was greatly augmented upon SULT1A1 overexpression (Extended Data Fig. 6a). Subsequent analysis of cells treated with YC-1 derivatives revealed a temporal increase in covalent binding of YC-1 biotin (Fig. 6b). Immunofluorescence using a streptavidin-FITC probe also showed progressive accumulation of YC-1 biotin in the cytosol and subsequent nuclear intensification, reinforcing the covalent nature of YC-1 binding to protein targets (Fig. 6c, see Methods). Furthermore, YC-1 biotin binding was largely abolished by YC-1 parent competition, or DCNP inhibition of SULT1A1 catalytic activity, indicative of protein binding specificity and its dependence on SULT1A1 (Fig. 6d). By contrast, we failed to observe evidence of YC-1-DNA adduct formation in studies in which we either extracted DNA from YC-1 biotin-treated cells and performed DNA dot blots (probed with streptavidin) or extracted DNA from YC-1-parent-treated cells and tested for hydrolyzed nucleic acids via Liquid Chromatography-Mass Spectrometry (see Methods).
We next sought to identify the amino acid residue(s) in proteins that are conjugated by YC-1. The YC-1 biotin bound proteome was isolated by streptavidin bead affinity purification after 1-day treatment and then subject to complete proteolytic digestion. Mass-spectrometry revealed strong detection of YC-1 biotin conjugation to lysine residues, followed by serine and asparagine, compared to control DH-YC-1 biotin samples (Extended Data Fig. 6b, see Methods). The side chain of each differentially conjugated amino acid residues contains a nucleophilic nitrogen (e.g., amine in lysine) or oxygen (e.g., hydroxy in serine) that can react and form a covalent bond with the electrophilic intermediate of YC-1 (Extended Data Fig. 6c). Thus, we conclude that sulfonated YC-1 binds cellular proteins, most prominently via covalent linkage with the side chain of lysine residues.
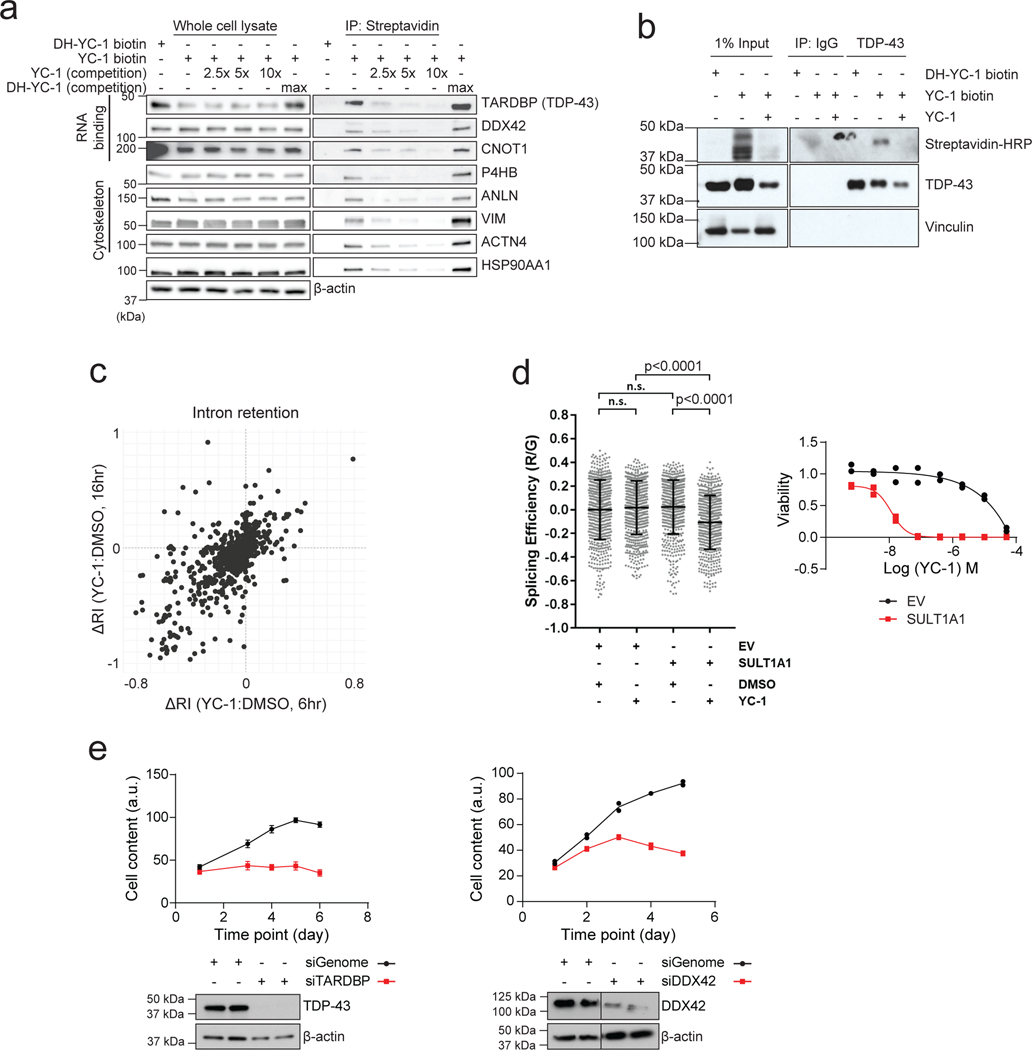
We used a chemoproteomic approach to identify proteins covalently bound by YC-1. Cells were treated with YC-1 biotin or DH-YC-1 biotin for 8 hours. Lysates were then subjected to streptavidin-based affinity purification in the presence of YC-1 parent compound or inactive YC-1 followed by TMT proteomics. Out of 250 proteins detected by YC-1 biotin affinity pull-down, 51 were specifically bound compared to inactive DH-YC-1 biotin and were diminished upon YC-1 parent competition (Fig. 6e, Log2FC > 1, and Supplementary Table 9). Gene ontology analysis demonstrated strong enrichment of RNA binding proteins (28/51, odds ratio = 8.07), including mediators of RNA metabolism, splicing and translation (Fig. 6e, f and Supplementary Table 10; see Methods). There was no correlation between gene expression levels and selective YC-1 binding (Fig. 6g). Moreover, many classes of highly expressed genes showed no enrichment in binding, suggesting that YC-1 binding profiles were not indicative of protein abundance (Extended Data Fig. 6d; see Methods). Interrogation of the InterPro protein domain database revealed specific enrichment of the RRM (RNA Recognition Motif), DEAD/H box and K homology RNA binding domains (Fig. 6f, upper right). Among the most differentially bound proteins (Log2FC = 2.84) was TAR DNA Binding Protein (TARDBP or TDP-43), an RNA-binding factor implicated in various aspects of RNA processing. Notably, TARDBP and other top ranked YC-1 target proteins — the RNA binding factors, CNOT1 and DDX42— scored as essential genes in cancer cell lines based on CRISPR screens (Extended Data Fig. 6e, retrieved from https://depmap.org). Immunoblot of proteins from YC-1 biotin affinity pulldown assays confirmed that TARDBP, CNOT1 and DDX42, and other candidate proteins bound avidly to YC-1 biotin and were competed in a dose-dependent manner by parent YC-1 (Extended Data Fig. 7a). We also further established that YC-1 directly binds TARDBP based on a reverse co-IP experiment (Extended Data Fig. 7b). Cells treated with YC-1 biotin (with or without competition with parental YC-1) or DH-YC-1 biotin were lysed and TARDBP protein was immunoprecipitated with a validated antibody37. We confirmed that streptavidin detected YC-1 biotin in TARDBP immunoprecipitates, but not inactive DH-YC-1 biotin, and that parent YC-1 competition reduced the YC-1 biotin signal.
Consistent with defects in RNA processing factors, YC-1 treated cells exhibited alterations in RNA splicing, including marked changes in intron retention as revealed by RNAseq analysis (Extended Data Fig. 7c). Moreover, functional assay with a TARDBP splicing reporter38 showed that YC-1 treatment impaired TARDBP-dependent RNA splicing in a SULT1A1-dependent manner (Extended Data Fig. 7d), whereas TARDBP protein levels were not consistently affected by YC-1 treatment. Thus, our data indicate that YC-1 preferentially targets specific classes of RNA binding proteins, including splicing factors essential for cell viability (Extended Data Fig. 7e).
SULT1A1-dependent activity of alkylator compounds in vivo
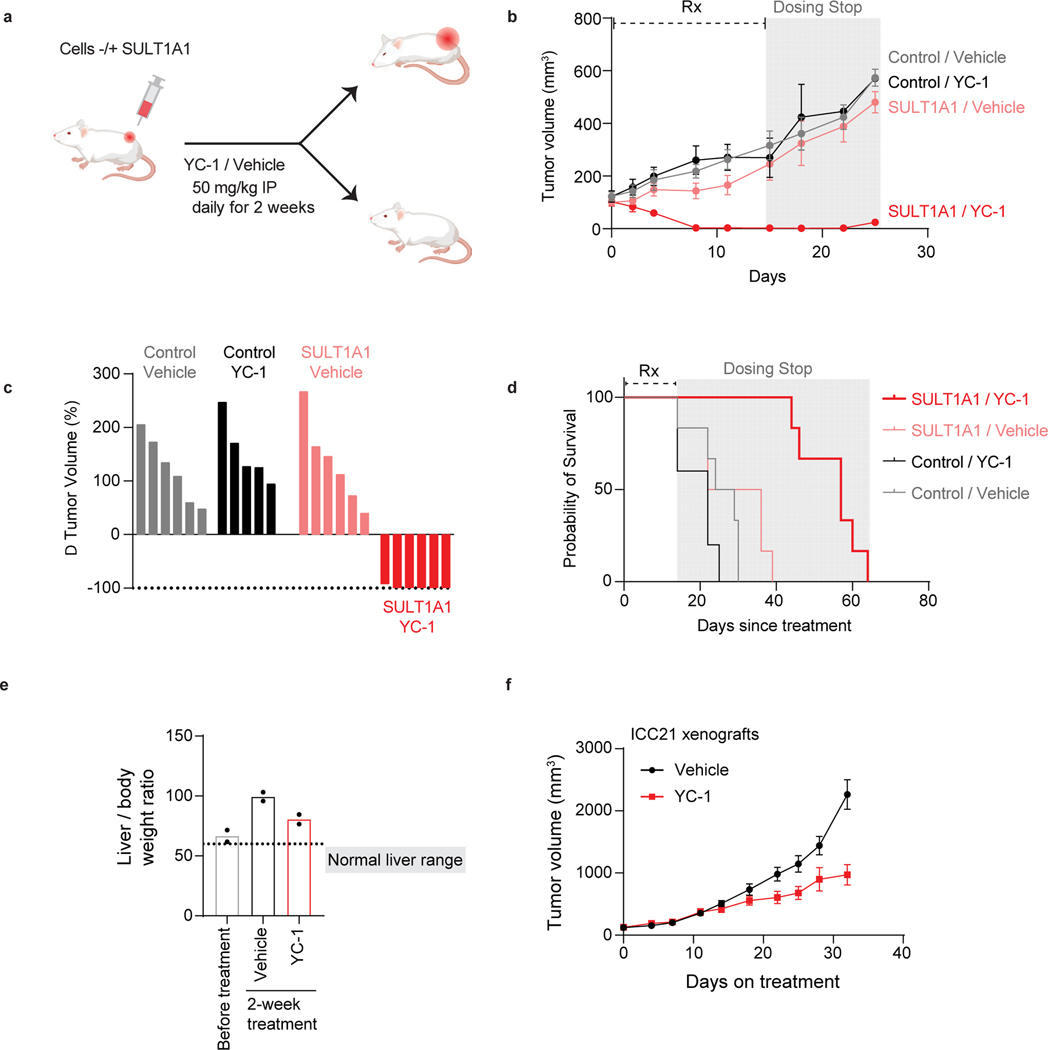
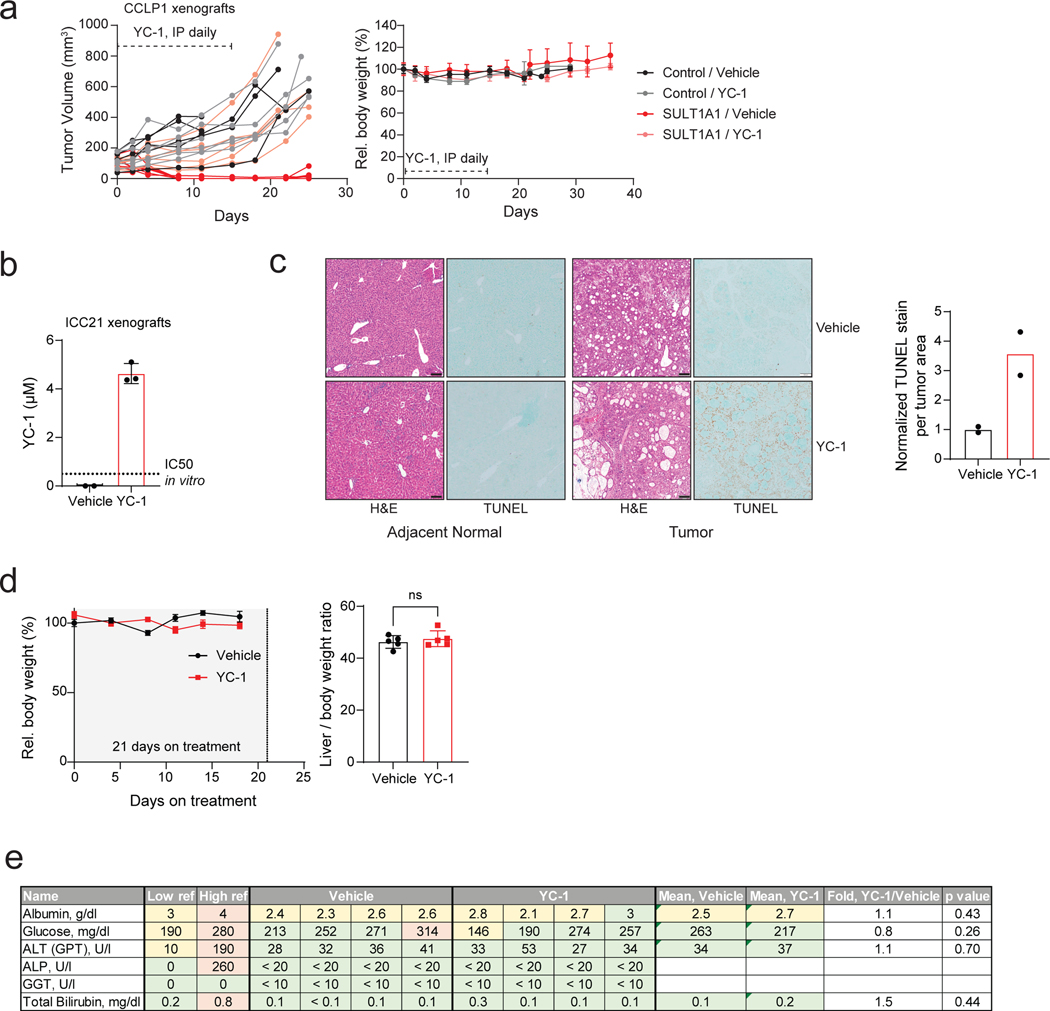
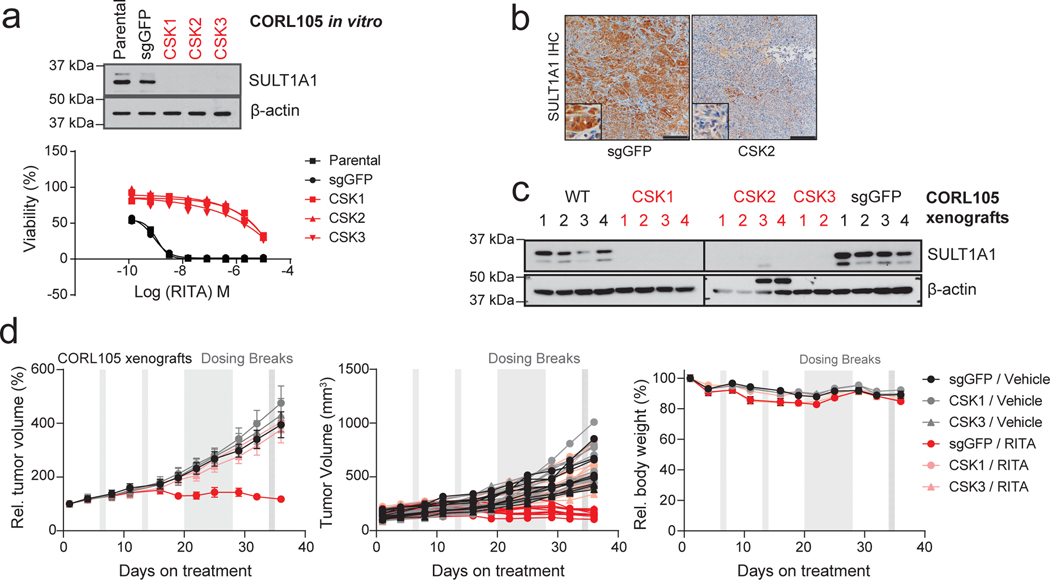
We sought proof-of-concept evidence to support the potential of exploiting SULT1A1-dependent alkylators therapeutically. To this end, we tested in vivo drug response in xenografts generated with pairs of isogenic cell lines, with or without SULT1A1 expression. SULT1A1-positive and control SULT1A1-negative (Control) derivatives of the CCLP1 ICC cell line (Fig. 7a) were injected subcutaneously into immuno-deficient mice, which were subsequently treated with YC-1 (50 mg/kg) or vehicle after tumor reached ~100 mm3. Whereas the SULT1A1-negative tumors were insensitive to YC-1 treatment, the SULT1A1-positive tumors regressed rapidly, with complete response within 8 days (Fig. 7b, c). To test for durability of benefit, treatment was halted after 14 days and the mice were monitored for recurrence. There was a dramatic extension in survival despite this brief treatment course; the median survival of mice in the YC-1-treated SULT1A1-positive group was 58 days versus < 30 days for each of the other groups (44 days after treatment cessation versus < 16 days) (Fig. 7d). No significant loss of body weight was noted in the treated animals (Extended Data Fig. 8a). YC-1 treatment also reduced the growth of subcutaneous and orthotopic xenografts generated from the SULT1A1-high, patient-derived ICC21 cell line (Fig. 7e, f; intratumor YC-1 levels are shown in Extended Data Fig. 8b), Moreover, TUNEL staining demonstrated that YC-1 provoked death of tumor cells but not adjacent normal liver (Extended Data Fig. 8c). There was no apparent liver damage assessed by body and liver weight, histology, and plasma marker levels (Extended Data Fig. 8d, e). To extend these findings to other members of this class of alkylator compounds, we examined the efficacy of RITA (Fig. 5f, g, i) in an additional xenograft model that endogenously expressed SULT1A1 or had CRISPR-mediated SULT1A1 KO (CORL105, Extended Data Fig. 9a). As in the case of YC-1, RITA was active against xenograft growth in a strictly SULT1A1-dependent manner (Extended Data Fig. 9b–d).
Figure 7. SULT1A1 determines YC-1 efficacy in vivo.
a-d, SULT1A1-positive and SULT1A1-negative (Control) CCLP1 cells were implanted subcutaneously into NSG mice. Once tumors reached ~100 mm3, mice were treated with YC-1 (50 mg/kg) or vehicle for 14 days. Mice were then monitored for disease progression in the absence of treatment. b, Graph of serial tumor volumes. Error bars are mean ± SD. c, Waterfall plot of best tumor response under treatment. N = 6 mice per group, except the Control, YC-1 group (N=5 mice)
d, Survival analysis of mice during treatment and after cessation of treatment. N = 6 tumors per group, except the Control, YC-1 group (N=5 tumors). e, ICC21 liver orthotopic xenografts were used to assess YC-1 efficacy. Mice were treated with YC-1 or vehicle for 14 days as above, starting at a tested time point with observable liver mass. Liver and body weight ratio at each end point was used as surrogate for tumor mass. Below dashed line is the range liver and body weight ratio of a healthy mouse liver falls within. Statistical significance annotated comparing treatment conditions. Two independent animals per group are shown. f, ICC21 subcutaneous xenografts were treated with YC-1 or vehicle as above until the vehicle group reached the end point. Error bars are mean ± SEM. n=6 independent animals per group.
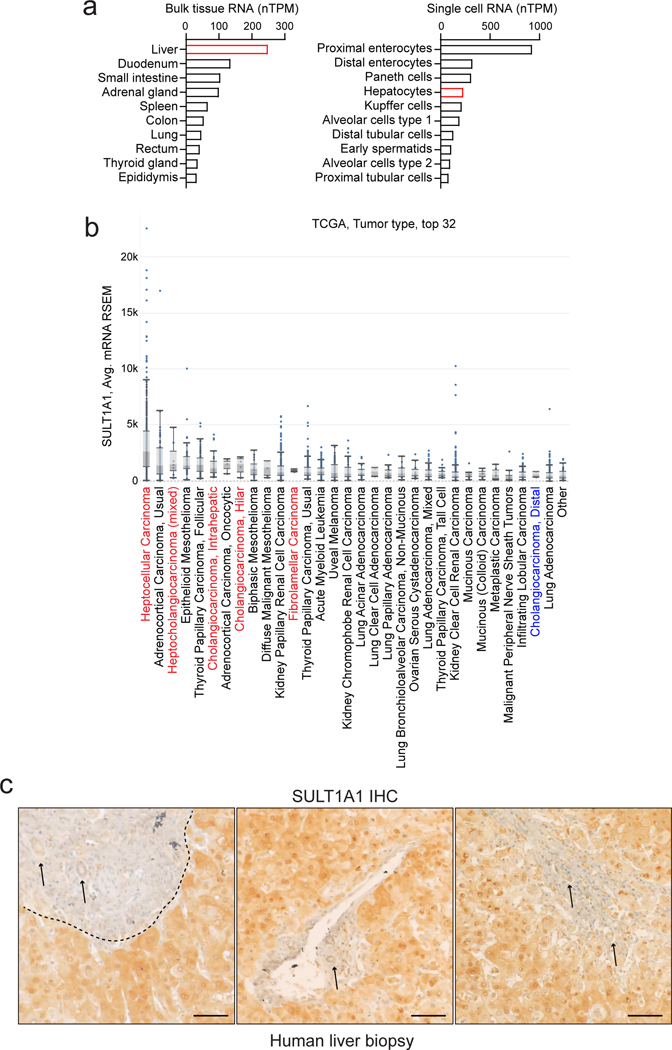
In normal tissues, SULT1A1 is expressed at highest levels in liver, followed by intestine, lung and adrenal gland, with most other tissues lacking significant expression; moreover single-cell RNA sequencing revealed that hepatocytes are among the highest SULT1A1-expressing cell types across organs (Extended Data Fig. 10a, retrieved from https://www.proteinatlas.org/). Similarly, primary HCC patient samples exhibited highest overall expression of SULT1A1 mRNA among >80 cancer types in The Cancer Genome Atlas (TCGA) (retrieved from https://www.cbioportal.org/), and hepato-cholangiocarcinoma and ICC ranked 3rd and 6th, respectively (Extended Data Fig. 10b). To extend these data, we first validated the specificity of a SULT1A1 antibody (shown above, Extended Data Fig. 9a–c) and subsequently performed immunohistochemistry in human specimens. Within the hepatobiliary system, SULT1A1 is largely restricted to hepatocytes, with minimal expression in bile duct cells (Extended Data Fig. 10c). Accordingly, we observed distinct profiles of SULT1A1 expression upon IHC staining of tissue microarrays representing different hepatobiliary malignancies (HCC, n = 63; ICC, n = 118; ECC, n = 19) (Fig. 8a). Ranking staining intensity as high, intermediate, low, and no (negative) expression (Methods), we found that the majority of HCCs (92%) and ICCs (67%) had high or intermediate SULT1A1 levels, compared to 22% of ECCs (p ≤ 0.0001, HCC versus ECC, and ICC versus ECC). Considering only high levels of SULT1A1 expression, ICCs had the highest rate (43%), followed by HCC (25%), and ECC (11%). SULT1A1 staining was specific to the neoplastic cells rather than stromal populations (Fig. 8a, b). Thus, HCC and ICC frequently express high levels of SULT1A1 consistent with their liver lineage origins, highlighting the potential of harnessing SULT1A1-activable compounds therapeutically.
Figure 8. SULT1A1 is frequently expressed in liver cancer patient tumor samples.
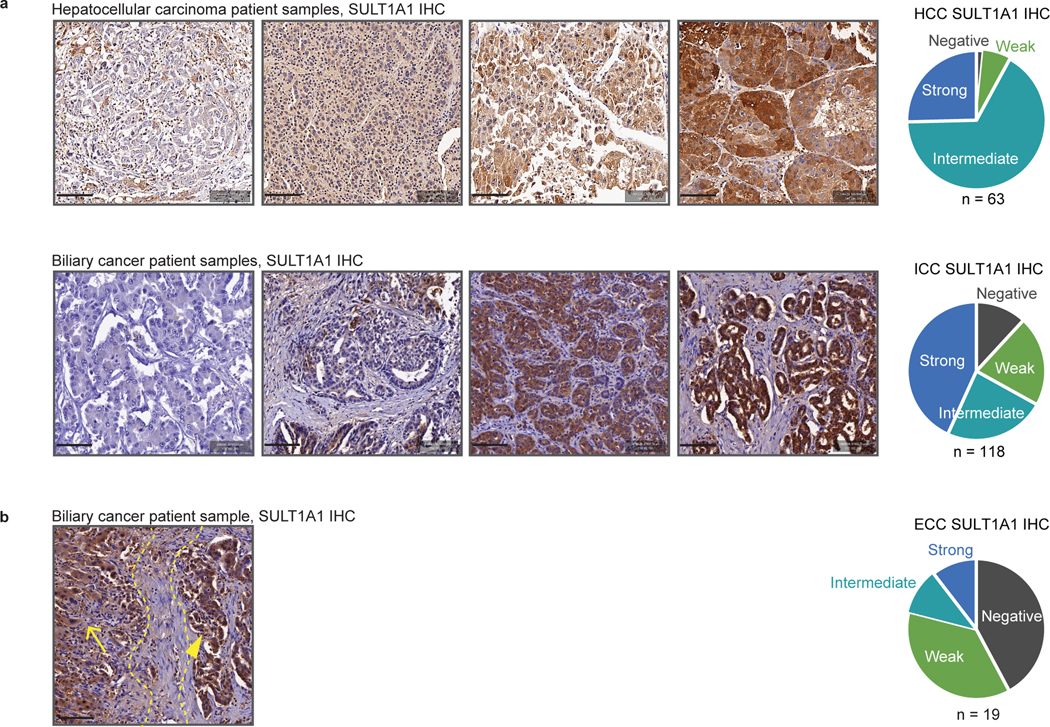
a, Representative IHC staining for SULT1A1 expression in HCC and cholangiocarcinoma (ICC and extrahepatic cholangiocarcinoma [ECC]) patient samples showing examples of negative, low, medium, and high expression. Semi-quantitative measure of staining intensity shown on the pie charts (right). N: Number of samples from independent patients examined (HCC, N = 63; ICC, N = 118; ECC, N = 19). Scale bars span 100 μm each.
b, Representative IHC staining for SULT1A1 expression in ICC patient sample showing SULT1A1 expression in tumor cells (right) and adjacent normal liver hepatocytes (left). 6 tissue cores from 6 cases were analyzed. Yellow dashed lines demarcate the tumor and adjacent normal liver areas, marked by arrowhead and arrow, respectively. Scale bar spans 100 μm.
DISCUSSION
Here, we used drug sensitivity screens, acquired resistance models, and quantitative proteomics to identify the mechanism of action and define biomarkers of responsiveness for the small molecule YC-1. We show that YC-1 is potently active in vitro and in vivo against cancer cells expressing the liver lineage SULT1A1 enzyme. The YC-1 prodrug is converted by sulfonation into an electrophile selectively reactive with lysine residues in proteins, with enrichment for RNA binding proteins. Using large scale drug screening data and basal gene expression profiles of cell lines, we identified a series of other small molecules with common structural features that together represent a class of SULT1A1-dependent anti-cancer agents.
SULT1A1 is highly expressed in a significant subset of ICCs and HCCs. Among ICC cell lines, SULT1A1 expression correlates with a gene expression signature suggestive of an intermediate differentiation state between the hepatocyte and bile duct lineages, with associated specific genomic alterations (involving the IDH1/2, BAP1, and FGFR2 genes). Correspondingly, ICC patient samples with these alterations have been reported to exhibit cholangiolar histology and co-express hepatic progenitor, hepatocyte, and biliary markers20–26. These observations are consistent with the expression of SULT1A1 in normal hepatocytes and the concept that liver cancer types represent a continuum between hepatocyte and biliary phenotypes, in line with the plasticity of these liver lineages10, 11. HCCs and ICCs carry poor prognosis, often lack actionable mutations, and when present, show only moderate responses to targeted therapies. SULT1A1-activated anti-cancer drugs may offer a new avenue for treatment opportunities based on the expression of this biomarker.
We show that YC-1 binds selectively to cellular proteins, particularly via covalent linkage to lysine residues. Oncology applications of covalent inhibitors binding to cysteine and lysine have emerged in recent years. Refinement of the YC-1 scaffold may allow the development of SULT1A1-dependent covalent inhibitors with additional selectivity for protein targets. In this regard, we provide evidence that YC-1 has enriched binding to RNA processing factors and causes aberrant RNA splicing. YC-1 derivatives could serve to expand the landscape of targetable RNA binding proteins, taking advantage of covalency. TARDBP and DDX42 are among the most enriched YC-1 targeted RNA binding proteins. Both are essential for cancer cell viability in vitro, are overexpressed in subsets of HCCs compared to normal liver tissue and show a positive correlation between their expression levels and poor prognosis in HCC patients39–41 (retrieved from https://www.proteinatlas.org). Derivatives of YC-1 could be explored as scaffolds for efforts to target these RNA binding proteins. Nonetheless, we find that YC-1 binds many RNA processing proteins, which challenges identification of cell death-inducing events.
Our SAR studies highlighted the role of furfuryl alcohol in YC-1 activity and suggested that modifications of other regions can potentially enhance sulfonation and improve pharmacokinetic properties (Fig. 5b and Supplementary Table 6). In addition to YC-1, we have identified a broader class of compounds that depend on SULT1A1-mediated sulfonation for their activity against cancer cells. These compounds contain similar chemical moieties that can be sulfonated directly, or after simple metabolic conversion, to activate their alkylating properties. Outside the region of sulfonation, these compounds differ in overall chemical structure, which confer distinct target binding properties (e.g. based on the reported profiles of RITA and N-BIC compared to YC-1, Extended Data Fig. 5d)29, 34. Utilizing these leads with fragment-based discovery approaches could expand the landscape of targetable proteins via covalent binding.
In summary, we present a set of small molecules active against SULT1A1-expressing tumor cells. Further development of these agents could lead to pro-drug approaches to target specific essential proteins in subsets of liver cancers. SULT1A1 expression transcends the genetic landscape and represents a common hepatic lineage marker, covering many liver cancers. Our data on the YC-1-bound proteome suggests the possibility of using these approaches to target RNA binding factors. The other SULT1A1 activated compounds could provide a broader toolkit of covalent anti-cancer agents for additional cellular processes. Furthermore, there is an array of other human sulfotransferases (13 reported SULT family enzymes) with differing target specificity and expression patterns across normal tissues and cancer types19, 40, 41. Comparable strategies could be used to identify sets of small molecules that are activated by the distinct SULT family enzymes highly expressed in different cancer cells and lead to the development of new classes of anti-cancer agents.
Limitations of the study include uncertainty of the SULT1A1 expression level required to activate YC-1, which might complicate the use of SULT1A1 as a biomarker. Further investigation is also needed to pinpoint the molecular mechanism of YC-1-induced cell death from the many binding proteins identified. Moreover, since SULT1A1 is expressed in normal liver, intestine, and lung, development of YC-1 derivatives with a more specific target spectrum and preferable toxicity profiles is warrante
Methods
Ethics statement:
Animal studies adhered to MGH Institutional Animal Care and Use Committee (IACUC) approved protocol 2019N000116. Studies with human specimens were approved by the Office for Human Research Studies (OHRS) at Dana-Farber/Harvard Cancer Center (protocols #19–699, 14–046, and 02–240).
Cell culture.
Cell lines sources included: Riken Bioresource Center (RBE, SSP25, HUCCT1), Korean Cell Line Bank (SNU1079), and ECACC (CORL105). CCLP1 was provided by Dr. Theresa Whiteside (University of Pittsburgh). ICC2, ICC4, ICC5, ICC6, ICC7, ICC8, ICC12, ICC137, ICC19, ICC20, ICC21, ECC3 and GBC1 are derived from patient-derived xenografts using previously described methods14. Cell counting was by trypan-blue exclusion (quantified on Countess Automated Cell Counter, Invitrogen). Cell lines were authenticated by short tandem repeat (STR) DNA profiling and tested regularly for mycoplasma (LookOut Mycoplasma PCR Kit; Sigma, MP0035).
Screening libraries.
Primary screening used the Mechanism Interrogation Plate (MIPE) comprising 1,912 compounds12, NCATS Pharmacologically Active Chemical Toolbox (NPACT)22 comprising 5,099 compounds, and a kinase inhibitor library (977 compounds) (Supplementary Table 1).
Quantitative high-throughput screen (qHTS).
CCLP1, HUCCT1, RBE and SNU1079 cells were seeded into 1536-well white bottom plates using a Multidrop Combi peristaltic dispenser (ThermoFisher, Waltham, MA) at 500 cells/well in 5 μL of medium (above). Screening was as described previously42, with cells treated with compound for 72 hrs then quantified by CellTiter-Glo (Promega) and ViewLux microplate imaging (PerkinElmer, Waltham, MA). See Supplementary Table 11 for assay protocol.
Compound activity was determined by plotting concentration-response data for each sample and modelling by a four-parameter logistic fit, yielding IC50 and efficacy (maximal response) values as previously described42. Plate reads for each titration point were first normalized relative to positive control (2 mM Bortezomib, 0% activity, full inhibition) and DMSO-only wells (basal, 100% activity). In-house informatics tools were used for data normalization and curve fitting. As in prior studies with the qHTS screen, hits ranged widely in potency and there was significant variation in the quality of the corresponding concentration–response curve (CRCs, based on efficacy and number of asymptotes). Samples associated with shallow curves or single-point extrapolated concentration responses were assigned as low-confidence actives. Class −1.1 and −1.2 were highest-confidence complete CRCs (upper and lower asymptotes with efficacies ≥ 80% and < 80%, respectively). Class −2.1 and −2.2 were incomplete CRCs (single asymptote with efficacy ≥ 80% and < 80%, respectively). Class 3 CRCs were active only at the highest concentration or were poorly fit. Class 4 CRCs were inactive (insufficient efficacy or no curve-fit). Area-under-the-curve (AUC) and curve fittings were utilized for activity comparison and identification of selective agents. High confidence hits were defined based on curve class - 1.1, −1.2, −2.1, or −2.2, maximum response of >50%, and IC50 < 10 μM. Screening information are summarized in Supplementary Table 13.
YC-1 sensitivity profiling across >1000 cancer cell lines.
1022 authenticated cancer cell lines from the Genomics of Drug Sensitivity in Cancer platform17 were screened with a 9-point two-fold dilution series of YC-1 at the Center for Molecular Therapeutics at the Massachusetts General Hospital. Area under the dose-response curve and median inhibitory concentration were determined as previously described17. Cell lines sensitive to YC-1 were defined based on their ranked AUC with Z-score < −1.3, p < 0.10. Fraction of cell lines from each cancer type sensitive to YC-1 was calculated by dividing the number of those sensitive to the total number from that cancer type.
Chemistry and Synthesis of YC-1 analogs
A detailed description of the chemical reagents and procedures used for the synthesis of YC-1 analogs and the testing for YC-1 conjugated deoxynucleobases and amino acids can be found as a supplementary document (Chemistry Methods Supplement).
Molecular Modeling.
The three-dimensional structure of SULT1A1 was obtained from the Protein Data Bank (PDB code 3U3M). The structure is complexed with non-sulfated form PAP and 3-Cyano-7-hydroxycoumarin. Prior to molecular modeling and docking, the protein structure was prepared using the MOE program (Molecular Operating Environment [MOE], Chemical Computing Group ULC, Montreal, Canada). Hydrogens were added with standard protonation state. The modeled structure was energy-minimized using the QuickPrep module in the MOE program. The active site was defined by the co-crystal ligand 3-Cyano-7-hydroxycoumarin with 4.5Å pocket extension. YC-1 conformations were generated during MOE docking. Initial docking pose placement used Triangle Matcher and the London dG scoring function. Final pose refinement used Rigid Receptor and the GBVI/WSA dG scoring function.
Caspase 3/7 activity.
Cells were seeded at 10,000 cells/well in 96-well plates. The next day, 1 μM YC-1 was added. After incubation with YC-1 for 24h, caspase 3/7 activity was assessed using a Caspase-Glo® 3/7 Assay (Promega, G8090) according to the manufacturer’s protocol. Data are represented as mean ± s.d. between technical triplicates.
Crystal violet staining.
Cells were seeded at 100,000 cells/well in 6-well plates. The next day, 1 μM YC-1 was added. At specified time points, media was aspirated, cells were washed with PBS, fixed with ice-cold methanol for 20 min, and stained with 0.5% crystal violet in 25% methanol for 20 min at room temperature. Cells were then rinsed in tap water.
Flow cytometry analysis.
For cell-cycle analysis, double thymidine block synchronized cells were released into S phase −/+ YC-1 and labeled with 10 μM EdU for 30 min. Cells were treated with the Click-iT EdU Alexa Fluor 647 Flow Cytometry Assay Kit according to the recommended protocols (Thermo Fisher). Data acquisition was performed on a FACS LSRII apparatus equipped with the FACS Diva software (BD Biosciences). Our gating strategy is summarized in Supplementary Figure 1.
In vitro resistance model.
RBE and SNU1079 cells were plated in six replicates. Nine step-concentrations of YC-1 from IC10 to IC90 were calculated for the parental cells. These concentrations were used to serially treat cells, with concentrations being raised by one step once cell growth was observed for two passages. RBE cells adapted after 2–3 months. The six independent YC-1 resistant clones remained insensitive to two orders of magnitude greater YC-1 concentrations relative to the IC50 of parental RBE cells. SNU1079 cells were refractory to this assay, with no clones growing beyond a three-step increase in YC-1 concentration.
Plasmids and Transduction.
To generate SULT1A1 knockout cells, sgRNAs were cloned into pLentiCRISPRv2 (Addgene #52961) (Supplementary Table 12 shows sequences). These plasmids were used to generated virus by transfection of HEK293T cells with pCMV-VSV-G (Addgene) and dCMV-dR8.91 packaging plasmids. Collected virus was filtered through 0.45 micron filters and used to spin-infect target cells with 8 μg/mL polybrene (Millipore, #TR-1003-G) at 2250 RPM and 37°C for 60 minutes. After 24 hours, cells were selected in 2 μg/mL puromycin for at least 3 days and pooled populations were first tested for SULT1A1 knock-out via immunoblot. Human SULT1A1 (variant allele, V223M) was cloned from SNU1079 mRNA (forward primer ATCGAGATCTGCCACCATGGAGCTGATCCAGGACAC and reverse primer ATCGCTCGAGTCACAGCTCAGAGCGGAAGC). cDNA was inserted into pMSCV-Blast. Since several SULT1A1 polymorphic variants are common in populations and may confer distinct substrate affinity, we also created constructs with the variants, V220M V223M F247L and S44N V164A V223M. Site-directed mutagenesis (New England Biolabs) was used to create SULT1A1 expression vectors resistant to CRISPRv2 gRNA in order to reintroduce SULT1A1 into knockout cells while not affecting the amino acid sequence (see Supplementary Table 12). MSCV-derived plasmids were used to generate viruses in combination with pCL-ECO and pCMV-VSV-G packaging plasmids. Successfully transduced target cells were selected with 10 μg/mL blasticidin for one week.
Immunoblotting.
Cell lysis, electrophoresis, immunoblotting were performed as previously43, using 20 μg of lysates run on 10% to 12% SDS-PAGE gels or on 4–20% Biorad Mini-PROTEAN precast gels (for YC-1 affinity binding studies). PVDF membranes (GE Healthcare) were probed with antibodies against SULT1A1 (PA5–81053; Thermo Scientific, 1:5000 dilution) or β-actin (Sigma, A5316, 1:10,000 dilution), TARDBP (Proteintech, 10782–2-AP, 1:2000 dilution), DDX42 (Bethyl Laboratories, A303–353A-T, 1:1000 dilution), CNOT1 (Proteintech, 14276–1-AP, 1:1000 dilution), PTBP1 (Proteintech, 12582–1-AP, 1:5000 dilution), ELAVL1 (Proteintech, 11910–1-AP, 1:5000 dilution), P4HB (CST, 3501S, clone C81H6, 1:2000 dilution), ANLN (Bethyl Laboratories, A301–406A-T, 1:5000 dilution), VIM (CST, 5741S, clone D21H3, 1:1000 dilution), ACTN4 (CST, 15145S, D7U5A, 1:1000 dilution), MYH9 (CST, 3403S, 1:1000 dilution), or HSP90AA1 (Santa Cruz Biotechnology, sc-13119, F-8, 1:500 dilution). Detection was performed with horseradish peroxidase–conjugated secondary antibodies (Vector Laboratories: Anti-rabbit, PI-1000–1, 1:10,000 dilution; and anti-mouse, PI-2000–1, 1:10,000 dilution), and SuperSignal West Pico Luminol/Enhancer Solution (Thermo Scientific).
Dose-Response Assays.
Drug-response was assessed by plating cells in 96 well plates. Growth was quantified using MTT colorimetric assay read at 490 nm. Each assay was performed at least twice, with the exception of the studies in Figure 2b, in which case multiple independent YC-1 resistant lines and replicate parental lines were analyzed in a single assay. IC50 curves were generated from two biological replicates (except for Fig 2b, employing technical replicates) and analyzed with GraphPad Prism 8.
SULT1A1 activity assay.
A colorimetric assay for SULT1A1 activity was adapted from Rothman et al., 201529. MES buffer (pH 7.5), p-nitrophenyl sulfate (5 mM), test substrate (YC-1 or YC-1 derivatives), and PAPS (0.02 mM) were added onto a 96-well plate. The reaction was initiated via addition of recombinant SULT1A1 (20 ng/μL, or 580 nM) and monitored over time at absorbance of 405 nm.
Computational identification of SULT1A1 activatable compounds.
Identification of compounds with similar response profiles to YC-1 and/or with a correlation between SULT1A1 expression and sensitivity were performed using the NCI Developmental Therapeutics Program database (NCI-60)43, the PRISM lab at the Broad Institute49, the Cancer Therapeutics Response Portal (CTRP) at the Broad Institute75, and the GDSC project at the Sanger Institute27. For analysis of the PRISM (Depmap.org), CTRP and GSDC databases, the input was YC-1 sensitivity profile across all cancer cell lines (Supplementary Table 3) and the output was compounds from each database with Pearson correlation score to YC-1 profiles. For analysis on DTP NCI-60 database, Cellminer (https://discover.nci.nih.gov/cellminer/) was queried with input of YC-1 (NSC 728165) for similar sensitivity patterns to YC-1, and with SULT1A1 mRNA levels for identification of potential SULT1A1 activatable compounds. The top ~150 correlating compounds from these queries were manually curated to identify a putative chemical moiety for SULT1A1 sulfonation and to group by structural features.
Immunofluorescence of intracellular YC-1 biotin.
The predicted covalent binding of YC-1 suggested opportunities to track its cellular uptake and localization via immunofluorescence. Briefly, cells were seeded into 6-well plates on collagenized glass coverslips. YC-1 biotin treated cells were washed three times with PBS, fixed at room temperature in 4% paraformaldehyde in PBS for 15 min with light agitation, washed three times with PBS, permeabilized and blocked for 30 min with 1% whole goat serum in 0.1% Tween in PBS (0.1% PBS-T). Next, 4′,6-diamidino-2-phenylindole (DAPI) (Molecular Probes) and streptavidin, Alexa Fluor 488 conjugate (Thermo Fisher, S11223) was added for 30 min in 0.1% PBS-T with light agitation at room temperature. Cells were washed three times with PBS and mounted with ProLong Gold Antifade reagent (Molecular Probes). A Nikon Eclipse Ti inverted fluorescent microscope with an oil-immersed 60× objective was used for imaging. Linear range of intensity and no thresholding was used for acquired images. Consistent filter settings for DAPI, and 488 FITC channels were used for sequential scans.
Quantitative proteomics.
Cells were lysed and prepared for tryptic digest as previously described44. Peptides (50 μg) were labeled using TMT reagents (Thermo Fisher), combined, and fractionated using basic reversed phase HPLC. Fractions were analyzed by reversed phase LC-MS2/MS3 for 3 h on an Orbitrap Fusion or Lumos. MS3 isolation for quantification used Simultaneous Precursor Selection (SPS) as described45. MS2 spectra were assigned using SEQUEST by searching against the Uniprot database on an in-house built platform. A target-decoy database-based search was used to filter false-discovery rate (FDR) of protein identifications of < 1%46. Peptides that matched to more than one protein were assigned to that protein containing the largest number of matched redundant peptide sequences following the law of parsimony. TMT reporter ion intensities were extracted from the MS3 spectra selecting the most intense ion within a 0.003 m/z window centered at the predicted m/z value for each reporter ion and spectra were used for quantification if the sum of the S/N values of all reporter ions divided by the number of analyzed channels was ≥ 20 and the isolation specificity for the precursor ion was ≥ 0.75. Protein intensities were calculated by summing the TMT reporter ions for all peptides assigned to a protein. Intensities were first normalized using a bridge channel (pooled digest of all analyzed samples in an experiment) relative to the median bridge channel intensity across all proteins. In a second normalization step protein intensities measured for each sample were normalized by the average of the median protein intensities measured across the samples.
For affinity-enriched proteomics profiling, after washing, beads were resuspended in 50 mM HEPES (pH = 8.5), reduced and alkylated. 8 M urea solution is added to a final concentration of 1M. After tryptic digest, 1/3 of the resulting peptides of each sample were labeled using TMT-10plex reagents. Labeled samples were combined and analyzed in a 3h reversed phase LC- MS2/MS3 run on an Orbitrap Lumos.
Testing for YC-1 conjugated deoxynucleobases and amino acids.
DNA adducts:
We adapted published methods47 to test whether YC-1 forms DNA adducts. YC-1-treated RBE cells were lysed and deoxynucleobases were released from DNA by enzymatic cleavage of glycosidic bonds. Samples were analyzed by LCMS to detect presence of molecular species with predicted mass-charge-ratio of YC-1 conjugating to each of the four deoxynucleobases. While the method demonstrates high sensitivity, detecting trace amounts of colibactin DNA adduct47, we did not observe evidence supporting YC-1 conjugation to DNA. In addition, the extracted DNA from YC-1 biotin treated RBE cells with SULT1A1 overexpression was subjected to dot blotting for affinity detection of YC-1 biotin DNA adduct using streptavidin-HRP. There was no signal of streptavidin-HRP retained on the DNA spotted nylon membrane.
Protein adducts:
Nucleic-acid free protein extracts generated from YC-1 Biotin and DH-YC-1 Biotin treated cells as above, and were subject to dot blotting and detection with streptavidin HRP (Fig. 6b and Extended Data Fig. 6a). LCMS was used to detect YC-1 conjugated amino acids as detailed in a supplementary note (Chemistry Methods Supplement).
Computational analysis of YC-1 binding proteome.
51 significant YC-1 binding proteins were filtered by a binding score of Log2FC (IP/Control) > 1. IP/Control denotes ratio of abundance of each protein pulled down by YC-1 biotin relative to inactive YC-1 biotin treatment. Significant binders were analyzed for Gene Ontology by the Gene Set Enrichment Analysis tool, EnrichR (https://maayanlab.cloud/Enrichr/). To generate Fig. 6f (plot on left), the top enriched terms from the GO_Biological Process and GO_Molecular Function database were plotted with bubble size indicating the significance score of -Log10FDR (Supplementary Table 10). The bar graph in Fig. 6f was based on an integrative analysis using the InterPro protein domain database by EnrichR. For comparative analysis between YC-1 binders and most abundantly expressed genes (Extended Data Fig. 6d), enriched terms from GO_Biological Process and GO_Molecular Function were derived from EnrichR utilizing the 500 most abundantly expressed genes based on RNA-seq data. The odds ratios of the enriched terms among YC-1 binding proteins were compared with the enriched terms derived using the most abundantly expressed genes. Fig. 6g was generated by selecting and graphing the most contrasting terms between YC-1 binders and most abundantly expressed genes.
YC-1 biotin affinity enrichment of proteins.
RBE cells overexpressing SULT1A1 (RBE CSK2 R4) were treated with YC-1 biotin, YC-1 biotin + YC-1 parent competition, or inactive DH-YC-1 biotin for 7–8 hours. Cell lysates were prepared in nucleic acid depleting buffer (137 mmol/L NaCl, 1% NP-40, 20 mmol/L Tris pH 8.0, 1mM MgCl2, 1mM CaCl2, 1:500 benzonase from Millipore #70746) containing protease inhibitors (Complete; Roche) and phosphatase inhibitors (Phosphatase Inhibitor Cocktail Sets I and II; Calbiochem). After BCA Protein Assay (Thermo Fisher Scientific), YC-1 biotin bound proteins were enriched by incubating cell lysates with streptavidin conjugated agarose beads (Thermo Fisher, #20347). After multiple denaturing washes, YC-1 biotin bound proteins were either processed for mass spectrometry by direct trypsin digestion or eluted for affinity blotting by boiling with SDS sample buffer. For reverse co-immunoprecipitation, clarified protein lysate from RBE CSK2 R4 cells was incubated with protein G-Dynabeads (Invitrogen, 10004D) conjugated with TARDBP antibody. Immune complexes were washed and analyzed via SDS–PAGE and western blotting. Immunoglobulin G antibody was used as a control.
RNAseq.
RNA extracted from RBE and SNU1079 cells (treated with YC-1 or vehicle) using Qiagen RNeasy Plus Mini kit was processed using the TruSeq Stranded mRNA Library Preparation Kit (Illumina). Samples were run on Nextseq 500 (Illumina). Reads were aligned to the human reference genome hg38 using STAR (v2.5.3a). Transcript-levels were quantified using SALMON (v0.9.1). Count data extraction and normalization and comparison were performed using Tximport and DESeq2, respectively (Bioconductor). To analyze RNA splicing, BAM output files from RNAseq alignments were sorted and indexed using SAMtools. Insert length was calculated by pe_utils –compute-insert-len. Expression levels (psi)for retained introns and skipped exons were obtained using MISO48. Alternative event annotations of hg38 were generated by rnaseqlib. For filtering events, only events with 10 supporting reads for inclusion or exclusion isoform and 20 supporting reads for all isoforms was used. The mean PSI value of all filtered retained introns and skipped exons was used as the event score.
TARDBP splicing assay.
We adapted a published TARDBP splicing assay38. A plasmid (Addgene, #107859) containing mEGFP fused to mCherry, interrupted by CFTR exon 9 (bound by and skippable with functional TARDBP), was introduced transiently into SULT1A1-overexpressing or control 293T cells. Following YC-1 (200 nM) or DMSO vehicle treatment, single-cell fluorescence images were captured with GFP (488 nm) and RFP (561 nm) laser using confocal Nikon A1R microscopy and analyzed with ImageJ. TARDBP splicing activity was calculated by normalized ratio of RFP to GFP from over 500 cells using 3–5 images in triplicate experiments.
Xenograft studies.
Immunodeficient mice (NOD-scid IL2Rgammanull strain), age 6–10 weeks, were housed in pathogen-free animal facilities. Studies were under protocol 2019N000116 approved by MGH IACUC, whose regulations for maximum tumor size (<2 cm in greatest diameter) were strictly adhered to. CCLP1 cells (2 × 10⁶ cells) exogenously expressing SULT1A1 or empty vector control were injected subcutaneously into recipient mice (both sexes). When tumor volume reached ~100 mm3, mice were randomly assigned to YC-1 or vehicle group (5–6 mice/group, efforts made to balance sex). The mice were treated with intraperitoneal injection of DMSO dissolved YC-1 (50 mg/kg daily, for 14 days). Tumor volumes were measured twice/week. When tumors became ulcerated or exceeded 1000 mm3, mice were euthanized and tumor samples were collected. For histology, tissue samples were fixed overnight in 10% formalin, embedded in paraffin, sectioned, and stained with hematoxylin and eosin.
Orthotopic models were performed using 500,000 ICC21 cells injected into the liver49. Sex was not considered for selection of mice, but considered for balancing when grouping. Pilot studies were conducted to define the engraftment and growth kinetics of the orthotopic tumor model, showing that tumors developed by 6 weeks and reached the end point by 8 weeks. Thus, treatment studies were initiated at 6-weeks post-injection. Researchers were not blinded during the conduct of the experiments. Both sexes of mice were used and showed similar tumor growth.
Histology and immunostaining.
Sample fixation, embedding, sectioning, and staining was performed by iHisto (Salem, MA) as described previously49. For antigen unmasking, specimens were heated in a 2100 Antigen Retriever (Aptum Biologics, Southampton, UK) in Antigen Unmasking Solution (H-3300, Vector Laboratories), rinsed 3 times with PBST, incubated for 10 min with 1% H2O2 at room temperature, and washed 3 times with PBST. After blocking (5% goat serum in PBST) for 1 h, tissue sections were incubated at 4˚C overnight with anti-SULT1A1 (Thermo Fisher, CF501838, clone OTI1G10) diluted 1:200 in blocking solution. Samples were washed three times for 3 min each in PBST and incubated with MACH 2 Rabbit HRP-Polymer (Biocare Medical, RHRP520) for 1h at room temperature. Slides were stained for peroxidase for 3 min with the DAB (Diamine-benzidine) substrate kit (Biocare Medical, DS900), washed with water and counterstained with hematoxylin. TUNEL staining (R&D Systems, 4810–30-K) was performed according to the manufacturer’s protocol. Slides were photographed with an Olympus DP74 microscope. SULT1A1 staining intensity was evaluated semi-quantitatively in tumor slides by a gastrointestinal cancer pathologist (V. D.) who was blinded to the origin of the tissue. Tissue microarrays (3 mm cores) were constructed from resected patient samples (N=200 patients). Information on sex and age was not available. These studies were approved by the Institutional Review Board in the Office for Human Research Studies (OHRS) at Dana-Farber/Harvard Cancer Center under protocols #19–699, 14–046, and 02–240.
Statistics and Reproducibility
Data distribution was assumed to be normal but this was not formally tested. No statistical methods were used to pre-determine sample sizes but our sample sizes are similar to those reported in previous publications43, 50. Pathology and IHC allocations were blind to the gastrointestinal cancer pathologist during semi-quantitative outcome assessment. Other data collection and analysis were not performed blinded to the conditions of all experiments. No data were excluded from the analyses and randomization was limited to the in vivo experiments. Experimental results were reproducible across multiple (2 times or more) independent biological replicates, shown with 2–3 replicates.
Reporting summary
Further information on research design is available in the Nature Research Reporting Summary linked to this article.
Data availability
The RNA sequencing dataset assessing YC-1 treatment has been deposited to the Gene Expression Omnibus (GEO), available with accession number GSE168791. Mass spectrometry raw data can be accessed through the MassIVE data repository (massive.ucsd.edu) under accession numbers MSV000090805 and MSV000090808. The human pan-cancer data were derived from the TCGA Research Network: http://cancergenome.nih.gov/. The data-set derived from this resource that supports the findings of this study is available in https://ucsc-xena.gitbook.io/project/cite-us
Complete source data for all figures are provided as Source Data files. All other data supporting the findings of this study are available from the corresponding authors on reasonable request.
Extended Data
Extended Data Figure 1. Characterization of cellular response to YC-1.
a, RBE cells were treated with YC-1 (1 μM) or vehicle for the indicated times and then stained with crystal violet. Data are quantified in the lower graph. Error bars are mean ± SD. Data shown were from one of the three performed experiments with similar results. b, RBE cells synchronized at the entry of S phase by double thymidine block were treated with YC-1 (1 μM) or vehicle and at the same time released into S phase. The DNA content (PI) and DNA synthesis (EdU incorporation) were analyzed after 4 hours by flow cytometry. Refer to Supplementary Figure 1 for gating strategy. c, Cleaved caspase-3 assay showing that YC-1 selectively induces apoptosis in responsive ICC cell lines (RBE and SNU1079 are IDH1 mutant). Error bars are mean ± SD. Data shown were from one of the two performed experiments with similar results. d-g, Analysis of RBE cells treated with YC-1 or DMSO. (d) Quantitative proteomics for cyclin and CDK protein levels, n = 2 biologically independent cell lines (RBE and SNU1079); Immunoblots for (e) cell cycle markers and (f) stress response markers. (g) Heatmap of YC-1 induced gene expression changes in p53 and apoptosis pathways.
Extended Data Figure 2. YC-1 sensitivity does not correlate to known mechanisms of action.
a, A panel of cancer cell lines, including IDHm and IDH WT ICC cells lines used in the initial chemical screens (shaded columns), were profiled for sensitivity to known HIF1α inhibitors and sGC agonists with highest dose of ~40 μM covering the effective range. Square size denotes sensitivity (AUC) of each cell line to a given compound, square color denotes the efficacy of the compound. b, Scatter plot of normalized CRISPR dependency scores (DepMap) of HIF1A, HIF2A (EPAS1) and VHL (as control) in hepatobiliary cell lines. Immunoblots in (e) and (f) were performed two times with similar results. Error bars (a, c, d) are mean ± SD.
Extended Data Figure 3. YC-1 sensitivity is determined by SULT1A1 expression levels.
a, Correlation between SULT1A1 mRNA and protein across biliary tract cancer cell lines. Significance was analyzed using two-tailed Student’s t-test. P < 0.05 was considered statistically significant. b, RBE control cells (parental and sgGFP cells) or CRISPR-induced SULT1A1 KO derivatives (CSK1–6) were tested for sensitivity to YC-1 (left) or dasatinib (right). SSP25 is an insensitive cell line shown as reference. Immunoblot confirming loss of SULT1A1 is shown in (c). d, ICC20 control sgGFP engineered cells or SULT1A1 KO derivatives (CSK1–3) were tested for sensitivity to YC-1 (left) or dasatinib (right). Immunoblot confirming loss of SULT1A1 is shown in (e). f, Schematic of CRISPR-resistant SULT1A1 expression constructs. g, Scatter plot showing ectopic expression of SULT1A1 sensitizes twelve hepatobiliary cancer cell lines to YC-1. The murine hepatocyte cell line, AML12, is not sensitized. Asterisk denotes IC50 value too high to extrapolate. h, Immunoblot of CCLP1 and SSP25 cells engineered to overexpressed naturally occurring SULT1A1 variants. i, YC-1 sensitivity of CCLP1 cells expressing SULT1A1 or SULT1A3. SULT1A1–1 (SULT1A1 V220M, V223M, F247L); SULT1A1– 2 (SULT1A1 S44N, V164A, V223M); SULT1A1–3 (SULT1A1 V223M). Immunoblots (c, e, h) were performed two times with similar results. Two biologically independent replicates are shown (b, d, i right). Error bars in k, left panel are mean ± SD. n=4 biologically independent experiments.
Extended Data Figure 4. SULT1A1 expression associates with hepatocyte lineage.
a, Full heatmap of hepatocyte protein expression in ICC cell lines according to GSEA using the phenotype of SULT1A1 protein levels. Serves as supporting data for Fig. 4b. b, SULT1A1 protein expression in biliary cancer PDXs. Corresponding genomic markers are annotated for hot-spot IDH1/IDH2 mutations, FGFR2 fusions, and mutation of BAP1.
Extended Data Figure 5. Benzyl alcohol moiety determines YC-1 toxicity and defines a class of SULT1A1-activatable compounds.
a, Schematic of SULT1A1-mediated sulfonation reaction in modulating xenobiotic solubility. b, Response of RBE cells (IC50) to parent YC-1 or dehydroxlated analog. Two biologically independent experiments are shown. c, Computational modeling showing 2-dimentional depiction of YC-1 molecular interactions with amino acid residues within SULT1A1 catalytic site. Serves as supporting data for Fig. 4c. d, Exemplar compounds of each chemical group identified from the NCI-60 database as having activity profiles similar to YC-1. e, Scatter plot showing correlation between YC-1 and RITA sensitivity profiles across 398 cancer cell lines. Relative SULT1A1 mRNA levels are depicted by the color scheme. f, Graph showing the ranked activity of AHBA series compounds in terms of differential sensitivity toward SULT1A1-high cells (RBE and SNU1079) versus SULT1A1-low cells (SSP25 and CCLP1) (y-axis). The color code represents the average sensitivity (AUC) of SULT1A1-high cells to each analog. Bubble sizes denote significance (p-value). Significance was analyzed using two-tailed Student’s t-test. P < 0.05 was considered statistically significant.
Extended Data Figure 6. Proteomic identification of YC-1 binding targets.
a, Dot blot of protein lysates from RBE parental cells (WT) RBE cells overexpressing SULT1A1 were treated with YC-1 biotin or DH-YC-1 biotin. Blots were probed with HRP-conjugated streptavidin (left). Ponceau S staining serves as the total protein loading control (right). b, Proteins extracted from RBE cells treated with YC-1 Biotin or DH-YC-1 Biotin were subjected to streptavidin affinity purification, digested to single amino acids, and analyzed by mass- spectrometry. Top: Heat map representing YC-1-conjugated amino acids. Bottom: Heat map representing amino acids not conjugated to YC-1 and serving to illustrate relative amino acid content of the purified proteins. c, Schematic of the predicted electrophilic reaction between sulfonated YC-1 biotin and lysine residue in proteins. d, Bar chart of odds ratios of enriched Gene Ontology classes among YC-1 binding proteins (bars to the left) in comparison to those from the most expressed 500 genes in RBE cells (bars to the right). e, Scatter plot of specific YC-1 binding score (x-axis) and probability of gene dependency from the Broad DepMap (y- axis) of YC-1 binding proteins. In (e), color code indicates proteins with common RNA binding domains identified by EnrichR analysis.
Extended Data Figure 7. YC-1 covalently binds RNA processing factors and influences RNA splicing.
a, Immunoblot from streptavidin affinity purification validating YC-1 binding proteins. RBE cells were treated with YC-1 biotin or DH-YC-1 biotin control in the presence of excess non- biotinylated YC-1 or DH-YC-1 as indicated. Left: Expression of candidate YC-1 binding proteins in whole cell lysates. Right: Immunoblot after Streptavidin capture, showing dose-dependent competition by parent YC-1. b, Immunoblot from TARDBP immunoprecipitation validating direct YC-1 binding. RBE cells were treated as in (a). The immunoblots (a, b) were performed two times with similar results. c, Scatter plot of genes with altered intron retention identified from RNA-seq analysis of RBE and SNU1079 cells treated with YC-1 or vehicle for 6 and 16 hours. N = 3 biological replicates per condition. ΔRI is the intron retention score calculated by the SALMON software package. d, Left, a TARDBP splicing efficiency assay assessing SULT1A1 dependent YC-1 impact on TARDBP RNA splicing activity. 293T cells exogenously expressing SULT1A1 or empty vector were transiently transfected with the reporter module containing plasmid and treated with YC-1 or DMSO vehicle and analyzed by fluorescent confocal microscope with GFP (G) and mCherry (R) laser. Statistical significance annotated between individual conditions (Welch unpaired t-test). n=3 biologically independent experiments with cells from two independent images per experiment included (>500 cells in total). “n.s.” denotes not significant. Right, YC-1 sensitivity assay confirming stable SULT1A1 expression. Two biologically independent experiments are shown. e, siRNA targeting TARDBP (left) or DDX42 (right) reduced target protein expression and cell number monitored for 5–6 days post transfection. Error bars in left panel are mean ± SD. Data shown were from one of the two performed experiments with similar results.
Extended Data Figure 8. SULT1A1 determines YC-1 efficacy in vivo.
a, SULT1A1-positive and SULT1A1-negative (Control) CCLP1 cells were implanted subcutaneously into NSG mice. Once tumors reached ~100 mm3, mice were treated with YC-1 (50 mg/kg) or vehicle for 14 days. Mice were then monitored for disease progression in the absence of treatment. Left: Graph of individual serial tumor volumes. These data are presented in the form of mean volumes in Figure 6b of the main figures. Right: Serial changes in body weight. Error bars are mean ± SEM. n=5–6 independent animals per group. b-e, Study of SULT1A1-high expressing ICC21 xenografts in response to YC-1 treatment. b, YC-1 concentration was assayed with three independent ICC21 xenograft tumor samples with YC-1 or vehicle treatment by mass spectrometry. Dashed line marks the in vitro ICC21 sensitivity to YC-1 treatment (IC50). Error bars are mean ± SD. n=3 independent samples per group. c, Tissue sections of ICC21 orthotopic tumors (middle panels) and adjacent normal (left panels) subjected to H&E and TUNEL staining. TUNEL staining was quantified in graph at the right and two independent animals per group are shown. Scale bar, 100 μm. d, Serial changes in body weight (left) were monitored for three weeks for subcutaneous tumor-bearing mice on YC-1 treatment and the liver and body weight ratios (right) were recorded at the euthanization point. Error bars are mean ± SEM. n=5 independent animals per group, two-tailed, unpaired Student’s t-test. e, table displaying plasma markers indicative of liver function from vehicle and YC-1 treated mouse plasma samples (p values derived by two-tailed, unpaired Student’s t-test).
Extended Data Figure 9. SULT1A1 determines RITA efficacy in vivo.
a-d, Study of SULT1A1-dependent sensitivity of CORL105 xenograft model to RITA. CORL105 is an IDH1-R132C mutant lung adenocarcinoma cell line with high endogenous SULT1A1 levels, which has robust growth in vivo. a, Generation of CORL105 derivatives with CRISPR- mediated SULT1A1 KO. Upper, Immunoblot showing loss of SULT1A1 protein expression upon CRISPR-mediated deletion of SULT1A1 (CSK1–3) and robust SULT1A1 detection in parental CORL105 cells and control sgGFP cells. The immunoblot was performed two times with similar results. Lower, demonstration that CORL105 cells are highly sensitive to RITA in a SULT1A1- dependent manner. Two biologically independent experiments are shown. b, Representative immunohistochemistry staining from CORL105 control (sgGFP) and SULT1A1 KO (CSK2) xenografts, showing loss of staining with the SULT1A1 antibody in the SULT1A1 KO model.
Serves as validation of SULT1A1 antibody specificity for IHC studies. Similar results were obtained in samples from 2–4 independent animals per group and three groups with independent sgRNA designs targeting SULT1A1 gene. Scale bar, 200 μm. c, Immunoblot confirming SULT1A1 protein loss in xenograft tumors generated from SULT1A1 KO CORL105 cells. The immunoblot was performed a single time, with multiple independent tumors analyzed per condition. d, Mice harboring tumors of 100–150 mm3 were treated with RITA (100 mg/kg) or vehicle daily with intermitted dosing breaks. Graphs show serial monitoring of group tumor volume (left), individual tumor volume (middle) and body weight (right). Dosing breaks are denoted by grey shading. Error bars are mean ± SEM . n=5–10 independent animals per group.
Extended Data Figure 10. SULT1A1 expression is prominent in liver cancers.
a, Normalized SULT1A1 RNA expression across bulk normal tissues (left, top 10) and single cell types (right, top 10) in human body (retrieved from proteinatlas.org). b, Box and whisker plot derived from TCGA analysis of SULT1A1 expression in patient samples showing top 32 tumor types ranked by median SULT1A1 mRNA expression. Liver cancer types (x-axis) are coded red. Note that extrahepatic cholangiocarcinoma is negative for SULT1A1 (coded blue). The center of the box indicates the median, upper and lower lines indicate upper and lower quartiles and the mark with the greatest and lowest values indicate maximum and minimum. c, Representative immunohistochemical images of SULT1A1 staining in normal human liver from multiple patients, demonstrating expression in the hepatocytes. Arrows point to normal bile ducts with no SULT1A1 staining. Similar results were obtained from multiple samples from independent patients that were processed at independent times. Scale bar, 200 μm.
Supplementary Material
Acknowledgements
We thank Yindi Jiang (Department of Chemistry and Chemical Biology, Harvard University) for helpful scientific discussions and experimental assistance. We thank Dr. Dingyin Tao and Dr. Elias Padilha (both from NCATS) for performing metabolite experiments. This work was supported by the MGH Fund for Medical Discovery Award (to L. Shi), the Cholangiocarcinoma Foundation Christopher J. Wilke Memorial Research Fellowship (to L. Shi), NIH/NCI 1K99CA245194-01 (to L. Shi), the V Foundation for Cancer Research (to N. Bardeesy, and C.H. Benes), DOD Translational Team Science Award W81XWH-17-1-0491 (to N. Bardeesy), NCI SPORE P50 CA127003 (to L. Shi, N. Bardeesy, and C.H. Benes), and the Gallagher Chair in Gastrointestinal Cancer Research, and Target Cancer Foundation (to N. Bardeesy).
Footnotes
Competing Interests statement
Patent applications for the drug uses detailed in this manuscript have been filed by L. Shi and N. Bardeesy. N Bardeesy reports research funding from Kinnate Biopharma, Taiho Oncology, Relay, Bristol Myers Squibb, and Servier Laboratories. B. Stanger has received consulting fees from Boehringer-Ingelheim an iTeos Therapeutics. D. Ting is a founders of and owns equity in TellBio, Inc., ROME Therapeutics, and PanTher Therapeutics, and has received consulting fees from Merrimack Pharmaceuticals, Ventana Roche, Foundation Medicine, Inc., and EMD Millipore Sigma. The authors declare no other competing interests.
References
- 1.Bray F. et al. Global cancer statistics 2018: GLOBOCAN estimates of incidence and mortality worldwide for 36 cancers in 185 countries. CA Cancer J Clin 68, 394–424 (2018). [DOI] [PubMed] [Google Scholar]
- 2.Dasgupta P. et al. Global Trends in Incidence Rates of Primary Adult Liver Cancers: A Systematic Review and Meta-Analysis. Front Oncol 10, 171 (2020). [DOI] [PMC free article] [PubMed] [Google Scholar]
- 3.Valle JW, Kelley RK, Nervi B, Oh DY & Zhu AX Biliary tract cancer. Lancet 397, 428–444 (2021). [DOI] [PubMed] [Google Scholar]
- 4.Llovet JM et al. Molecular pathogenesis and systemic therapies for hepatocellular carcinoma. Nat Cancer 3, 386–401 (2022). [DOI] [PMC free article] [PubMed] [Google Scholar]
- 5.Cancer Genome Atlas Research Network. Electronic address, w.b.e. & Cancer Genome Atlas Research, N. Comprehensive and Integrative Genomic Characterization of Hepatocellular Carcinoma. Cell 169, 1327–1341 e1323 (2017). [DOI] [PMC free article] [PubMed] [Google Scholar]
- 6.Farshidfar F. et al. Integrative Genomic Analysis of Cholangiocarcinoma Identifies Distinct IDH-Mutant Molecular Profiles. Cell Rep 18, 2780–2794 (2017). [DOI] [PMC free article] [PubMed] [Google Scholar]
- 7.Craig AJ, von Felden J, Garcia-Lezana T, Sarcognato S. & Villanueva A. Tumour evolution in hepatocellular carcinoma. Nat Rev Gastroenterol Hepatol 17, 139–152 (2020). [DOI] [PubMed] [Google Scholar]
- 8.Xue R. et al. Genomic and Transcriptomic Profiling of Combined Hepatocellular and Intrahepatic Cholangiocarcinoma Reveals Distinct Molecular Subtypes. Cancer Cell 35, 932–947 e938 (2019). [DOI] [PMC free article] [PubMed] [Google Scholar]
- 9.Chaisaingmongkol J. et al. Common Molecular Subtypes Among Asian Hepatocellular Carcinoma and Cholangiocarcinoma. Cancer Cell 32, 57–70 e53 (2017). [DOI] [PMC free article] [PubMed] [Google Scholar]
- 10.Schaub JR et al. De novo formation of the biliary system by TGFbeta-mediated hepatocyte transdifferentiation. Nature 557, 247–251 (2018). [DOI] [PMC free article] [PubMed] [Google Scholar]
- 11.Deng X. et al. Chronic Liver Injury Induces Conversion of Biliary Epithelial Cells into Hepatocytes. Cell Stem Cell 23, 114–122 e113 (2018). [DOI] [PubMed] [Google Scholar]
- 12.Mathews Griner LA et al. High-throughput combinatorial screening identifies drugs that cooperate with ibrutinib to kill activated B-cell-like diffuse large B-cell lymphoma cells. Proc Natl Acad Sci U S A 111, 2349–2354 (2014). [DOI] [PMC free article] [PubMed] [Google Scholar]
- 13.Davis MI et al. Identification of Novel Plasmodium falciparum Hexokinase Inhibitors with Antiparasitic Activity. Antimicrob Agents Chemother 60, 6023–6033 (2016). [DOI] [PMC free article] [PubMed] [Google Scholar]
- 14.Saha SK et al. Isocitrate Dehydrogenase Mutations Confer Dasatinib Hypersensitivity and SRC Dependence in Intrahepatic Cholangiocarcinoma. Cancer Discov 6, 727–739 (2016). [DOI] [PMC free article] [PubMed] [Google Scholar]
- 15.Yeo EJ et al. YC-1: a potential anticancer drug targeting hypoxia-inducible factor 1. J Natl Cancer Inst 95, 516–525 (2003). [DOI] [PubMed] [Google Scholar]
- 16.Ko FN, Wu CC, Kuo SC, Lee FY & Teng CM YC-1, a novel activator of platelet guanylate cyclase. Blood 84, 4226–4233 (1994). [PubMed] [Google Scholar]
- 17.Garnett MJ et al. Systematic identification of genomic markers of drug sensitivity in cancer cells. Nature 483, 570–575 (2012). [DOI] [PMC free article] [PubMed] [Google Scholar]
- 18.Iorio F. et al. A Landscape of Pharmacogenomic Interactions in Cancer. Cell 166, 740–754 (2016). [DOI] [PMC free article] [PubMed] [Google Scholar]
- 19.Chapman E, Best MD, Hanson SR & Wong CH Sulfotransferases: structure, mechanism, biological activity, inhibition, and synthetic utility. Angew Chem Int Ed Engl 43, 3526–3548 (2004). [DOI] [PubMed] [Google Scholar]
- 20.Kendall T. et al. Anatomical, histomorphological and molecular classification of cholangiocarcinoma. Liver Int 39 Suppl 1, 7–18 (2019). [DOI] [PubMed] [Google Scholar]
- 21.Wang T. et al. Distinct histomorphological features are associated with IDH1 mutation in intrahepatic cholangiocarcinoma. Hum Pathol 91, 19–25 (2019). [DOI] [PMC free article] [PubMed] [Google Scholar]
- 22.Akita M. et al. Dichotomy in intrahepatic cholangiocarcinomas based on histologic similarities to hilar cholangiocarcinomas. Mod Pathol 30, 986–997 (2017). [DOI] [PubMed] [Google Scholar]
- 23.Goeppert B. et al. Integrative Analysis Defines Distinct Prognostic Subgroups of Intrahepatic Cholangiocarcinoma. Hepatology 69, 2091–2106 (2019). [DOI] [PMC free article] [PubMed] [Google Scholar]
- 24.Misumi K. et al. Intrahepatic cholangiocarcinoma frequently shows loss of BAP1 and PBRM1 expression, and demonstrates specific clinicopathological and genetic characteristics with BAP1 loss. Histopathology 70, 766–774 (2017). [DOI] [PubMed] [Google Scholar]
- 25.Brackett DG et al. Cholangiolar pattern and albumin in situ hybridisation enable a diagnosis of intrahepatic cholangiocarcinoma. J Clin Pathol 73, 23–29 (2020). [DOI] [PubMed] [Google Scholar]
- 26.Sigel CS et al. Intrahepatic Cholangiocarcinomas Have Histologically and Immunophenotypically Distinct Small and Large Duct Patterns. Am J Surg Pathol 42, 1334–1345 (2018). [DOI] [PMC free article] [PubMed] [Google Scholar]
- 27.Berger I, Guttman C, Amar D, Zarivach R. & Aharoni A. The molecular basis for the broad substrate specificity of human sulfotransferase 1A1. PLoS One 6, e26794 (2011). [DOI] [PMC free article] [PubMed] [Google Scholar]
- 28.Huang X. et al. Expression of sulfotransferase SULT1A1 in cancer cells predicts susceptibility to the novel anticancer agent NSC-743380. Oncotarget 6, 345–354 (2015). [DOI] [PMC free article] [PubMed] [Google Scholar]
- 29.Rothman DM et al. Metabolic Enzyme Sulfotransferase 1A1 Is the Trigger for N-Benzyl Indole Carbinol Tumor Growth Suppression. Chem Biol 22, 1228–1237 (2015). [DOI] [PubMed] [Google Scholar]
- 30.Rees MG et al. Correlating chemical sensitivity and basal gene expression reveals mechanism of action. Nat Chem Biol 12, 109–116 (2016). [DOI] [PMC free article] [PubMed] [Google Scholar]
- 31.Meng LH et al. Activation of aminoflavone (NSC 686288) by a sulfotransferase is required for the antiproliferative effect of the drug and for induction of histone gamma-H2AX. Cancer Res 66, 9656–9664 (2006). [DOI] [PubMed] [Google Scholar]
- 32.Corsello SM et al. Discovering the anti-cancer potential of non-oncology drugs by systematic viability profiling. Nat Cancer 1, 235–248 (2020). [DOI] [PMC free article] [PubMed] [Google Scholar]
- 33.Rautio J, Meanwell NA, Di L. & Hageman MJ The expanding role of prodrugs in contemporary drug design and development. Nat Rev Drug Discov 17, 559–587 (2018). [DOI] [PubMed] [Google Scholar]
- 34.Nieves-Neira W. et al. DNA protein cross-links produced by NSC 652287, a novel thiophene derivative active against human renal cancer cells. Mol Pharmacol 56, 478–484 (1999). [DOI] [PubMed] [Google Scholar]
- 35.Leong CO et al. Antitumour 2-(4-aminophenyl)benzothiazoles generate DNA adducts in sensitive tumour cells in vitro and in vivo. Br J Cancer 88, 470–477 (2003). [DOI] [PMC free article] [PubMed] [Google Scholar]
- 36.Leong CO et al. In vitro, in vivo, and in silico analyses of the antitumor activity of 2-(4-amino-3-methylphenyl)-5-fluorobenzothiazoles. Mol Cancer Ther 3, 1565–1575 (2004). [PubMed] [Google Scholar]
- 37.Van Nostrand EL et al. A large-scale binding and functional map of human RNA-binding proteins. Nature 583, 711–719 (2020). [DOI] [PMC free article] [PubMed] [Google Scholar]
- 38.Schmidt HB, Barreau A. & Rohatgi R. Phase separation-deficient TDP43 remains functional in splicing. Nat Commun 10, 4890 (2019). [DOI] [PMC free article] [PubMed] [Google Scholar]
- 39.Park YY et al. Tat-activating regulatory DNA-binding protein regulates glycolysis in hepatocellular carcinoma by regulating the platelet isoform of phosphofructokinase through microRNA 520. Hepatology 58, 182–191 (2013). [DOI] [PMC free article] [PubMed] [Google Scholar]
- 40.Uhlen M. et al. A pathology atlas of the human cancer transcriptome. Science 357 (2017). [DOI] [PubMed] [Google Scholar]
- 41.Uhlen M. et al. Proteomics. Tissue-based map of the human proteome. Science 347, 1260419 (2015). [DOI] [PubMed] [Google Scholar]
- 42.Lee OW et al. Cytotoxic Profiling of Annotated and Diverse Chemical Libraries Using Quantitative High-Throughput Screening. SLAS Discov 25, 9–20 (2020). [DOI] [PMC free article] [PubMed] [Google Scholar]
- 43.Wu Q. et al. EGFR Inhibition Potentiates FGFR Inhibitor Therapy and Overcomes Resistance in FGFR2 Fusion-Positive Cholangiocarcinoma. Cancer Discov 12, 1378–1395 (2022). [DOI] [PMC free article] [PubMed] [Google Scholar]
- 44.Edwards A. & Haas W. Multiplexed Quantitative Proteomics for High-Throughput Comprehensive Proteome Comparisons of Human Cell Lines. Methods Mol Biol 1394, 1–13 (2016). [DOI] [PubMed] [Google Scholar]
- 45.Ting L, Rad R, Gygi SP & Haas W. MS3 eliminates ratio distortion in isobaric multiplexed quantitative proteomics. Nat Methods 8, 937–940 (2011). [DOI] [PMC free article] [PubMed] [Google Scholar]
- 46.Elias JE & Gygi SP Target-decoy search strategy for increased confidence in large-scale protein identifications by mass spectrometry. Nat Methods 4, 207–214 (2007). [DOI] [PubMed] [Google Scholar]
- 47.Wilson MR et al. The human gut bacterial genotoxin colibactin alkylates DNA. Science 363 (2019). [DOI] [PMC free article] [PubMed] [Google Scholar]
- 48.Katz Y, Wang ET, Airoldi EM & Burge CB Analysis and design of RNA sequencing experiments for identifying isoform regulation. Nat Methods 7, 1009–1015 (2010). [DOI] [PMC free article] [PubMed] [Google Scholar]
- 49.Wu MJ et al. Mutant IDH Inhibits IFNgamma-TET2 Signaling to Promote Immunoevasion and Tumor Maintenance in Cholangiocarcinoma. Cancer Discov 12, 812–835 (2022). [DOI] [PMC free article] [PubMed] [Google Scholar]
- 50.Wu MJ, Shi L, Merritt J, Zhu AX & Bardeesy N. Biology of IDH mutant cholangiocarcinoma. Hepatology 75, 1322–1337 (2022). [DOI] [PubMed] [Google Scholar]
Associated Data
This section collects any data citations, data availability statements, or supplementary materials included in this article.
Supplementary Materials
Data Availability Statement
The RNA sequencing dataset assessing YC-1 treatment has been deposited to the Gene Expression Omnibus (GEO), available with accession number GSE168791. Mass spectrometry raw data can be accessed through the MassIVE data repository (massive.ucsd.edu) under accession numbers MSV000090805 and MSV000090808. The human pan-cancer data were derived from the TCGA Research Network: http://cancergenome.nih.gov/. The data-set derived from this resource that supports the findings of this study is available in https://ucsc-xena.gitbook.io/project/cite-us
Complete source data for all figures are provided as Source Data files. All other data supporting the findings of this study are available from the corresponding authors on reasonable request.


