

Abstract
The evolution of multicellular life spurred evolutionary radiations, fundamentally changing many of Earth’s ecosystems. Yet little is known about how early steps in the evolution of multicellularity affect eco-evolutionary dynamics. Through long-term experimental evolution, we observed niche partitioning and the adaptive divergence of two specialized lineages from a single multicellular ancestor. Over 715 daily transfers, snowflake yeast were subjected to selection for rapid growth, followed by selection favouring larger group size. Small and large cluster-forming lineages evolved from a monomorphic ancestor, coexisting for over ~4,300 generations, specializing on divergent aspects of a trade-off between growth rate and survival. Through modelling and experimentation, we demonstrate that coexistence is maintained by a trade-off between organismal size and competitiveness for dissolved oxygen. Taken together, this work shows how the evolution of a new level of biological individuality can rapidly drive adaptive diversification and the expansion of a nascent multicellular niche, one of the most historically impactful emergent properties of this evolutionary transition.
Earth’s biosphere looks quite different now than it did a billion years ago, due in no small part to the expansion and success of multicellular organisms1,2. While there is little question that the evolution of multicellularity preceded some of the largest adaptive radiations in Earth’s history, determining whether the evolution of multicellularity directly promotes ecological diversification or if it is merely a result of the emergence of new traits in these lineages remains a challenging task. For example, the ability of green algae to grow on land, or more appropriately, in the air (the only lineage of the dozens of independently evolved multicellular algae we call ‘plants’), opened vast new ecological and evolutionary frontiers3. Yet this diversification arguably has more to do with the evolution of multicellular traits allowing for exploration of a new environment4, including a hydrophobic cuticle, roots, vascular system for transporting water and so on5,6, than it does with the transition to multicellularity (the origin of simple multicellular groups capable of adaptation), per se7.
John Tyler Bonner, a pioneering evolutionary biologist who helped develop core conceptual foundations on the evolution of multicellularity, argued that before the evolution of groundbreaking multicellular innovations, multicellular size was a trait that favoured open-ended ecological diversification8. In this view, far before the evolution of trade-off-breaking multicellular innovations that characterize many dominant multicellular clades9, multicellularity itself offered access to novel size niches, driving ecological divergence and maintaining diversity. Bonner’s hypothesis, while foundational, has remained largely conceptual. This is not uncommon when it comes to theories about the evolution of multicellularity—all well-studied extant lineages made this transition deep in the past, and relatively little is known about the ecological or evolutionary dynamics of their earliest multicellular ancestors.
In this paper, we examine the link between multicellularity and diversity via a combination of long-term experimental evolution and mathematical modelling. We show that, consistent with Bonner’s ‘size-niche’ hypothesis, the simple act of creating a multicellular group generates novel size-dependent trade-offs that drive ecological divergence and maintain coexistence. For this work we used the ‘snowflake yeast’ model system of diffusion-limited multicellularity10,11. Snowflake yeast are an experimental model of undifferentiated multicellularity capable of open-ended laboratory evolution12. They have an emergent multicellular life cycle in which clusters form via incomplete cell division, so that mother and daughter cells remain attached after mitosis and fracture between cells results in the production of clonal multicellular propagules13. The shape of cells in a snowflake yeast cluster affects its maximum size: more elongated cells create additional free space within the cluster’s interior, which delays the breaking of cell–cell bonds caused by cellular crowding, ultimately leading to the fragmentation of the cluster14. Group size at fracture is highly heritable (broad sense heritability ~0.8, on par with clonally reproducing animals such as Daphnia)10,15 and is a trait under strong selection in our system11,12.
This paper is an extension of our ongoing Multicellularity Long-Term Evolution Experiment (MuLTEE)11,12. This experiment contains three different metabolic treatments (anaerobic, mixotrophic and obligately aerobic, referred to as PA, PM and PO) to test the effect of metabolic differences on the evolution of multicellularity. To favour the evolution of larger groups, we perform a round of settling selection (using sedimentation speed through liquid media to screen for larger groups) after 24 h of growth in batch culture. The fitness of snowflake yeast thus depends on their ability to both (1) compete for resources during batch culture and (2) form large groups that have high multicellular survival during settling selection. These traits appear to trade-off, as large size reduces the potential for resources to diffuse into the cluster interior and reach internal cells, slowing growth rates while increasing settling speed and thus survival10,11. Such trade-offs may be common during the early stages of the evolutionary transition to multicellularity. Group size is a key trait under selection in many multicellular lineages, as distinct benefits of multicellularity (that is, protection from predators or harsh environments, motility or cooperative metabolism16) often function in a size-dependent manner. Yet before the evolution of circulatory systems or other morphological innovations that mitigate this constraint17, larger size would have reduced a group’s surface area to volume ratio, potentially causing key exogenous resources (for example, reduced carbon, or dissolved oxygen) to become limited by diffusion, thus slowing growth16,18,19. In our experiment, glucose is initially present at approximately four orders of magnitude higher concentration than oxygen, and limited oxygen diffusion into the cluster interior imposes a strong constraint on the evolution of larger group size11.
In previous work within a 60-day evolution experiment10,20, we observed what appeared to be nascent steps in the diversification of snowflake yeast populations into small and large-sized strains. Here we examine what happens when such an experiment is prolonged under novel environmental conditions, and demonstrate that coexistence between small and large-sized strains is evolutionarily stable, lasting at least 715 daily transfers (~4,300 generations). We show that size-dependent trade-offs involving access to dissolved oxygen are essential for maintaining diversity: coexistence is lost if we provide supplemental oxygen, and never evolved in mixotrophic and anaerobic populations of the MuLTEE capable of fermentation. Coexistence is the result of ecological specialization: small snowflake yeast evolve to become growth-rate specialists, while large group-forming genotypes, which are 16 to 48-fold larger in volume, evolve to become survival specialists. Through both experiments and modelling, we show that coexistence is maintained by frequency-dependent selection and that the large difference in group size between size specialists is the result of niche partitioning. Taken together, this work demonstrates that a simple and yet fundamental trade-off between growth and survival, mediated by differential oxygen diffusion through bodies of different sizes, can drive and maintain ecological diversity in a nascent multicellular lineage.
Results
Maintenance of two phenotypes over long-term evolution
To generate the ancestor of the MuLTEE, we deleted the ACE2 reading frame, resulting in ‘snowflake’ yeast21. After 715 serial passages with daily selection favouring faster growth and larger group size (Fig. 1a), three of five populations in the obligately aerobic treatment (PO) appeared to contain a mixture of small and large snowflake yeast (PO-3, PO-4 and PO-5; Extended Data Fig. 1; see Extended Data Fig. 2 for microscopy images of population PO-4 after 715 serial passages). To determine whether these size differences reflect heritable variation among coexisting strains, or reflect within-genotype phenotypic variation (that is, small groups may simply be fragments of large group-forming genotypes), we isolated 10 small and 10 large snowflakes from each of the five replicate populations with a dissecting microscope and then measured the size of the resulting populations after growth. Among populations PO-3, PO-4 and PO-5, where noticeable size disparities existed, the populations originating from large clusters were 37, 27 and 16 times larger in volume, respectively, compared with those originating from small genotypes. On the other hand, in the two populations that did not exhibit clear variation in size, the populations derived from larger clusters were only 2 and 1.5 times larger than those from smaller genotypes (populations PO-1 and PO-2; Extended Data Fig. 1). This was surprising, both because our detailed investigations of the anaerobic (PA) and mixotrophic (PM) treatments of the MuLTEE did not show any sign of size dimorphism12 and because daily size selection should, in theory, favour the larger, faster-settling genotypes.
Fig. 1 |. Emergence and long-term coexistence of large and small snowflake yeast phenotypes.
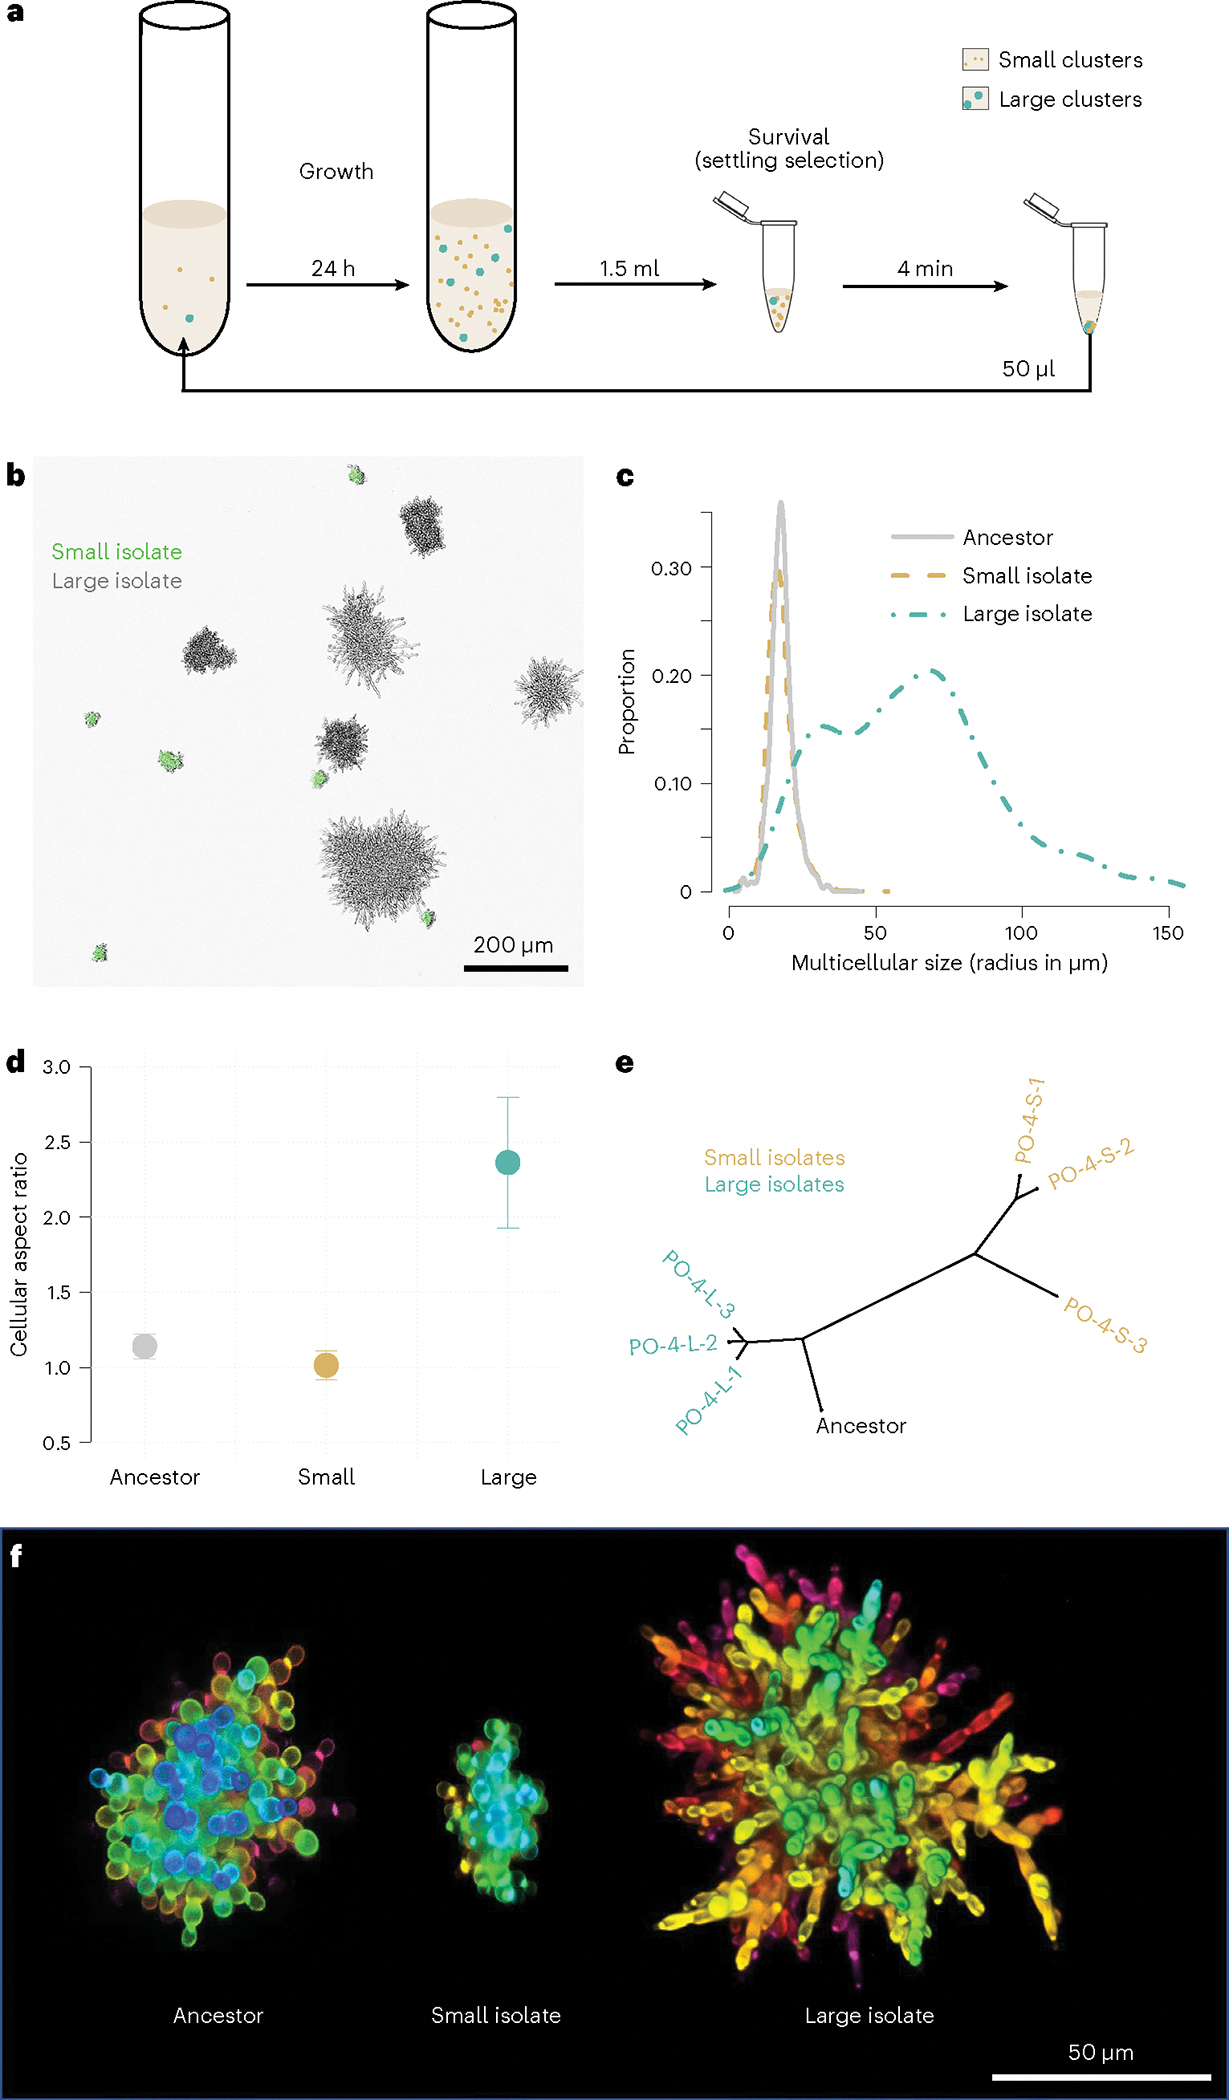
a, Daily transfers consist of 24 h of batch culture in which selection favours faster growth, followed by a round of settling selection for larger group size. b, While the experiment started from a monomorphic multicellular ancestor, after 715 rounds of selection, the population is composed of large and small phenotypes (here, Small are marked with GFP to differentiate them from Large). c, We measured the cluster size distribution via microscopy. Small-sized snowflake yeast (yellow) are similar in size to their ancestor (grey). The volume of large-sized snowflake yeast isolates (teal), in contrast, is on average 48 times larger. d, The Large genotype evolved highly elongate cells with a mean aspect ratio (length to width) of 2.36, while the Small genotype became nearly perfectly spherical (aspect ratio 1.01) from the ancestor’s slightly oblate cells (aspect ratio 1.14) (n = 128 for ancestor cells, 120 for large cells and 50 for small cells). Bars represent 1 s.d. e, The phylogeny of the Small and Large genotypes reveals that they only share one mutation in common, indicating that the lineages leading to each genotype have been coexisting throughout the majority of our long-term evolution experiment (PO-4–1 to 3 in yellow are the three Small isolate strains and PO-4–1 to 3 in teal are three Large isolate strains). f, Differences in cellular morphology between the multicellular ancestor, Small and Large genotypes shown via confocal microscopy. Pictured are representative clusters from the populations. Note that the Large cluster shown here is smaller than its maximum possible size (this cluster is in the 40th percentile of size). Colour indicates depth.
To understand the drivers of coexistence between small and large-sized snowflake yeast, we isolated representative genotypes from the population where we first noticed the size dimorphism (PO-4) after 715 transfers (Fig. 1b,f). We chose this time point because the MuLTEE was on transfer 715 when we began investigating this phenomenon and we wanted to use the most highly evolved populations available. Clusters of the small genotype (henceforth called Small) were similar in size to the ancestor of the experiment, with a mean radius of 17.4 μm (vs 17.9 μm for the ancestor, n = 1,454 for ancestor clusters, n = 2,860 for small clusters; Tukey’s HSD after one-way analysis of variance (ANOVA), F2,5085 = 11,255, P = 0.1 for the post hoc test). In contrast, the larger genotype (henceforth called Large) evolved to form clusters with a mean radius of 62 μm, a ~48-fold increase in volume from the ancestor (Fig. 1c; n = 774 for large clusters; P < 0.001, Tukey’s HSD for the above ANOVA). Previous work has shown that snowflake yeast primarily evolve larger size by increasing the length of individual cells (increasing their aspect ratio), which in turn reduces cellular packing density and allows clusters to grow larger before fracturing14,15. We examined whether evolved differences in aspect ratio were responsible for differences in the Small and Large cluster phenotypes. Consistent with previous experiments, cells within Large clusters evolved to be more than twice as elongated as the ancestor, increasing their aspect ratio from 1.1 to 2.3 (Fig. 1d,f; n = 128 for ancestor cells, n = 120 for large cells; Tukey’s HSD after one-way ANOVA, F2,295 = 95.5, P < 0.0001). In contrast, cells in the Small snowflake yeast genotype evolved to be nearly spherical, with their mean aspect ratio declining from 1.14 to 1.01 (n = 50 for small cells; P = 0.02, Tukey’s HSD for the above ANOVA).
To determine whether the divergence of Small and Large lineages is recent or occurred early in the experiment, we sequenced the genomes of three randomly selected isolates of each type, from population PO-4 after 715 transfers. We found six mutations shared among the Small isolates (Supplementary Data 1). Two mutations were shared among the Large isolates, one of them involved in cell wall organization and thus a candidate mutation for increasing cellular aspect ratio11,15. Only one mutation was shared between Small and Large genotypes (Fig. 1e and Supplementary Data 1). Similarly, in the independently evolving line PO-3, we did not find any mutations in common between the Small and Large genotype sequences (Extended Data Fig. 3). Given that this experiment originated from a single clone, it implies that the most recent common ancestor of the two phenotypes is closely related to the initial monomorphic ancestor of the MuLTEE. The low number of shared de novo mutations further suggests that lineages leading to these distinct phenotypes diverged early on in the MuLTEE and have been coexisting for nearly ~4,300 generations12 of growth and 715 rounds of size-based settling selection. Consistent with the early divergence of these lineages, we see the coexistence of Small and Large phenotype clusters at t200, t400 and t600 (Extended Data Fig. 4).
Competition for oxygen creates a niche for coexistence
Negative frequency-dependent selection, in which the fitness of a genotype declines with increasing frequency in the population, can maintain coexistence even in the face of stochastic perturbations to equilibrium genotype frequencies22,23. To determine whether frequency-dependent selection is acting to maintain a polymorphic population of Small and Large snowflake yeast genotypes, we competed these strains across a wide range of starting frequencies, from 1% to 80% Large (Fig. 2a). In these experiments, we use the same conditions as in the MuLTEE: a growth phase of 24 h in YEPG media, followed by a survival phase where we select for larger size (Fig. 1a). During the growth phase, the clusters can only respire as glycerol (YEPG) is a non-fermentable carbon source. After 24 h of growth, 1.5 ml of the saturated culture is transferred to a 1.5 ml Eppendorf microcentrifuge tube where the clusters are allowed to settle for 4 min. We remove the supernatant and seed the next growth phase with the bottom 50 μl (Fig. 1a). Regardless of their starting frequency, all populations evolved to have an average of 9% Large snowflake yeast clusters after 6 rounds of growth and selection (frequency calculated after the final growth phase). This frequency was nearly identical to that of the population as a whole from the t715 PO-4, where Large genotypes of snowflake yeast forming large clusters were present at a mean of 9.4% (Extended Data Fig. 4). The fitnesses of both Small and Large snowflake yeast are strongly frequency dependent but are equivalent when the Large strain composes 9% of the population and the Small strain composes the other 91% (Fig. 2b; regression slope for Small β = 1.03, R2 = 0.96, P = 0.01).
Fig. 2 |. Coexistence between Small and Large group-forming genotypes is mediated by oxygen.
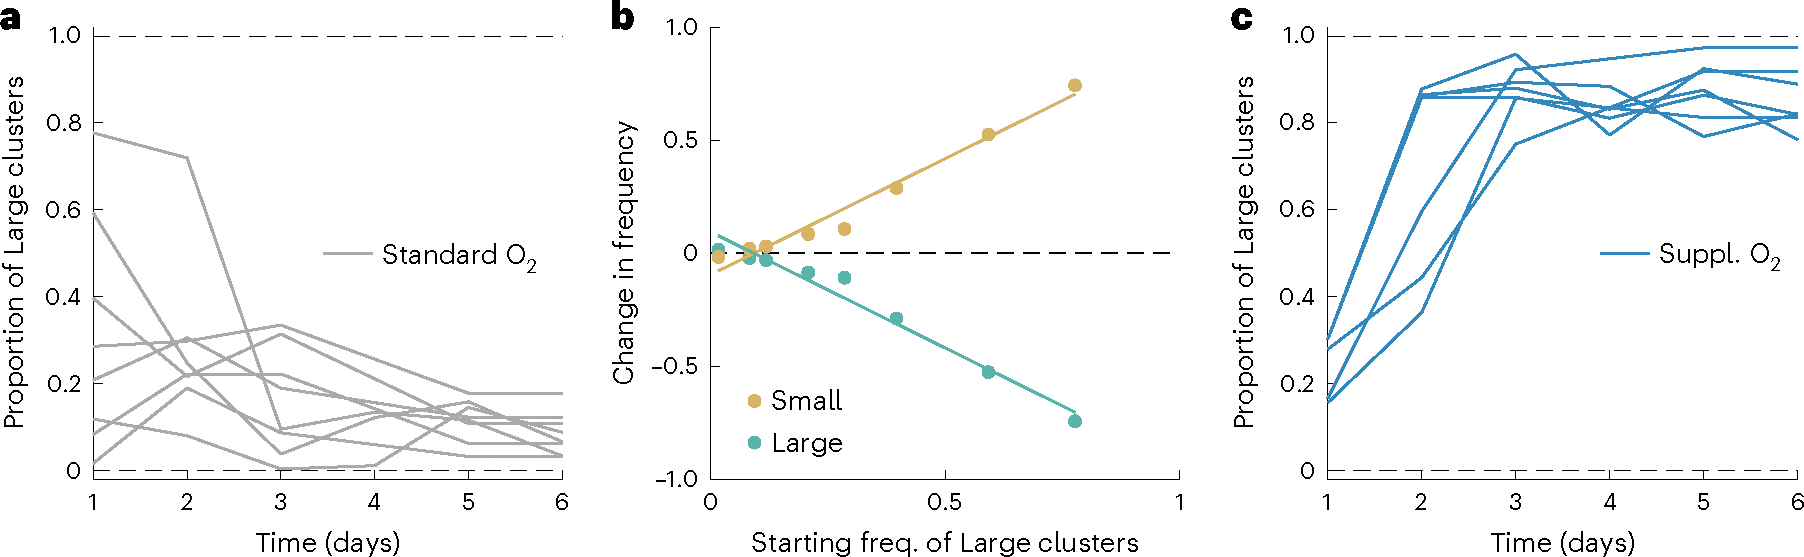
a, Under standard oxygen conditions (~26% PAL, grey), our populations converge on an equilibrium of ~9% Large snowflake yeast after the growth phase regardless of their starting frequency (n = 8). b, Under standard oxygen conditions, frequency-dependent selection maintains coexistence between Small and Large strains at 9% Large clusters. Data points reflect changes in frequency of each genotype between days 1 and 6 of the competition reported in a. Linear regression for Small y = −0.095 + 1.03x, P < 0.01, adjusted R2 = 0.96. c, The Large genotype has an advantage under supplemental oxygen, increasing to a mean equilibrium frequency of 86% in a high-oxygen environment (~84% PAL, dark blue, n = 6).
Snowflake yeast in this experimental treatment are obligate aerobes and do not possess the ability to actively transport oxygen throughout the group. Instead, oxygen diffuses passively through the cells and the media surrounding them, and diffusion limitation is a fundamental constraint on the growth of interior cells11. Previous work has shown that in this system, respiration consumes oxygen faster than it can diffuse into the media, resulting in a mean partial pressure of oxygen (pO2) of ~26% of present atmospheric levels (26% PAL) under our standard growth conditions11. We thus hypothesized that, due to their smaller size and diffusion limitation, Small clusters may have a competitive advantage for oxygen, allowing them to be maintained at a high equilibrium frequency despite daily settling selection favouring large size. To determine whether the coexistence equilibrium is sensitive to oxygen, we performed a competition with supplemental oxygen, provided via an in-tube aerator (which has been shown in previous work to increase mean pO2 from ~26% to ~84% PAL in the growth medium11). We initiated five replicate populations with intermediate frequencies of the Large genotype (~25%), then passaged them for 5 rounds of growth and settling selection. Rather than declining to the 9% equilibrium as seen in the standard oxygen conditions (Fig. 2a), under supplemental oxygen, the Large genotype rose to 86% frequency (Fig. 2c), indicating that oxygen availability is a key driver of the coexistence equilibrium, with more oxygen favouring a higher frequency of the Large genotype.
Model of coexistence mediated by a growth–survival trade-off
We next investigated a possible mechanism underlying the coexistence of Small and Large snowflake yeast, namely, that they coexist due to emergent functional specialization over a classic trade-off between key life history parameters. In this scenario, Small snowflake yeast are growth specialists, outcompeting Large genotypes for oxygen at the expense of low survival during settling selection. In contrast, Large snowflake yeast trade slower growth for improved settling which results in higher survival during settling selection. We develop a mathematical model to evaluate whether this trade-off is sufficient to drive coexistence between Small and Large snowflake yeast.
We construct our mathematical model by focusing on the key features of the experimental design and making simplifications to remove extraneous parameters. For simplicity, we assume that there are only two genotypes, one that produces small snowflake clusters () and one that produces large snowflake clusters (). A mixed population of these two genotypes experiences repeated rounds of growth and settling selection. We assume that the net result of a round of growth and settling selection maintains the population size such that populations do not expand or contract. Within this context, a relevant metric of the fitness of either genotype is its proportion after a full round of growth and settling selection. We let be the proportion of large snowflake clusters at the start of the ith round and then consider how a round of growth and settling selection affects this proportion, that is, we determine .
We model the growth phase with a set of competitive Lotka–Volterra equations in which a population of cells in small and large clusters grows to a carrying capacity, some factor of the initial size of the cell population. We assume that small and large clusters grow at different rates and let represent the ratio of growth rates for small versus large clusters. Since the carrying capacity for population growth is in terms of cell numbers but the metric of fitness is in terms of proportion of large clusters, we need some way of relating numbers of cells to numbers of clusters. If we let denote the ratio of the number of cells in an average large cluster versus a small cluster, then we can determine how the proportion of clusters that are large, , changes after the growth phase, , by solving the following equation (see Supplementary Methods, ‘Methods for growth map’):
Following growth, populations experience settling selection where groups of cells compete to sink to the bottom quickly. We can relate the size of a group to its likelihood of reaching the bottom via Stokes’ law, which has that the terminal velocity of a sphere is proportional to its radius squared, . If we approximate snowflake groups as spheres of the same volume, we can then use the relative values of the velocities from Stokes’ law to determine the fraction of clusters that reach the bottom in time that are of the large cluster genotype (see Supplementary Methods, ‘Methods for the settling selection map’):
The descriptions of how growth and settling selection alter the proportion of large snowflake clusters have three basic parameters: (1) the factor by which the population grows and contracts , (2) the ratio of the population growth rates , which describes the growth advantage of small clusters and (3) the ratio of the cluster sizes , which determines the settling advantage of large clusters. To have coexistence between small and large snowflake clusters, the proportion of Large snowflake genotypes should be unchanged after a round of growth and settling selection such that . Figure 3a shows that while the trade-off between growth rate and settling speed does not guarantee coexistence, it does occur for multiple combinations of size and growth ratios. Thus, for a specific size ratio , there are a range of relative growth rates that enable the small and large clusters to stably coexist:
Fig. 3 |. Coexistence arises in a general model via size-dependent trade-offs between growth rate and survival.
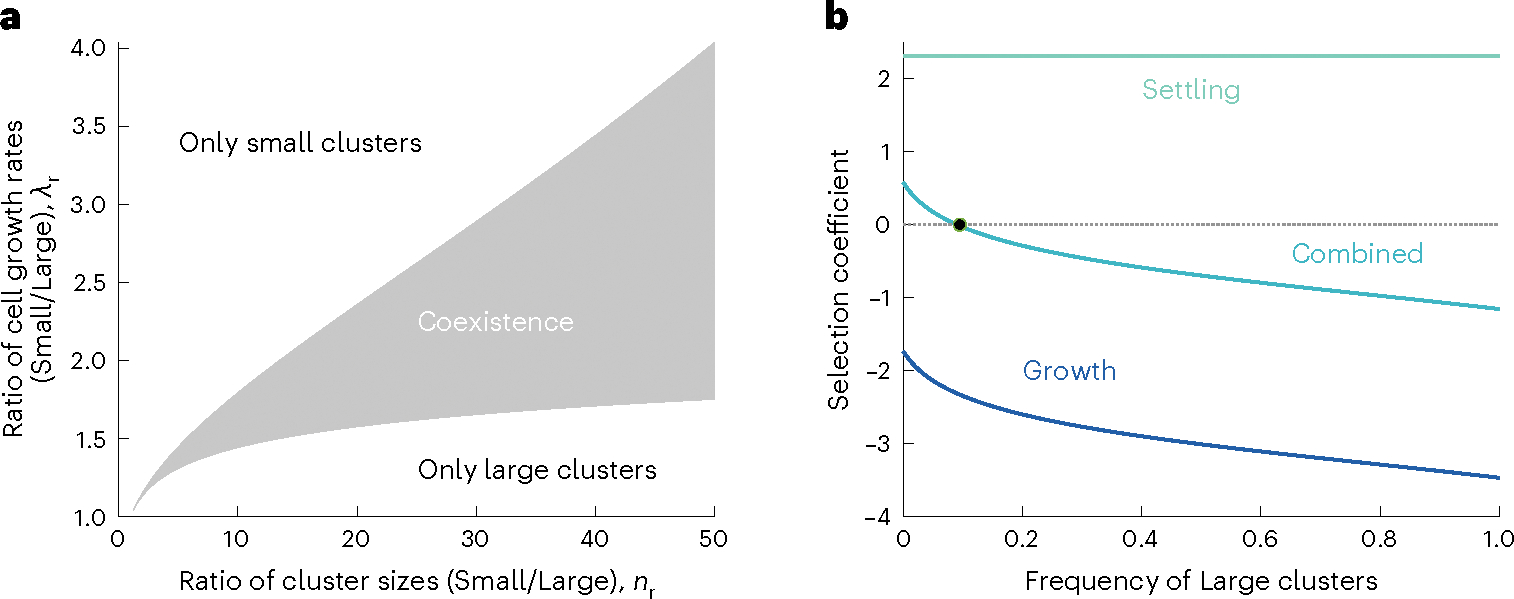
a, The grey area shows combinations of growth and size ratios that establish coexistence between pairs of Small and Large snowflake clusters, when the population expands and contracts by the mean amount during each transfer of the MuLTEE, 32 fold (that is, ). Coexistence is possible in this grey shaded region. b, The selection coefficient for large clusters is shown as a function of starting proportions of large clusters (using parameters ) for different phases of the competition. Selection coefficients during growth, but not during settling, are negatively frequency dependent. The combination of selection coefficients is 0 when large clusters are 10% of the population, meaning both genotypes coexist. Since the combined selection coefficient for Large is positive below 10% and negative above it, coexistence is stable to perturbations in the genotype frequency.
As the size difference between large and small clusters () increases, so does the range of relative growth rates that produce coexistence. We also note that these coexistence proportions are robust such that populations starting with proportions far from coexistence approach it over repeated rounds of growth and settling selection.
Coexistence emerges in the mathematical model because fitness across a round of growth and settling selection demonstrates frequency dependence. To identify the source of this frequency dependence, we calculate the selection coefficients24 and find that the selection coefficient from the growth phase is and the selection coefficient from the settling phase is . Since the term is the only one that varies with population composition, the frequency dependence that underlies coexistence arises in the growth phase but not during settling selection (see Fig. 3b for an example). We tested this experimentally and found that, consistent with the model, the fitness of our Large strain was negatively frequency dependent during growth, but independent of frequency during settling selection (Extended Data Fig. 5). The reason the growth phase has frequency dependence is because population growth stops when the carrying capacity is reached, and the time to reach carrying capacity changes with population composition. The more a population is dominated by the slow-growing Large clusters, the longer it takes to reach carrying capacity, allowing the faster-growing Small genotype to further compound their advantage. Although the growth phase has frequency dependence, we only observe coexistence for specific combinations of relative growth rates and size ratios because these particular combinations cause the selective coefficients in the growth and settling phases to be balanced, that is, at some equilibrium frequency, the benefit to one genotype during growth is perfectly cancelled by its cost during settling (Fig. 3b). Growth rates or sizes outside of this range give too much of an advantage during one phase of the experiment to be compensated by the other.
While our mathematical model demonstrates the possibility of coexistence between two populations of clusters for some fixed size ratio , it is unclear whether the coexistence is evolutionarily stable should clusters evolve different sizes. We explore the evolutionary stability of coexistence in our model by expanding it to consider three populations of clusters with different sizes. We evaluate whether an initial coexisting population of two sizes can withstand invasion by a third population. Figure 4a shows that a population of coexisting Small and Large clusters is stable against invasion provided the growth rate of a mutant cluster is below the threshold:
where is the ratio of the growth rate of the small cluster versus the invading cluster and is the ratio of the size of the invading cluster versus that of small cluster. Thus, the coexisting population defines a trade-off between growth and settling speed (size) such that the only types that can successfully invade are those that alter this trade-off (Fig. 4a).
Fig. 4 |. Selection drives divergence via character displacement.
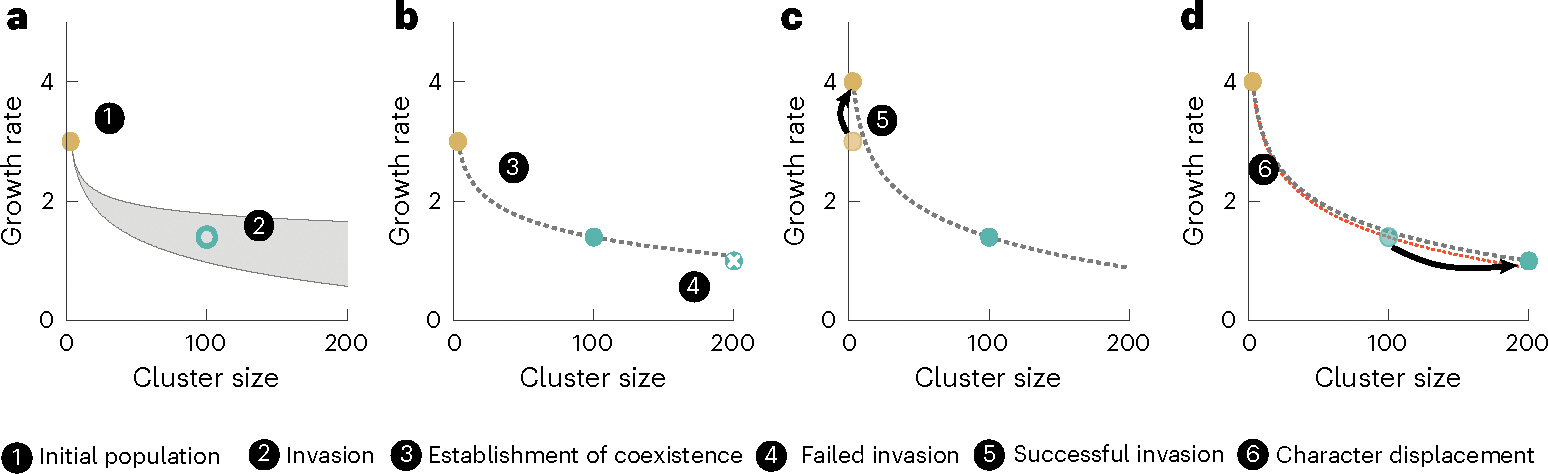
a, In a clonal population of Small snowflake clusters, there is a range (shown in grey) of larger cluster-forming genotypes that can invade and establish a stable coexistence (for example, the strain indicated by the empty circle). b, This pair of coexisting strains establishes a fitness isocline (dotted line) that determines the type of future strains that can invade (that is, above the fitness isocline). A larger, slower-growing mutant of the Large strain, shown with an ‘x’, falls below the line and cannot invade. c, A mutation that increases the growth rate of the Small genotype (yellow circle) displaces its ancestor and establishes a new, steeper fitness isocline (red line in d). d, In the context of this new fitness isocline, the larger, slower-growing mutant of the Large strain shown in b can now invade. Taken together, this illustrates how coexistence can arise from a monomorphic ancestor and how adaptation by Small and Large types can drive divergence via character displacement.
The size-mediated trade-off between growth and survival favours divergence via character displacement. If a mutation increases the growth rate of the coexisting Small or Large strains, then not only can this mutant invade and displace its ancestor, but it can also alter the boundary determining what other types can invade. Figure 4b–d shows an example where a mutation increasing the growth rate of a Small genotype shifts the boundary of invasion so that larger clusters can more easily invade. In this example, a larger but slower-growing mutant of the Large strain was incapable of invading the original population (Fig. 4b, indicated by an ‘x’), but can displace its Large ancestor after the invasion of a faster-growing Small genotype (Fig. 4d). This illustrates how adaptation of Small and Large strains may drive the evolution of distinct growth and survival specialists via character displacement.
Testing for character displacement
To test whether character displacement has driven ecological specialization in our yeast, we evolved four replicate populations of the Large and Small genotypes in the absence of an opposite-sized competitor for 40 rounds of growth and settling selection (Fig. 5). Each independent re-evolution population began with a single genotype, either the sequenced Small or Large clone from PO-4. Each genotype evolved towards an intermediate size in the absence of competitors, with the Small strain evolving to be 1.7 times as large (from 14 ± 1 to 25 ± 3 μm s.d. on average, regression slope β = 0.27; Fig. 5a), while the Large strain evolved to be an average of 15% smaller (from 55 ± 3 to 47 ± 1 μm on average, regression slope β = −0.27). The regression slopes were significantly different (interaction between genotype and time on cluster size, assessed via analysis of covariance (ANCOVA), F(1, 38) = 14.9, P < 0.001). Remarkably, the Small populations even re-evolved a bimorphic population of small and large genotypes in as little as 15 transfers (Fig. 5b).
Fig. 5 |. The divergent traits of Large and Small genotypes appear to have arisen via character displacement.
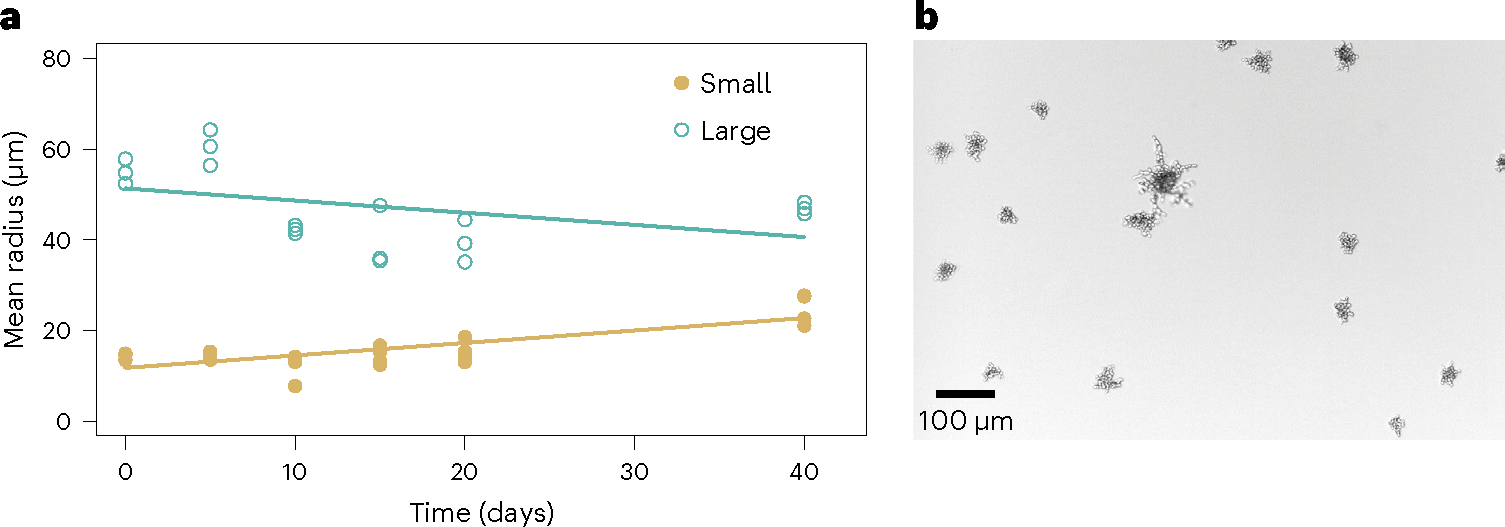
a, To determine whether competition between Large and Small snowflake yeast strains has driven divergence due to character displacement, we evolved five replicate populations of the Small and the Large isolates separately for 40 days. Removing their competitor resulted in the rapid evolution of intermediate sizes, with the Small strain evolving to be approximately twice as large (14–27 μm), while the Large strain shrank on average by 15% (from 55 μm to 47 μm). This suggests that the divergence seen between these strains was the result of competitive interactions, with character displacement evolving to minimize competitive overlap at intermediate phenotypes. b, We observe the re-emergence of Small and Large strain diversity in the Small monoculture re-evolution experiments in as little as 15 transfers. Shown is an image from a replicate population after 40 days.
Discussion
The evolution of multicellular organisms from unicellular ancestors precipitated some of the largest and most consequential adaptive radiations in the history of life on Earth21,25–28. Earth’s ecosystems would be fundamentally different without plants, animals, fungi or seaweeds—a result of the truly biosphere-altering impact of multicellular taxa29–35. However, understanding the ecology of contemporary multicellular organisms, in which extensive cellular differentiation enables functional specialization, is fundamentally different from understanding the ecological implications of the first steps in this major evolutionary transition. In this paper, we explore initial steps in this transition, the formation of simple replicating multicellular groups which enables a diffusion-mediated trade-off between growth and survival that drives ecological divergence and maintains coexistence.
Our biphasic selective environment is highly heterogenous, favouring rapid growth during the 24-h culture cycle, followed by strong selection on multicellular size. Theory and previous experiments across diverse systems suggest that temporally varying environments typically favour generalism because generalists display a higher overall mean fitness across a wider niche than specialists36. In our case, the generalist strategy would be an intermediate size that optimizes fitness along the trade-off between growth and survival. Why might we see specialization and coexistence? In our system, there is no genetic constraint on the evolution of a generalist snowflake yeast. Across the MuLTEE, we see genotypes evolving with radii ranging from 17 μm (Smalls in this experiment) to more than 500 μm (macroscopic snowflake yeast in the t600 anaerobic populations)11. Niche partitioning could, in principle, drive divergent selection if the population contains different genotypes with even modest, initially stochastic variation in size. Specifically, if the presence of a slightly larger competitor distorts the fitness landscape such that there is a local fitness minimum just below their size, then smaller strains may adapt along the growth–survival trade-off by evolving to become smaller. One could imagine the same process occurring for genotypes that are slightly above the mean size evolving to become larger survival specialists. Further work will be required to determine whether each size specialist competes primarily with the opposite type, or whether diverse populations exist within each size class and competition is mainly within other conspecific specialists. While the convergent evolution of large and small genotypes in 3 of 5 populations suggests that divergence is relatively robust, further work is required to understand the lack of diversity in PO-1 and PO-2. Intriguingly, these two populations are composed of intermediate-sized snowflake yeast (Extended Data Fig. 1), suggesting that a generalist strategy can be feasible.
It is noteworthy that coexistence in our system is dependent on a trade-off between growth and survival fitness. These are fundamental life history traits that arise from the fact that there are only two ways for a reproducing entity to increase its Darwinian fitness: it can increase its frequency in a population by reproducing more or dying less37. Trade-offs between increased reproduction and increased survival are nearly universal in biology38, as trade-off-free adaptations would be expected to have fixed long ago. Adaptation along these trade-offs is well-known to drive the emergence of novel ecological strategies39,40, and it is interesting that selection for such diversification appeared to occur in our system as soon as multicellularity evolved (inferred from the deep coexistence of both Small and Large lineages).
Experimental evolution has shown, in diverse systems, how simple and stable ecological communities can arise from monomorphic origins through a process of niche construction. Similar to our system, oxygen gradients in test tubes of nutrient broth favour the diversification of an initially clonal population of Pseudomonas fluorescens into a ‘wrinkly spreader’ that grows as a biofilm along the surface and a ‘smooth’ genotype that occupies the low-O2 broth below41,42. E. coli evolving on glucose minimal media diversify into genotypes that either specialize on this resource, or on overflow metabolites that result from glucose consumption, such as acetate43. Yeast evolving in static culture tubes differentiate into wall-adherent and bottom-dwelling genotypes, reducing competition caused by cellular crowding44. Even RNA replicators evolve into stable ecological networks of hosts and parasites45.
Little is known about the joint dynamics of early multicellular adaptation and ecological assembly, although clearly, organismal biology is tightly coupled to ecological opportunities46,47. Our results here do not explain the remarkable diversity of modern multicellular ecosystems48,49. Instead, our results focus on the very first steps in the evolutionary transition to multicellularity—the evolution of replicating groups of cells that are ‘Darwinian individuals’ capable of multicellular adaptation50. Our results support a central component of Bonner’s foundational work on the evolution of multicellularity8,51,52: group size is itself a key trait underpinning the origin of novel niches. Our paper is not the first to show that group formation itself creates a niche—multicellularity has evolved repeatedly in diverse model systems when group formation is adaptive16. Here we build on previous work and use experimental evolution to demonstrate how an emergent trade-off stemming from group size can expand multicellular niche space, from a single niche to two, occupied by growth and survival specialists, potentially resulting in the long-term coexistence of distinct lineages.
This work raises a number of questions of broad interest in the field, most prominently: how does ecological specialization interact with organismal specialization? In the context of the MuLTEE, we intend to explore mechanisms by which divergent selection on Small and Large lineages results in different forms of morphological or cellular specialization. Moreover, once coexistence between different size-based strategies emerges, it is unclear whether such coexistence is stable indefinitely or whether further multicellular adaptation opens up additional niche space. In theory, the emergence of diverse lineages may enable further niche construction, perhaps through the evolution of novel ecological interactions (as has been found in other evolution experiments44,53–57), or the collapse of diversity through the evolution of trade-off-breaking mutations58–60. Exploring these questions will shed light on the process and limits to open-ended diversification once the evolutionary transition to multicellularity enables individuals in complex populations to grow ever larger in size.
Methods
Model system
Snowflake yeast are a simple model system of undifferentiated multicellularity, which originally evolved due to selection for faster sedimentation10 in the diploid unicellular yeast strain Y55. This phenotype was associated with a single mutation in the ACE2 gene, responsible for incomplete cell separation21. For the MuLTEE10,61, we wanted to study the process of multicellular adaptation without confounding this by having different mutations driving group formation, so we deleted the ACE2 gene in our ancestor (ace2 Δ::KANMX//ace2 Δ::KANMX). This initial snowflake genotype was used as the basis of three treatments (with 5 independent repetitions per treatment): obligate aerobic metabolism (growth on glycerol, which is non-fermentable), obligately anaerobic metabolism (via the selection of a spontaneous petite mutant that cannot respire) and mixotrophy, in which yeast both ferment and respire. In this paper, we focus on the obligately aerobic treatment, as that is where we saw coexistence.
Conditions of the long-term evolution experiment
We evolved the 5 independent populations of obligate aerobes in 10 ml yeast extract peptone glycerol (YEPG; 1% yeast extract, 2% peptone and 2.5% glycerol) in 25 × 150 mm culture tubes for 24 h at 30 °C with 225 rpm shaking. To select for larger size, we transferred 1.5 ml of the culture after 24 h of growth into a 1.5 ml Eppendorf tube. For the PO lines, we let them settle for 4 min for the first 150 days and 3 min for the rest of the evolution experiment, discarded the supernatant and transferred the bottom 50 μl to start the next population. See ref. 12 for details on the PA and PM lines. In all cases, we used wide-bore filtered pipette tips (Thermo Fisher) to ensure that larger clusters can be transferred without fracture. The populations studied in this paper underwent 715 sequential rounds of growth and settling selection. Frozen glycerol stocks were created every 10–20 transfers and kept at −80 °C. Mixotrophs were evolved in YEP dextrose (YEPD) and obligate anaerobes were started with a petite (mitochondrially deficient) mutant and also evolved in YEPD (see ref. 12 for more details on the MuLTEE).
Estimating the number of generations
To estimate the number of generations elapsed over 715 transfers, we used data from ref. 12, in which we measured the biomass in the population by imaging at the beginning and at the end of a 24-h growth cycle for each of the 5 independently evolving lines in the MuLTEE at three time points: 200, 400 and 600 days (1,200, 2,400 and 3,400 generations, respectively). Next, we calculated the number of generations by taking the log2 of each day’s fold increase in biomass, assuming that days 0–200 were described by the t200 generation time measurement, 200–400 was described by the t400 generation measurement and so on. Using this approach, we estimated that the PO populations underwent ~4,300 generations of growth over the 715 transfers.
Detecting size polymorphism in t715 populations
At 715 transfers, 3 out of 5 replicate populations of obligately aerobic snowflake yeast appeared to be composed of both small and large genotypes. To determine whether the small groups present were simply fragments of large group-forming genotypes, or represent genotypes that are unable to form large groups, we isolated 10 small and 10 large clusters from each population using a Singer SporePlay tetrad dissecting microscope. We then grew each of these genotypes in isolation and measured their size distributions (Extended Data Fig. 1).
Isolation of small and large cluster types
To examine the dynamics of small and large-strain competition, we isolated a single pair of isolates from line PO-4, which we term Small and Large, respectively (Fig. 1). We marked the Small strain with yeGFP (plasmid pFA6a-TEF2Pr-eGFP-ADH1-Primer-NATMX4 amplified and inserted with LYS2 locus) using the LiAc/SS-DNA/PEG method of transformation62, allowing us to distinguish it from the unlabelled Large genotype during competition experiments. To measure the fitness cost of GFP expression, we labelled the unicellular ancestor (strain GOB8) with the same construct and competed it against its unlabelled counterpart. The cost was negligible (5 replicates, 2 transfers, t-test t = −1.26, P = 0.25; see Supplementary Fig. 1). Representative clusters were imaged using a Nikon AR1 confocal microscope.
Measuring cluster and population size
Cell, cluster and population size distributions were calculated from images of populations of clusters taken in 24-well plates on a Nikon Eclipse Ti-E microscope, with composite images taken from a 5 × 7 tiling array at ×40 magnification (Fig. 1). To measure the size of multicellular groups, we generated an automated image segmentation pipeline using ImageJ and MATLAB, which allowed us to measure the cross-sectional area of individual clusters.
Competition assays
The monocultures for small and large clusters were grown overnight in a shaking incubator (30 °C, 250 rpm) in fresh liquid media (YEPG) (Fig. 2). The density of each population was estimated before starting the competition with the following procedure: we diluted the overnight cultures 1,000-fold and placed 500 μl of the diluted cultures in a 24-well plate. We estimated densities by imaging the populations using a Nikon Eclipse Ti inverted microscope, counting cluster number via a custom script in ImageJ. We calculated the volume of starting culture on the basis of the cluster density and the desired starting frequency, aiming to start the competition with ~10,000 clusters per ml. The two phenotypes were placed together in fresh media and grown for 24 h. To calculate the frequency of both genotypes at the start of the experiment, we again used microscopy, differentiating between strains by the presence of a GFP marker (the small genotype was labelled). We performed settling selection from Day 1 cultures and measured the population densities before and after selection to disentangle the growth from the survival advantages of each type. To select for larger size, we placed 1.5 ml of the overnight culture in a 2 ml Eppendorf tube. After 4 min of settling, the bottom 50 μl of the biomass was selected for and placed in fresh media for the next growth phase. To increase the oxygen concentration in the supplementary oxygen treatment, air was blown into the tubes directly in the cultures11. We measured the oxygen present in the cultures over time using a fibre-optic oxygen optode (FireStingO2, PyroScience).
Frequency dependence during growth and survival
Frequency-dependent selection occurs when the fitness of a particular genotype or phenotype is dependent on its frequency in the population (this is different from density-dependent selection, which is based on population size or density, where selection pressures change with the abundance of individuals). To measure frequency dependence in our system, the Small and Large isolates were grown separately in fresh YEPG (Extended Data Fig. 5). To start the growth and selection phases from a wide range of initial frequencies of each phenotype (from 1% to 99% Large), we first estimated the population size at saturation using imaging. We mixed the Small and Large clusters with varying starting proportions while keeping a fixed number of clusters to start with. We measured the frequencies before and after either (1) one phase of growth (24 h), or (2) one phase of settling selection. We measured the mean cluster size and used these values to feed the model.
Sequencing data analysis
To quantify the genetic divergence between the Small and Large pheno types, we sequenced 3 Large and 3 Small isolates from line PO-4 after 715 days of evolution as well as the ancestor (Fig. 1). We extracted the DNA using the Life Science Yeast Genomic DNA Purification kit (VWR). We sent the samples for library preparation and sequencing at the Microbial Genome Sequencing Center (SeqCenter, https://www.seqcenter.com/). Illumina Nextera kit (Illumina) was used for library preparation and the samples were sequenced with the NextSeq 550 platform. We checked the 150 base pairs paired-end reads quality using FastQC (v.0.11.5, https://www.bioinformatics.babraham.ac.uk/projects/fastqc/) and decided to trim the first 15 cycles and the last cycle of the Illumina sequence run using FASTP (v.0.21.0)63. We kept reads with a PHRED score >30 with a tolerance of 5% of unqualified base pairs. We aligned the reads on the most recent version of the S288c strain reference genome (http://sgd-archive.yeastgenome.org/sequence/S288C_reference/genome_releases/S288C_reference_genome_Current_Release.tgz) using BWA-MEM (v.0.7.17-r1188)64. We used PICARD (v.2.24.0, http://broadinstitute.github.io/picard/), SAMTOOLS (v.1.7)65 and BAMTOOLS (v.2.3.0)66 to sort, index, remove duplicates and convert the aligned reads to bam. We removed duplicate reads before performing a quality check of the bam files with GATK ValidateSamFiles tool (GATK v.4.1.9.0). GATK HaplotypeCaller was used on the fixed bam files to call variants67. Next, we filtered out the low-quality variants by applying the following criteria on VCF files: minimum allele frequency of 0.1, quality score of 30, minimum depth of 12 and maximum depth of 350 using VCFtools (0.1.17)68. We compared the variants found in the ancestor to the variants found in the evolved lines to filter out the variants that were already present in the ancestor. All mutations were visually checked on Integrative Genomics Viewer (IGV, v.2.8.13)69 and filtered on the basis of the position (telomeric or not) and the quality of alignment files of both the ancestor and the evolved samples. We used Bayesian Evolutionary Analysis Sampling Trees (Beast2) to build the phylogeny with the Jukes–Cantor substitution model and a strict clock70,71.
Formulation of the general model
The experiment cycled through repeated rounds of growth and settling selection (Figs. 3 and 4). During the growth phase, the population expands by some factor and during settling selection, the population is reduced by some factor. We assume that the net result of these two phases maintains populations such that if populations expand during the growth phase by some factor , then settling selection reduces them by a factor .
If a mutant genotype arises within this system, a relevant metric of its fitness is then its proportion after a full cycle of growth and selection. For simplicity, we considered two genotypes, one that produces small snowflakes () and one that produces large snowflakes (). We let be the proportion of large snowflake groups at the start of the ith growth phase and then considered how the effects of growth and settling selection affect this proportion through one full cycle.
We modelled the effects of growth and settling selection by considering two maps. The first map, , connects the initial and final proportion of large snowflake groups resulting from the growth process. The second map, , describes how the proportion of large snowflake groups changes after settling selection. The net change in proportion of large snowflake groups depends on the composition of the two maps, that is, . To have stable coexistence between small and large snowflake groups, for some , which means that has a characteristic cubic function shape. Any function with such a shape will exhibit stable coexistence.
We can derive the growth map from a simple model of population growth (see Supplementary Methods for derivations) in which a population of cells in small and large clusters grows to a carrying capacity—some factor of this initial population size. We assume that the ratio of cells in large clusters versus small clusters is and the ratio of growth rates for small versus large is . We can calculate the proportion of clusters that are large after the growth phase, , by solving equation (1) for and then using this value to compute according to equation (2).
| (1) |
| (2) |
During settling selection, groups of cells compete to sink to the bottom. We can relate the size of a group to its likelihood of reaching the bottom via Stoke’s law. Stoke’s law states that the terminal velocity of a sphere is proportional to its radius squared, . We thus approximate small and large snowflake groups as large spheres composed of volumes equal to the total volume of cells they include. We can then use the relative values of the velocities from Stoke’s law to determine the fraction of small and large snowflakes that reach the bottom in time. Putting this together we get:
| (3) |
If we analyse the resulting composite map for the combined effects of growth and settling selection, we can find coexistence where large and small snowflake clusters persist in the population. Our model has three basic parameters: (1) the factor by which the population grows and contracts , (2) the ratio of the population growth rates which describes the growth advantage of small clusters and (3) the ratio of the cluster sizes which describes how much bigger large snowflakes are than small snowflakes.
The complete derivation of the growth and settling selection maps are in Supplementary Methods.
Monoculture evolutionary replay experiment
To determine whether the difference in size between large and small genotypes is due to character displacement, we evolved 4 replicate populations of the Large and Small isolates in monoculture for 40 days (Fig. 5) with identical media and settling selection conditions as the original MuLTEE experiment12. We captured images of an average of 1,224 clusters from each population at 6 distinct intervals: days 0, 5, 10, 15, 20 and 40. We used a custom MATLAB pipeline to process these images and extract data on cluster sizes.
Extended Data
Extended Data Fig. 1 |. Size distributions of isolates from the ancestor and the five lines subject to long term evolution, after 715 days of serial transfers ( ~ 4,300 generations).
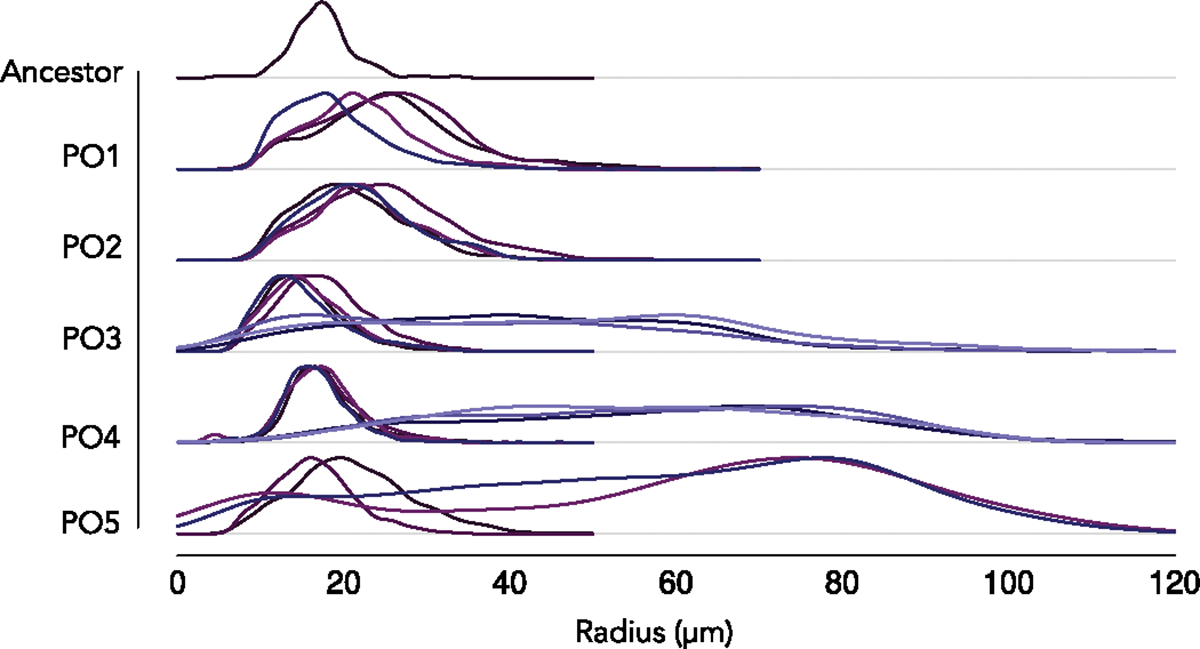
We observe the emergence of phenotypic diversity in lines PO-3, PO-4 and PO-5. The different colors denote different isolates.
Extended Data Fig. 2 |. Standing diversity within population PO-4.
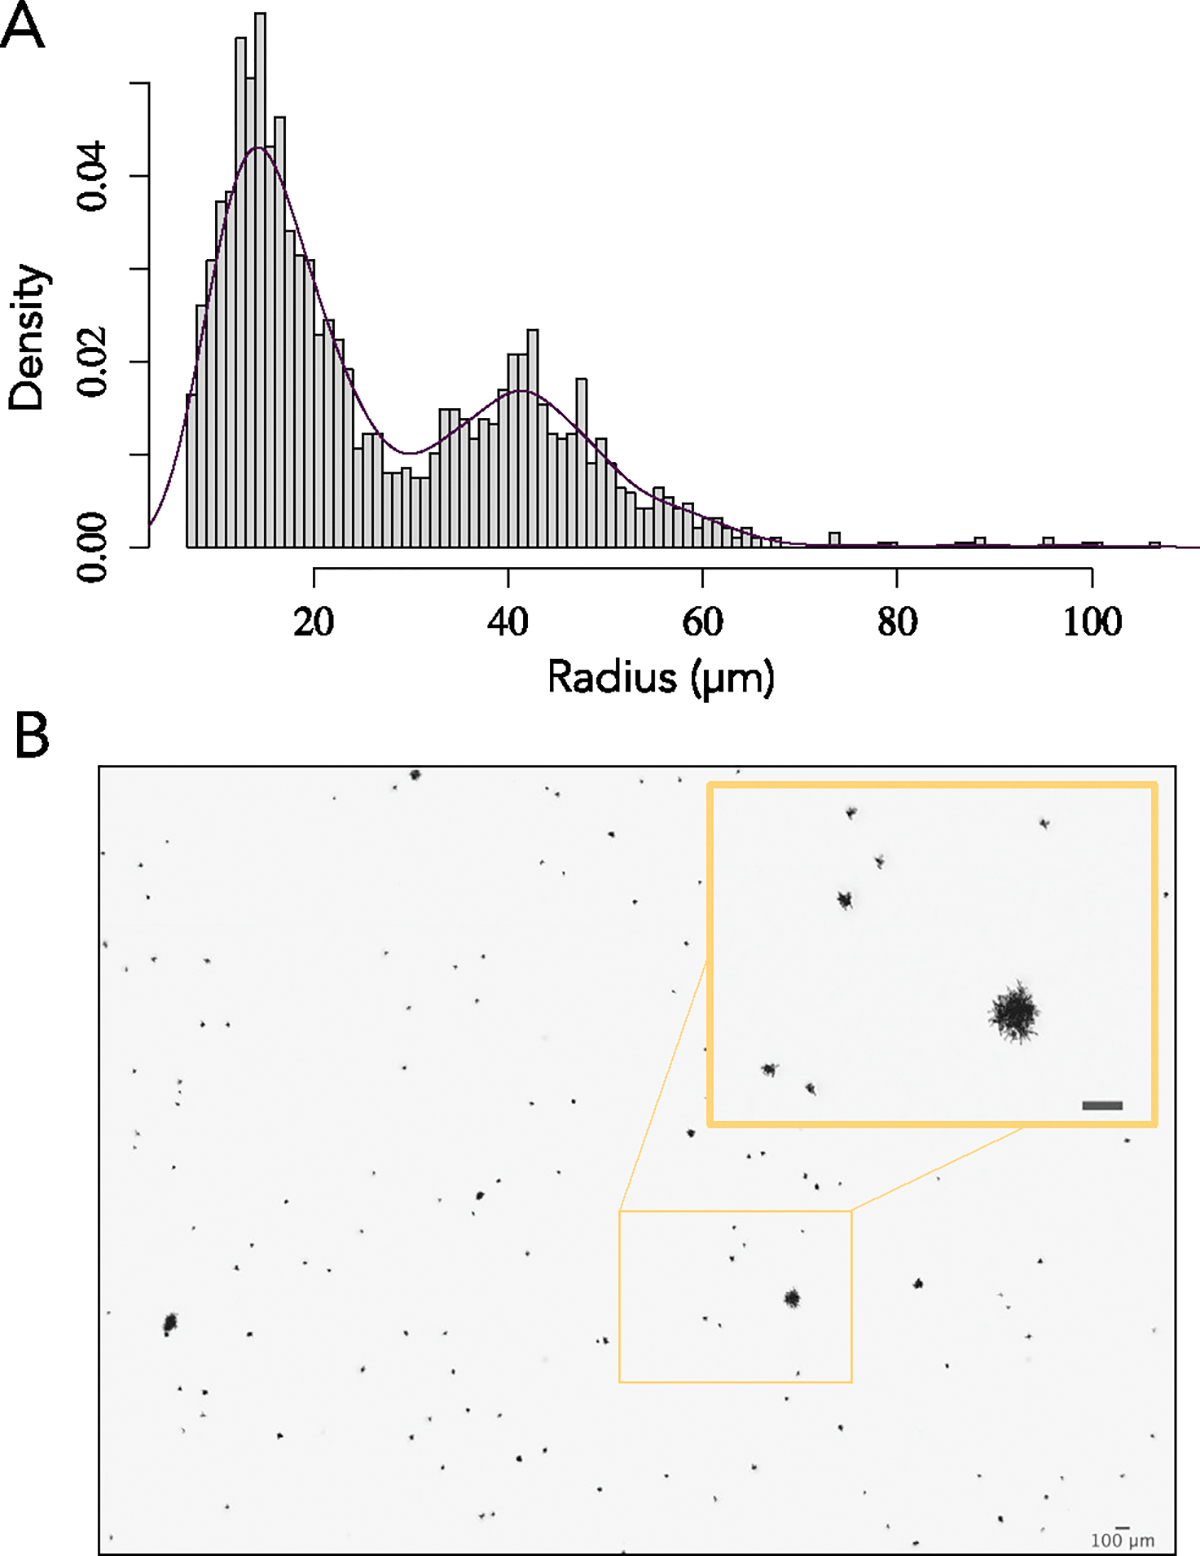
(A) Whole population size distribution (n > 1000) and b picture of PO-4 after 715 days of serial transfers ( ~ 4300 generations). Large-sized snowflake yeast were present at a mean frequency of 9.4% in the whole t715 population (Extended Data Fig. 4). This image is representative of the whole population.
Extended Data Fig. 3 |. Phylogeny of independently evolved line PO-3, showing deep divergence between Small and Large isolates.
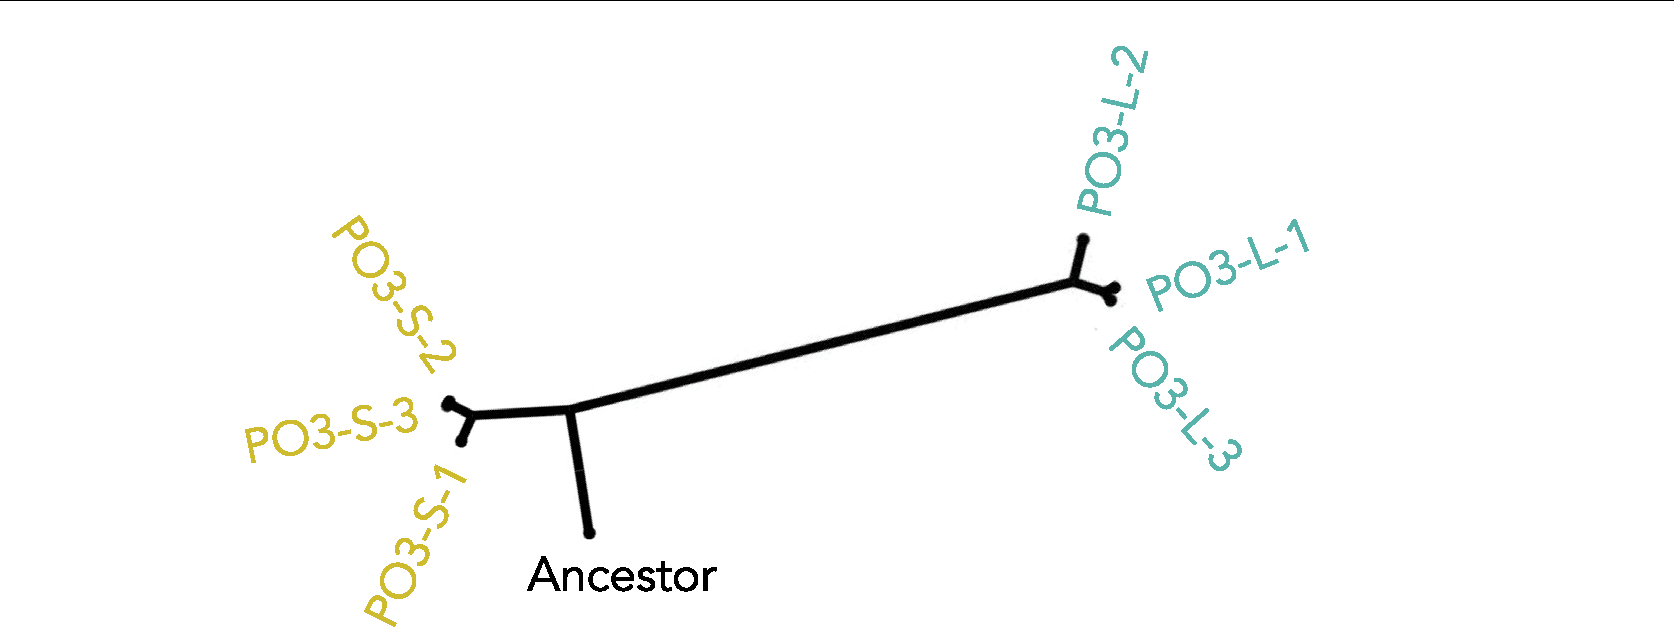
They do not share any mutations, indicating that the last common ancestor of these lineages was the genotype used to found the experiment, and these lineages have been coexisting for the full duration of the experiment. Here, the color represents the phenotype (Small or Large), and numbers PO-3–1, PO-3–2, and PO-3–3 represent three isolates of Small and Large yeast sampled from line PO-3.
Extended Data Fig. 4 |. Coexistence over time.
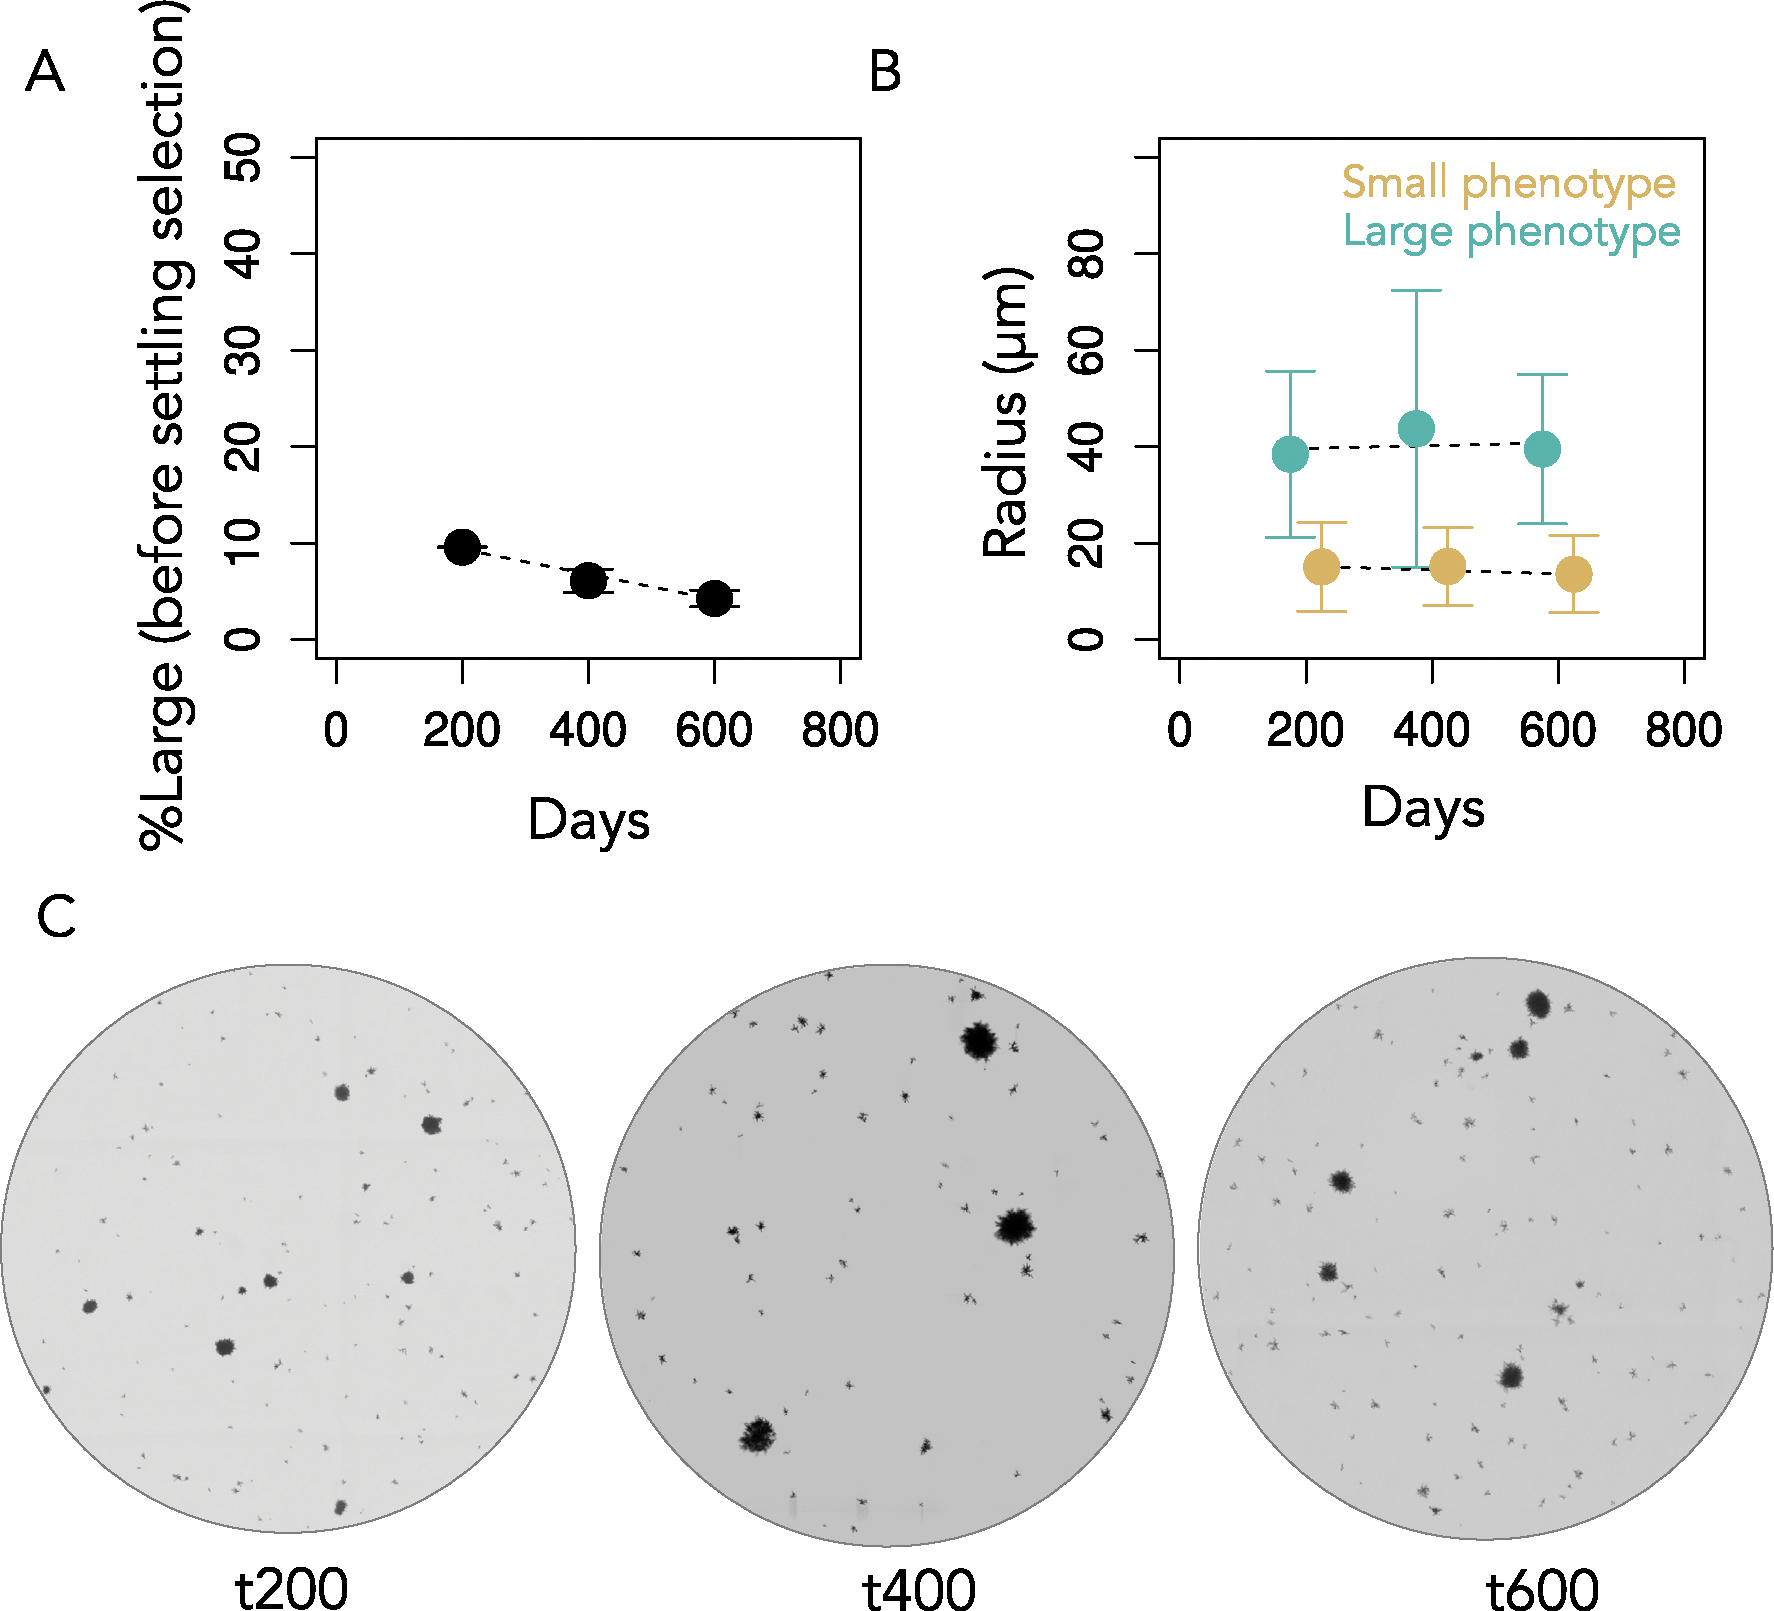
To examine the stability of coexistence throughout the experiment, we measured the frequency and group size at time 200, 400 and 600. We estimated the frequency of large and small phenotypes by segmenting microscopy images at these timepoints. (A) The large phenotype declined in frequency as a function of time, at approximately 1.3% per 100 transfers (y = 11.96 −.013x, P = 0.00017, linear regression. Adjusted R2 = 0.86). Bars represent one standard deviation. (B) There were no obvious differences in the size of large and small phenotypes over time, though the main effects of time and phenotype were highly significant (F1, 18173 = 226.8 and 6989.5, respectively, P < 10−15 for each, two-way ANOVA), as was the interaction between phenotype and time (F1,18173 = 23.7, P < 10−5). Bars represent one standard deviation. (C) Snapshots of PO-4 populations for each time point measured.
Extended Data Fig. 5 |. Frequency dependence and specialization along a growth-survival trade-off.
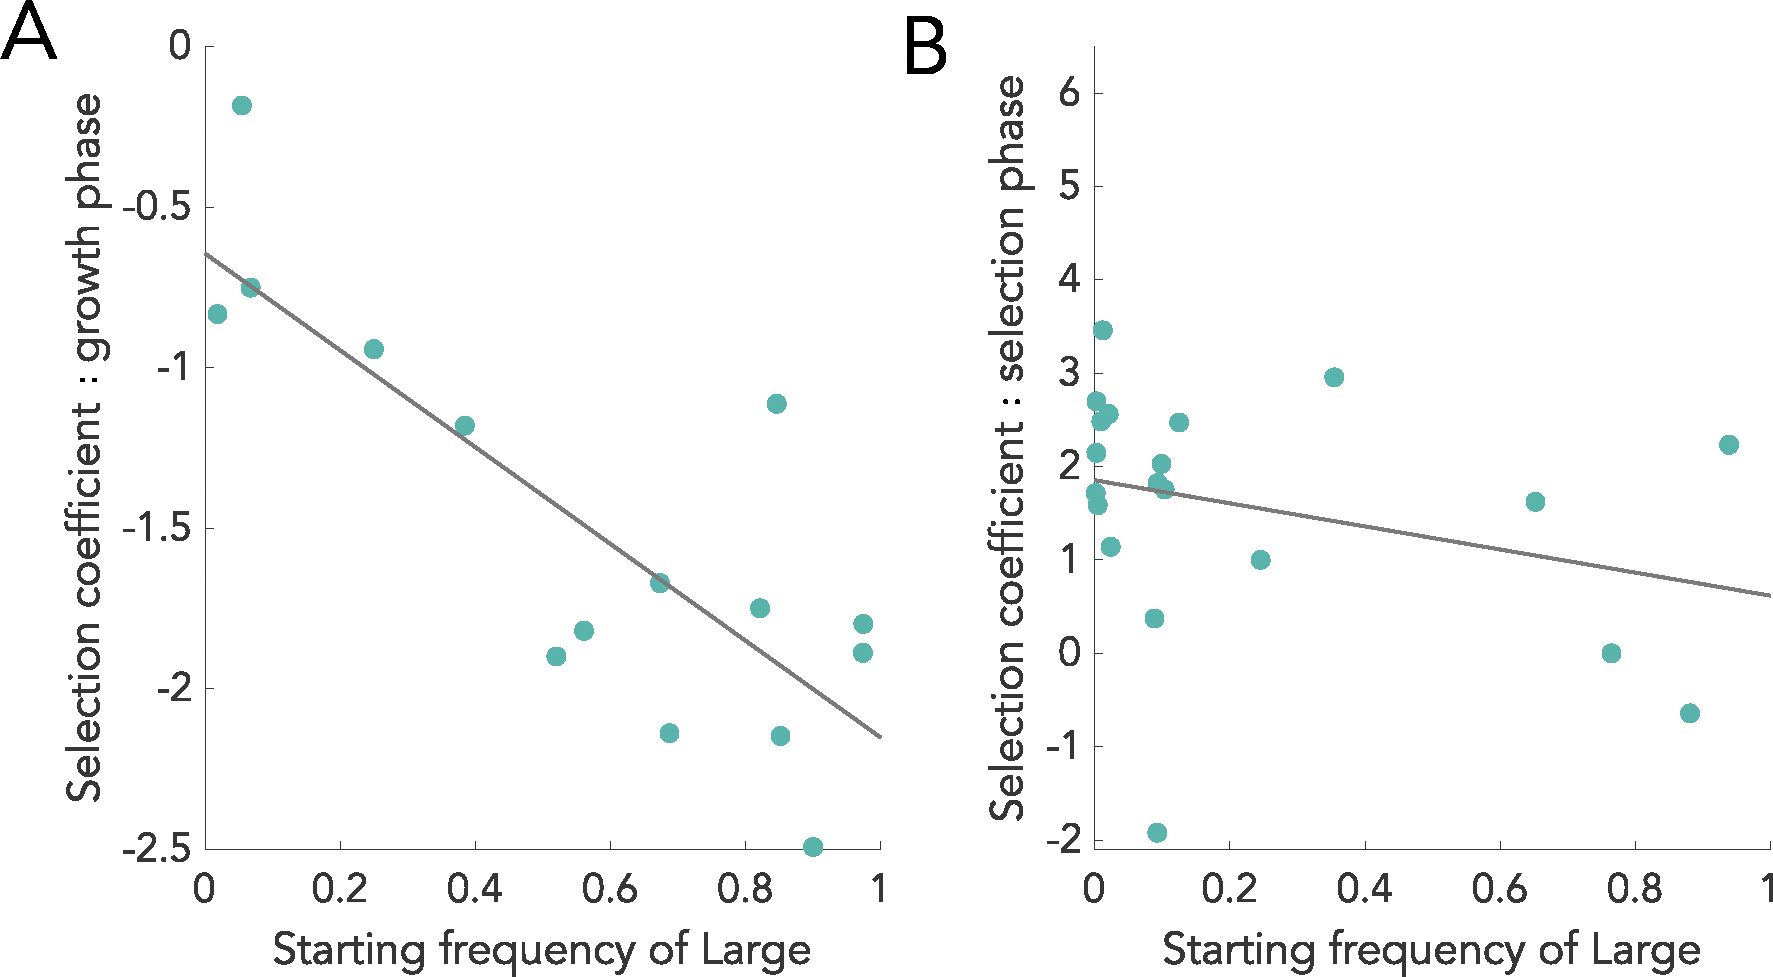
To test for frequency dependence in the experiment, we initiated one round of growth and one round of settling selection starting from a wide range of initial 10 frequencies (from 1% to 99%). The proportion of Large clusters after 24 hours of growth (A), but not after settling (B), is frequency dependent. Linear regression fit for growth: β = −1.5, R2 = 0.6, P = 0.0002; Linear regression fit for selection: β = −1.2, R2 = 0.04, P = 0.2.
Supplementary Material
Acknowledgements
We thank the members of the Ratcliff lab for their input on the project, as well as the GT QBioS Graduate Program for its support (this paper would not exist without the incredible work of program coordinator L. Redding). This work was supported by grants from the NIH (Grant No. 5R35GM138030) and the NSF Division of Environmental Biology (Grant No. DEB-1845363) to W.C.R. P.J.Y. acknowledges funding from the NIH National Institute of General Medical Sciences (Grant No. 1R35GM138354-01).
Footnotes
Competing interests
The authors declare no competing interests.
Reporting summary
Further information on research design is available in the Nature Portfolio Reporting Summary linked to this article.
Code availability
Codes used to generate the main figures are available on GitHub (https://github.com/Ratcliff-Lab/coexistence-paper.git).
Additional information
Extended data is available for this paper at https://doi.org/10.1038/s41559-024-02367-y.
Peer review information Nature Ecology & Evolution thanks Sean Buskirk, Milo Johnson and the other, anonymous, reviewer(s) for their contribution to the peer review of this work.
Reprints and permissions information is available at www.nature.com/reprints.
Supplementary information The online version contains supplementary material available at https://doi.org/10.1038/s41559-024-02367-y.
Data availability
Underlying data used to generate figures and raw data are available on GitHub (https://github.com/Ratcliff-Lab/coexistence-paper.git). Raw Illumina sequencing reads are available at the NIH Sequence Read Archive under accession number PRJNA1064559. Source data are provided with this paper.
References
- 1.Maloof AC et al. The earliest Cambrian record of animals and ocean geochemical change. GSA Bull. 122, 1731–1774 (2010). [Google Scholar]
- 2.McMahon S & Parnell J The deep history of Earth’s biomass. J. Geol. Soc. 175, 716–720 (2018). [Google Scholar]
- 3.Delwiche CF & Cooper ED The evolutionary origin of a terrestrial flora. Curr. Biol. 25, R899–R910 (2015). [DOI] [PubMed] [Google Scholar]
- 4.Odling-Smee FJ, Laland KN & Feldman MW Niche construction. Am. Nat. 147, 641–648 (1996). [Google Scholar]
- 5.Boyce CK The evolutionary history of roots and leaves. in Vascular Transport in Plants (eds Holbrook NM & Zwieniecki MA) 479–499 (Elsevier, 2005). [Google Scholar]
- 6.Kenrick P & Strullu-Derrien C The origin and early evolution of roots. Plant Physiol. 166, 570–580 (2014). [DOI] [PMC free article] [PubMed] [Google Scholar]
- 7.Rose CJ & Hammerschmidt K What do we mean by multicellularity? The evolutionary transitions framework provides answers. Front. Ecol. Evol 9, 730714 (2021). [Google Scholar]
- 8.Bonner JT The Evolution of Complexity by Means of Natural Selection (Princeton Univ. Press, 1988). [Google Scholar]
- 9.Bourrat P, Doulcier G, Rose CJ, Rainey PB & Hammerschmidt K Tradeoff breaking as a model of evolutionary transitions in individuality and limits of the fitness-decoupling metaphor. ELife 11, e73715 (2022). [DOI] [PMC free article] [PubMed] [Google Scholar]
- 10.Ratcliff WC, Denison RF, Borrello M & Travisano M Experimental evolution of multicellularity. Proc. Natl Acad. Sci. USA 109, 1595–1600 (2012). [DOI] [PMC free article] [PubMed] [Google Scholar]
- 11.Bozdag GO, Libby E, Pineau R, Reinhard CT & Ratcliff WC Oxygen suppression of macroscopic multicellularity. Nat. Commun. 12, 2838 (2021). [DOI] [PMC free article] [PubMed] [Google Scholar]
- 12.Bozdag GO et al. De novo evolution of macroscopic multicellularity. Nature 617, 747–754 (2023). [DOI] [PMC free article] [PubMed] [Google Scholar]
- 13.Pentz JT, Taylor BP & Ratcliff WC Apoptosis in snowflake yeast: novel trait, or side effect of toxic waste? J. R. Soc. Interface 13, 20160121 (2016). [DOI] [PMC free article] [PubMed] [Google Scholar]
- 14.Jacobeen S et al. Cellular packing, mechanical stress and the evolution of multicellularity. Nat. Phys. 14, 286–290 (2018). [DOI] [PMC free article] [PubMed] [Google Scholar]
- 15.Zamani-Dahaj SA et al. Spontaneous emergence of multicellular heritability. Genes 14, 1635 (2023). [DOI] [PMC free article] [PubMed] [Google Scholar]
- 16.Tong K, Bozdag GO & Ratcliff WC Selective drivers of simple multicellularity. Curr. Opin. Microbiol. 67, 102141 (2022). [DOI] [PubMed] [Google Scholar]
- 17.Knoll AH The multiple origins of complex multicellularity. Annu. Rev. Earth Planet. Sci. 39, 217–239 (2011). [Google Scholar]
- 18.Herron MD et al. De novo origins of multicellularity in response to predation. Sci. Rep. 9, 2328 (2019). [DOI] [PMC free article] [PubMed] [Google Scholar]
- 19.Kapsetaki SE & West SA The costs and benefits of multicellular group formation in algae. Evolution 73, 1296–1308 (2019). [DOI] [PubMed] [Google Scholar]
- 20.Rebolleda-Gómez M, Ratcliff WC, Fankhauser J & Travisano M Evolution of simple multicellularity increases environmental complexity. Preprint at bioRxiv 10.1101/067991 (2016). [DOI] [Google Scholar]
- 21.Ratcliff WC, Fankhauser JD, Rogers DW, Greig D & Travisano M Origins of multicellular evolvability in snowflake yeast. Nat. Commun. 6, 6102 (2015). [DOI] [PMC free article] [PubMed] [Google Scholar]
- 22.Levin B Frequency-dependent selection in bacterial populations. Phil. Trans. R. Soc. Lond. B 319, 459–472 (1988). [DOI] [PubMed] [Google Scholar]
- 23.Heino M, Metz JA & Kaitala V The enigma of frequency-dependent selection. Trends Ecol. Evol. 13, 367–370 (1998). [DOI] [PubMed] [Google Scholar]
- 24.Chevin L-M On measuring selection in experimental evolution. Biol. Lett. 7, 210–213 (2011). [DOI] [PMC free article] [PubMed] [Google Scholar]
- 25.Schirrmeister BE, de Vos JM, Antonelli A & Bagheri HC Evolution of multicellularity coincided with increased diversification of cyanobacteria and the great oxidation event. Proc. Natl Acad. Sci. USA 110, 1791–1796 (2013). [DOI] [PMC free article] [PubMed] [Google Scholar]
- 26.Szathmáry E & Smith JM The major evolutionary transitions. Nature 374, 227–232 (1995). [DOI] [PubMed] [Google Scholar]
- 27.Szathmáry E Toward major evolutionary transitions theory 2.0. Proc. Natl Acad. Sci. USA 112, 10104–10111 (2015). [DOI] [PMC free article] [PubMed] [Google Scholar]
- 28.Simpson GG Tempo and Mode in Evolution (Columbia Univ. Press, 1984). [Google Scholar]
- 29.Yoder J et al. Ecological opportunity and the origin of adaptive radiations. J. Evol. Biol. 23, 1581–1596 (2010). [DOI] [PubMed] [Google Scholar]
- 30.Le Hir G et al. The climate change caused by the land plant invasion in the Devonian. Earth Planet. Sci. Lett. 310, 203–212 (2011). [Google Scholar]
- 31.Dahl TW & Arens SK The impacts of land plant evolution on Earth’s climate and oxygenation state–an interdisciplinary review. Chem. Geol. 547, 119665 (2020). [Google Scholar]
- 32.Erwin DH & Tweedt S Ecological drivers of the Ediacaran-Cambrian diversification of Metazoa. Evol. Ecol. 26, 417–433 (2012). [Google Scholar]
- 33.Warren L et al. Origin and impact of the oldest metazoan bioclastic sediments. Geology 41, 507–510 (2013). [Google Scholar]
- 34.McIlroy D & Logan GA The impact of bioturbation on infaunal ecology and evolution during the Proterozoic-Cambrian transition. Palaios 14, 58–72 (1999). [Google Scholar]
- 35.Billingham J (ed.) Life in the Universe NASA Conference Pulication 2156 (NASA, 1981). [Google Scholar]
- 36.Kassen R The experimental evolution of specialists, generalists, and the maintenance of diversity. J. Evol. Biol. 15, 173–190 (2002). [Google Scholar]
- 37.Doebeli M, Ispolatov Y & Simon B Towards a mechanistic foundation of evolutionary theory. Elife 6, e23804 (2017). [DOI] [PMC free article] [PubMed] [Google Scholar]
- 38.Roff D Evolution of Life Histories: Theory and Analysis (Springer, 1993). [Google Scholar]
- 39.Stearns SC Trade-offs in life-history evolution. Funct. Ecol. 3, 259–268 (1989). [Google Scholar]
- 40.Sibly RM in Encyclopedia of Evolution (ed. Pagel M) 623–627 (Oxford Univ. Press, 2002). [Google Scholar]
- 41.Rainey PB & Travisano M Adaptive radiation in a heterogeneous environment. Nature 394, 69–72 (1998). [DOI] [PubMed] [Google Scholar]
- 42.Koza A, Moshynets O, Otten W & Spiers AJ Environmental modification and niche construction: developing O2 gradients drive the evolution of the wrinkly spreader. ISME J. 5, 665–673 (2011). [DOI] [PMC free article] [PubMed] [Google Scholar]
- 43.Kinnersley M et al. Ex uno plures: clonal reinforcement drives evolution of a simple microbial community. PLoS Genet. 10, e1004430 (2014). [DOI] [PMC free article] [PubMed] [Google Scholar]
- 44.Frenkel EM et al. Crowded growth leads to the spontaneous evolution of semistable coexistence in laboratory yeast populations. Proc. Natl Acad. Sci. USA 112, 11306–11311 (2015). [DOI] [PMC free article] [PubMed] [Google Scholar]
- 45.Mizuuchi R, Furubayashi T & Ichihashi N Evolutionary transition from a single RNA replicator to a multiple replicator network. Nat. Commun. 13, 1460 (2022). [DOI] [PMC free article] [PubMed] [Google Scholar]
- 46.Mahler DL, Revell LJ, Glor RE & Losos JB Ecological opportunity and the rate of morphological evolution in the diversification of Greater Antillean anoles. Evolution 64, 2731–2745 (2010). [DOI] [PubMed] [Google Scholar]
- 47.Wellborn GA & Langerhans RB Ecological opportunity and the adaptive diversification of lineages. Ecol. Evol. 5, 176–195 (2015). [DOI] [PMC free article] [PubMed] [Google Scholar]
- 48.Dobson A, Tilman D & Holt RD Unsolved Problems in Ecology (Princeton Univ. Press, 2020). [Google Scholar]
- 49.Godfray HCJ & May RM Open questions: are the dynamics of ecological communities predictable? BMC Biol. 12, 22 (2014). [DOI] [PMC free article] [PubMed] [Google Scholar]
- 50.Godfrey-Smith P in From Groups to Individuals: Evolution and Emerging Individuality (eds Bouchard F & Huneman P) Ch. 1 (MIT Press, 2013). [Google Scholar]
- 51.Bonner JT The origins of multicellularity. Integr. Biol. 1, 27–36 (1998). [Google Scholar]
- 52.Bonner JT Why Size Matters: From Bacteria to Blue Whales (Princeton Univ. Press, 2007). [Google Scholar]
- 53.Velicer GJ & Yu Y.-tN. Evolution of novel cooperative swarming in the bacterium Myxococcus xanthus. Nature 425, 75–78 (2003). [DOI] [PubMed] [Google Scholar]
- 54.Jeon KW Development of cellular dependence on infective organisms: micrurgical studies in amoebas. Science 176, 1122–1123 (1972). [DOI] [PubMed] [Google Scholar]
- 55.Barber JN et al. The evolution of coexistence from competition in experimental co-cultures of Escherichia coli and Saccharomyces cerevisiae. ISME J. 15, 746–761 (2021). [DOI] [PMC free article] [PubMed] [Google Scholar]
- 56.Blount ZD, Borland CZ & Lenski RE Historical contingency and the evolution of a key innovation in an experimental population of Escherichia coli. Proc. Natl Acad. Sci. USA 105, 7899–7906 (2008). [DOI] [PMC free article] [PubMed] [Google Scholar]
- 57.Mukherjee A et al. Coexisting ecotypes in long-term evolution emerged from interacting trade-offs. Nat. Commun. 14, 3805 (2023). [DOI] [PMC free article] [PubMed] [Google Scholar]
- 58.Velicer GJ, Kroos L & Lenski RE Developmental cheating in the social bacterium Myxococcus xanthus. Nature 404, 598–601 (2000). [DOI] [PubMed] [Google Scholar]
- 59.Hart SFM, Pineda JMB, Chen C-C, Green R & Shou W Disentangling strictly self-serving mutations from win-win mutations in a mutualistic microbial community. Elife 8, e44812 (2019). [DOI] [PMC free article] [PubMed] [Google Scholar]
- 60.Harcombe W Novel cooperation experimentally evolved between species. Evolution 64, 2166–2172 (2010). [DOI] [PubMed] [Google Scholar]
- 61.Ratcliff WC et al. Experimental evolution of an alternating uni- and multicellular life cycle in Chlamydomonas reinhardtii. Nat. Commun. 4, 2742 (2013). [DOI] [PMC free article] [PubMed] [Google Scholar]
- 62.Gietz RD & Schiestl RH Quick and easy yeast transformation using the LiAc/SS carrier DNA/PEG method. Nat. Protoc. 2, 35–37 (2007). [DOI] [PubMed] [Google Scholar]
- 63.Chen S, Zhou Y, Chen Y & Gu J fastp: an ultra-fast all-in-one FASTQ preprocessor. Bioinformatics 34, i884–i890 (2018). [DOI] [PMC free article] [PubMed] [Google Scholar]
- 64.Li H Aligning sequence reads, clone sequences and assembly contigs with bwa-mem. Preprint at 10.48550/arXiv.1303.3997 (2013). [DOI]
- 65.Li H et al. The sequence alignment/map format and samtools. Bioinformatics 25, 2078–2079 (2009). [DOI] [PMC free article] [PubMed] [Google Scholar]
- 66.Barnett DW, Garrison EK, Quinlan AR, Strömberg MP & Marth GT Bamtools: a C++ API and toolkit for analyzing and managing BAM files. Bioinformatics 27, 1691–1692 (2011). [DOI] [PMC free article] [PubMed] [Google Scholar]
- 67.Van der Auwera GA et al. From FastQ data to high-confidence variant calls: the genome analysis toolkit best practices pipeline. Curr. Protoc. Bioinformatics 43, 11.10.1–11.10.33 (2013). [DOI] [PMC free article] [PubMed] [Google Scholar]
- 68.Danecek P et al. The variant call format and vcftools. Bioinformatics 27, 2156–2158 (2011). [DOI] [PMC free article] [PubMed] [Google Scholar]
- 69.Robinson JT, Thorvaldsdóttir H, Turner D & Mesirov JP igv.js: an embeddable Javascript implementation of the Integrative Genomics Viewer (IGV). Bioinformatics 39, btac830 (2023). [DOI] [PMC free article] [PubMed] [Google Scholar]
- 70.Jukes TH & Cantor CR et al. in Mammalian Protein Metabolism (ed. Munro HN) 21–132 (Academic Press, 1969). [Google Scholar]
- 71.Bouckaert R et al. BEAST 2: a software platform for Bayesian evolutionary analysis. PLoS Comput. Biol. 10, e1003537 (2014). [DOI] [PMC free article] [PubMed] [Google Scholar]
Associated Data
This section collects any data citations, data availability statements, or supplementary materials included in this article.
Supplementary Materials
Data Availability Statement
Underlying data used to generate figures and raw data are available on GitHub (https://github.com/Ratcliff-Lab/coexistence-paper.git). Raw Illumina sequencing reads are available at the NIH Sequence Read Archive under accession number PRJNA1064559. Source data are provided with this paper.