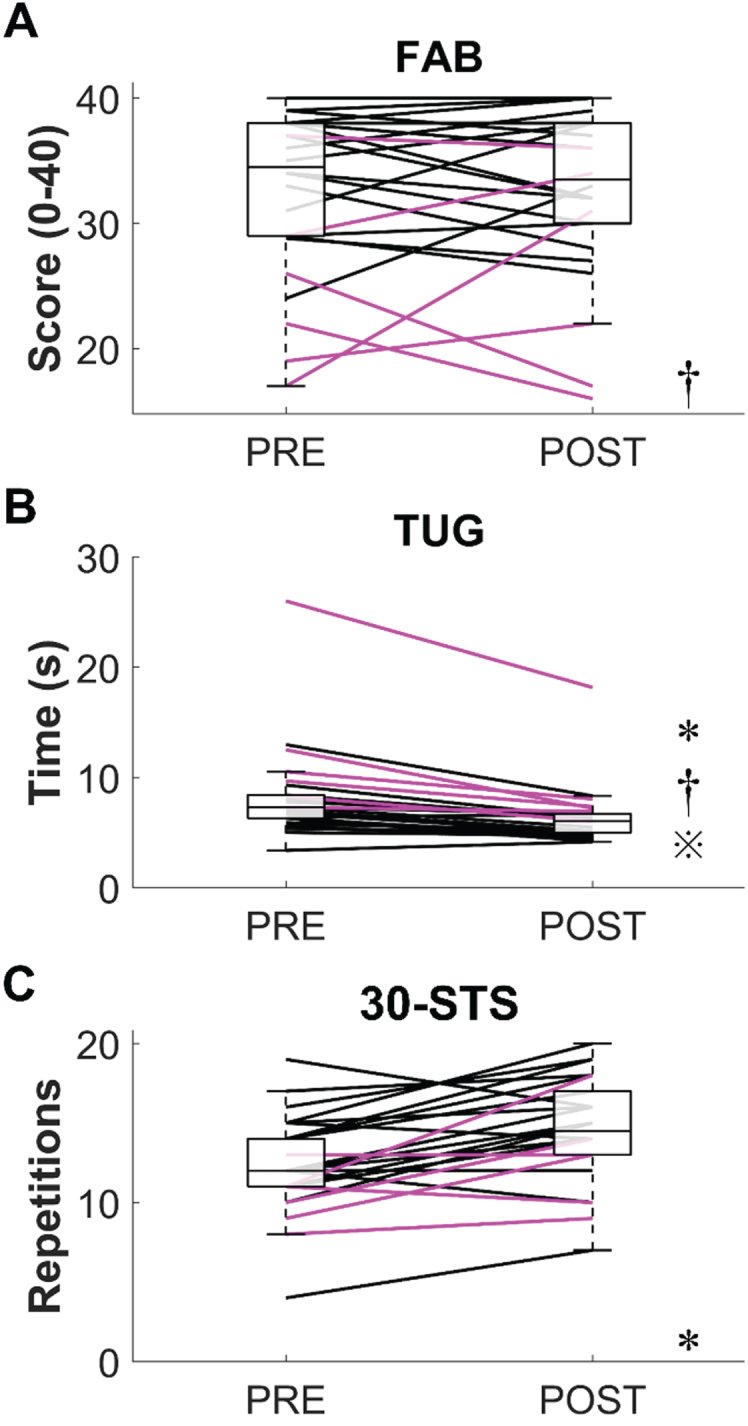
Fig. 1.

Results from the physical functioning tests. A) Fullerton Advanced Balance (FAB) scale. B) Timed Up-and-Go (TUG) test. C) 30-second Sit-to-Stand (30-STS) test. The boxplots represent the data aggregated from all participants regardless of their Hoehn and Yahr (HY) stage at PRE and POST. The black and magenta lines respectively represent individual data from HYI-II and HYIII-IV participants. *, significant difference between PRE and POST (all participants). †, significant difference between HYI-II and HY III-IV at PRE.  , significant difference between HYI-II and HY III-IV at POST.
