Abstract
CO2 from carbonate-based capture solutions requires a substantial energy input. Replacing this step with (bi)carbonate electrolysis has been commonly proposed as an efficient alternative that coproduces CO/syngas. Here, we assess the feasibility of directly integrating air contactors with (bi)carbonate electrolyzers by leveraging process, multiphysics, microkinetic, and technoeconomic models. We show that the copresence of CO32– with HCO3– in the contactor effluent greatly diminishes the electrolyzer performance and eventually results in a reduced CO2 capture fraction to ≤1%. Additionally, we estimate suitable effluents for (bi)carbonate electrolysis to require 5–14 times larger contactors than conventionally needed contactors, leading to unfavorable process economics. Notably, we show that the regeneration of the capture solvent inside (bi)carbonate electrolyzers is insufficient for CO2 recapture. Thus, we suggest process modifications that would allow this route to be operationally feasible. Overall, this work sheds light on the practical operation of integrated direct air capture with (bi)carbonate electrolysis.
Achieving global net-zero climate targets by the end of the century requires the capture of carbon dioxide (CO2), either in concentrated forms or directly from the atmosphere using CO2 removal (CDR) technologies.1,2 One of the most promising CDR pathways is via direct air capture (DAC), which uses a solid/liquid solvent (e.g., KOH) or sorbent (e.g., cellulosic-based amines) to capture CO2 from the atmosphere.3−5 Although both solid/liquid solvents and sorbents have been commonly used in DAC applications, the current most cost-effective and scalable option is the liquid alkaline solvent.3 In a typical liquid alkaline DAC process, ambient air passes through a CO2-absorbing medium in an air contactor, forming a CO2–adduct intermediate, which can be integrated into CO2 removal and solvent recycling techniques.3 These routes have enabled the foundation of rapidly developing DAC companies such as Climeworks,6 Carbon Engineering,7 and Global Thermostat.8
Unfortunately, the reported total energy consumption of DAC (i.e., CO2 capture and regeneration from air) is high, ranging from 5.50 to 9.50 GJ/t-CO2 (i.e., from 242.1 to 418.1 kJ/mol-CO2).2 Because CO2 capture is highly exothermic (eqs 1 and 4), its release from the capture solvent requires substantial regeneration energy to recover the captured CO2 in a high-purity form and allow for the solvent to be regenerated in order to recapture fresh CO2.3,5,9,10 Concentrated hydroxide-based DAC processes, which capture CO2 using hydroxides to form carbonates, requires a particularly high temperature (≥900 °C) to dissociate the metal carbonate into metal oxide and CO2 via calcination.5,11 This high temperature is challenging to reach via electrical energy input alone and requires a thermal energy input of 4.05 GJ/t-CO2 (i.e., 178.2 kJ/mol-CO2).5,12,13 Comparatively, the established monoethanolamine (MEA) solvent recovery method can be performed at much milder temperatures of 80–120 °C, which can be achieved from waste heat and renewable electricity integrations. However, the MEA/CO2 regeneration step still requires a regeneration energy input in the range of 2.00–5.50 GJ/t-CO2 (i.e., 88.0–242.1 kJ/mol-CO2).14−16
The costly energetics of recovering CO2 from capture solvents has motivated efforts to combine the CO2 removal step with a CO2 conversion step,14,17−20 effectively integrating CO2 capture and conversion into a single cycle. For the hydroxide route, for example, CO2 will leave the air contactors in the form of both bicarbonates and carbonates (hereinafter referred to as (bi)carbonates). Electrolyzers utilizing reverse-biased bipolar membranes (BPMs), which separate the cathode from the anode and split water into protons and hydroxides, can then modulate the pH of the (bi)carbonate solution to generate CO2in situ. The CO2 can then be further reduced into more valuable intermediates or products.19 By the absence of the energy-intensive CO2 regeneration steps, the thermodynamic favorability of directly converting captured CO2 to products would be very compelling.
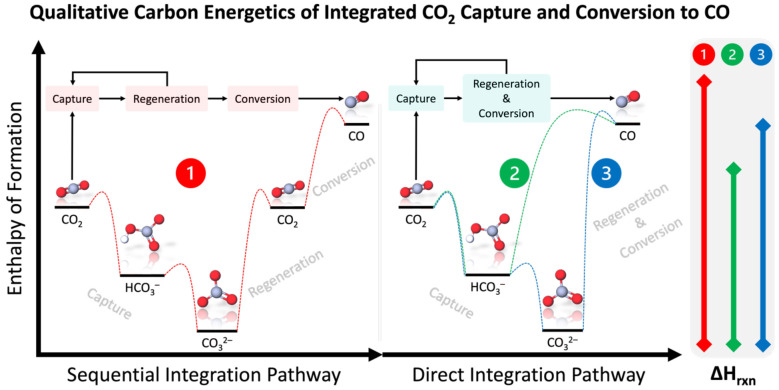
Figure 1 qualitatively shows the energetics of the sequential and direct integration routes of CO2 capture and conversion, highlighting the required regeneration of CO2 in the sequential routes as opposed to the direct conversion of (bi)carbonates in the direct integration route. While the putative mechanism in both the sequential and direct pathways is the conversion of molecular CO2 (either fed directly or generated in situ), we choose to use the terminology “(bi)carbonate electrolysis” to distinguish between the CO2 sources and to be consistent with the phrasing in the literature.10,17,18,20−27 It is also worthwhile to note that CO2 electrolysis takes a feed of gaseous CO2 whereas (bi)carbonate electrolysis takes a feed of liquid (bi)carbonates, which enables the possibility of directly integrating CO2 capture and conversion. Thus, multiple research groups have proposed the replacement of the high-temperature (900 °C) solvent/CO2 regeneration steps in hydroxide-based DAC with a single low-temperature (≤80 °C) (bi)carbonate electrolysis step, aiming to concurrently regenerate the hydroxide-based solvent and produce more desired products such as CO or syngas (i.e., a mixture of CO and H2).10,17−20,28,27,21
Figure 1.
Qualitative carbon energetics of CO2 capture and conversion to CO via the sequential integration pathway (i.e., integrated air contactor, CO2 regeneration, and CO2 conversion: 1, red) and via the direct integration pathway (i.e., integrated air contactor with bicarbonate and carbonate conversions: 2 and 3, green and blue). Note that we do not show the detailed mechanism of these molecular transformations but indicate the presence of transition states in each. We do not include the in situ CO2 regeneration in the direct integration pathway to highlight the promise of combining the regeneration and conversion steps into a single step. Also note the qualitative energy requirement scale at the right-hand side of the figure, which qualitatively emphasizes the thermodynamic favorability of directly converting captured CO2 (i.e., (bi)carbonates) into desired products.
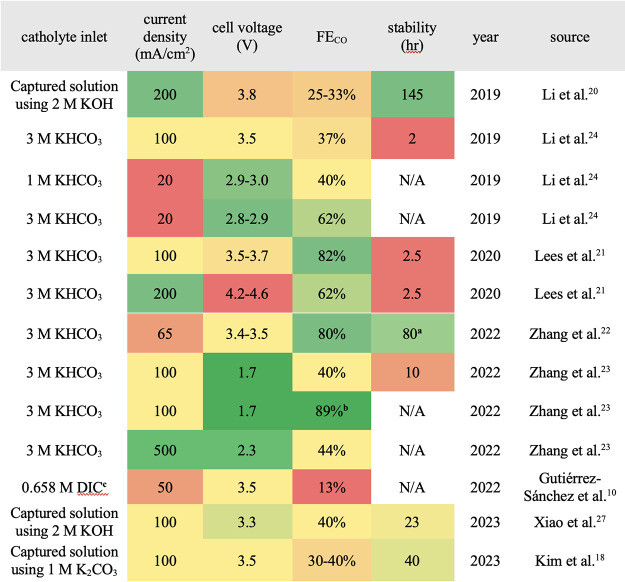
In the past few years, there have been many examples of integrated CO2 capture and (bi)carbonate electrolysis proposed in the literature. For example, Li et al.20 attempted to integrate the capture and conversion steps in a lab-scale system, where CO2 was captured by a 2 M KOH solution in a bottle and the captured (bi)carbonate mixture was converted to syngas in an electrolyzer with a BPM. The authors were able to show continuous syngas production at an H2:CO ratio between 2:1 (Faradaic efficiency of CO (FECO) ≈ 33%) and 3:1 (FECO ≈ 25%) for 145 h at 3.8 V (energy efficiency (EE) ≈ 35%) and 200 mA/cm2.20 Later, Xiao et al.27 used the same setup but with a cation exchange membrane rather than a BPM and with a CO2 diffusion adlayer that limited the transfer of protons to the catalyst layer, improving the overall carbon efficiency of the process. With these changes, they were able to improve the FECO to 40% and reduce the cell voltage to approximately 3.3 V (EE ≈ 40%) at 100 mA/cm2, although their system was tested for only 23 h.
Lees and co-workers21 designed a bicarbonate electrolyzer with a BPM, intending to integrate it with an air contactor to develop an energy- and cost-efficient air-to-syngas/CO system. They utilized a 3 M KHCO3 catholyte and were able to achieve a FECO of 82% (H2:CO ratio ≈ 0.2) at a current density of 100 mA/cm2 and a cell voltage of 3.5 V (EE ≈ 38%). However, they found that a higher applied current density of 200 mA/cm2 not only increases the cell voltage but also reduces the FECO to about 60% (H2:CO ratio ≈ 0.67).21 Further work by Zhang et al.22,23 demonstrated that changing the anodic reaction to H2 oxidation and applying higher pressures of up to 4 atm can increase the FECO back to high levels (≥80%) and reduce the cell voltage to around 2.00 V (EE ≈ 67%), however at current densities of ≤100 mA/cm2. More recently, Kim et al.18 built an integrated system composed of a stainless steel CO2 absorber and a (bi)carbonate electrolyzer. They used a 1 M K2CO3 solution as the capture solvent to produce KHCO3, which could be fed to the electrolyzer for high CO formation and selectivity. Their integrated system was able to produce syngas at an H2:CO ratio of 1.5–2.3 (FECO ≈ 30–40%), a cell voltage of 3.5 V (EE ≈ 38%), and a current density of 100 mA/cm2.18
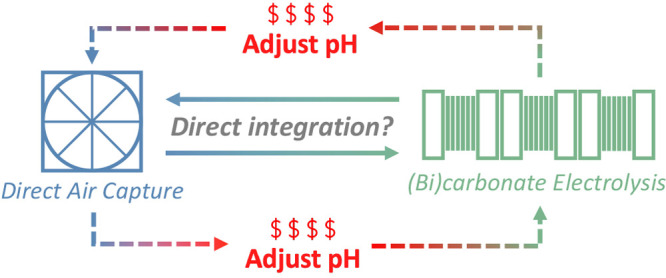
The contribution of these efforts, summarized in Table 1, has enabled the research field to understand and improve (bi)carbonate electrolysis of CO2, providing valuable insights into both the opportunities and limitations of the technology. A key missing piece of research to date, however, is a discussion on the trade-offs of a fully closed integrated capture-and-conversion loop (Figure 2a). Most critically, a circular CO2 capture-and-conversion process requires the outlet solvent of a (bi)carbonate electrolyzer to recapture CO2 again once passed through an air contactor. For this to be possible, the (bi)carbonate electrolyzer must subsequently release and convert most of the absorbed CO2. As an example, if an air contactor captures CO2 with a 1.00 M KOH solvent, a (bi)carbonate electrolyzer should be able to return the same 1.00 M KOH back to the air contactor. To the best of our knowledge, the ability of the catholyte outlet to recapture CO2 continuously for long durations (≥1000 h) has not yet been demonstrated experimentally, which is an essential step for providing long-term, large-scale, and durable CDR.
Table 1. Summary of Previous (Bi)carbonate Electrolysis Works That Considered the Direct Integration Routed.
The stability test was run for 80 h with KHCO3 being refreshed every 500 s.22
Pressurized to 3.5 atm to yield 89%, but no stability/durability test was provided.23
DIC: dissolved inorganic carbon. The 0.658 M DIC contains 0.166 M HCO3– and 0.492 M CO32–.10
The performance metrics (columns) are separately color-coded. Greener colors show the best performance metric achieved, and the redder colors show the worst performance metric achieved. N/A results were not provided by the authors of the cited works.
Figure 2.
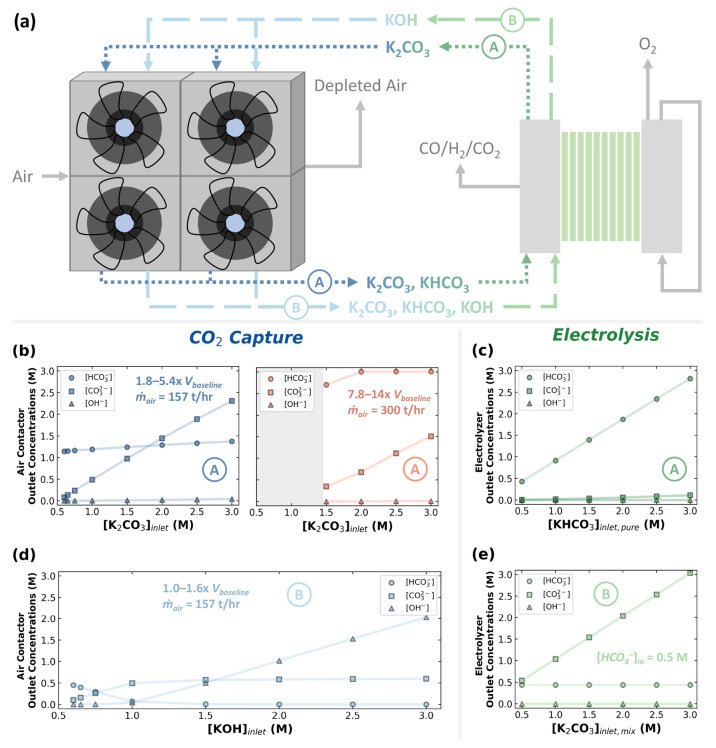
(a) Schematic of the literature-proposed integration route showing the air contactors on the left and the electrolyzer stacks on the right. Note the two possible pathways: (A) K2CO3-based and (B) KOH-based capture. The air contactor outlet concentrations of HCO3–, CO32–, and OH– as a function of the air contactor inlet concentration of (b) K2CO3 and (d) KOH are shown. The right-hand plot in (b) shows the outlet anionic species concentrations after increasing the air flow rate and contactor volume for the inlet K2CO3 concentrations of 2–3 M. The catholyte outlet concentrations of HCO3–, CO32–, and OH– as a function of the catholyte inlet concentration of (c) KHCO3 and (e) K2CO3/KHCO3 mixtures are also shown. For all air contactor calculations, except for (b)-right, we assume a CO2 absorption rate of 646 t-CO2/yr at a CO2 capture fraction of approximately 78%. For (b)-right, the CO2 absorption rate is 1340–1454 5-CO2/yr and the CO2 capture fraction is 85–93%.
Indeed, the requirements for designing a circular capture-conversion process are uncertain for two reasons. First, for a (bi)carbonate electrolyzer to regenerate the capture solvent, much of the reactor will move away from optimal operating conditions (e.g., 3.00 M KHCO3 for CO production), resulting in poorer overall CO partial current densities and FECO. Second, if the (bi)carbonate electrolyzer cannot fully regenerate the same alkaline solvent concentrations, then the size of the air contactor must be increased to capture the same amount of CO2, but with more sluggish kinetics due to reduced alkalinity. These trade-offs are critical to the design of potential integrated routes, but have yet to be addressed. Specifically, the major focus of integrated capture-and-conversion systems has been centered on the ability of a (bi)carbonate electrolyzer to form the desired products while ignoring its ability to regenerate the capture solvent concentrations and pH.
In this work, we directly address this knowledge gap by describing the practical trade-offs between the performance of air contactors and the performance of (bi)carbonate electrolyzers to identify the physical, economic, and practical challenges faced by the direct integration route, as shown in Figure 2a. Our results, drawn from mass-balance, microkinetic, and multiphysics modeling, underscore the inability of (bi)carbonate electrolyzers to regenerate the desired solvent concentrations and pH. We show that the CO2 capture fraction significantly decreases with time, demonstrating the effect of HCO3– accumulation on the CO2 capture ability of the electrolyzer outlet stream. In addition, our contactor sizing calculations elucidate the necessary increase in contactor volume depending on the solvent choice and input concentration. Finally, we demonstrate that a practical capture-conversion system requires the addition of external pH adjustment steps, which could negatively influence the economics of the integrated pathway. Our high-level analysis can guide the field toward the most relevant research targets for integrating DAC with carbon-based electrolysis; thus contributing to meeting carbon neutrality targets as we approach the middle of the century.
Mass Balances of the Air Contactor and (Bi)carbonate Electrolyzer
The direct integrated route of capture and conversion of atmospheric CO2 is shown in Figure 2a, where air contactors are envisioned to be integrated with the electrolyzer stacks. To realize this integration, two conditions must be satisfied. First, the air contactor liquid effluent needs to produce a (bi)carbonate mixture with a neutral or mildly alkaline pH before feeding into the electrolyzer. This condition has been shown to allow (bi)carbonate electrolyzers to achieve reasonably high FECO and CO partial current densities at relatively low cell voltages.21−24 Second, the electrolyzer cathodic outlet needs to regenerate the alkaline solvent at a high pH, as needed by the air contactor. This condition enables fast recapture of fresh CO2 from the atmosphere5 and low capital costs of the air contactor, as will be shown later in this work. It is important to note that the pH of a solution is related to the proton concentration in the same solution. Thus, performing a mass balance using the concentration of species is necessary to determine the pH of the liquid streams in our system.
To estimate the air contactor outlet composition with a changing solvent concentration, we use a verified DAC plant model from our previous work.13 To fairly compare the mass-balance and equipment sizing results, we fix the captured CO2 rate at 646 t-CO2/yr, comparable to the CO2 capture rate of a single air contactor unit as developed by Keith and colleagues.5 We assume constant flow rates of the air and liquid solvent inlets, unless otherwise noted. To capture the same amount of CO2 under these conditions, with different compositions and concentrations of the solvent, we vary the length of the air contactor, which is directly proportional to its volume. We further consider a specific case in which we vary the inlet air flow rate and the contactor length to produce approximately 3.00 M HCO3– in the contactor effluent stream, which is the optimal HCO3– concentration ([HCO3–]) demonstrated for liquid-based CO2 electrolysis to CO.21,24 In this case, the amount of absorbed CO2 is increased due to increasing the air mass flow rate from 157 to 300 t-air/h such that the [HCO3–] reaches the desired 3.00 M value.
Throughout this work, we consider two routes: (A) the integration of a K2CO3-based air contactor with an electrolyzer that is fed with KHCO3 and (B) the integration of a KOH-based contactor with an electrolyzer is fed with a mixture of K2CO3 and KHCO3. For simplicity, we assume no loss of potassium ions during the cyclic process. The first route captures CO2 using a K2CO3 solution, which forms KHCO3 (eq 1) or K+ and HCO3– ions (eq S.23) in the aqueous phase (more detailed review of CO2 capture by K2CO3 can be found elsewhere18,29). The aqueous solution is then sent to a BPM electrolyzer to generate CO2in situ using 1 mol of H+ per mole of HCO3– (eq 2). The in situ CO2 is finally reduced electrochemically to form CO and carbonates using HCO3– as a proton source (eq 3), which is found at appreciable concentrations (≥0.5 M) and high current densities (≥100 mA/cm2) near the catalyst layer due to the neutralization of the alkaline reaction products (CO32–/OH–) by the protons conducted through bipolar membrane or cation exchange membrane.25,26 More information can be found in section S.10 of the Supporting Information.
| 1 |
| 2 |
| 3 |
The second route captures CO2 using KOH, forming K2CO3 as a main product (eq 4) or two K+ ions and one CO32– ion (eq S.24). The solution is then sent to a BPM electrolyzer to generate CO2in situ. However, 2 mol of H+ is now required per mole of CO32– to form CO2 (eq 5). Finally, the CO2 is electroreduced to CO and OH– (eq 6) using H2O as a proton source. We note that HCO3– ions could be intermediate products, which could possibly be used as proton sources for CO2 electrochemical reduction, as shown in eq 3. However, for simplicity, we do not consider HCO3– as the proton source in K2CO3-based CO2 electrolysis. Details of the enthalpy of reaction calculations are provided in subsection S.8.2 of the Supporting Information.
| 4 |
| 5 |
| 6 |
To begin our analysis, we examine the effect of the capture solvent choice and concentration on the resulting capture effluent composition, which is fed into the (bi)carbonate electrolyzer. Figure 2b (left) and Figure 2d show the outlet concentrations of the ionic species (i.e., [HCO3–], [CO32–], and [OH–]) as a function of the contactor inlet [K2CO3] and [KOH], respectively. Again, we consider the cation to be K+ in all cases with no or negligible losses; thus, we focus on only the anionic species in the mass balances for simplicity. We notice that at low solvent concentrations of approximately 0.60–0.65 M, the captured effluent solution is mostly composed of HCO3– ions with concentrations of 1.14 and 0.45 M for the K2CO3 (route A) and KOH (route B) cases, respectively. As the solvent inlet concentration increases from 0.60 to 1.00 M, [CO32–] also increases in both cases from approximately 0.10 to 0.50 M. However, using a 1 M K2CO3 capture solvent mostly produces HCO3– in the contactor effluent (1.19 M), whereas using the more alkaline 1 M KOH solvent mostly produces CO32– (0.50 M) with a small amount of HCO3– (0.07 M).
Furthermore, Figure 2b (left) shows that the outlet [HCO3–] from the contactor does not significantly increase with higher [K2CO3] in the inlet stream. Indeed, a 3 M K2CO3 capture solution produces only 1.37 M HCO3–, which is below the 3.00 M target needed for electrolysis to produce CO at moderate to high FECO (≥60%).24 However, producing a [HCO3–] of 3.00 M in the captured solution requires almost doubling the air mass flow rate and significantly increasing the contactor length (∝ volume) by a factor of 7.75–14.32, as compared to the base 1 M KOH case (Figure 2b (right)). Although the contactor captures double the amount of CO2 in this specific case compared to the base cases and increases the capture fraction—i.e., the amount of captured CO2 over the amount of CO2 that enters the contactor—from 78% to 92%, its capital cost would be prohibitively high. Indeed, to produce bicarbonate at a concentration of 3.00 M, the air contactor capital cost would be 5–10 times that of the baseline case (1.00 M KOH, 646 t-CO2/yr, capture fraction ∼75%).
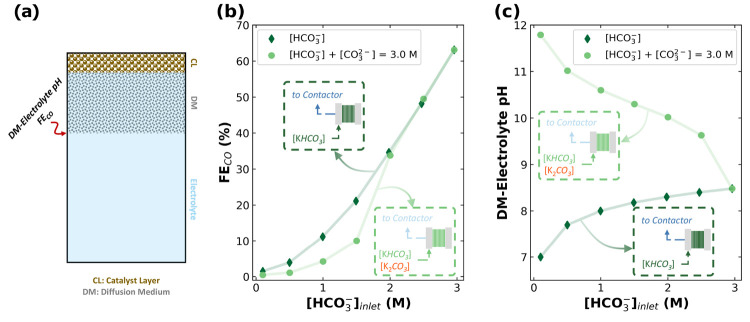
In addition, producing 3.00 M HCO3– requires a contactor inlet [K2CO3] of ≥2.00 M and the copresence of 0.68–1.51 M CO32– due to the bicarbonate–carbonate equilibrium, which could significantly impact the electrolysis performance. To investigate this effect, we leveraged a detailed 1-D Multiphysics model26 to estimate the FECO at changing local concentrations of HCO3– and CO32– ions (Figure 3b). It is worth noting that this model only considers a diffusion medium (DM) and a catalyst layer (CL), which might not allow it to capture some recent design developments, such as the addition of a catalyst diffusion adlayer.27 However, it can still be used to understand the general trade-offs between the HCO3–/CO32– concentrations and the electrolyzer performance metrics (e.g., FECO).
Figure 3.
(a) Scheme of the 1D Multiphysics model. (b) Faradaic efficiency of CO and (c) DM–Electrolyte pH as a function of the inlet (bi)carbonate concentration to the electrolyzer. Note that the dark green diamonds represent the input of HCO3– at different concentrations, whereas the light green circles represent the input of a mixture of HCO3– and CO32– such that the total concentration is 3.00 M. For example, the circle at 2.00 M HCO3– contains 1.00 M CO32– and 2.00 M HCO3–. In (b), we consider the pH at a 200 μm distance from the catalyst layer.
Using our 1-D Multiphysics model, we observe that replacing HCO3– with CO32– lowers the FECO significantly (Figure 3b), which is attributed to the reaction between CO32– and protons, and/or the increase in pH at the interface between the DM and bulk liquid electrolyte (DM–Electrolyte interface), as shown in Figure 3c. For instance, the replacement of 0.50 M HCO3– with 0.50 M CO32– in a 3 M (bi)carbonate solution can lower the FECO from 63% to 49%—a 22% decrease in FECO—and can increase the DM–Electrolyte pH from 8.48 to 9.63 (Figure 3b,c). Furthermore, as CO32– becomes the dominant ion in the solution (first four light green circles in Figure 3b,c), the local pH increases beyond 10.30, limiting the selective production of CO inside the electrolyzer. These findings are consistent with experimental results, as FECO is typically lower in carbonate solutions compared to that in bicarbonate (Table 1). Thus, compositional analyses of various air contactor capture effluents are needed to elucidate the suitability of integrating DAC with a (bi)carbonate electrolyzer. We note that although this type of analysis is uncommon in the DAC-electrolysis literature, it has been performed previously.10
To complete the mass balance of the integrated capture-conversion system, we now consider the overall electrolyzer mass balances. Figure 2c,e shows the outlet species concentration from the catholyte as a function of the inlet [KHCO3] and [K2CO3] to the electrolyzer, respectively. Note that Figure 2c assumes that the catholyte inlet is an almost pure KHCO3 solution, whereas Figure 2e assumes it is a mixture of 0.50 M KHCO3 and 0.50–3.00 M K2CO3. Another version of the figure where the input is pure K2CO3 is given in section S.11 of the Supporting Information. To perform these calculations, we utilized the same 1-D Multiphysics flow model, which was used to generate the results of Figure 3,26 and developed a microkinetic model to correlate the electrolyzer inlet KHCO3/K2CO3 concentrations with the outlet species concentrations. We integrate our mass balance calculations with our microkinetic model to roughly estimate the species concentrations in the flow channel. Our key assumptions are summarized in Table 2.
Table 2. Summary of Key Assumptions Used in the Microkinetic, Mass Balance, and 1D Multiphysics Models.
| parameter | value/note |
|---|---|
| operational current density | 100 mA/cm2 |
| CO2 conversion/utilization | 100% |
| volumetric flow rate | 100 mL/min |
| electrolyzer cell area | 100 cm2 |
| gas products | CO and H2 |
| proton source (KHCO3 case) | HCO3– |
| proton source (KHCO3/K2CO3 case) | H2O |
| FECO (KHCO3 case) | 3.9–63.2% (from 1D Multiphysics model) |
| FECO (KHCO3/K2CO3 case) | 40% |
We acknowledge that an electrolyzer cross-section area of 100 cm2 is larger than that used in all previous (bi)carbonate electrolysis experimental works in the literature (i.e., 1–4 cm2),10,18,20−24,27 but we assume future developments will enable the achievement of the same key performance metrics at this larger scale, as it is a necessary precursor for commercial viability. We also note that the FECO of the KHCO3/K2CO3 case is kept constant in our models at 40% because it is the highest experimentally achieved FECO for this system (Table 1). Lastly, it is worthwhile to define the CO2 conversion/utilization, which is simply the carbon efficiency, as the number of moles of carbon in the output CO over the number of moles of carbon in the in situ generated CO2 (eq S.26).
We find that the [OH–] and [CO32–] in the electrolyzer outlet are too low to recapture CO2 from the atmosphere (Figure 2c). For all of the tested inlets [KHCO3] to the electrolyzer, we estimate the maximum [OH–] and [CO32–] to be 0.07 × 10⁻⁴ and 0.11 M, respectively. Indeed, the outlet pH values of all cases in Figure 2c are mildly alkaline, ranging from 8.56 to 8.90. To put this into context, the ocean, which captures CO2 slowly based on its equilibrium with the atmosphere, has a pH value between 8.1 and 8.3.30 In addition, we find the outlet [HCO3–], balanced by [K+], to be almost the same as the inlet [KHCO3] when the electrolyzer is fed with an almost pure KHCO3 solution, signifying the very low HCO3– conversion to CO2, which is consistent with the calculations by Lees et al.21 We reason that this observation is due to the HCO3– acting as both an ion-conducting electrolyte and a key reactant, limiting the electrolyzer’s ability to fully consume it (Figure 2c). Consequently, the regenerated OH– ions from the electrochemical CO2 reduction reaction (eq 6) per electrolyzer pass is negligible, favoring their consumption near the catalyst surface to maintain the chemical equilibrium between CO2, HCO3–, and CO32–.
Similarly, we find that [OH–] in the carbonate electrolyzer outlet is too low to be recycled for further direct air capture (Figure 2e). However, since we are linearly increasing the inlet [K2CO3] while keeping the inlet [KHCO3] constant, we observe a linear increase in the outlet [CO32–], resulting in a high pH range of the electrolyzer outlet, ranging from 10.40 to 11.15. While the high observed pH at the outlet may suggest the possibility of fresh CO2 being recaptured from air, it is important to highlight that the pH values at the inlet of the electrolyzer are in a similar range of 10.31–11.09, emphasizing the marginal increase in pH inside the electrolyzer.
Additionally, the presence of HCO3– ions, as shown in Figure 2e, in the electrolyzer outlet stream could slow the sequential capture process, requiring even larger air contactors than what were predicted in Figure 2b (left). In fact, the use of a K2CO3-rich capture agent requires extremely large air contactors, which will be shown later, due to the sluggish kinetics of CO2 capture by K2CO3 as compared to KOH. These trade-offs must be carefully considered during the design phase to avoid potential operational challenges of the integrated process.
Effect of HCO3– Accumulation on the Recapture of Fresh CO2
To understand the behavior of an integrated capture-and-conversion unit as a whole, we used our mass-balance and microkinetic models to estimate the electrolyzer outlet pH as a function of simulation iteration, where a single iteration refers to the single passage of the liquid solvent through both the air contactor and the electrolyzer. For simplicity, we assume a fixed FECO of 40% in the electrolyzer and a steady-state operation in both the contactor and electrolyzer. Initially, we flow 1.00 M K2CO3 solution in the air contactor and allow it to change based on the ability of the electrolyzer to regenerate the capture solvent.
Our calculations show a decreasing catholyte outlet pH from 11.62 to 9.35 with simulation iteration (Figure 4), consistent with previous experimental observations of the same system.18 More importantly, we find that the CO2 capture fraction decreases from a maximum of 78.34% to a minimum of 0.52% with the simulation iteration (Figure 4). Indeed, after the fifth iteration, the CO2 capture fraction is already less than 1%. It is worth noting that previous experiments obtained a similar result, showing a significant decrease in CO2 capture rate at a pH of 9.1.18 The poor CO2 capture behavior can be explained by the buildup of HCO3– ions in the catholyte outlet stream and the presence of the bicarbonate–carbonate equilibrium inside the electrolyzer, which are all accounted for in our integrated models. More precisely, as the pH is reduced to a mildly alkaline value of 9.35, the catholyte outlet becomes unsuitable for further CO2 capture due to outgassing of CO2 in the air contactor.31,32 Further details are given in section S.9 of the Supporting Information.
Figure 4.
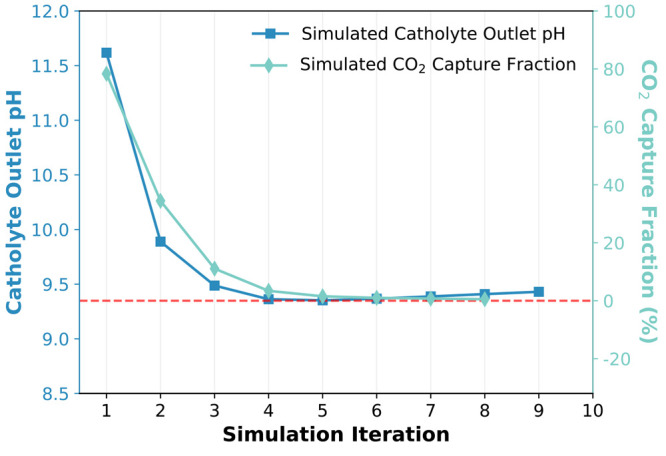
Simulated electrolyzer catholyte outlet pH (left y-axis; blue) and CO2 capture fraction (right y-axis; turquoise) as functions of iteration. Note that the red dashed horizontal line highlights the 0% CO2 capture fraction and a minimum catholyte outlet pH of about 9.35.
Economic Implications of the Literature-Proposed Integrated Route
So far, we have demonstrated the incompatibility of the direct integration of air contactors with (bi)carbonate electrolyzers while producing CO selectively and recapturing CO2 continuously from the atmosphere. In this section, we aim to understand the effects of the presented mass balances on the capital cost of the system, regardless of the capture and conversion performance. We use the same methodology as in Mass Balances of the Air Contactor and (Bi)carbonate Electrolyzer, and we choose the basis for the cost comparison to be Carbon Engineering’s air contactor, as presented by Keith et al., which was optimized to capture 646 t-CO2/yr using a 1 M KOH solvent.5
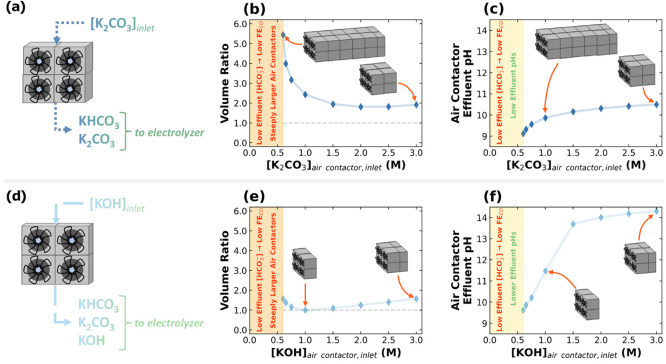
Figure 5b,e shows the volume ratio as a function of the contactor’s
inlet [K2CO3] and [KOH], respectively. Note
that we fix the capture rate and define the volume ratio according
to eq 7, where  is the molarity of the solvent. Figure 5c,f presents the
contactor effluent pH as a function of the inlet contactor solvent
concentrations.
| 7 |
Figure 5.
Schemes of (a) K2CO3-fed and (d) KOH-fed air contactors. Air contactor volume ratios of (b) K2CO3-fed and (e) KOH-fed air contactors as functions of the solvent concentration. Air contactor effluent pH as a function of inlet air contactor concentrations of inlet (c) K2CO3 and (f) KOH solvents. Note that the drawings of the air contactors indicate the size with respect to the 1 M KOH contactor. For instance, the first point in (b) from the left (0.60 M K2CO3 solvent) corresponds to 5.5 times the size of a contactor operating with 1 M KOH solvent, considering the same capture rate of 646 t-CO2 per year. In all of these cases, the capture fraction was approximately 78%.
We find that using 0.65–3.00 M K2CO3 solvents results in contactor volumes that are 1.8–5.4 times larger than those of a typical Carbon Engineering unit (Figure 5b). On the other hand, we find that using 0.65–3.00 M KOH capture solvents requires only up to 1.6 times the baseline contactor volume to capture the same amount of CO2 at the same liquid-to-gas volumetric/mass ratio (Figure 5e). The low contactor volume ratio of this system is directly influenced by the faster CO2 capture kinetics of the KOH-based (Figure 5d) system as compared to that of the K2CO3-based system (Figure 5a). This result suggests that significantly fewer total capital expenditures of the contactor are needed for an integrated route that uses KOH as a capture agent as opposed to one that uses K2CO3 instead.
Notably, we find that K2CO3 solvent concentrations of less than 0.65 M require significantly high contactor volumes. This result demonstrates that a 3.00 M bicarbonate electrolyzer that produces any amount less than 0.65 M of K2CO3 is completely infeasible to integrate with CO2 capture, as it will demand significantly large air contactors to capture the same amount of CO2. Indeed, considering HCO3– as the proton source for the electrochemical reduction of in situ CO2 to CO,26 32.5% of HCO3– will need to be converted to generate enough CO32– for possibly feasible integration. This conversion is far from state-of-the-art bicarbonate electrolysis devices used today, which convert less than 1% of the HCO3– feed,21 likely due to HCO3– acting as both a catholyte and a reactant.
In the case of using a 1 M K2CO3 solvent, which was recently tested experimentally,18 we find the required contactor volume to be 2.44 times that needed for a 1 M KOH solvent to capture 646 t-CO2/yr at a fixed air feed flow rate of 157 t/h. At these conditions and at a cell voltage of 3.3–3.5 V, we estimate the air contactor and (bi)carbonate electrolyzer capital costs to be approximately $2023582000 and $2023352000–373000, respectively. These numbers are equivalent to 2.14 times the baseline contactor capital cost and 3.40–3.60 times the capital cost of a typical low-temperature CO2 electrolyzer,13,33 respectively (see section S.7 in the Supporting Information). Note that the (bi)carbonate electrolyzer in this route produces CO at a low selectivity of 40%,18 which is likely due to the presence of both HCO3– and CO32– species (see Figure 3). Lowering the amount of CO32– in the capture effluent (and thus, the catholyte inlet) requires a lower concentration of the K2CO3 solvent, allowing HCO3– to be more dominant in the mixture (Figure 2b). However, a low-concentration K2CO3 solvent would require a larger air contactor to capture the same amount of CO2 per year (i.e., 646 t-CO2/yr). Indeed, we find that using a 0.75 M K2CO3 solvent increases the capital cost of the air contactor to $2023742000, approximately 2.73 times the capital cost of the baseline contactor. These results show that the feasible operation of the direct integrated system requires a significant capital cost increase in the air contactor, which could cause the overall economics of this pathway to be unfavorable.
Although special cases of the direct integrated route could enhance the economics of the capture-and-conversion system,17,28 one should still be aware of the technical challenges associated with the mass balances and stability of this direct integration. Our results demonstrate the important influence of the solvent choice on the contactor volume and, thus, the total capital cost of the integrated system. Therefore, future TEA studies should thoroughly evaluate the complete capture-and-conversion process instead of individual unit operations, as design choices in one unit may have significant up- or downstream economic consequences.
Potential Solutions to the Integrated Capture-and-Conversion System
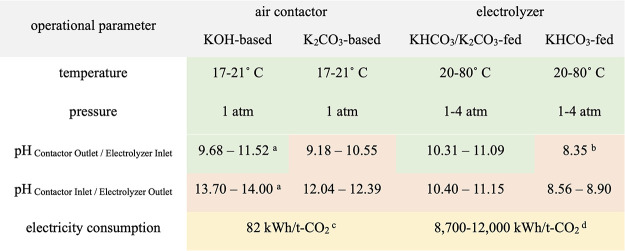
Overcoming the infeasibility of the direct integration of air contactors with (bi)carbonate electrolyzers requires careful consideration of mass-balance and operational limitations. Table 3 summarizes the operational parameters of air contactors and (bi)carbonate electrolyzers, which include the temperature, pressure, pH of the two connecting streams (i.e., catholyte inlet/outlet or contactor inlet/outlet), and electricity consumption. Based on literature values,5,13,21,22,27 the capture and conversion units are possibly compatible in terms of operational temperature and pressure. However, we find the pH values of the two connecting streams to be mostly incompatible. For instance, our results show that the pH range of the KOH-based air contactor inlet (i.e., 13.70–14.00) to not match well with the expected pH of the KHCO3/K2CO3-fed electrolyzer’s outlet (i.e., 10.40–11.15), necessitating the inclusion of pH treatment steps between the capture and conversion units. Additionally, it is worthwhile to note that the electricity consumption of the electrolyzer is more than 2 orders of magnitude higher than that of the air contactor. Although this difference does not present a compatibility issue, it signifies the electrolyzer’s dependence on electricity-related metrics (e.g., voltage, electricity price), which could impact the overall process economics and practical feasibility.
Table 3. Summary of the Operational Parameters of the Air Contactor and (Bi)carbonate Electrolyzere.
This range was calculated based on the KOH concentration range of 0.60–1.00 M to keep pHmaximum at 14.
This pH was calculated using our microkinetic model.
Taken from Keith et al.,5 assuming 70% fan efficiency and 82% pump efficiency.
Estimated from our electrolyzer process model, considering Vminimum = 2.5 V and Vmaximum = 3.5 V.
Green and red cells highlight compatibility and incompatibility, respectively. Yellow cells show an important difference between the units.
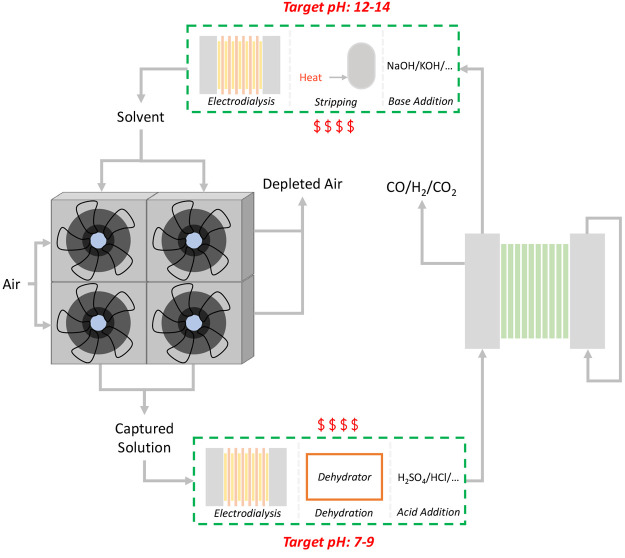
Therefore, we propose key modifications, as shown inside the green dashed boxes in Figure 6. First, increasing the [HCO3–] to 3.00 M in the contactor effluent while maintaining a mildly alkaline or neutral pH is needed to achieve high electrolyzer performances (Table 1). This step can be performed inside or outside the air contactor. We demonstrated that high capital costs will be required for producing a highly concentrated HCO3– stream inside the contactor (Figure 2a; right). We also demonstrated that the copresence of CO32– might not be the best option for optimal electrolysis performance (Figure 3b). Thus, it is worthwhile to consider solutions that produce pure 3 M KHCO3outside of the contactor such as
acidifying the contactor effluent stream using the acid stream from an electrodialysis unit
acidifying the contactor effluent stream by feeding a continuously supplied acidic stream
dehydrating the solution to increase the contactor outlet [HCO3–]
Figure 6.
Schematic of the literature-proposed integration route, with some potential solutions shown inside the green dashed boxes. On the left side, we show the air contactors and on the right side are the (bi)carbonate electrolyzer stacks. At the top and bottom, we show potential solutions that could satisfy the different pH requirements of the capture and conversion processes, which include electrodialysis, evaporator, and an acidic stream on the bottom and electrodialysis, a stripping/heating step, and a basic stream on the top.
Second, the catholyte outlet needs to be able to recapture CO2 from the inlet gas stream. Earlier, we showed that the KHCO3-fed electrolyzer produces a low-pH stream with a low OH– content (Figure 2c). Additionally, we showed that operating this integrated system with a 1 M K2CO3 capture solvent will likely accumulate bicarbonate, reducing the CO2 capture fraction (Figure 4). Therefore, potential solutions to these issues include
basifying the electrolysis outlet stream using the basic stream from an electrodialysis unit
basifying the electrolysis outlet stream by feeding a continuously supplied basic stream
heating the catholyte outlet to 80–100 °C, similar to the procedure done in the Benfield process,34 to degas CO2 from the (bi)carbonate mixture; thus increasing its pH
Moreover, improving the electrolyzer and contactor designs simultaneously could break the restrictions presented in this work. Particularly, designing contactors that maximize [HCO3–] in the effluent stream and designing electrolyzers that perform well independently of the inlet [HCO3–] could enable a practical integration of air contactors with (bi)carbonate electrolyzers. However, achieving both targets can be challenging, especially when considering the CO2–HCO3––CO32– equilibrium.
Overall, the solutions that would benefit this integrated route require the acidification of the contactor effluent and the basification of the regenerated solvent. We note that adding an electrodialysis unit that supplies an acidic stream to the former and a basic stream to the latter might be sufficient, but it will add to both the capital and the operational costs. Indeed, all presented approaches would require additional capital and operational costs that might limit the economic feasibility of the integrated system.35 However, adding an electrodialysis unit might present an additional economic challenge when the system is integrated with renewables simply due to the high sensitivity of electrochemical processes to the price volatility of solar- and wind-based electricity. Therefore, further thorough TEA studies that consider the additional equipment needed, operational challenges, and variability of renewable electricity prices are necessary to improve our understanding of the economic feasibility of the presented (and similar) integrated capture-and-conversion routes. However, future TEA studies must be based on rigorous mass-balance models to ensure practical feasibility of the proposed process designs. Additionally, experimental DAC-electrolysis studies need to confirm the electrolysis performance with realistic capture effluents. Specifically, the continuous ability of the electrolyzer outlet solution to recapture CO2 from the atmosphere for tens of thousands of capture-and-conversion cycles is still missing from the literature, but critical for the potential impact of these technologies.
The urgency of achieving net-zero carbon emission goals due to the serious impacts on people around the world from the devastating effects of climate change necessitates the careful pursuit of research in rapidly developing carbon-neutral and carbon-free technologies. The direct integration of air contactors with (bi)carbonate electrolyzers has been proposed to be a cost- and energy-efficient pathway for air-to-products routes. Here, we demonstrate that this direct integration is practically infeasible without additional treatment steps. We presented mass balance calculations that illustrated the incompatibility of air contactors to be directly integrated with (bi)carbonate electrolyzers due to the different pH values needed for capture and conversion. In addition, we utilized our models to predict the CO2 capture fraction in the air contactor with time, which showed a significant decrease from 78% to less than 1%. Further, our analysis showed that producing a desired bicarbonate concentration that optimizes the performance of the electrolyzer requires significantly large air contactors, which would impact the premise of pursuing this integration. Indeed, the required air contactor volume for producing highly concentrated (2.70–3.00 M) HCO3– was found to be 7–14 times larger than the state-of-the-art air contactor volume, which would cause the economics of this route to be unfavorable. Finally, we identified that acidifying the captured solution before feeding into the electrolyzer and basifying the catholyte outlet before feeding into the air contactor may solve the operational issues of this integrated route. One technology that could be promising but still needs further experimental, modeling, and technoeconomic investigations is bipolar membrane electrodialysis, which can supply acidic and basic streams from an inexpensive input of brine.
Acknowledgments
H.M.A. acknowledges support from the Saudi ministry of education, sponsored by the Saudi Arabian Cultural Mission (SACM) in the United States. This work was authored in part by the National Renewable Energy Laboratory, operated by Alliance for Sustainable Energy, LLC, for the US Department of Energy (DOE) under contract no. DE-AC36-08GO28308. This work was supported by the Laboratory Directed Research and Development (LDRD) Program at NREL. The views expressed in the article do not necessarily represent the views of the DOE or the US Government.
Supporting Information Available
The Supporting Information is available free of charge at https://pubs.acs.org/doi/10.1021/acsenergylett.4c00807.
Air contactor process model, general approach to electrolyzer mass balance, multiphysics models, mass balance model, and microkinetic model, capital cost estimations (with an example calculation), change in enthalpy calculations, extra description of Figure 4, proton source discussion, supplementary figures, and carbon efficiency definition (PDF)
Author Contributions
Conceptualization: H.M.A., R.K., P.B., A.M.C., T.E.B., and W.A.S. Methodology: H.M.A., R.K., and P.B.. Data curation: H.M.A., R.K., and P.B. Formal analysis: H.M.A., R.K., and P.B. Investigation: H.M.A., R.K., and P.B. Writing–original draft: H.M.A. Writing–review and editing: H.M.A., R.K., P.B., A.M.C., B.-M.H., A.S-.T., T.E.B., and W.A.S. Visualization: H.M.A. Supervision: W.A.S. and B.-M.H.
The authors declare no competing financial interest.
Supplementary Material
References
- IPCC . Climate Change 2022: Mitigation of Climate Change: Summary for Policymakers; Cambridge University Press: 2022. 10.1017/9781009157926.001. [DOI] [Google Scholar]
- International Energy Agency . Direct Air Capture: A Key Technology for Net Zero; OECD: 2022. 10.1787/bbd20707-en. [DOI] [Google Scholar]
- McQueen N.; Gomes K. V.; McCormick C.; Blumanthal K.; Pisciotta M.; Wilcox J. A Review of Direct Air Capture (DAC): Scaling up Commercial Technologies and Innovating for the Future. Prog. Energy 2021, 3 (3), 032001 10.1088/2516-1083/abf1ce. [DOI] [Google Scholar]
- Beuttler C.; Charles L.; Wurzbacher J. The Role of Direct Air Capture in Mitigation of Anthropogenic Greenhouse Gas Emissions. Frontiers in Climate 2019, 1, 1. 10.3389/fclim.2019.00010. [DOI] [Google Scholar]
- Keith D. W.; Holmes G.; St. Angelo D.; Heidel K. A Process for Capturing CO2 from the Atmosphere. Joule 2018, 2 (8), 1573–1594. 10.1016/j.joule.2018.05.006. [DOI] [Google Scholar]
- Climeworks . Climeworks. https://climeworks.com (accessed 2022-08-02).
- Carbon Engineering . Carbon Engineering. https://carbonengineering.com/ (accessed 2022-08-02).
- Global Thermostat . Global Thermostat. https://globalthermostat.com/ (accessed 2022-08-02).
- Fasihi M.; Efimova O.; Breyer C. Techno-Economic Assessment of CO2 Direct Air Capture Plants. Journal of Cleaner Production 2019, 224, 957–980. 10.1016/j.jclepro.2019.03.086. [DOI] [Google Scholar]
- Gutiérrez-Sánchez O.; de Mot B.; Daems N.; Bulut M.; Vaes J.; Pant D.; Breugelmans T. Electrochemical Conversion of CO2 from Direct Air Capture Solutions. Energy Fuels 2022, 36 (21), 13115–13123. 10.1021/acs.energyfuels.2c02623. [DOI] [Google Scholar]
- Zeman F. Energy and Material Balance of CO2 Capture from Ambient Air. Environ. Sci. Technol. 2007, 41 (21), 7558–7563. 10.1021/es070874m. [DOI] [PubMed] [Google Scholar]
- Azarabadi H.; Lackner K. S. A Sorbent-Focused Techno-Economic Analysis of Direct Air Capture. Applied Energy 2019, 250, 959–975. 10.1016/j.apenergy.2019.04.012. [DOI] [Google Scholar]
- Almajed H. M.; Guerra O. J.; Smith W. A.; Hodge B.-M.; Somoza-Tornos A. Evaluating the Techno-Economic Potential of Defossilized Air-to-Syngas Pathways. Energy Environ. Sci. 2023, 16 (12), 6127–6146. 10.1039/D3EE02589F. [DOI] [Google Scholar]
- Li M.; Irtem E.; Iglesias van Montfort H.-P.; Abdinejad M.; Burdyny T. Energy Comparison of Sequential and Integrated CO2 Capture and Electrochemical Conversion. Nat. Commun. 2022, 13 (1), 5398. 10.1038/s41467-022-33145-8. [DOI] [PMC free article] [PubMed] [Google Scholar]
- Luis P. Use of Monoethanolamine (MEA) for CO 2 Capture in a Global Scenario: Consequences and Alternatives. Desalination 2016, 380, 93–99. 10.1016/j.desal.2015.08.004. [DOI] [Google Scholar]
- Rochelle G.; Chen E.; Freeman S.; Van Wagener D.; Xu Q.; Voice A. Aqueous Piperazine as the New Standard for CO2 Capture Technology. Chemical Engineering Journal 2011, 171 (3), 725–733. 10.1016/j.cej.2011.02.011. [DOI] [Google Scholar]
- Debergh P.; Gutiérrez-Sánchez O.; Khan M. N.; Birdja Y. Y.; Pant D.; Bulut M. The Economics of Electrochemical Syngas Production via Direct Air Capture. ACS Energy Lett. 2023, 8, 3398–3403. 10.1021/acsenergylett.3c00885. [DOI] [Google Scholar]
- Kim Y.; Lees E. W.; Donde C.; Waizenegger C. E. B.; Simpson G. L.; Valji A.; Berlinguette C. P.. Electrochemical Capture and Conversion of CO2 into Syngas. ChemRxiv (Chemical Engineering and Industrial Chemistry) August 29, 2023. 10.26434/chemrxiv-2023-hvjxn. (accessed 2024-04-22). [DOI]
- Welch A. J.; Dunn E.; DuChene J. S.; Atwater H. A. Bicarbonate or Carbonate Processes for Coupling Carbon Dioxide Capture and Electrochemical Conversion. ACS Energy Lett. 2020, 5 (3), 940–945. 10.1021/acsenergylett.0c00234. [DOI] [Google Scholar]
- Li Y. C.; Lee G.; Yuan T.; Wang Y.; Nam D.-H.; Wang Z.; García de Arquer F. P.; Lum Y.; Dinh C.-T.; Voznyy O.; Sargent E. H. CO2 Electroreduction from Carbonate Electrolyte. ACS Energy Lett. 2019, 4 (6), 1427–1431. 10.1021/acsenergylett.9b00975. [DOI] [Google Scholar]
- Lees E. W.; Goldman M.; Fink A. G.; Dvorak D. J.; Salvatore D. A.; Zhang Z.; Loo N. W. X.; Berlinguette C. P. Electrodes Designed for Converting Bicarbonate into CO. ACS Energy Lett. 2020, 5 (7), 2165–2173. 10.1021/acsenergylett.0c00898. [DOI] [Google Scholar]
- Zhang Z.; Lees E. W.; Habibzadeh F.; Salvatore D. A.; Ren S.; Simpson G. L.; Wheeler D. G.; Liu A.; Berlinguette C. P. Porous Metal Electrodes Enable Efficient Electrolysis of Carbon Capture Solutions. Energy Environ. Sci. 2022, 15 (2), 705–713. 10.1039/D1EE02608A. [DOI] [Google Scholar]
- Zhang Z.; Lees E. W.; Ren S.; Mowbray B. A. W.; Huang A.; Berlinguette C. P. Conversion of Reactive Carbon Solutions into CO at Low Voltage and High Carbon Efficiency. ACS Cent. Sci. 2022, 8 (6), 749–755. 10.1021/acscentsci.2c00329. [DOI] [PMC free article] [PubMed] [Google Scholar]
- Li T.; Lees E. W.; Goldman M.; Salvatore D. A.; Weekes D. M.; Berlinguette C. P. Electrolytic Conversion of Bicarbonate into CO in a Flow Cell. Joule 2019, 3 (6), 1487–1497. 10.1016/j.joule.2019.05.021. [DOI] [Google Scholar]
- Lees E. W.; Bui J. C.; Song D.; Weber A. Z.; Berlinguette C. P. Continuum Model to Define the Chemistry and Mass Transfer in a Bicarbonate Electrolyzer. ACS Energy Lett. 2022, 7 (2), 834–842. 10.1021/acsenergylett.1c02522. [DOI] [Google Scholar]
- Kas R.; Yang K.; Yewale G. P.; Crow A.; Burdyny T.; Smith W. A. Modeling the Local Environment within Porous Electrode during Electrochemical Reduction of Bicarbonate. Ind. Eng. Chem. Res. 2022, 61 (29), 10461–10473. 10.1021/acs.iecr.2c00352. [DOI] [Google Scholar]
- Xiao Y. C.; Gabardo C. M.; Liu S.; Lee G.; Zhao Y.; O’Brien C. P.; Miao R. K.; Xu Y.; Edwards J. P.; Fan M.; Huang J. E.; Li J.; Papangelakis P.; Alkayyali T.; Sedighian Rasouli A.; Zhang J.; Sargent E. H.; Sinton D. Direct Carbonate Electrolysis into Pure Syngas. EES Catalysis 2023, 1 (1), 54–61. 10.1039/D2EY00046F. [DOI] [Google Scholar]
- Moreno-Gonzalez M.; Berger A.; Borsboom-Hanson T.; Mérida W. Carbon-Neutral Fuels and Chemicals: Economic Analysis of Renewable Syngas Pathways via CO2 Electrolysis. Energy Conversion and Management 2021, 244, 114452 10.1016/j.enconman.2021.114452. [DOI] [Google Scholar]
- Borhani T. N. G.; Azarpour A.; Akbari V.; Wan Alwi S. R.; Manan Z. A. CO2 Capture with Potassium Carbonate Solutions: A State-of-the-Art Review. International Journal of Greenhouse Gas Control 2015, 41, 142–162. 10.1016/j.ijggc.2015.06.026. [DOI] [Google Scholar]
- Eisaman M. D.; Parajuly K.; Tuganov A.; Eldershaw C.; Chang N.; Littau K. A. CO2 Extraction from Seawater Using Bipolar Membrane Electrodialysis. Energy Environ. Sci. 2012, 5 (6), 7346–7352. 10.1039/C2EE03393C. [DOI] [Google Scholar]
- Vadlamani A.; Pendyala B.; Viamajala S.; Varanasi S. High Productivity Cultivation of Microalgae without Concentrated CO2 Input. ACS Sustainable Chem. Eng. 2019, 7 (2), 1933–1943. 10.1021/acssuschemeng.8b04094. [DOI] [Google Scholar]
- Ataeian M.; Liu Y.; Canon-Rubio K. A.; Nightingale M.; Strous M.; Vadlamani A. Direct Capture and Conversion of CO2 from Air by Growing a Cyanobacterial Consortium at pH up to 11.2. Biotechnol. Bioeng. 2019, 116 (7), 1604–1611. 10.1002/bit.26974. [DOI] [PMC free article] [PubMed] [Google Scholar]
- Wen G.; Ren B.; Wang X.; Luo D.; Dou H.; Zheng Y.; Gao R.; Gostick J.; Yu A.; Chen Z. Continuous CO2 Electrolysis Using a CO2 Exsolution-Induced Flow Cell. Nat. Energy 2022, 7 (10), 978–988. 10.1038/s41560-022-01130-6. [DOI] [Google Scholar]
- Benson H. E.; McCrea D. H.. Removal of Acid Gases from Hot Gas Mixtures. US4160810A, 1979.
- Sabatino F.; Mehta M.; Grimm A.; Gazzani M.; Gallucci F.; Kramer G. J.; van Sint Annaland M. Evaluation of a Direct Air Capture Process Combining Wet Scrubbing and Bipolar Membrane Electrodialysis. Ind. Eng. Chem. Res. 2020, 59 (15), 7007–7020. 10.1021/acs.iecr.9b05641. [DOI] [Google Scholar]
Associated Data
This section collects any data citations, data availability statements, or supplementary materials included in this article.


