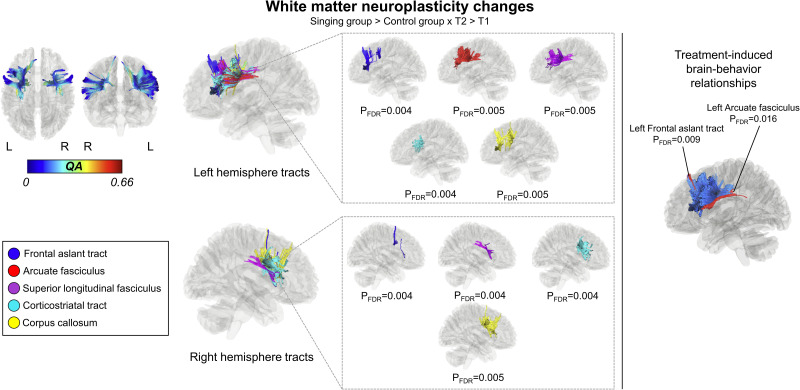
Figure 3.
Treatment-induced WM neuroplasticity changes. Connectometry results displaying the significant segments of the tracts with longitudinal QA increases significantly associated with singing group versus control group between T1 and T2 (ΔT2–T1; left) and longitudinal QA change correlation with improved naming (right). FDR, false discovery rate; L, left; QA, quantitative anisotropy; R, right.

