

Abstract
Background:
Idiopathic intracranial hypertension (IIH) typically manifests with headache, accompanied by papilledema and visual loss, and has a higher prevalence in females. In recent years, ocular sonography, particularly, measurement of optic nerve sheath diameter (ONSD), is being investigated for diagnosis of IIH.
Methods:
A total of 35 patients over the age of 18 years, fulfilling the modified Dandy's criteria for diagnosis of IIH were included. Patients underwent assessment with magnetic resonance imaging, lumbar puncture, and ocular sonography to measure ONSD and ocular arterial indices.
Results:
The mean ONSD values (in centimeters) in the right eye of patients with IIH was 0.57 ± 0.13, while it was 0.48 ± 0.03 in controls. In the left eye, the mean ONSD value (cm) was 0.59 ± 0.13 in patients with IIH and 0.48 ± 0.03 in controls. ONSD was significantly higher in cases compared to controls (P < 0.001, Welch test). Pulsatility index of the central retinal artery was significantly higher in cases compared to controls (P < 0.001, Welch test). Resistance index of the ophthalmic artery was statistically significant (P < 0.005, Welch test). Receiver operating characteristic curve analysis revealed a cutoff value of 5.1 mm on the right side and 5 mm on the left side had a sensitivity and specificity of more than 80% for IIH diagnosis.
Conclusion:
Our study provides insights into the utility of optic nerve sheath measurements and arterial indices in the diagnosis of IIH in a South Indian cohort. Further research is needed to fully understand the longitudinal relationship of these parameters and treatment outcomes in IIH.
Keywords: Idiopathic intracranial hypertension, ocular ultrasound, ONSD
INTRODUCTION
Idiopathic intracranial hypertension (IIH) typically manifests with headache, accompanied by papilledema and visual loss, and has a higher prevalence in females.[1] It is characterized by increased intracranial pressure without evidence of structural lesions and normal cerebrospinal fluid (CSF) findings. As a result, IIH is a diagnosis of exclusion, necessitating neuroimaging and lumbar puncture for accurate diagnosis. In recent times, noninvasive techniques like transorbital sonography and Doppler have been explored to aid in diagnosing and monitoring patients with IIH.[2]
The optic nerve is surrounded by a flexible subarachnoid space known as the optic nerve sheath. The rise in intracranial CSF pressure in IIH directly leads to distension of the optic nerve sheath. Ocular sonography, in the context of IIH, is primarily used to measure the diameter of the optic nerve sheath (ONSD).[2] It can also provide valuable insights into the real-time hemodynamic characteristics of the central retinal artery (CRA) and the ophthalmic artery (OA), such as peak systolic velocity, pulsatility index (PI) and resistance index (RI).[2]
Measurement of ONSD has proven to be most useful in diagnosing IIH. The procedure involves measurements of the optic nerve sheath at a distance of 3 mm posterior to the globe, in the anterior part of the optic nerve, where trabeculations are less dense and the nerve sheath is more distensible.[3] Such measurements have demonstrated reproducibility and minimized intraobserver and interobserver variability. Nevertheless, normal ONSD values at this location may vary between studies, ranging from 0.44 to 0.57 cm.[4,5,6,7,8,9,10,11] ONSD values and cutoffs for diagnosing IIH might also differ with factors such as age, gender, body mass index (BMI), ethnicity, and differences in method of measurement.[12] ONSD measurements obtained by magnetic resonance imaging (MRI) may yield higher values than those acquired through ultrasound.[4]
While the role of ONSD in IIH has been investigated in a few studies, the significance of arterial hemodynamic indices remains uncertain. This simple procedure involves applying low-frequency (2 MHz) ultrasound waves through a transorbital approach.[13] Although these indices are likely associated with raised intracranial pressure syndromes caused by various factors, Although ocular arterial indices may be affected by raised intracranial pressure syndromes caused by various factors, relationship between these indices and IIH is not clear.[14] Therefore, further investigation is required to understand the relationship between these arterial indices and ONSD values.
Notably, ONSD values and ocular arterial indices have not been systematically studied in the Indian population with IIH. This study aims to address this knowledge gap by examining the utility of ONSD measurement and arterial indices in diagnosing IIH and exploring their association with clinical and neuroimaging findings within a well-characterized cohort of IIH patients.
PATIENTS AND METHODS
The study was conducted at a tertiary care center in South India from February 2019 to October 2020 after approval of the Institute Ethics Committee. The informed consent was taken from all participants. A total of 35 patients over the age of 18 years, fulfilling the modified Dandy's criteria[15] for diagnosis of IIH were included. Collection of demographic details, BMI measurements, neurologic examination, visual acuity testing using Snellen's chart, fundus examination, and visual field charting were performed for all patients. Patients on drugs that may cause raised Intracranial pressure (ICP), for example, oral contraceptive pills, patients with high serum retinol levels, and those in whom other causes of raised ICP, such as cerebral venous thrombosis or a space-occupying lesion, had been identified were excluded. Magnetic resonance venography (MRV) was performed in all patients to rule out Cerebral Venous Thrombosis (CVT).
Lumbar puncture was done after obtaining written informed consent from the patients after they were explained the risks and benefits of the procedure. CSF pressure was measured in the lateral recumbent position with the help of a manometer after straightening the patients’ legs, and a narrow-bore spinal needle (21/22G needle) was used to minimize CSF leakage. CSF pressure was measured after stabilization of the CSF column. An experienced neurologist who was trained by a neuroradiologist conducted the ocular ultrasound procedure. The neurologist was not blinded to the diagnosis of IIH. Ultrasound was done using the Esaote MyLab gamma scanner with a frequency range of 3–13 MHz and a field of view 14–47 mm. The subjects were in the supine position with the eyes closed and were instructed to look straight. The optic nerve was identified and measured in a horizontal direction from 3 mm behind the optic nerve head, and ONSD was measured in both eyes. Later, CRA and OA arterial indices were measured. CRA was located along the optic nerve, and OA was identified by a large-caliber artery beside the optic nerve at 40–50 mm depth. ONSD was also measured in 26 healthy controls, and arterial indices were measured in 21 healthy controls.
Statistical analysis
Symptom analysis was done by frequency analysis, and descriptive analysis was performed to obtain the mean and standard deviation for quantitative variables and frequencies and proportions for categorical variables. Chi-square test was used to compare categorical outcomes between the study groups. Correlation was examined between CSF pressure, ONSD values, and arterial indices, and association between categorical variables such as visual acuity and fundus findings was examined using the Chi-square test.
Normal distribution was assessed by the Shapiro–Wilk test, and a P value of < 0.05 was considered as normal. Independent samples t-test was used to compare the mean values of normally distributed parameters. Mann–Whitney U test (two groups) was used to compare the median and interquartile range for non-normally distributed parameters.
Pearson correlation coefficient was calculated to assess the correlation between quantitative explanatory and outcome variables. P value < 0.05 was considered statistically significant. International Business Machine Statistical Package for the Social Sciences version 20 was used for statistical analysis.
RESULTS
Demographic and clinical features
The baseline characteristics of patients and controls are summarized in Table 1.
Table 1.
Baseline characteristics of cases and controls
| Cases (n=35) | Controls (n=26) | |
|---|---|---|
| Age in years, mean±SD | 30±8.4 | 28±7 |
| Gender, females (%) | 90 | 80.7 |
| Symptoms (%) Headache TVO Diplopia Vision loss Nausea Vomiting Tinnitus Neck pain |
95.23 40.47 30.95 33.33 38.09 26.19 23.80 21.42 |
Asymptomatic (100%) |
| Fundus examination Papilledema (%) Grade 1 Grade 2 Grade 3 Grade 4 Normal (%) Optic atrophy (%) |
19.04 28.57 33.33 4.76 11.90 2.38 |
Normal fundus (100%) |
| Corrected visual acuity | 47/84 (55.95%) eyes had 6/6 vision at baseline | 6/6 in both eyes (100%) |
TVO = Transient visual obscurations
Thirty-five patients underwent measurement of ONSD, along with 26 controls. The mean age of patients was 30 ± 8.4 years, ranging from 18 to 56 years. Majority of the patients (90%) were females. It was found that 25.7% of patients had a normal BMI (18.5–22.9 kg/m2), whereas 37.14% were overweight and 37.14%% were obese.
The most common visual field defect was enlargement of the blind spot (45.32%). Constriction of the visual field was seen in 23.80% of patients. Scotoma was seen in one patient, and two patients had extremely poor vision that precluded visual field testing. Moreover, 44.05% eyes had impaired vision at baseline, while only 13.1% eyes had impaired acuity at discharge. Our results also showed that 81.25% eyes had 6/6 vision and 12/64(18.75%) had impaired vision at a mean follow-up duration of 120 days.
Most patients (69.02%) received intravenous 20% mannitol in a dose of 100 ml at 6–8 h intervals until symptoms subsided, followed by a slow taper over 1–2 weeks. For maintenance therapy, acetazolamide was given in the majority (92.85%), while topiramate, oral glycerol, and oral methylprednisolone were used in one patient each.
The most predominant MRI findings were partial empty sella (95.23%), perioptic sheath dilatation and flattening of the sclera (90.47%), optic nerve kinking (43%), and transverse sinus stenosis (40.47%). The mean CSF pressure was 279.404 ± 64.95 mm of H2O. Biochemistry and microbiologic analysis of CSF were normal.
Ocular sonography
The ONSD values and arterial indices are summarized in Table 2.
Table 2.
Ocular ultrasound parameters in patients with IIH
| Mean | Standard deviation | Number of eyes studied | |
|---|---|---|---|
| Right ONSD | 0.533 | 0.108 | 61 |
| Left ONSD | 0.544 | 0.115 | 61 |
| RI of right CRA | 0.686 | 0.094 | 55 |
| PI of right CRA | 1.240 | 0.346 | 55 |
| RI of left CRA | 0.710 | 0.126 | 55 |
| PI of left CRA | 1.362 | 0.520 | 55 |
| RI of right OA | 0.749 | 0.123 | 55 |
| PI of right OA | 1.426 | 0.332 | 55 |
| RI of left OA | 0.756 | 0.082 | 55 |
| PI of left OA | 1.495 | 0.346 | 55 |
CRA=central retinal artery, CSF=cerebrospinal fluid, IIH=idiopathic intracranial hypertension, OA=ophthalmic artery, ONSD=optic nerve sheath diameter, PI=pulsatility Index, RI=resistance index. ONSD values in centimeters, CSF pressure in mm of H2O
The mean ONSD value (in centimeters) in the right eye of patients with IIH was 0.57 ± 0.13, while it was 0.48 ± 0.03 in controls. In the left eye, the mean ONSD value (cm) was 0.59 ± 0.13 in patients with IIH and 0.48 ± 0.03 in controls. This is depicted in Figure 1.
Figure 1.
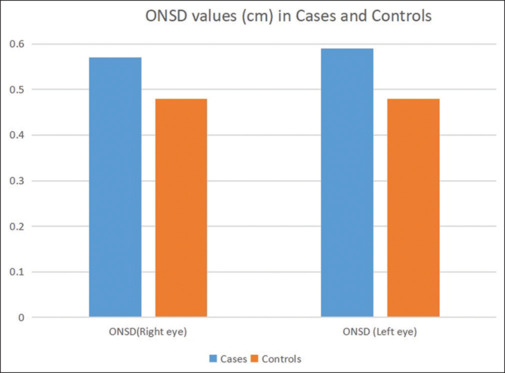
ONSD cut-off for IIH diagnosis. ONSD = optic nerve sheath diameter
ONSD was significantly higher in cases compared to controls (P < 0.001, Welch test). PI of CRA was significantly higher in cases compared to controls (P < 0.001, Welch test). RIs of right OA (P = 0.05) and left OA (P < 0.005, Welch test) were statistically significant. Table 3 shows a comparison of ocular ultrasound parameters between cases and controls.
Table 3.
Comparison of ocular ultrasound parameters between cases and controls
| Variable | Cases Mean (SD) | Controls Mean (SD) | t | P |
|---|---|---|---|---|
| ONSD (right eye) | 0.57 (0.13) | 0.48 (0.03) | 4.210 | <0.001 |
| ONSD (left eye) | 0.59 (0.13) | 0.48 (0.03) | 5.067 | <0.001 |
| RI of right CRA | 0.72 (0.09) | 0.63 (0.06) | 4.327 | <0.001 |
| PI of right CRA | 1.35 (0.39) | 1.06 (0.15) | 3.984 | <0.001a |
| RI of left CRA | 0.76 (0.14) | 0.64 (0.05) | 4.597 | <0.001a |
| PI of left CRA | 1.54 (0.59) | 1.08 (0.14) | 4.394 | <0.001a |
| RI of right OA | 0.77 (0.15) | 0.72 (0.05) | 2.019 | 0.050a |
| PI of right OA | 1.45 (0.4) | 1.39 (0.18) | 0.666 | 0.509a |
| RI of left OA | 0.78 (0.1) | 0.72 (0.04) | 2.922 | 0.005a |
| PI of left OA | 1.56 (0.4) | 1.39 (0.21) | 2.114 | 0.039a |
CRA=central retinal artery, IIH=idiopathic intracranial hypertension, ONSD=optic nerve sheath diameter, PI=pulsatility index, OA=ophthalmic artery, RI=resistance index, SD=standard deviation. ONSD values in centimeters. aIndicates use of Welsh test
Receiver operating characteristic curve analysis [Figure 2] revealed a cutoff value of 0.51 cm on the right side and 0.5 cm on the left side had a sensitivity and specificity of more than 80% for IIH diagnosis. One patient had normal pressure and elevated ONSD.
Figure 2.
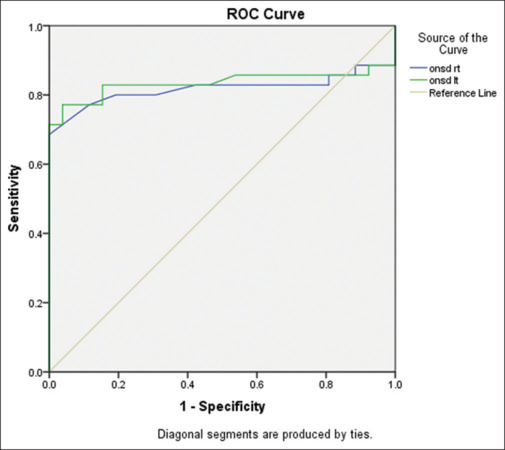
ONSD values in cases and controls. ONSD = optic nerve sheath diameter, ROC = receiver operating characteristic
RI of both CRAs at cutoff values of 0.7 and 0.69 had a sensitivity of 71% and 79%, respectively, for the diagnosis of IIH.
Correlation studies
At the group level, presence of papilledema did not correlate with visual acuity. However, subgroup analysis showed that papilledema of grade 3 or more had significant correlation with visual acuity (P = 0.03). CSF pressure had a weak positive correlation with baseline visual acuity (P = 0.02). However, CSF pressure did not show significant correlation with ONSD. Moreover, no correlation was observed between ONSD and baseline visual acuity or papilledema. There was no correlation between CSF pressure and ocular arterial indices. There was a significant positive correlation between visual acuity and PI of right CRA (P < 0.001, Levine test).
DISCUSSION
We present here the ocular sonography findings and their association with clinical features in a well-characterized cohort of IIH patients in an Indian setting. Our patients’ age and gender and BMI distribution are similar to those of previously studied IIH cohorts. The clinical features, including symptomatology, visual acuity findings, presence of papilledema, and CSF pressures, align with the findings reported in the literature.[1]
Various ONSD cutoff values have been reported in literature, which could be attributed to the ethnic variations and methodologic differences between study populations.[12] In our study, we derived ONSD cutoffs for the diagnosis of IIH in the South Indian population. This holds significant implications as the standard values and cutoffs specific to IIH in the Indian population have not been previously documented. The measurement of ONSD using Ultrasonography (USG) is a simple, fast, noninvasive, and reliable method. We followed the standard practice of measuring ONSD values 3 mm behind the optic nerve head, similar to previous studies.[4,5,6,7,8,9,10,11,12]
Our study confirms that ONSD values in IIH patients were significantly higher than in controls, a well-established observation reaffirmed in our research.[4,5,6,7,8,9,10,11,12] However, the mean ONSD values in our IIH patients were slightly lower than those reported previously.[4,5,6,7,8,9,10,11,12] It is possible that racial and ethnic differences and larger height and body habitus among Caucasians may account for the differences in ONSD observed between studies. The cutoffs we determined for IIH diagnosis (0.51 cm in the right eye and 0.5 cm in the left eye) fall within the range of previously reported values (ranging from 0.48 to 0.63 cm).[4,5,6,7,8,9,10,11,12] A summary of our findings of the mean ONSD values and cutoff points for IIH diagnosis compared to previous studies is provided in Table 4.
Table 4.
Comparison of ocular sonography findings reported in literature
| Author, country, year | Sample size | Age (years) | Sex (patient group) | Mean BMI (kg/m2) | Mean CSF pressure (patients) | Mean ONSD (controls) | Mean ONSD at baseline (patients) | ONSD cutoffs for IIH diagnosis | Additional observations |
|---|---|---|---|---|---|---|---|---|---|
| Sinclair,[5] United Kingdom, 2010 | Patients=25 No controls |
34.3±9.2 | F=25 | 38.2±5.0 | 39.8±5.1 cm H2O | Not applicable | 4.5±1 mm | Not applicable | ONSD decreased at 3-month follow-up with a low-energy diet intervention |
| Saz-Saucedo,[7] Spain, 2015 | Patients=19 Controls=11 |
36.5±14.3 | F=15 M=4 |
Not reported | 30.5±6.6 cm H2O | 5.7±0.45 mm | 6.76±0.61 | 6.3 mm Sensitivity: 94.7%, specificity: 90.9% |
ONSD had a moderate correlation with CSF opening pressure |
| Lochner,[8] Germany, 2017 | Patients=22 No control group |
33±11 | F=16 M=6 |
32.0 | 35.3±17.6 cm H2O | Not applicable | 6.51 mm | Not applicable | ONSD decreased significantly at 6-month follow-up |
| Patterson,[4] USA, 2018 | Patients=22 Controls=22 |
32±10 | F=19 M=3 |
Not reported | 34.6±7.7 cm H2O | 4.4±0.7 mm | 5.2±0.6 mm | 4.8 mm Sensitivity: 77%, specificity: 82% |
MRI-measured ONSD was significantly higher than US ONSD |
| Kishk et al.,[10] Egypt, 2018 | Patients=99 Controls=35 |
31.00±8.74 | F=99 | 32.93±7.22 | 279.64±65.97 mm H2O | 5.50±0.40 mm | 6.57±1.02 mm | 6.05 mm Sensitivity: 73.2%, specificity: 91.4% |
OND/ONSD ratio did not differ between patients and controls |
| Ebraheim,[9] Egypt, 2018 | Patients=24 Controls=30 |
31.40±7.65 | F=24 | 31.9±8.6 | Not reported | 5.5±0.3 mm | 6.7±0.5 mm | 6.2 mm Sensitivity: 87.5%, specificity: 100% |
ONSD correlated with CSF opening pressure and BMI |
| Jeub et al.,[14] Germany, 2019 | Patients=19 Controls=20 |
31.6 | F=17 M=2 |
36.4±1.75 | 30.18±1.0 cm H2O | RE: 5.6±0.1 mm LE: 5.6±0.1 mm |
RE: 6.5±0.2 mm LE: 6.6±0.1 mm |
5.8 mm Sensitivity: 81%, specificity: 80% |
ONSD decreased significantly 24 h after therapeutic LP |
| Knodel,[6] Germany, 2021 | Patients=25 Controls=19 |
37±16 | F=22 M=3 |
35.62±7.53 | 35±8 | 4.99±0.55 mm | 6.2±0.8 mm | 5.8 mm Sensitivity: 74%, specificity: 92% |
ONSD significantly reduced at 6-month follow-up |
| Dağdelen et al.,[11] Turkey, 2022 | Patients=47 Controls=50 |
28 | F=37 M=10 |
34.81±5.33 | Not reported | 4.9 mm | 6.4 mm | 5.7 mm Sensitivity: 100%, specificity: 98% |
There was a positive correlation between ONSD and BMI |
| Current Study | Patients=35 Controls=26 |
30.34±7.36 | F=32 M=3 |
25.17±3.49 | 280.6±62.96 mm H2O | 0.48±0.13 cm | RE=0.57±0.13 cm LE 0.59±0.13 cm |
5.1 mm Sensitivity: 80%, specificity: 80% |
ONSD did not correlate with BMI or CSF opening pressure |
BMI=body mass index, CSF=cerebrospinal fluid, IIH=idiopathic intracranial hypertension, LE=left eye, MRI=magnetic resonance imaging, ONSD=optic nerve sheath diameter, RE=right eye, US=ultrasound. Continuous variables are represented as mean ± SD
The optic nerve sheaths, being direct continuations of intracranial meningeal layers, are susceptible to dilation due to changes in intracranial pressure when CSF is pushed toward the small rim of the subarachnoid space between the sheath and the nerve.[16] This is particularly prominent over the anterior part of the optic nerve, where it is most distensible due to sparse trabeculations. Elevated ONSD likely reflects chronic ICP changes in IIH. While optic nerve sheath enlargement in IIH can be unilateral or asymmetric,[17] our study did not find any significant asymmetry between both eyes.
Although a positive correlation between CSF opening pressure and ONSD values has been demonstrated in some earlier studies,[7,9] our study failed to demonstrate a significant correlation between these variables. The dynamic nature of ONSD values in relation to lumbar puncture as demonstrated previously[14] may underlie the lack of this correlation, as majority of our patients underwent ONSD measurement at a variable duration after the diagnostic lumbar puncture. For instance, Jeub et al.[14] reported that 24 h following therapeutic lumbar puncture, ONSD diminished significantly, whereas papilledema remained unchanged. The pulsatile nature of intracranial CSF pressure may influence ONSD, but with a time lag. In addition, anatomic structures like the lamina cribrosa of the posterior sclera may modulate ONSD.[18] Factors such as the timing of ONSD measurement in relation to CSF drainage due to diagnostic lumbar puncture may further complicate the relationship.[19]
A previous Indian study[20] demonstrated a significant difference in the mean ONSD across Frisen grades of papilledema. The lack of association in our study may be due to sample size limitations. Furthermore, we did not observe any correlation between ONSD values and BMI, as suggested by some previous studies.[9,11] This may be related to the high proportion of IIH patients with normal BMI in our cohort.
We also demonstrated the utility of RI of CRA for IIH diagnosis. CRA is situated anatomically within the optic nerve sheath, in the same compartment as the optic nerves, and is therefore subjected to similar pressure changes.[21] As a physiologically low-resistance circulation, any compression of CRA decreases the diastolic flow, leading to an increased RI. However, elevated CRA RI is not specific to IIH and has been observed in other ocular and systemic pathologies, including glaucoma, diabetes mellitus, and chronic liver disease.[22,23,24] Hence, measuring arterial indices serves as an adjunctive tool in the diagnostic process of IIH. Its potential as a prognostic marker in IIH requires further investigation.
Certain limitations of our study are worth mentioning. The ONSD values were not measured before the lumbar puncture, so the precise effect of lumbar puncture on pressure could not be quantified. The sample size did not permit subgroup analysis based on age, gender, and ONSD values. Previous studies suggest the utility of combined measures such as ONSD and the pit/sella ratio to increase specificity for IIH diagnosis.[25] The correlation between these radiographic features and ONSD was not examined. There is a risk of bias in the assessment as the examiner performing ONSD was not blinded to IIH diagnosis. Interobserver variability could not be studied as ONSD was assessed by a single person. Although we attempted to assess the utility of ONSD measurement in patient follow-up, variability in time to follow-up and attrition prevented a longitudinal analysis of ONSD values. Such a longitudinal analysis merits further exploration to determine the potential of ONSD as a prognostic marker. Furthermore, it is unlikely that ONSD will replace MRI or lumbar puncture requirements for IIH diagnosis because of numerous IIH mimics. It will likely supplement these existing tools and aid in prognostication.
CONCLUSION
Our study provides insights into the utility of optic nerve sheath measurements and arterial indices in the diagnosis of IIH. Further research is needed to fully understand the longitudinal relationship of these markers and treatment outcomes.
Financial support and sponsorship
Nil.
Conflicts of interest
There are no conflicts of interest.
REFERENCES
- 1.Hoffmann J, Goadsby PJ. Update on intracranial hypertension and hypotension. Curr Opin Neurol. 2013;26:240–7. doi: 10.1097/WCO.0b013e328360eccc. [DOI] [PubMed] [Google Scholar]
- 2.Janitschke D, Stögbauer J, Lattanzi S, Brigo F, Lochner P. B-mode transorbital ultrasonography for the diagnosis of idiopathic intracranial hypertension: An updated systematic review and meta-analysis. Neurol Sci. 2023;44:4313–22. doi: 10.1007/s10072-023-07016-z. [DOI] [PubMed] [Google Scholar]
- 3.Kim DH, Jun JS, Kim R. Ultrasonographic measurement of the optic nerve sheath diameter and its association with eyeball transverse diameter in 585 healthy volunteers. Sci Rep. 2017;7:15906. doi: 10.1038/s41598-017-16173-z. doi: 10.1038/s41598-017-16173-z. [DOI] [PMC free article] [PubMed] [Google Scholar]
- 4.Patterson DF, Ho ML, Leavitt JA, Smischney NJ, Hocker SE, Wijdicks EF, et al. Comparison of ocular ultrasonography and magnetic resonance imaging for detection of increased intracranial pressure. Front Neurol. 2018;9:278. doi: 10.3389/fneur.2018.00278. doi: 10.3389/fneur.2018.00278. [DOI] [PMC free article] [PubMed] [Google Scholar]
- 5.Sinclair AJ, Burdon MA, Nightingale PG, Ball AK, Good P, Matthews TD, et al. Low energy diet and intracranial pressure in women with idiopathic intracranial hypertension: prospective cohort study. BMJ. 2010;341:c2701. doi: 10.1136/bmj.c2701. doi: 10.1136/bmj.c2701. [DOI] [PMC free article] [PubMed] [Google Scholar]
- 6.Knodel S, Roemer SN, Moslemani K, Wykrota A, Käsmann-Kellner B, Seitz B, et al. Sonographic and ophthalmic assessment of optic nerve in patients with idiopathic intracranial hypertension: A longitudinal study. J Neurol Sci. 2021;430:118069. doi: 10.1016/j.jns.2021.118069. doi: 10.1016/j.jns.2021.118069. [DOI] [PubMed] [Google Scholar]
- 7.del Saz-Saucedo P, Redondo-González O, Mateu-Mateu Á, Huertas-Arroyo R, García-Ruiz R, Botia-Paniagua E. Sonographic assessment of the optic nerve sheath diameter in the diagnosis of idiopathic intracranial hypertension. J Neurol Sci. 2016;361:122–7. doi: 10.1016/j.jns.2015.12.032. [DOI] [PubMed] [Google Scholar]
- 8.Lochner P, Fassbender K, Lesmeister M, Nardone R, Orioli A, Brigo F, et al. Ocular ultrasound for monitoring pseudotumor cerebri syndrome. J Neurol. 2018;265:356–61. doi: 10.1007/s00415-017-8699-1. [DOI] [PubMed] [Google Scholar]
- 9.Ebraheim AM, Mourad HS, Kishk NA, Badr Eldin N, Saad AA. Sonographic assessment of optic nerve and ophthalmic vessels in patients with idiopathic intracranial hypertension. Neurol Res. 2018;40:728–35. doi: 10.1080/01616412.2018.1473097. [DOI] [PubMed] [Google Scholar]
- 10.Kishk NA, Ebraheim AM, Ashour AS, Badr NM, Eshra MA. Optic nerve sonographic examination to predict raised intracranial pressure in idiopathic intracranial hypertension: The cut-off points. Neuroradiol J. 2018;31:490–5. doi: 10.1177/1971400918789385. [DOI] [PMC free article] [PubMed] [Google Scholar]
- 11.Dağdelen K, Ekici M. Measuring optic nerve sheath diameter using ultrasonography in patients with idiopathic intracranial hypertension. Arq Neuropsiquiatr. 2022;80:580–5. doi: 10.1590/0004-282X-ANP-2021-0136. [DOI] [PMC free article] [PubMed] [Google Scholar]
- 12.Bakola E, Palaiodimou L, Eleftheriou A, Foska K, Pikouli A, Stefanatou M, et al. Transorbital sonography in idiopathic intracranial hypertension: Single-center study, systematic review and meta-analysis. J Neuroimaging. 2024;34:108–19. doi: 10.1111/jon.13160. [DOI] [PubMed] [Google Scholar]
- 13.Aslan N, Yildizdas D, Ozcan N, Horoz OO, Mert GG, Sertdemir Y, et al. Optic nerve sheath diameter and retinal artery resistive index measurements with bedside ophthalmic ultrasound in pediatric patients with pseudotumor cerebri syndrome. J Pediatr Intensive Care. 2020;9:181–7. doi: 10.1055/s-0040-1705112. [DOI] [PMC free article] [PubMed] [Google Scholar]
- 14.Jeub M, Schlapakow E, Ratz M, Kindler C, Schievelkamp AH, Wabbels B, et al. Sonographic assessment of the optic nerve and the central retinal artery in idiopathic intracranial hypertension. J Clin Neurosci. 2020;72:292–7. doi: 10.1016/j.jocn.2019.09.003. [DOI] [PubMed] [Google Scholar]
- 15.Friedman DI, Jacobson DM. Diagnostic criteria for idiopathic intracranial hypertension. Neurology. 2002;59:1492–5. doi: 10.1212/01.wnl.0000029570.69134.1b. [DOI] [PubMed] [Google Scholar]
- 16.Gala F. Magnetic resonance imaging of optic nerve. Indian J Radiol Imaging. 2015;25:421–38. doi: 10.4103/0971-3026.169462. [DOI] [PMC free article] [PubMed] [Google Scholar]
- 17.Naldi A, Provero P, Vercelli A, Bergui M, Mazzeo AT, Cantello R, et al. Optic nerve sheath diameter asymmetry in healthy subjects and patients with intracranial hypertension. Neurol Sci. 2020;41:329–33. doi: 10.1007/s10072-019-04076-y. [DOI] [PubMed] [Google Scholar]
- 18.Lee SH, Kim TW, Lee EJ, Kil H. Association between optic nerve sheath diameter and lamina cribrosa morphology in normal-tension glaucoma. J Clin Med. 2023;12:360. doi: 10.3390/jcm12010360. [DOI] [PMC free article] [PubMed] [Google Scholar]
- 19.Schott CK, Hirzallah MI, Heyman R, Lesky DN, Brant EB, Callaway CW. Ultrasound measurement of optic nerve sheath diameter pre- and post-lumbar puncture. Ultrasound J. 2020;12:26. doi: 10.1186/s13089-020-00173-8. [DOI] [PMC free article] [PubMed] [Google Scholar]
- 20.Raghunandan N, Joseph M, Nithyanandam S, Karat S. Role of ultrasonographic optic nerve sheath diameter in the diagnosis and follow-up of papilledema and its correlation with Frisén's severity grading. Indian J Ophthalmol. 2019;67:1310–3. doi: 10.4103/ijo.IJO_1827_18. [DOI] [PMC free article] [PubMed] [Google Scholar]
- 21.Abdul-Rahman A, Morgan W, Jo Khoo Y, Lind C, Kermode A, Carroll W, et al. Linear interactions between intraocular, intracranial pressure, and retinal vascular pulse amplitude in the fourier domain. PLoS One. 2022;17:e0270557. doi: 10.1371/journal.pone.0270557. [DOI] [PMC free article] [PubMed] [Google Scholar]
- 22.Ghany AF, Botros SM, El-Raggal TM. Central retinal artery resistive index and optical coherence tomography in assessment of glaucoma progression. Int J Ophthalmol. 2015;8:305–9. doi: 10.3980/j.issn.2222-3959.2015.02.16. [DOI] [PMC free article] [PubMed] [Google Scholar]
- 23.Khatri M, Saxena S, Kumar M, Chabbra AK, Bhasker SK, Akduman EI, et al. Resistive index of central retinal artery is a bioimaging biomarker for severity of diabetic retinopathy. Int J Retina Vitreous. 2019;5:38. doi: 10.1186/s40942-019-0189-4. [DOI] [PMC free article] [PubMed] [Google Scholar]
- 24.Sorrentino P, Tarantino G, Conca P, Ragucci P, Perrella A. Abnormally high resistive index of central retinal artery by ultrasound color Doppler in patients with viral chronic liver disease: Correlation with worsening liver staging. Ultrasound Med Biol. 2004;30:599–604. doi: 10.1016/j.ultrasmedbio.2004.02.011. [DOI] [PubMed] [Google Scholar]
- 25.Patterson DF, Ho ML, Leavitt JA, Smischney NJ, Hocker SE, Wijdicks EF, et al. Comparison of ocular ultrasonography and magnetic resonance imaging for detection of increased intracranial pressure. Front Neurol. 2018;9:278. doi: 10.3389/fneur.2018.00278. [DOI] [PMC free article] [PubMed] [Google Scholar]