

Abstract
Long noncoding RNAs (lncRNAs) have emerged as important molecules and potential new targets for human cancers. This study investigates the function of lncRNA CTBP1 antisense RNA (CTBP1‐AS) in prostate cancer (PCa) and explores the entailed molecular mechanism. Aberrantly expressed genes potentially correlated with PCa progression were probed using integrated bioinformatics analyses. A cohort of 68 patients with PCa was included, and their tumor and para‐cancerous tissues were collected. CTBP1‐AS was highly expressed in PCa tissues and cells and associated with poor patient prognosis. By contrast, tumor protein p63 (TP63) and S100 calcium binding protein A14 (S100A14) were poorly expressed in the PCa tissues and cells. CTBP1‐AS did not affect TP63 expression; however it blocked the TP63‐mediated transcriptional activation of S100A14, thereby reducing its expression. CTBP1‐AS silencing suppressed proliferation, apoptosis resistance, migration, invasion, and tumorigenicity of PCa cell lines, while its overexpression led to inverse results. The malignant phenotype of cells was further weakened by TP63 overexpression but restored following artificial S100A14 silencing. In conclusion, this study demonstrates that CTBP1‐AS plays an oncogenic role in PCa by blocking TP63‐mediated transcriptional activation of S100A14. This may provide insight into the management of PCa.
Keywords: CTBP1‐AS, prostate cancer, S100A14, TP63, transcription
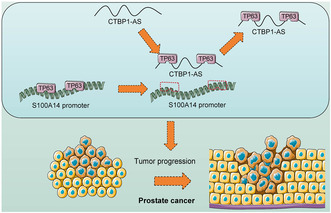
CTBP1‐AS interacts with TP63 and negates the transcription activation of S100A14, resulting in increased proliferation and dissemination of PCa cells.
Abbreviations
- CTBP1‐AS
CTBP1 antisense RNA
- EdU
5‐ethynyl‐2′‐deoxyuridine
- EMT
epithelial to mesenchymal transition
- lncRNA
long noncoding RNAs
- MUT
mutant type
- NC
negative control
- oe‐
overexpression plasmid
- PCa
prostate cancer
- PI
propidium iodide
- PRAD
prostate adenocarcinoma
- PSA
prostate‐specific antigen
- RT‐qPCR
reverse transcription‐quantitative polymerase chain reaction
- S100A14
S100 calcium binding protein A14
- TP63
tumor protein 63
- WB
western blot
- WT
wild type
1. INTRODUCTION
With nearly 1.4 million new cases and 375,000 deaths worldwide in 2020, PCa represents the second most frequent cancer and the fifth leading cause of cancer‐related deaths among men. 1 Most patients present with PRAD, characterized by luminal prostate cell‐like morphology, androgen‐driven growth, and elevated serum PSA levels. 2 Standard treatments include watchful waiting and active surveillance for low‐risk cases, and radical prostatectomy, radiation therapy, and cryotherapy for localized disease. 3 Endocrine therapy is the primary option for advanced metastatic disease; however, patients usually progress to castration‐resistant PCa with a poor prognosis after a median duration of 18–24 months of treatment. 4 The survival rate for localized disease is high, but it significantly decreases in advanced cases due to castration resistance and metastasis. 5 More effective strategies are needed to improve the outcomes of advanced patients.
LncRNAs have emerged as promising new targets for metastatic PCa and offered an explanatory understanding of several unknown facets of the malignancy. 6 They are noncoding RNA molecules over 200 nucleotides long and are essential in normal development and physiology; however, their aberrant expression has been associated with cancer. 7 Recent advances in transcriptome profiling technology have facilitated the identification of potential targets involved in tumor progression. 8 LncRNA PCAT‐1 (PCa‐associated transcript 1), for instance, has been identified in 2011 as a prostate‐specific transcriptional repressor and a regulator of cell proliferation in PCa. 9 Later research demonstrated that it augmented the progression of advanced PCa by activating the oncogenic protein kinase B and nuclear factor κB signaling pathways. 6 In this study, we identified CTBP1‐AS as a promising lncRNA aberrantly expressed in PRAD following integrated bioinformatics analyses. Intriguingly, CTBP1‐AS has been reported as a nucleus‐localized, androgen‐responsive lncRNA linked to PCa progression. 10 However, its interactive molecules in PCa have not been fully investigated.
Furthermore, bioinformatics prediction suggests TP63 as an interactive protein of CTBP1‐AS and S100A14 as a target transcript of TP63 in PRAD. TP63, also known as p63 or Trp63, belongs to the TP53 family of tumor‐suppressive transcription factors with several isoforms that play diverse functions in cell biology. 11 Markedly, TP63 mRNA has been reported to present a low‐expression pattern in PCa tissues, indicating a potential suppressive effect in PCa. 12 Similarly, the absence of TP63 has reportedly been associated with the presence of multilayered luminal epithelium in high‐grade prostatic intraepithelial neoplasia lesions. 13 Regarding S100A14, it has been recognized as an epithelial marker in PCa cells that suppresses the EMT process, a hallmark event for tumor dissemination. 14 , 15 Collectively, we conjectured that there might be a CTBP1‐AS–TP63–S100A14 axis that is aberrantly expressed in PCa and linked to PCa progression.
2. MATERIALS AND METHODS
2.1. Clinical samples
Sixty‐eight PCa patients who had undergone radical prostatectomy or transurethral prostatectomy at Harbin Medical University Cancer Hospital from June 2018 to June 2021 were included. None of the patients received prior antitumor treatment. Tumor and adjacent normal tissue specimens free from necrosis or bleeding and confirmed by pathology, were stored at −80°C. All participants provided written informed consent. This study was approved by the Ethics Committee of Harbin Medical University Cancer Hospital, following the Declaration of Helsinki.
2.2. Cell culture and treatment
Human PCa cell lines LNCaP clone FGC, C4‐2, DU145, and 22Rv1 were procured from the ATCC (Manassas, VA, USA). The human normal prostate epithelial cell line RWPE‐1 was procured from the BeNa Culture Collection (Henan, China). All cells were incubated in RPMI medium containing 10% fetal bovine serum and 1% antibiotics at 37°C in 5% CO2. Exponentially growing DU145 cells and 22Rv1 cells were transfected with the overexpression plasmid of CTBP1‐AS or TP63 (oe‐CTBP1‐AS, oe‐TP63), short hairpin (sh)RNA of CTBP1‐AS or S100A14 (sh‐CTBP1, sh‐S100A14), or the negative control plasmids (oe‐NC; sh‐NC) using Lipofectamine 2000 (Invitrogen, Thermo Fisher Scientific). The transfection plasmids were synthesized by Sangon Biotech Co., Ltd. (Shanghai, China).
2.3. RT‐qPCR
Total RNA from tissues or cells was extracted using TRIzol reagent (Thermo Fisher Scientific). The cDNA was synthesized using the PrimeScript RT reagent kit (RR047A, TaKaRa Holdings Inc., Kyoto, Japan), which was applied to qPCR analysis using the Fast SYBR Green PCR kit (4402956, Thermo Fisher Scientific) on an ABI PRISM 7500 qPCR system (Applied Biosystems, Thermo Fisher Scientific). Three duplicated wells were set. Relative gene expression values to GAPDH were analyzed using the method. The primer sequences are listed in Table 1.
TABLE 1.
Primer sequences used for RT‐qPCR.
| Gene symbol | Forward sequence (5′–3′) | Reverse sequence (5′–3′) |
|---|---|---|
| CTBP1‐AS | CTACAACTGGTCACTGGCGT | CAGCTGAAAGGCCCATGAGA |
| TP63 | CAGGAAGACAGAGTGTGCTGGT | AATTGGACGGCGGTTCATCCCT |
| S100A14 | CCTCATCAAGAACTTTCACCAGTA | GGTTGGCAATTTTCTCTTCCAGG |
| GAPDH | GTCTCCTCTGACTTCAACAGCG | ACCACCCTGTTGCTGTAGCCAA |
Abbreviations: CTBP1‐AS, CTBP1 antisense RNA; GAPDH, glyceraldehyde‐3‐phosphate dehydrogenase; RT‐qPCR, reverse transcription‐quantitative polymerase chain reaction; S100A14, S100 calcium binding protein A14; TP63, tumor protein p63.
2.4. WB analysis
Tissues or cells were lysed in RIPA lysis buffer to collect total protein. The protein concentration was examined using the BCA kit (71285‐M, Sigma‐Aldrich). Equal amounts of protein samples were separated using SDS‐PAGE and transferred onto polyvinylidene fluoride membranes. The membranes were blocked with 5% bovine serum albumin and probed with the antibodies against S100A14 (1:1000, PA5‐106282, Thermo Fisher Scientific), TP63 (1:1000, ab32353, Abcam Inc., Cambridge, MA, USA), and GAPDH (1:5000, ab9485, Abcam) overnight at 4°C, followed by incubation with secondary antibody (1:20,000, ab205718, Abcam) at room temperature for 90 min. The protein bands were developed by the enhanced chemiluminescence substrate (32109, Thermo Fisher Scientific). The protein expression relative to GAPDH was analyzed using ImageJ software (Bio‐Rad, Inc., Hercules, CA, USA).
2.5. Nucleus/cytoplasm separation assay
The nuclear and cytoplasmic components of PCa cells were separated using the Ambion™ PARIS™ kit (AM1921, Thermo Fisher Scientific). The nuclear and cytoplasmic RNA was extracted, in which the CTBP1‐AS expression was determined using RT‐qPCR. GAPDH and U6 were used as the internal loading genes for cytoplasm and nucleus, respectively.
2.6. RIP assay
The binding between CTBP1‐AS and TP63 protein was examined using an RIP kit (17‐704, Millipore Corp., Billerica, MA, USA). Briefly, DU145 and 22Rv1 cells were lysed in the RIPA buffer in an ice bath, followed by centrifugation at 12,000 g at 4°C for 10 min to collect the supernatant. Part of the cell extract was collected as Input, and another part of the extract was reacted with protein A/G magnetic bead‐conjugated anti‐TP63 (1:100, GTX102425, GeneTex Inc., San Antonio, TX, USA) or IgG (1:100, ab172730, Abcam) at 4°C overnight. The magnetic‐protein complexes were eluted and de‐crosslinked, and CTBP1‐AS expression was examined by RT‐qPCR.
2.7. ChIP‐qPCR
When confluency reached 70%–80%, DU145 and 22Rv1 cells were treated with 1% formaldehyde for DNA–protein crosslinking. After that, the cells were lysed and ultrasonicated to truncate the DNA into fragments. The supernatant was reacted with anti‐TP63 (1:100, GTX102425, GeneTex) or IgG (1:100, ab172730, Abcam) at 4°C overnight. The DNA–protein complex precipitation was collected by Protein Agarose/Sepharose. Subsequently, the precipitated complex was eluted and de‐crosslinked, and the DNA fragments were purified for qPCR analysis to analyze the enrichment of the S100A14 promoter.
2.8. Dual luciferase reporter gene assay
The binding site between the S100A14 promoter and TP63 was obtained from the Jaspar system (https://jaspar.genereg.net/analysis). The WT or MUT sequence was inserted into the pGL6 vector (Beyotime Biotechnology Co., Ltd., Shanghai, China) to construct WT or MUT luciferase reporter vectors. Constructed vectors were co‐transfected with oe‐CTBP1‐AS, sh‐CTBP1‐AS, oe‐TP63, oe‐NC, or sh‐NC into DU145 and 22Rv1 cells. After 48 h, the luciferase activity in cells was examined using the dual luciferase reporter assay kit (RG005, Beyotime).
2.9. EdU labeling assay
DU145 and 22Rv1 cells were cultured in 24‐well plates at 1 × 10⁵ cells per well. After 48 h, each well was supplemented with 10 μM EdU reagent (C0081S, Beyotime), followed by another 2 h of incubation at 37°C. Subsequently, the cells were fixed with 4% paraformaldehyde, penetrated with Triton X‐100 and incubated with Click reaction solution in the dark for 30 min, followed by Hoechst 33342 staining and microscopic observation. The EdU‐positive rate was calculated as follows: rate = (EdU‐positive cells/total cells) × 100%.
2.10. Flow cytometry
The Annexin V‐FITC/PI kit (556547, BD Biosciences, San Jose, CA, USA) was used to detect the apoptosis of DU145 and 22Rv1 cells. In short, the cells were digested and centrifuged at 800 g to discard the supernatant. Subsequently, the cells were resuspended in 500 μL binding buffer and incubated with 5 μL Annexin V‐FITC and 5 μL PI reagent in the dark for 15 min. The apoptosis rate of cells was analyzed using a flow cytometer (BD Biosciences).
2.11. Transwell assays
DU145 and 22Rv1 cells were suspended in serum‐free medium and added to Transwell apical chambers. The basolateral chambers were added with 500 μL fresh medium containing 10% fetal bovine serum. Specifically, Matrigel was pre‐coated onto apical chambers before seeding the cells in invasion tests. After 24 h of incubation, the cells that invaded or migrated to the lower membranes were fixed and stained with crystal violet. The number of migratory and invasive cells was calculated under the microscope.
2.12. Xenograft models in nude mice
Male BALB/c nude mice (3–4 weeks old, 14–18 g) were procured from SJA Laboratory Animal Co., Ltd. (Hunan, China) and fed in specific pathogen‐free conditions at 18–22°C with 50%–60% humidity. 22Rv1 cells administered lentivirus‐carried sh‐NC + oe‐NC, sh‐CTBP1‐AS + oe‐NC, sh‐CTBP1‐AS + oe‐TP63, oe‐TP63 + sh‐NC or oe‐TP63 + sh‐S100A14 were injected into mice subcutaneously. Each mouse received an injection of 0.1 mL of cell suspension containing 2 × 10⁷ cells/mL. There were eight mice for each injection. The tumor volume (V) was calculated weekly as follows: V = major axis × minor axis2 × 0.5. After 4 weeks, the mice were euthanized by overdosed (150 mg/kg) pentobarbital sodium and the tumors were collected and weighed. All animal procedures were approved by the Animal Ethics Committee of Harbin Medical University Cancer Hospital.
2.13. Immunohistochemistry (IHC)
The harvested tumor tissue sections (4 μm) were deparaffined, rehydrated, blocked with 3% H2O2, antigen‐retrieved in a water bath (98°C) for 20 min, and blocked with normal goat serum. Subsequently, the sections were incubated with anti‐S100A14 (1:200, PA5‐55666, Abcam) at 4°C overnight and then with IgG (1:100, ab205718, Abcam) at 37°C for 30 min. After color development using DAB and nuclear staining by hematoxylin, the sections were sealed for microscopic observation.
2.14. Statistical analysis
All experimental data were analyzed and plotted using Prism 8 (GraphPad, La Jolla, CA, USA). All data are expressed as the mean ± standard deviation. To compare differences, Student's t‐test was used for two groups, and one‐way or two‐way ANOVA with Tukey's post hoc test was used for difference analysis when more than two groups were involved. Correlations between gene expression and the clinical characteristics of patients were analyzed using the chi‐squared test. A p‐value <0.05 was considered statistically significant.
3. RESULTS
3.1. CTBP1‐AS is significantly highly expressed in PCa tissues and cells
Differentially expressed genes between PCa and normal tissues were identified by analyzing GSE155056 and GSE179321 datasets (Figure 1A,B). Significantly differentially expressed lncRNAs were obtained by adj. p‐value <0.05 and |Log FC| > 2, and nine shared outcomes were obtained (Figure S1A). LINC00239, NPY6R, TBX5‐AS1, GPC5‐AS1, CTBP1‐AS, PCAT18, and LINC01213 were predicted to show differential expression profiles between PRAD and normal samples in the StarBase (http://starbase.sysu.edu.cn/) (Figure S1B). Among them, CTBP1‐AS stood out, as it has been reported as a nucleus‐predominant oncogene in PCa by suppressing the expression of tumor‐suppressor genes. 10 Of note, the cancer tissues exhibited higher CTBP1‐AS expression compared with the paracancerous tissues (Figure 1C). The 68 patients were allocated into high‐ or low‐CTBP1‐AS expression groups based on the median gene expression value. As shown in Table 2, high CTBP1‐AS expression was significantly correlated with tumor size, distant metastasis, lymph node metastasis, and high PSA level in patients while having no correlation with age. Similarly, increased expression of CTBP1‐AS was detected in PCa cell lines (LNCaP clone FGC, C4‐2, DU145, and 22Rv1) compared with the normal RWPE‐1 cells (Figure 1D). The 22Rv1 and DU145 cells with relatively higher CTBP1‐AS expression were selected for subsequent use.
FIGURE 1.
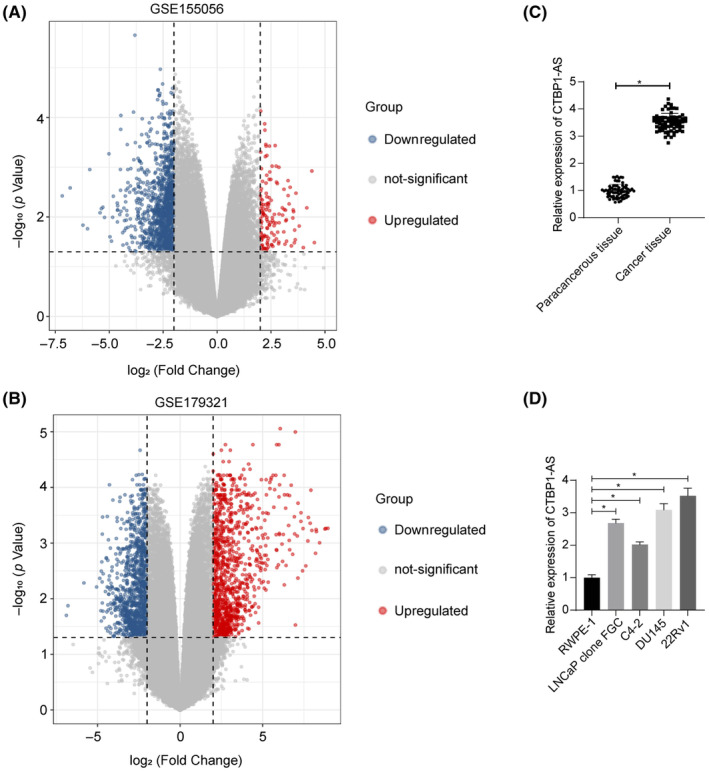
CTBP1‐AS is significantly highly expressed in PCa tissues and cells. (A, B) Volcano plots for differentially expressed genes between PCa and normal tissues (adj. p‐value <0.05 and |Log FC| > 2 as the thresholds) in the GSE155056 and GSE179321 datasets; (C) expression of CTBP1‐AS in the tumor and the paracancerous tissues from clinical PCa patients (N = 68) determined using RT‐qPCR; (D) expression of CTBP1‐AS in the procured PCa cell lines (LNCaP clone FGC, C4‐2, DU145 and 22Rv1) and normal RWPE‐1 cells determined using RT‐qPCR. For cellular experiments, three biological replicates were performed. Differences were compared by paired t‐test (C) or one‐way ANOVA (D). *p < 0.05.
TABLE 2.
Correlation between CTBP1‐AS expression and the clinical characteristics of patients with PCa (N = 68).
| Characteristics | CTBP1‐AS expression | p‐value | |
|---|---|---|---|
| High (N = 34) | Low (N = 34) | ||
| Age | |||
| <60 | 18 | 21 | 0.624 |
| ≥60 | 16 | 13 | |
| Primary tumor | |||
| ≤T2 | 6 | 23 | <0.001 |
| >T2 | 28 | 11 | |
| Distant metastasis | |||
| M0 | 9 | 24 | <0.001 |
| M1 | 25 | 10 | |
| Lymph node metastasis | |||
| Yes | 22 | 7 | <0.001 |
| No | 12 | 27 | |
| PSA at initial diagnosis (ng/mL) | |||
| ≤20 | 8 | 29 | <0.001 |
| >20 | 26 | 5 | |
Note: The associations between every two categorical variables were analyzed by chi‐squared test. A p‐value less than 0.05 was considered statistically significant.
Abbreviations: CTBP1‐AS, CTBP1 antisense RNA; PCa, prostate cancer; PSA, prostate‐specific antigen; TNM, tumor node metastasis.
3.2. Silencing of CTBP1‐AS suppresses the malignant phenotype of PCa cells in vitro
Three shRNAs of CTBP1‐AS were transfected into DU145 and 22Rv1 cells. The sh‐CTBP1‐AS‐1 with the best interfering effect was selected for subsequent use (Figure S2A). The EdU labeling assay revealed that the CTBP1‐AS silencing significantly reduced the proliferation of cells (Figure S2B). By contrast, the apoptosis rate in cells was increased after CTBP1‐AS silencing (Figure S2C). In addition, the Transwell assays revealed that the migration and invasion of DU145 and 22Rv1 cells were blocked by sh‐CTBP1‐AS (Figure S2D,E).
3.3. CTBP1‐AS interacts with TP63 to suppress S100A14 transcription
The nucleus/cytoplasm separation assay revealed a nucleus‐predominance of CTBP1‐AS in DU245 and 22RV1 cells (Figure 2A). Subsequently, we predicted interactive proteins of CTBP1‐AS in the RNAInter system (http://www.rnainter.org/). The outcomes were compared with the differentially expressed genes (|Log FC| > 2) in the GSE155056 and GSE179321 datasets (Figure 2B), with three intersections obtained: TP63, GATA3, and SNAI2. Among them, TP63 had the highest |Log FC| in both datasets. Subsequently, we confirmed the successful binding between the TP63 protein and CTBP1‐AS in both DU145 and 22Rv1 cells using RIP assays (Figure 2C). The RT‐qPCR and WB assays showed that both the mRNA and protein levels of TP63 were decreased in the clinically collected tumor tissues (Figure 2D) and in the PCa cell lines (Figure 2E).
FIGURE 2.
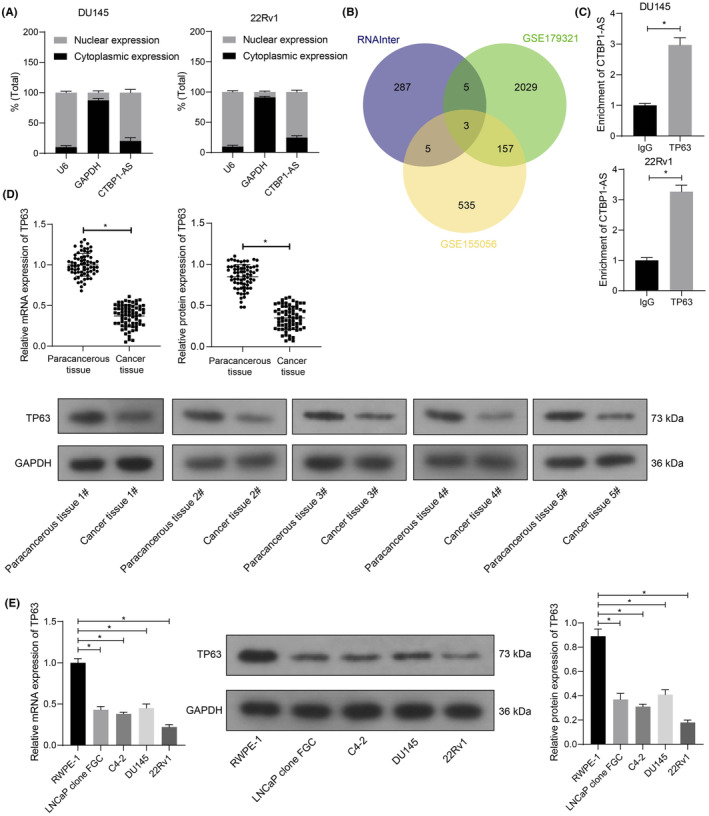
CTBP1‐AS interacts with TP63, a molecule poorly expressed in PCa. (A) Subcellular localization of CTBP1‐AS in DU145 and 22Rv1 cells analyzed by nucleus/cytoplasm separation assay; (B) bioinformatics analyses of the candidate interactive proteins of CTBP1‐AS in PCa predicted using the RNAInter system and their intersections with the differentially expressed genes in the GSE179321 and GSE155056 datasets; (C) direct binding between CTBP1‐AS and the TP63 protein in DU145 and 22Rv1 cells examined by RIP assay; (D) TP63 mRNA and protein levels in the clinically collected PCa cancer and paracancerous tissues (N = 68) examined by RT‐qPCR and WB assays, respectively; (E) TP63 mRNA and protein levels in the procured PCa cell lines (LNCaP clone FGC, C4‐2, DU145, and 22Rv1) and normal RWPE‐1 cells determined by RT‐qPCR and WB assays, respectively. For cellular experiments, three biological replicates were performed. Differences were analyzed by unpaired t‐test (C), paired t‐test (D), or one‐way ANOVA (E). *p < 0.05.
The target transcripts of TP63 were then predicted using the hTFtarget system (http://bioinfo.life.hust.edu.cn/hTFtarget/#!/). The possible targets were intersected with the differentially expressed genes in the two GSE datasets as well, with two outcomes obtained: LGR6 and S100A14 (Figure 3A). S100A14, which has been demonstrated as a promising tumor‐suppressive marker in PCa, 15 was selected for subsequent research. According to the StarBase data, S100A14 shows a low‐expression pattern in PRAD samples (Figure 3B), which presents a negative correlation with CTBP1‐AS while a positive correlation with TP63 (Figure 3C). Additionally, the Jaspar database suggests the existence of multiple TP63 binding sites near the S100A14 promoter region (chr1:153615196–153,616,467) (Figure 3D). Notably, we identified reduced S100A14 levels in the PCa tissues and cell lines (Figure 3E,F). ChIP‐qPCR assays revealed the direct binding of TP63 to the S100A14 promoter in both DU251 and 22Rv1 cells (Figure 3G). Additionally, we treated the DU145 and 22Rv1 cells with sh‐CTBP1‐AS or oe‐CTBP1‐AS, with the successful gene alteration confirmed by RT‐qPCR (Figure 3H). Notably, the CTBP1‐AS overexpression reduced the binding between TP63 and the S100A14 promoter, whereas its silencing increased the binding (Figure 3I). In addition, the dual luciferase assay revealed that the transcriptional activity of the WT S100A14 promoter in cells was suppressed by CTBP1‐AS overexpression but increased after CTBP1‐AS silencing. However, the CTBP1‐AS alteration did not significantly affect the luciferase activity of the reporter vector harboring the MUT S100A14 promoter (Figure 3J). Additionally, overexpression of TP63 was found to enhance the luciferase activity of the WT S100A14 promoter reporter vector while having no impact on the MUT S100A14 promoter reporter vector (Figure 3K). In addition, the CTBP1‐AS overexpression led to a decline in the S100A14 mRNA and protein levels while having no impact on TP63 expression. The oe‐TP63 transfection in cells led to increased expression of TP63 and S100A14, and further administration of oe‐CTBP1‐AS reduced the S100A14 expression again (Figure 3L,M).
FIGURE 3.
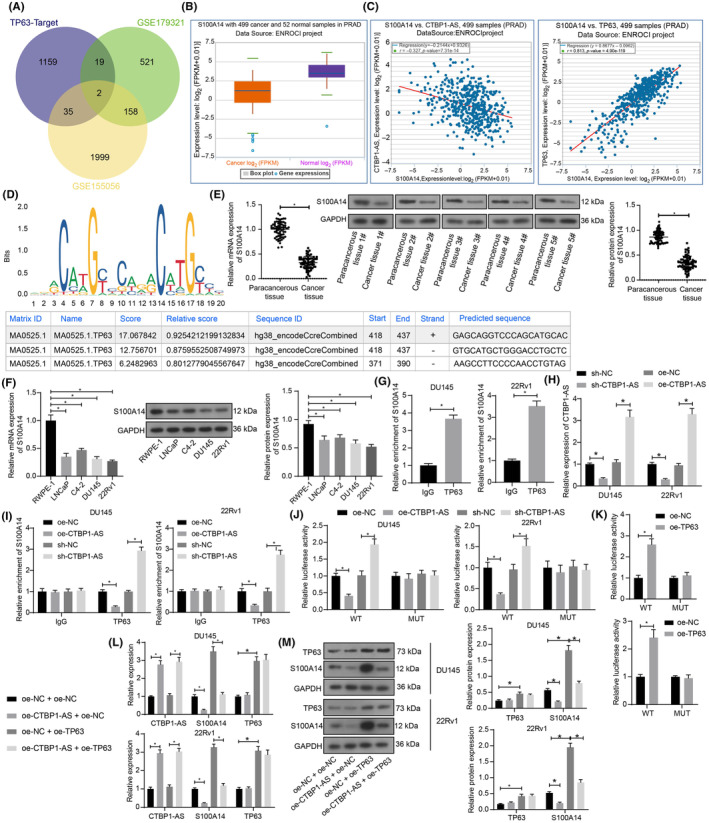
CTBP1‐AS interacts with TP63 to suppress S100A14 transcription. (A) Downstream targets of TP63 predicted in the hTFtarget system and their intersections with differentially expressed genes in the GSE179321 and GSE155056 datasets; (B) expression pattern of S100A14 in PRAD and normal samples in the StarBase system; (C) correlations of S100A14 with CTBP1‐AS and TP63 in PRAD in the StarBase system; (D) putative binding sites between TP63 and S100A14 promoter obtained from the Jaspar system; (E) S100A14 mRNA and protein levels in the clinically collected PCa cancer and paracancerous tissues (N = 68) examined by RT‐qPCR and WB assays, respectively; (F) S100A14 mRNA and protein levels in the procured PCa cell lines (LNCaP clone FGC, C4‐2, DU145 and 22Rv1) and normal RWPE‐1 cells determined by RT‐qPCR and WB assays, respectively; (G) binding relationship between TP63 and S100A14 promoter in DU145 and 22Rv1 cells determined by the ChIP‐qPCR assay; (H) expression of CTBP1‐AS in DU145 and 22Rv1 cells after sh‐CTBP1‐AS or oe‐CTBP1‐AS transfection determined by RT‐qPCR; (I) binding relationship between TP63 and S100A14 promoter in DU145 and 22Rv1 cells with artificial CTBP1‐AS upregulation or silencing determined by ChIP‐qPCR assay; (J) transcriptional activity of the WT or MUT S100A14 promoter luciferase reporter vectors in DU145 and 22Rv1 cells with artificial CTBP1‐AS upregulation or silencing examined by dual luciferase reporter gene assay; (K) transcriptional activity of the WT or MUT S100A14 promoter luciferase reporter vectors in DU145 and 22Rv1 cells with artificial TP63 upregulation examined by dual luciferase reporter gene assay; (L) expression of CTBP1‐AS, TP63 mRNA, and S100A14 mRNA in DU145 and 22Rv1 cells after different transfection combinations determined by RT‐qPCR; (M) protein levels of TP63 and S100A14 in DU145 and 22Rv1 cells after different transfection combinations determined by WB analysis. For cellular experiments, three biological replicates were performed. Differences were analyzed by paired t‐test (E), unpaired t‐test (G), one‐way ANOVA (F) or two‐way ANOVA (H–M). *p < 0.05.
3.4. The CTBP1‐AS/TP63/S100A14 axis affects the malignant property of PCa cells in vitro
Additionally, we constructed DU145 and 22Rv1 cell lines with oe‐CTBP1‐AS + oe‐NC, oe‐CTBP1‐AS + oe‐S100A14, oe‐TP63 + sh‐NC and oe‐TP63 + sh‐S100A14 transfections. The oe‐S100A14 and sh‐S100A14 administration successfully altered S100A14 expression in the cells while having no effect on CTBP1‐AS or TP63 expression (Figure 4A). Notably, CTBP1‐AS overexpression promoted the proliferation of DU145 and 22Rv1 cells while decreasing cell apoptosis. Further overexpression of TP63 or S100A14 blocked proliferation and enhanced apoptosis of the cells. In the presence of TP63 overexpression, further silencing of S100A14 restored cell proliferation while suppressing cell apoptosis (Figure 4B,C). Similarly, the migration and invasion of cells were promoted by CTBP1‐AS overexpression but were decreased by TP63 or S100A14 overexpression. Still, S100A14 silencing restored cell migration and invasion blocked by TP63 overexpression (Figure 4D,E).
FIGURE 4.
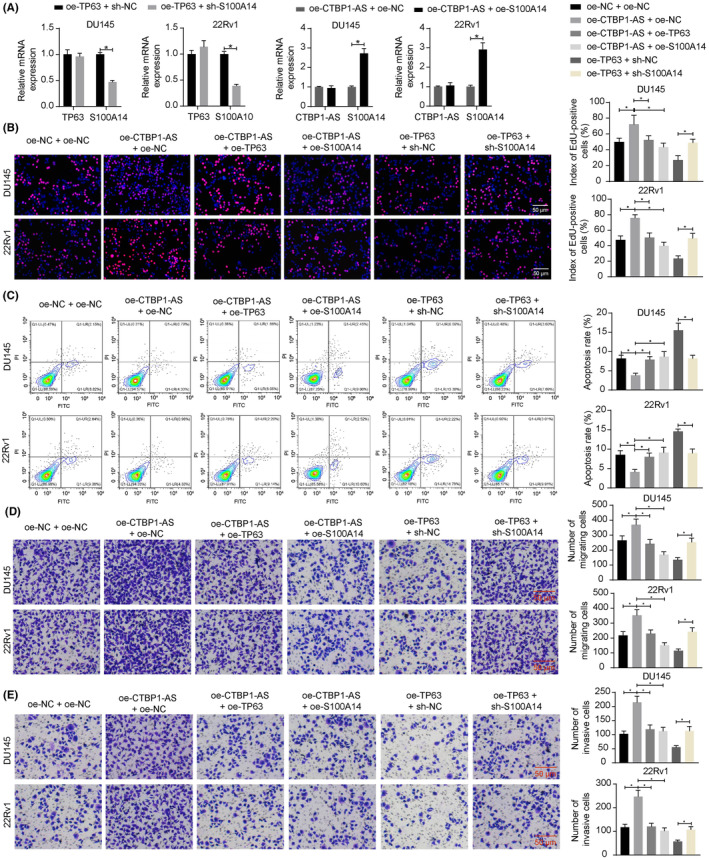
The CTBP1‐AS/TP63/S100A14 axis affects the malignant properties of PCa cells in vitro. (A) Expression of TP63 and S100A14 in DU145 and 22Rv1 cells after several combinations of oe‐NC, oe‐TP63, sh‐NC, and sh‐S100A14 administration determined by RT‐qPCR; (B) proliferation of DU145 and 22Rv1 cells determined by EdU labeling assay; (C) apoptosis of DU145 and 22Rv1 cells determined by flow cytometry; (D, E) migration (D) and invasion (E) of DU145 and 22Rv1 cells determined by Transwell assays. Three biological replicates were performed. Differences were compared using one‐way ANOVA (B–E) or two‐way ANOVA (A). *p < 0.05.
3.5. The CTBP1‐AS/TP63/S100A14 axis affects the tumorigenicity of PCa cells in nude mice
For in vivo validation, 22Rv1 cells stably transfected with sh‐NC + oe‐NC, sh‐CTBP1‐AS + oe‐NC, sh‐CTBP1‐AS + oe‐TP63, oe‐TP63 + sh‐NC, or oe‐TP63 + sh‐S100A14 were injected into mice subcutaneously (to reduce animal sacrifice, only one cell line was used). Prior to injection, the successful gene interference was validated by RT‐qPCR. Notably, oe‐TP63 also enhanced the S100A14 levels, and sh‐CTBP1‐AS increased S100A14 expression without altering TP63 expression (Figure 5A). Markedly, CTBP1‐AS silencing reduced the growth rate and weight of the xenograft tumors. Overexpression of TP63 further weakened the tumorigenic activity of the 22Rv1 cells. However, S100A14 silencing restored the volume and weight of xenograft tumors suppressed by TP63 (Figure 5B–D). IHC assay concerning gene expression in tumor tissues revealed that S100A14 expression was increased by CTBP1‐AS silencing, further increased by TP63 overexpression, and suppressed by S100A14 silencing (Figure 5E).
FIGURE 5.
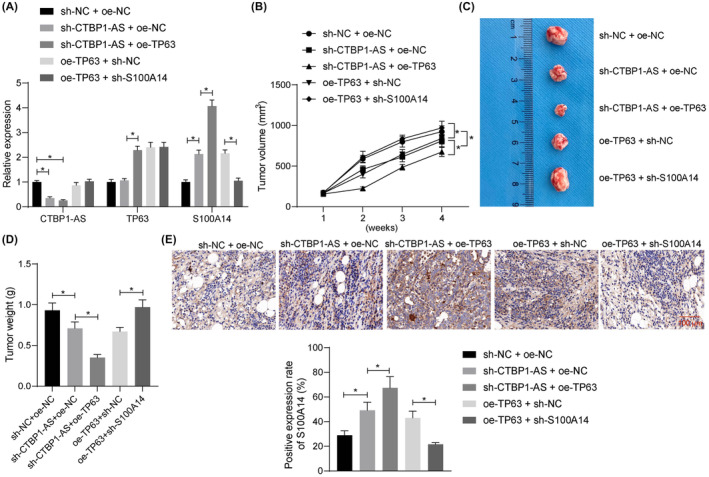
The CTBP1‐AS/TP63/S100A14 axis affects the tumorigenicity of PCa cells in nude mice. (A) Expression of CTBP1‐AS, TP63, and S100A14 in 22Rv1 cells after several combinations of sh‐NC, oe‐NC, sh‐CTBP1‐AS, oe‐TP63, and sh‐S100A14 administration determined by RT‐qPCR; (B) volume of the xenograft tumors formed by the 22Rv1 cells; (C) representative images of the xenograft tumors on week 4 after animal euthanasia; (D) weight of the collected xenograft tumors; (E) expression of S100A14 in the xenograft tumor tissues analyzed by IHC. In each group, n = 8. Differences were compared by one‐way ANOVA (D, E) or two‐way ANOVA (A, B). *p < 0.05.
4. DISCUSSION
There have been significant developments in comprehending the genomic makeup and underlying biology of both primary and metastatic PCa, causing the management of this disease to progress rapidly. LncRNAs can regulate gene expression at various levels and have important biological functions in cells and pathological events, including PCa development. 16 , 17 In this study, the authors report that lncRNA CTBP1‐AS drives the malignant phenotype of PCa cells by inhibiting the TP63–S100A14 axis.
Bioinformatics analyses indicated CTBP1‐AS as an important aberrantly expressed lncRNA in PCa. In fact, CTBP1‐AS has been reported as an androgen‐responsive lncRNA localized in the nucleus that contributed to PCa progression by repressing the transcriptional co‐regulator CTBP1 through sense–antisense regulation, as well as globally regulating tumor‐suppressor genes through epigenetic mechanisms. 10 In breast cancer, CTBP1‐AS has been identified as a predictor of poor patient outcomes and survival, as well as a supporter of the malignant behavior of cells. 18 In this case, CTBP1‐AS was found to act by sponging microRNA‐940 in the cytoplasm. Other studies have confirmed a close relationship between CTBP1‐AS upregulation and the development of polycystic ovary syndrome. 19 , 20 In this study, we identified elevated CTBP1‐AS expression in PCa tissues and cells and confirmed its association with aggressive tumor presentation in clinical patients and malignant properties of cells. These trends were partly in line with the observations by Takayama et al. 10 Interestingly, Takayama et al. claimed that the androgen‐responsive CTBP1‐AS is highly expressed in long‐term androgen‐deprived cells derived from LNCaP, an androgen receptor (AR)‐positive cell line; however, they only found the presence of strong CTBP1‐AS expression in AR‐positive patients. 10 We found that the baseline expression of CTBP1‐AS was lower in the C4‐2 cell line (isolated from an LNCaP cell subcutaneous xenograft tumor of castrated mouse) compared with that in the LNCaP clone FGC. This evidence indicates that the expression of CTBP1‐AS in advanced PCa might not be solely regulated by AR signaling.
In general, lncRNAs can regulate gene expression at the transcriptional level by binding to DNA or transcription factors, at the post‐transcriptional level by targeting microRNAs, mRNAs, or proteins, or at the epigenetic‐dependent manner by interfering with chromatin complexes. 21 The functional mechanisms depend on its subcellular localization. They regulate chromatin remodeling and transcription within the nucleus while regulating mRNA turnover and translation in the cytoplasm. 22 We confirmed the nucleus‐predominance of CTBP1‐AS in both DU145 and 22Rv1 cell lines. Therefore, we set out to explore its possible interactive proteins in PCa. Based on comprehensive bioinformatics, we confirmed the direct binding between CTBP1‐AS and TP63. The binding is possibly supported by the sterile alpha motif (SAM) domain in the C‐terminal region of TP63 protein. 23 , 24 The SAM domain involves not only protein–protein interaction but also RNA binding. 24 , 25 In contrast with its paralog tumor‐suppressor TP53 that frequently mutates in cancers, TP63 is rarely mutated and exhibits either tumor‐suppressive or tumor‐oncogenic effects depending on the cellular contexts and specific gene isoforms. 26 , 27 , 28 In squamous cell carcinoma cells, TP63 has been suggested as an oncogenic transcription factor participating in the regulation of hundreds of cis‐regulatory elements and activation of cancer‐promoting pathways. 29 Specifically, the TP63 gene, especially the ΔN isoform, has been identified as a prostate basal cell marker and critical for the normal development of the prostate. 30 The ΔNp63‐positive PCa cells presented a basal‐like cell phenotype but showed no sign of bone metastasis. 31 In PCa, TP63 downregulation has been detected in tumor tissues. 12 Robert and colleagues also identified decreased expression of TP63 in PCa induced by microRNA‐301a, leading to increased EMT. 32 TP63 can target several types of proteins, such as chromatin‐modifying proteins, cell surface proteins, metabolism‐related proteins, inhibitors of NF‐κB kinase subunit α, and so forth. 11 In the previous study by Mukherjee S and Sudandiradoss C, TP63 was reported as one of the key transcription factors controlling the expression of hub genes related to tumor invasion and metastasis, with TP63 downregulation found to have a causative relationship with metastatic castration‐resistant PCa. 33 In the present study, we identified reduced TP63 expression levels in the PCa tumors and cells and found that TP63 overexpression blocked the malignant phenotype of two PCa cell lines. When it comes to the downstream targets of TP63, S100A14 was obtained by integrated bioinformatics analyses. S100A14 has shown aberrant and tissue‐specific expression patterns across several cancers, linking to specific cellular functions, 34 playing either tumor‐suppressive or tumor‐promoting functions. 35 , 36 , 37 , 38 In this study, we found that the S100A14 expression in PCa cells was increased upon TP63 upregulation. Functional experiments revealed that S100A14 suppressed the proliferation, survival, migration and invasion, and tumorigenic activity of the PCa cells, which were partly in line with previous findings by Jiang et al. 14 Notably, we found that the CTBP1‐AS upregulation (or downregulation) in the two PCa cell lines decreased (or enhanced) the S100A14 expression without affecting TP63 expression, indicating that the CTBP1‐AS plays an oncogenic role in PCa, at least partly, by blocking the TP63‐mediated transcriptional activation of S100A14. Jiang et al. ascribed the tumor‐suppressive function of S100A14 to the upregulation of the tumor‐suppressor FAT1 and the activation of the Hippo signaling pathway. 14 Sapkota and colleagues have demonstrated that S100A14 increases the nuclear accumulation of p53, leading to upregulation of p21 and cell cycle arrest. 39 Therefore, S100A14 might function through multiple mechanisms. However, the precise downstream molecular mechanisms responsible for the antitumor effects of S100A14 in PCa remain unclear in this study, which represents an interesting topic for further investigation.
In conclusion, the present study demonstrates that CTBP1‐AS suppresses TP63‐mediated transcriptional activation of S100A14 to augment the malignant phenotype of cells (Figure 6). Also, we validated the tumor‐suppressive effect of TP63 and S100A14 in PCa. The findings may shed new light on the management of PCa that suppression of CTBP1‐AS, or restoration of TP63 or S100A14 levels, may favor the clinical outcome of PCa patients. However, there remain several limitations. First, as mentioned above, the downstream molecular mechanisms implicated in the antitumor effects of S100A14 remain unclear. Additionally, a follow‐up study of the enrolled clinical respondents, scheduled for 5 years, is ongoing, and the data are not yet complete. This may limit the clinical translational value of the present study. We are diligently collecting and analyzing the necessary information and would like to fill in these gaps in the near future.
FIGURE 6.

CTBP1‐AS interacts with TP63 and negates the transcription activation of S100A14, resulting in increased proliferation and dissemination of PCa cells.
AUTHOR CONTRIBUTIONS
Guangzheng Wu: Conceptualization; formal analysis; investigation; software; writing – original draft. Zhenkun Dong: Conceptualization; formal analysis; investigation; resources; writing – original draft. Yuhang Dong: Formal analysis; project administration; resources; supervision; writing – original draft. Yinmei Chen: Formal analysis; project administration; software; visualization; writing – review and editing. Huan Zhu: Data curation; investigation; supervision; visualization; writing – review and editing. Dexin Ding: Formal analysis; project administration; software; visualization; writing – original draft. Yan Cui: Formal analysis; methodology; supervision; validation; writing – review and editing. Yiwen Wang: Formal analysis; project administration; software; validation; writing – review and editing. Yangyang Xu: Formal analysis; investigation; resources; validation; writing – review and editing. Hui Chen: Data curation; methodology; software; validation; writing – original draft.
CONFLICT OF INTEREST STATEMENT
The authors declare no conflict of interest.
ETHICS STATEMENT
Approval of the research protocol by an Institutional Reviewer Board: This study was approved by the Ethics Committee of Harbin Medical University Cancer Hospital. All procedures were conducted in adherence with the Declaration of Helsinki.
Informed Consent: N/A.
Registry and the Registration No. of the study/trial: N/A.
Animal Studies: All animal procedures were approved by the Animal Ethics Committee of Harbin Medical University Cancer Hospital.
Supporting information
Figure S1.
ACKNOWLEDGEMENTS
The authors are thankful to the Haiyan Fund (JJZD2022‐09).
Wu G, Dong Z, Dong Y, et al. LncRNA CTBP1‐AS inhibits TP63‐mediated activation of S100A14 during prostate cancer progression. Cancer Sci. 2024;115:1492‐1504. doi: 10.1111/cas.16138
Guangzheng Wu and Zhenkun Dong contributed equally to this work.
Contributor Information
Yangyang Xu, Email: dr_xuyangyang@outlook.com.
Hui Chen, Email: huichenhmu@yeah.net.
REFERENCES
- 1. Sung H, Ferlay J, Siegel RL, et al. Global cancer statistics 2020: GLOBOCAN estimates of incidence and mortality worldwide for 36 cancers in 185 countries. CA Cancer J Clin. 2021;71:209‐249. [DOI] [PubMed] [Google Scholar]
- 2. Conteduca V, Oromendia C, Eng KW, et al. Clinical features of neuroendocrine prostate cancer. Eur J Cancer. 2019;121:7‐18. [DOI] [PMC free article] [PubMed] [Google Scholar]
- 3. Chin YF, Lynn N. Systematic review of focal and salvage cryotherapy for prostate cancer. Cureus. 2022;14:e26400. [DOI] [PMC free article] [PubMed] [Google Scholar]
- 4. Xin S, Sun X, Jin L, et al. The prognostic signature and therapeutic value of phagocytic regulatory factors in prostate adenocarcinoma (PRAD). Front Genet. 2022;13:877278. [DOI] [PMC free article] [PubMed] [Google Scholar]
- 5. Akova Olken E, Aszodi A, Taipaleenmaki H, et al. SFRP2 overexpression induces an osteoblast‐like phenotype in prostate cancer cells. Cells. 2022;11:4081. [DOI] [PMC free article] [PubMed] [Google Scholar]
- 6. Shang Z, Yu J, Sun L, et al. LncRNA PCAT1 activates AKT and NF‐kappaB signaling in castration‐resistant prostate cancer by regulating the PHLPP/FKBP51/IKKalpha complex. Nucleic Acids Res. 2019;47:4211‐4225. [DOI] [PMC free article] [PubMed] [Google Scholar]
- 7. Bao G, Xu R, Wang X, et al. Identification of lncRNA signature associated with Pan‐cancer prognosis. IEEE J Biomed Health Inform. 2021;25:2317‐2328. [DOI] [PubMed] [Google Scholar]
- 8. Lorenzi L, Avila Cobos F, Decock A, et al. Long noncoding RNA expression profiling in cancer: challenges and opportunities. Genes Chromosomes Cancer. 2019;58:191‐199. [DOI] [PubMed] [Google Scholar]
- 9. Prensner JR, Iyer MK, Balbin OA, et al. Transcriptome sequencing across a prostate cancer cohort identifies PCAT‐1, an unannotated lincRNA implicated in disease progression. Nat Biotechnol. 2011;29:742‐749. [DOI] [PMC free article] [PubMed] [Google Scholar]
- 10. Takayama K, Horie‐Inoue K, Katayama S, et al. Androgen‐responsive long noncoding RNA CTBP1‐AS promotes prostate cancer. EMBO J. 2013;32:1665‐1680. [DOI] [PMC free article] [PubMed] [Google Scholar]
- 11. Fisher ML, Balinth S, Mills AA. p63‐related signaling at a glance. J Cell Sci. 2020;133:jcs228015. [DOI] [PMC free article] [PubMed] [Google Scholar]
- 12. Parsons JK, Saria EA, Nakayama M, et al. Comprehensive mutational analysis and mRNA isoform quantification of TP63 in normal and neoplastic human prostate cells. Prostate. 2009;69:559‐569. [DOI] [PMC free article] [PubMed] [Google Scholar]
- 13. Sandhu S, Moore CM, Chiong E, Beltran H, Bristow RG, Williams SG. Prostate cancer. Lancet. 2021;398:1075‐1090. [DOI] [PubMed] [Google Scholar]
- 14. Jiang S, Zhu Y, Chen Z, et al. S100A14 inhibits cell growth and epithelial‐mesenchymal transition (EMT) in prostate cancer through FAT1‐mediated hippo signaling pathway. Hum Cell. 2021;34:1215‐1226. [DOI] [PubMed] [Google Scholar]
- 15. Parsana P, Amend SR, Hernandez J, Pienta KJ, Battle A. Identifying global expression patterns and key regulators in epithelial to mesenchymal transition through multi‐study integration. BMC Cancer. 2017;17:447. [DOI] [PMC free article] [PubMed] [Google Scholar]
- 16. Mirzaei S, Paskeh MDA, Okina E, et al. Molecular landscape of LncRNAs in prostate cancer: a focus on pathways and therapeutic targets for intervention. J Exp Clin Cancer Res. 2022;41:214. [DOI] [PMC free article] [PubMed] [Google Scholar]
- 17. Mitobe Y, Takayama KI, Horie‐Inoue K, Inoue S. Prostate cancer‐associated lncRNAs. Cancer Lett. 2018;418:159‐166. [DOI] [PubMed] [Google Scholar]
- 18. Cui HB, Geng CZ. Molecular mechanisms of long chain non‐coding RNA CTBP1‐AS in regulation of invasion and migration of breast cancer cells. J Biol Regul Homeost Agents. 2019;33:773‐785. [PubMed] [Google Scholar]
- 19. Nabi M, Andrabi SM, Rasool SUA, Ashraf S, Majid I, Amin S. Androgen receptor coregulator long noncoding RNA CTBP1‐AS is associated with polycystic ovary syndrome in Kashmiri women. Endocrine. 2022;75:614‐622. [DOI] [PubMed] [Google Scholar]
- 20. Wen M, Dou X, Zhang S, et al. CTBP1‐AS upregulation is associated with polycystic ovary syndrome and can be effectively downregulated by cryptotanshinone. Mol Med Rep. 2022;26:245. [DOI] [PMC free article] [PubMed] [Google Scholar]
- 21. Chen Y, Li Z, Chen X, Zhang S. Long non‐coding RNAs: from disease code to drug role. Acta Pharm Sin B. 2021;11:340‐354. [DOI] [PMC free article] [PubMed] [Google Scholar]
- 22. Huang W, Li H, Yu Q, Xiao W, Wang DO. LncRNA‐mediated DNA methylation: an emerging mechanism in cancer and beyond. J Exp Clin Cancer Res. 2022;41:100. [DOI] [PMC free article] [PubMed] [Google Scholar]
- 23. Ghioni P, Bolognese F, Duijf PH, Van Bokhoven H, Mantovani R, Guerrini L. Complex transcriptional effects of p63 isoforms: identification of novel activation and repression domains. Mol Cell Biol. 2002;22:8659‐8668. [DOI] [PMC free article] [PubMed] [Google Scholar]
- 24. Sathyamurthy A, Freund SM, Johnson CM, Allen MD, Bycroft M. Structural basis of p63alpha SAM domain mutants involved in AEC syndrome. FEBS J. 2011;278:2680‐2688. [DOI] [PubMed] [Google Scholar]
- 25. Green JB, Gardner CD, Wharton RP, Aggarwal AK. RNA recognition via the SAM domain of Smaug. Mol Cell. 2003;11:1537‐1548. [DOI] [PubMed] [Google Scholar]
- 26. Choi W, Shah JB, Tran M, et al. p63 expression defines a lethal subset of muscle‐invasive bladder cancers. PLoS One. 2012;7:e30206. [DOI] [PMC free article] [PubMed] [Google Scholar]
- 27. Gaya JM, Lopez‐Martinez JM, Karni‐Schmidt O, et al. DeltaNp63 expression is a protective factor of progression in clinical high grade T1 bladder cancer. J Urol. 2015;193:1144‐1150. [DOI] [PubMed] [Google Scholar]
- 28. Su X, Chakravarti D, Flores ER. p63 steps into the limelight: crucial roles in the suppression of tumorigenesis and metastasis. Nat Rev Cancer. 2013;13:136‐143. [DOI] [PMC free article] [PubMed] [Google Scholar]
- 29. Li LY, Yang Q, Jiang YY, et al. Interplay and cooperation between SREBF1 and master transcription factors regulate lipid metabolism and tumor‐promoting pathways in squamous cancer. Nat Commun. 2021;12:4362. [DOI] [PMC free article] [PubMed] [Google Scholar]
- 30. Labbe DP, Brown M. Transcriptional regulation in prostate cancer. Cold Spring Harb Perspect Med. 2018;8:a030437. [DOI] [PMC free article] [PubMed] [Google Scholar]
- 31. Galoczova M, Nenutil R, Pokorna Z, Vojtesek B, Coates PJ. TAp63 and DeltaNp63 (p40) in prostate adenocarcinomas: DeltaNp63 associates with a basal‐like cancer stem cell population but not with metastasis. Virchows Arch. 2021;478:627‐636. [DOI] [PubMed] [Google Scholar]
- 32. Nam RK, Benatar T, Wallis CJ, et al. MiR‐301a regulates E‐cadherin expression and is predictive of prostate cancer recurrence. Prostate. 2016;76:869‐884. [DOI] [PubMed] [Google Scholar]
- 33. Mukherjee S, Sudandiradoss C. Transcriptomic analysis of castration, chemo‐resistant and metastatic prostate cancer elucidates complex genetic crosstalk leading to disease progression. Funct Integr Genomics. 2021;21:451‐472. [DOI] [PubMed] [Google Scholar]
- 34. Basnet S, Sharma S, Costea DE, Sapkota D. Expression profile and functional role of S100A14 in human cancer. Oncotarget. 2019;10:2996‐3012. [DOI] [PMC free article] [PubMed] [Google Scholar]
- 35. Li X, Ding F, Wang L, Chen H, Liu Z. Disruption of enhancer‐driven S100A14 expression promotes esophageal carcinogenesis. Cancer Lett. 2022;545:215833. [DOI] [PubMed] [Google Scholar]
- 36. Li X, Wang M, Gong T, et al. A S100A14‐CCL2/CXCL5 signaling axis drives breast cancer metastasis. Theranostics. 2020;10:5687‐5703. [DOI] [PMC free article] [PubMed] [Google Scholar]
- 37. Zhang Y, Sun M, Gao L, et al. ZHX2 inhibits thyroid cancer metastasis through transcriptional inhibition of S100A14. Cancer Cell Int. 2022;22:76. [DOI] [PMC free article] [PubMed] [Google Scholar]
- 38. Zhu M, Wang H, Cui J, et al. Calcium‐binding protein S100A14 induces differentiation and suppresses metastasis in gastric cancer. Cell Death Dis. 2017;8:e2938. [DOI] [PMC free article] [PubMed] [Google Scholar]
- 39. Sapkota D, Costea DE, Blo M, et al. S100A14 inhibits proliferation of oral carcinoma derived cells through G1‐arrest. Oral Oncol. 2012;48:219‐225. [DOI] [PubMed] [Google Scholar]
Associated Data
This section collects any data citations, data availability statements, or supplementary materials included in this article.
Supplementary Materials
Figure S1.