

Abstract
Neuroferritinopathy is a disorder of neurodegeneration with brain iron accumulation that has no proven disease‐modifying treatments. Clinical trials require biomarkers of iron deposition. We examined brain iron accumulation in one presymptomatic FTL mutation carrier, two individuals with neuroferritinopathy and one healthy control using ultra‐high‐field 7T MRI. There was increased magnetic susceptibility, suggestive of iron deposition, in superficial and deep gray matter in both presymptomatic and symptomatic neuroferritinopathy. Cavitation of the putamen and globus pallidus increased with disease stage and at follow up. The widespread brain iron deposition in presymptomatic and early disease provides an opportunity for monitoring disease‐modifying intervention.
Introduction
Neuroferritinopathy (OMIM #606159) is a disorder of neurodegeneration with brain iron accumulation (NBIA type 3), typically presenting in mid‐adulthood with a slowly progressive movement disorder and cognitive impairment. 1 Most affected individuals have a single base insertion in exon 4 (c460InsA) 2 of the ferritin light chain (FTL) gene but six other mutations in the same gene have been identified. 3 All variants likely restrict ferritin iron‐sequestering, causing iron deposition and eventual cell death. 4 The long presymptomatic stage in neuroferritinopathy presents an opportunity for iron chelation before irreversible neurodegeneration.
Brain iron accumulation can be detected in vivo using MRI. 5 , 6 Previous studies using 1.5T and 3T MRI in neuroferritinopathy showed iron deposition in the basal ganglia but did not detect the more widespread iron deposition seen even in early disease stages at postmortem. 1 , 7 , 8 , 9 Other case reports of 3T MRI in neuroferritinopathy show cortical iron deposition, particularly in the motor cortex, and suggest this “pencil sign” may be specific to neuroferritinopathy. 10 , 11 Here, we report results using ultra‐high field (7T) MRI in three individuals with a pathogenic FTL variant at varying disease stages and a healthy control. Our aim was to determine if 7T MRI could detect brain iron deposition in the superficial and deep gray matter in both presymptomatic and symptomatic neuroferritinopathy.
Methods
We recruited three participants with the same FTL gene mutation (c.460InsA; p.Arg154LysfsTer27): An asymptomatic male in his 30s with a positive family history; a woman in her 50s with a 1‐year history of mild dysarthria, limb ataxia, and dystonia; a man in his 40s with a 10‐year history of orofacial dyskinesia, dysarthria, limb tremor, and dystonia. An asymptomatic woman in her 20s with no family history of neuroferritinopathy or other neurological or psychiatric disease was used as a healthy control. All individuals gave written informed consent to participate (REC 13/YH/0310). The participant with 10 years disease duration returned for a 2‐year follow up assessment and scan. We have not provided detailed demographic information to preserve participant anonymity given the rarity of neuroferritinopathy. None of these patients are included in other published studies.
Participants underwent 7T MRI with a MAGNETOM Terra scanner (Siemens, Germany) including a T1‐weighted MP2RAGE structural sequence (FTL carriers: 0.7 mm isotropic voxels, TE = 2.64 ms, TR = 3500 ms, TI = 725/3150 ms, Healthy control: 0.75 mm voxels, TE = 1.99 ms, TR = 4300 ms, TI = 840/2370 ms) and multi‐echo T2*‐weighted sequence (1.4 mm isotropic resolution, TE1 = 4.68 ms, 6 echoes with echo‐spacing 3.24 ms, TR = 43 ms, nominal FA = 15°).
Qualitative review was performed by a neuroradiologist (TM). R2* maps were obtained using the Auto‐Regression on Linear Operations algorithm. 12 QSM maps were derived using the QSMbox 2.0 Multi‐Scale Dipole Inversion algorithm. 13 , 14 Tissue segmentation of MP2RAGE images was performed using SPM12 default settings. Cortical regions were derived from the Harvard‐Oxford atlas and subcortical regions from the PD25 atlas. 15 The dentate region of interest was derived from the Diedrichsen template. 16 We summarized the R2* and QSM concentrations only from voxels predicted as gray or white matter.
We used CSF fraction of the putamen and globus pallidus to measure cavitation in these regions as a postmortem study of neuroferritinopathy confirmed that the cavitation appearance on MRI is caused by loss of brain tissue. 8 CSF fraction was calculated using SPM12 tissue segmentation maps and the PD25 atlas regions using the spm_summarise function in SPM and Matlab 2021b (Mathworks, USA).
Results
In participants with an FTL mutation, R2* maps demonstrated markedly increased signal compared to controls, consistent with iron deposition, throughout the gray matter of the supratentorial brain. This was most pronounced in the primary motor cortex. There was less involvement of the cerebellum, except in the dentate nucleus where signal was increased in neuroferritinopathy. There was high signal in deep gray matter structures including the putamen, globus pallidus, red nucleus, substantia nigra, and subthalamic nucleus (Fig. 1A). The participants with 10 years of neuroferritinopathy symptoms had higher magnetic susceptibility compared to the presymptomatic FTL carrier and individual with 1 year of symptoms. There was no consistent difference in magnetic susceptibility between the presymptomatic FTL mutation carrier and the participants with only 1 year of symptoms (Table 1). QSM demonstrated similar intensity distribution to R2* maps (Table 1, Fig. 1B). R2* and QSM maps were largely unchanged, with minor changes in most regions with formal quantification, in the single neuroferritinopathy participant with a 2‐year interval scan (Table 1).
Figure 1.
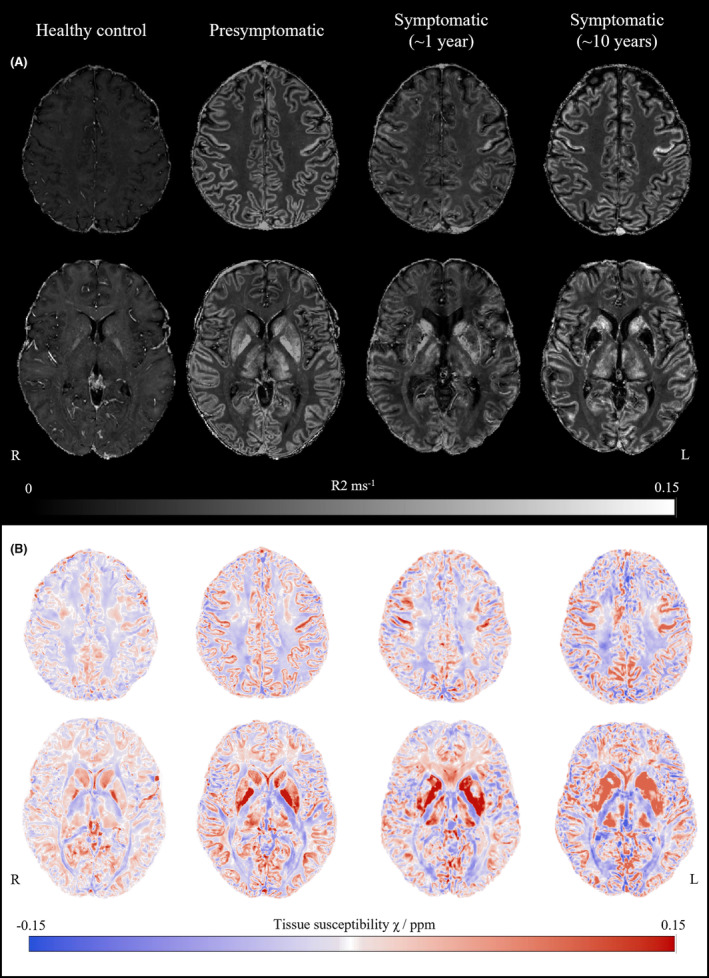
Brain iron accumulation in neuroferritinopathy. (A) Two representative axial R2* maps from each participant. Brightness and contrast widths are the same for all images. The R2* images were thresholded at 0.15 ms−1 to improve visualization. (B) Two representative axial quantitative susceptibility χ maps from each participant.
Table 1.
Quantification of magnetic susceptibility χ and striatum cavitation (% of CSF in region) in neuroferritinopathy.
| Control | FTL mutation carriers | ||||
|---|---|---|---|---|---|
| Presymptomatic | Symptomatic (1 year) | Symptomatic (10 years) | |||
| Baseline | 2 year follow up | ||||
| Frontal | |||||
| R2* | 0.019 | 0.054 | 0.048 | 0.064 | 0.065 |
| QSM | 0.018 | 0.030 | 0.029 | 0.037 | 0.039 |
| Temporal | |||||
| R2* | 0.020 | 0.058 | 0.049 | 0.062 | 0.062 |
| QSM | 0.019 | 0.031 | 0.032 | 0.034 | 0.034 |
| Parietal | |||||
| R2* | 0.021 | 0.060 | 0.048 | 0.065 | 0.065 |
| QSM | 0.018 | 0.033 | 0.030 | 0.035 | 0.040 |
| Occipital | |||||
| R2* | 0.022 | 0.062 | 0.050 | 0.066 | 0.065 |
| QSM | 0.020 | 0.032 | 0.030 | 0.036 | 0.041 |
| Cingulate | |||||
| R2* | 0.020 | 0.049 | 0.040 | 0.058 | 0.056 |
| QSM | 0.020 | 0.030 | 0.030 | 0.044 | 0.040 |
| Red nucleus | |||||
| R2* | 0.027 | 0.107 | 0.077 | 0.089 | 0.083 |
| QSM | 0.040 | 0.102 | 0.208 | 0.199 | 0.175 |
| Substantia Nigra | |||||
| R2* | 0.029 | 0.095 | 0.066 | 0.097 | 0.093 |
| QSM | 0.036 | 0.146 | 0.161 | 0.211 | 0.214 |
| Subthalamic nucleus | |||||
| R2* | 0.027 | 0.084 | 0.078 | 0.074 | 0.076 |
| QSM | 0.019 | 0.127 | 0.164 | 0.094 | 0.111 |
| Caudate | |||||
| R2* | 0.025 | 0.062 | 0.050 | 0.081 | 0.084 |
| QSM | 0.042 | 0.057 | 0.083 | 0.122 | 0.110 |
| Putamen | |||||
| R2* | 0.025 | 0.074 | 0.064 | 0.094 | 0.074 |
| QSM | 0.025 | 0.055 | 0.081 | 0.133 | 0.113 |
| %CSF | 0.039 | 0.124 | 0.087 | 0.096 | 0.078 |
| Globus pallidus | |||||
| R2* | 0.094 | 0.208 | 0.199 | 0.209 | 0.167 |
| QSM | 0.022 | 0.073 | 0.055 | 0.080 | 0.080 |
| %CSF | 0.021 | 0.039 | 0.049 | 0.047 | 0.051 |
| Thalamus | |||||
| R2* | 0.019 | 0.054 | 0.048 | 0.064 | 0.065 |
| QSM | 0.018 | 0.030 | 0.029 | 0.037 | 0.039 |
| Dentate nucleus | |||||
| R2* | 0.023 | 0.058 | 0.054 | 0.079 | 0.079 |
| QSM | 0.021 | 0.038 | 0.075 | 0.101 | 0.108 |
Susceptibility values (QSM) in ppm. R2* values in ms‐1. %CSF values are percentage of region containing CSF (a proxy for cavitation).
CSF replacement of brain tissue (cavitation) in the putamen and globus pallidus increased with disease duration in neuroferritinopathy (Fig. 2). There was no cavitation in the healthy control nor the presymptomatic FTL mutation carrier. Early cavitation was apparent in the patient with 1 year of symptoms and severe cavitation after 10 years disease duration which then increased over 2 years (Table 1).
Figure 2.
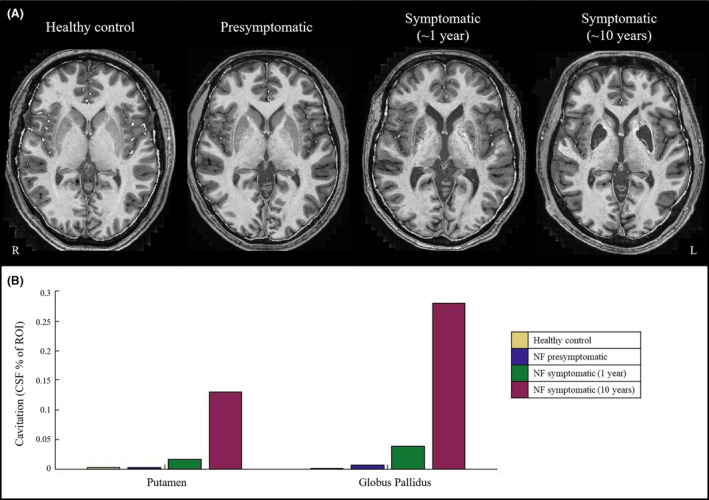
Cavitation in neuroferritinopathy. (A) Representative axial imaging from T1‐weighted MP2RAGE images in MNI space. (B) Cavitation (measured by CSF fraction of the region of interest) in the putamen and globus pallidus.
Discussion
Ultra‐high field MRI shows R2* and QSM values are increased, suggesting iron accumulation, throughout the brain in neuroferritinopathy. This was already widespread in the presymptomatic participant. More advanced disease was associated with greater cavitation of putamen and globus pallidus but there was not a clear increase in iron deposition.
We show that 7T MRI can detect the iron deposition in deep and superficial gray matter, seen at postmortem but not with lower field (1.5T) MRI. 1 , 3 , 8 , 9 , 10 7T MRI revealed involvement of widespread cortical regions, including the motor cortex, and deep gray matter structures, including the red nucleus and substantia nigra.
There was no increase in iron deposition between participants with different disease stages, or in the single case with longitudinal follow up. In contrast, there was a clear association between cell loss in the striatum and more advanced disease. The presymptomatic participant had widespread iron but no striatal cavitation while symptomatic participants had a similar extent of iron deposition but severe cavitation, which increased with follow up. This suggests that it is the cell loss which eventually follows iron deposition that causes the clinical features of neuroferritinopathy. This is supported by previous findings of iron deposition in early childhood, decades before anticipated symptom onset 7 and postmortem evidence of a presymptomatic case with widespread brain iron deposition but no neuronal loss. 8 Alternatively, any increase in iron deposition may be undetected by MRI due to a ceiling effect of magnetic susceptibility. This has been suggested in other NBIAs with postmortem validation 17 but not in neuroferritinopathy. 8
The widespread iron deposition and subsequent neurodegeneration mirrors the clinical presentations of neuroferritinopathy and explains why many symptoms are not typically associated with a focal disease of the basal ganglia. 1 Limb stiffness has been attributed to dystonia but can be associated with pyramidal signs 1 which would be explained by iron accumulation in the motor cortices. The extensive cortical iron deposition explains the heterogenous cognitive impairments which include executive dysfunction, disinhibition, emotional lability, psychosis, and apraxia. 18
Our study has limitations. This was a pilot study with only 3 FTL mutations carriers and a single control with unmatched demographics. Only a single participant had longitudinal imaging. This prevents any definitive conclusions on the relationship between iron accumulation, confounders (e.g., age and sex), and clinical phenotype. The control participant was younger than any of the FTL mutation carriers which may confound our results as brain iron accumulates with age. We used magnetic susceptibility as a measure of brain iron but this can be affected by other substances including myelin. Our results are corrected for brain atrophy, but a larger study would enable more robust statistical analysis of the relationship between brain atrophy and magnetic susceptibility.
In conclusion, this pilot study using ultra‐high field MRI suggests neuroferritinopathy is associated with widespread superficial and deep gray matter iron deposition before symptom onset. Neuroferritinopathy has a presymptomatic stage of decades, 7 which we show can be detected with ultra‐high field MRI and provides an opportunity for disease modification before irreversible neurodegeneration and striatal cavitation. Iron chelation is a promising treatment for neuroferritinopathy, with a causative link between FTL mutation, iron accumulation, and neurodegeneration. 3 , 4 Our pilot study supports the use of ultra‐high field MRI as a trial endpoint, 1 , 9 similar to other NBIA subtypes. 19 Larger studies are required to test the association between regional variation in iron deposition and clinical phenotype.
Funding Information
This work was funded by the UK Medical Research Council (13044). A.G. Murley is an NIHR Clinical Lecturer. C. T. Rodgers was funded by a Sir Henry Dale Fellowship from the Wellcome Trust and Royal Society (098436/Z/12/B). J. van den Ameele is a Wellcome Clinical Research Career Development Fellow (219615/Z/19/Z), who receives support from the Evelyn Trust (21–25), the MRC Mitochondrial Biology Unit (MC_UU_00028/8), and the BBSRC (BB/X00256X/1). R.Horvath. is a Wellcome Trust Investigator (109915/Z/15/Z), who receives support from the Medical Research Council (UK) (MR/V009346/1), the Addenbrookes Charitable Trust (G100142), the Evelyn Trust, the Stoneygate Trust, the Lily Foundation, Action for AT and an MRC strategic award to establish an International Centre for Genomic Medicine in Neuromuscular Diseases (ICGNMD) MR/S005021/1. P.F. Chinnery is a Wellcome Trust Principal Research Fellow (212219/Z/18/Z), and a UK NIHR Senior Investigator, who receives support from the Medical Research Council Mitochondrial Biology Unit (MC_UU_00028/7), the Medical Research Council (MRC) International Centre for Genomic Medicine in Neuromuscular Disease (MR/S005021/1), the Leverhulme Trust (RPG‐2018‐408), an MRC research grant (MR/S035699/1), and an Alzheimer's Society Project Grant (AS‐PG‐18b‐022). This research was supported by the NIHR Cambridge Biomedical Research Centre (NIHR203312). The views expressed are those of the author(s) and not necessarily those of the NIHR or the Department of Health and Social Care.
Author Contributions
AGM substantially contributed to analysis and interpretation of data and drafted the manuscript. CR, HB, JvdA, and RH substantially contributed to acquisition, analysis and interpretation of data and reviewed the manuscript for important intellectual content. CTR and TM substantially contributed to analysis and interpretation of data and reviewed the manuscript for important intellectual content. PFC conceived and designed the study, substantially contributed to analysis and interpretation of data and drafted the manuscript.
Conflict of Interest
Catarina Rua is an employee of Invicro, London, UK. None of the other authors have any conflicts of interest relevant to this study.
Acknowledgements
We thank the participants for volunteering for the study, the radiographers at the Wolfson Brain Imaging Centre, University of Cambridge and P Simon Jones, University of Cambridge for his advice on imaging analysis.
Funding Statement
This work was funded by UK Medical Research Council grants 13044, MR/S035699/1, MR/V009346/1, MR/S005021/1, and MC_UU_00028/7; Addenbrookes Charitable Trust grant G100142; Wellcome Trust grants 109915/Z/15/Z and 212219/Z/18/Z; Royal Society grant 098436/Z/12/B; Stoneygate Trust; Lily Foundation ; BBSRC grant BB/X00256X/1; Evelyn Trust grant 219615/Z/19/Z; Leverhulme Trust grant RPG‐2018‐408; Alzheimer's Society grant AS‐PG‐18b‐022; NIHR Cambridge Biomedical Research Centre grant NIHR203312.
Data Availability Statement
Anonymized data are available on reasonable request to the lead author for academic (noncommercial) purposes, although restrictions may apply to adhere to participant consent and anonymity.
References
- 1. Chinnery PF, Crompton DE, Birchall D, et al. Clinical features and natural history of neuroferritinopathy caused by the FTL1 460InsA mutation. Brain. 2007;130(1):110‐119. [DOI] [PubMed] [Google Scholar]
- 2. Curtis ARJ, Fey C, Morris CM, et al. Mutation in the gene encoding ferritin light polypeptide causes dominant adult‐onset basal ganglia disease. Nat Genet. 2001;28(4):350‐354. [DOI] [PubMed] [Google Scholar]
- 3. Keogh MJ, Morris CM, Chinnery PF. Neuroferritinopathy. International Review of Neurobiology. Academic Press Inc.; 2013:91‐123. [DOI] [PubMed] [Google Scholar]
- 4. Levi S, Rovida E. Neuroferritinopathy: from ferritin structure modification to pathogenetic mechanism. Neurobiol Dis. 2015;81:134‐143. [DOI] [PMC free article] [PubMed] [Google Scholar]
- 5. Lehéricy S, Roze E, Goizet C, Mochel F. MRI of neurodegeneration with brain iron accumulation. Curr Opin Neurol. 2020;33(4):462‐473. [DOI] [PubMed] [Google Scholar]
- 6. Tambasco N, Nigro P, Chiappiniello A, et al. An updated overview of the magnetic resonance imaging of brain iron in movement disorders. Behav Neurol. 2022;2022:1‐20. [DOI] [PMC free article] [PubMed] [Google Scholar]
- 7. Keogh MJ, Jonas P, Coulthard A, Chinnery PF, Burn J. Neuroferritinopathy: a new inborn error of iron metabolism. Neurogenetics. 2012;13(1):93‐96. [DOI] [PMC free article] [PubMed] [Google Scholar]
- 8. Kurzawa‐Akanbi M, Keogh M, Tsefou E, et al. Neuropathological and biochemical investigation of hereditary Ferritinopathy cases with ferritin light chain mutation: prominent protein aggregation in the absence of major mitochondrial or oxidative stress. Neuropathol Appl Neurobiol. 2021;47(1):26‐42. [DOI] [PubMed] [Google Scholar]
- 9. McNeill A, Gorman G, Khan A, Horvath R, Blamire AM, Chinnery PF. Progressive brain iron accumulation in neuroferritinopathy measured by the thalamic T2* relaxation rate. Am J Neuroradiol. 2012;33(9):1810‐1813. [DOI] [PMC free article] [PubMed] [Google Scholar]
- 10. Batla A, Adams ME, Erro R, et al. Cortical pencil lining in neuroferritinopathy: a diagnostic clue. Neurology. 2015;84(17):1816‐1818. doi: 10.1212/WNL.0000000000001511 [DOI] [PMC free article] [PubMed] [Google Scholar]
- 11. Lehn A, Mellick G, Boyle R. Teaching NeuroImages: Neuroferritinopathy. 2011. https://www.neurology.org [DOI] [PubMed]
- 12. Pei M, Nguyen TD, Thimmappa ND, et al. Algorithm for fast monoexponential fitting based on auto‐regression on linear operations (ARLO) of data. Magn Reson Med. 2015;73(2):843‐850. [DOI] [PMC free article] [PubMed] [Google Scholar]
- 13. Acosta‐Cabronero J, Milovic C, Mattern H, Tejos C, Speck O, Callaghan MF. A robust multi‐scale approach to quantitative susceptibility mapping. NeuroImage. 2018;183:7‐24. [DOI] [PMC free article] [PubMed] [Google Scholar]
- 14. Rua C, Clarke WT, Driver ID, et al. Multi‐centre, multi‐vendor reproducibility of 7T QSM and R2* in the human brain: results from the UK7T study. NeuroImage. 2020;223:117358. [DOI] [PMC free article] [PubMed] [Google Scholar]
- 15. Xiao Y, Fonov V, Bériault S, et al. Multi‐contrast unbiased MRI atlas of a Parkinson's disease population. Int J Comput Assist Radiol Surg. 2015;10(3):329‐341. [DOI] [PubMed] [Google Scholar]
- 16. Diedrichsen J, Balsters JH, Flavell J, Cussans E, Ramnani N. A probabilistic MR atlas of the human cerebellum. NeuroImage. 2009;46(1):39‐46. [DOI] [PubMed] [Google Scholar]
- 17. Vroegindeweij LHP, Wielopolski PA, Boon AJW, et al. MR imaging for the quantitative assessment of brain iron in aceruloplasminemia: a postmortem validation study. NeuroImage. 2021;245:118752. [DOI] [PubMed] [Google Scholar]
- 18. Keogh MJ, Singh B, Chinnery PF. Early neuropsychiatry features in neuroferritinopathy. Mov Disord. 2013;28(9):1310‐1313. [DOI] [PubMed] [Google Scholar]
- 19. Klopstock T, Tricta F, Neumayr L, et al. Safety and efficacy of deferiprone for pantothenate kinase‐associated neurodegeneration: a randomised, double‐blind, controlled trial and an open‐label extension study. Lancet Neurol. 2019;18(7):631‐642. https://linkinghub.elsevier.com/retrieve/pii/S1474442219301425 [DOI] [PubMed] [Google Scholar]
Associated Data
This section collects any data citations, data availability statements, or supplementary materials included in this article.
Data Availability Statement
Anonymized data are available on reasonable request to the lead author for academic (noncommercial) purposes, although restrictions may apply to adhere to participant consent and anonymity.