

Abstract
This study evaluated workers’ exposures to flame retardants, including polybrominated diphenyl ethers (PBDEs), organophosphate esters (OPEs) and other brominated flame retardants (BFRs), in various industries. The study aimed to characterize OPE metabolite urinary concentrations and PBDE serum concentrations among workers from different industries, compare these concentrations between industries and the general population, and evaluate the likely route of exposure (dermal or inhalation). The results showed that workers from chemical manufacturing had significantly higher (p-value < 0.05) urinary concentrations of OPE metabolites compared to other industries. Spray polyurethane foam workers had significantly higher (p-value < 0.05) urinary concentrations of bis(1-chloro-2-propyl) phosphate (BCPP) compared to other industries. Electronic scrap workers had higher serum concentrations of certain PBDE congeners compared to the general population. Correlations were observed between hand wipe samples and air samples containing specific flame-retardant parent chemicals and urinary metabolite concentrations for some industries, suggesting both dermal absorption and inhalation as primary routes of exposure for OPEs. Overall, this study provides insights into occupational exposure to flame retardants in different industries and highlights the need for further research on emerging flame retardants and exposure reduction interventions.
Graphical Abstract

1. INTRODUCTION
Flame retardants in products have changed rapidly in the last two decades, primarily because polybrominated diphenyl ethers (PBDEs), the most common flame retardants previously, were phased out of manufactured products from 2004 to 2013 in the United States(1,2). In addition, the Stockholm Convention restricted the usage of PBDEs globally in 2017(3). PBDEs were often replaced with organophosphate esters (OPEs) and other brominated flame retardants (BFRs). Flame retardants are added to consumer and industrial materials like flexible polyurethane foams, printed circuit boards, computer monitor casings, children’s products, carpets, plastics, automotive and aviation components, and building insulation to slow and/or stop the spread of fire(4–6). OPEs (e.g., triphenyl phosphate (TPhP)) are also added to consumer products like nail polish as plasticizers(7–8).
PBDEs are persistent and known to accumulate in humans(9) and the environment(10). Lower molecular weight PBDEs (e.g., −47, −99) and some of the higher molecular weight PBDEs (i.e., −153) have relatively long half-lives (e.g., years), while BDE-209 has a shorter half-life (e.g., 15 days)(9,11). PBDEs have been associated with adverse health outcomes like thyroid disruption and reproductive changes(12–14). Additionally, BDE-209 has been classified as possible human carcinogens by the EPA(15). PBDEs congeners are lipophilic and are not found in urine, therefore, biological monitoring is commonly performed using serum samples(16).
OPEs and other BFRs have been associated with adverse health effects as well. Specifically, tris(2-chloroethyl) phosphate (TCEP) and tris(1,3-dichloro-2-propyl) phosphate (TDCPP) are listed under California Proposition 65 as potentially carcinogenic(17). Animal studies showed that exposure to TCEP resulted in kidney tumors, tributyl phosphate (TBP) resulted in urinary bladder and liver tumors, and TDCPP resulted in liver, kidney, testes, and adrenal gland tumors(18). Exposure to OPEs like TDCPP(19) and TPhP(20–21) can affect development in zebrafish. Additionally, TPhP and Tris(1-chloro-2-propyl) phosphate (TCPP) could be toxic to human cells(22) while TDCPP has been found to potentially alter human cell homeostasis(23). 2-Ethylhexyl 2,3,4,5-tetrabromobenzoate (EH-TBB), a brominated flame retardant often found in commercial mixtures known as Firemaster 550 and 600, is an endocrine disruptor(24). As such, understanding occupational exposure to OPEs and BFRs is of interest. OPEs readily metabolize allowing for biological monitoring to be performed by analyzing metabolites in urine(25). Biomonitoring results of OPEs in urine are reported in the literature as concentration per volume (ng/mL) or they are sometimes adjusted using creatinine or specific gravity (SG). A recent review of the literature(26) proposed standardization of analysis and reporting to enable comparison between studies.
Workers, in addition to the U.S. general population, have been shown to be exposed to flame retardants(9,27). Workers can be occupationally exposed to flame retardants during primary production (e.g. chemical manufacturing), secondary production (e.g. foam production), downstream use (e.g. spray polyurethane foam application, roofing, nail salons), and decommissioning (e.g. electronic scrap industry). Air and dermal exposure to flame retardants, reported previously in workers in some of these industries (e.g., chemical manufacturing), were elevated compared to other studies(27). There have been relatively few occupational-specific biological monitoring studies, but non-occupational studies have been conducted to determine human exposure to flame retardants in the general population and within specific groups such as gymnasts or those seeking reproductive counseling(12,25,28–29). Gravel et al (2019) identified a gap in occupational exposure assessment to flame retardants; most studies evaluated PBDEs with fewer studies evaluating OPEs(26).
A review of the limited occupational studies to date reported that firefighters, waste incinerators, and cable manufacturing workers have the highest mean blood concentration of BDE-47, BDE-183, and BDE-209, respectively, compared to the other occupations studied(26). Shaw et al. reported firefighters had elevated PBDE serum concentrations compared to the general population(30). Other studies have reported elevated PBDE concentrations for workers exposed to recycled foam(31), manufacturing workers(32) and electronic scrap workers(33). A more recent study in China examining workers manufacturing BDE-209 and decabromodiphenyl ethane (DBDPE) found serum levels for individuals working with each respective chemical were several orders of magnitude higher than electronic scrap workers(34).
Fewer studies have characterized occupational exposure to OPE flame retardants through biomonitoring, with one review finding only five occupational studies in aircraft, aircraft maintenance, construction, hotels, and offices(26). Additional studies were published recently characterizing OPE exposures for firefighters(35), nail salon workers(7), spray foam workers(36–37), and electronic scrap workers(38–39). Studies found spray polyurethane foam workers had high urinary concentrations of TCPP biomarkers(36–37) and other studies reported firefighter OPE urinary concentrations were higher than the U.S. general population(29,35). Three recent Chinese studies reported elevated urinary concentrations of OPE metabolites with bis(2-chloroethyl) phosphate (BCEP) (a metabolite of TCEP) being the most abundant OPE compared to the other metabolites among electronic scrap workers(38–40). Knowledge about exposure pathways provides information so that workplace recommendations for reducing exposure can be made.
This study evaluated workers’ exposures to flame retardants in select industries to 1) characterize OPE metabolites urinary concentrations and PBDE serum concentrations among workers from different industries, 2) compare industries to each other and to the U.S. general population, and 3) evaluate the most likely route of exposure (i.e., dermal or inhalation).
2. METHODS AND MATERIALS
2.1. Study Design
The study design was described previously along with results from personal air and hand wipe samples(27). Briefly, a convenience sample of 18 companies was recruited across the following industries from 2015 to 2017: chemical manufacturing, gymnastics schools, roofing, foam manufacturing, nail salons, electronic scrap, rigid board installation, and spray polyurethane foam application. At each company, all workers performing job tasks with potential exposures to flame retardants were invited to participate in the study. All participants consented to participate in the study and were asked demographic and career-related questions to better understand how these factors impacted their exposures. This study was reviewed and approved by the Centers for Disease Control and Prevention (CDC)/National Institute for Occupational Safety and Health (NIOSH) Institutional Review Board (IRB) (§ See 45 CFR part 46.101(c); 21 CFR part 56). All participants provided written consent.
Sampling methods were the same for all industries and included the collection of urine and serum samples which were analyzed per section 2.2 and 2.3. Table 1 provides a full list of the urinary and serum chemical exposure biomarkers measured in all workers. Results of personal air and hand wipe samples collected concurrently were reported previously(27). Briefly, air samples consisted of a time weighted average of two full workdays of the parent chemicals shown in Table 1. Based on a review of safety data sheets and knowledge of the manufacturing processes, air and hand wipe samples were evaluated for flame retardant classes known or suspected to be present—therefore not all air and handwipe samples were analyzed for all analytes. Other information collected included gender, age, race, ethnicity, body mass index (BMI), length of time working in the industry, hand washing practices (categorized as yes and no, based on whether the participant reported they washed their hands at least once during their shift), glove use (categorized as yes, no, and intermittent glove use), and wearing nail polish. Data collection was not always on the first day of the work week, so we collected the day they last worked (e.g. yesterday, 2 days ago).
Table 1.
Flame retardant parent chemicals and biomarkers quantifed in urine and serum.
| Parent Chemical | Biomarker in Urine |
|---|---|
| Organophosphate Esters (OPEs) | |
| Triphenyl phosphate (TPP or TPhP) | Diphenyl phosphate (DPhP)* |
| Tris(1,3-dichloro-2-propyl) phosphate (TDCPP) | Bis(1,3-dichloro-2-propyl) phosphate (BDCPP) |
| Tri-p-cresyl phosphate (TpCP) | Di-p-cresyl phosphate (DpCP) |
| Tris(1-chloro-2-propyl) phosphate (TCPP or TCIPP) | Bis(1-chloro-2-propyl) phosphate (BCPP) |
| Tributyl phosphate or Tri-n-butyl phosphate (TBP or TnBP) | Dibutyl phosphate (DBP or DBuP) |
| Tribenzyl phosphate (TBzP) | Dibenzyl phosphate (DBzP) |
| Tris(2-chloroethyl) phosphate (TCEP) | Bis(2-chloroethyl) phosphate (BCEtP) |
| Tri-o-cresyl phosphate (ToCP) | Di-o-cresyl phosphate (DoCP) |
| Non-PBDE-brominated flame retardant | |
| 2-Ethylhexyl 2,3,4,5-tetrabromobenzoate (EH-TBB) | 2,3,4,5-Tetrabromobenzoic acid (TBBA) |
| Parent Chemical | Biomarker in Serum |
|
| |
| Polybromianted Diphenyl Ethers (PBDEs) | |
| 2,2’,4-tribromodiphenyl ether (BDE-17) | BDE-17 |
| 2,4,4’-tribromodiphenyl ether (BDE-28) | BDE-28 |
| 2,2’,4,4’-tetrabromodiphenyl ether (BDE-47) | BDE-47 |
| 2,3’,4,4’-tetrabromodiphenyl ether (BDE-66) | BDE-66 |
| 2,2’,3,4,4’-pentabromodiphenyl ether (BDE-85) | BDE-85 |
| 2,2’,4,4’,5-pentabromodiphenyl ether (BDE-99) | BDE-99 |
| 2,2’,4,4’,6-pentabromodiphenyl ether (BDE-100) | BDE-100 |
| 2,2’,4,4’,5,5’-hexabromodiphenyl ether (BDE-153) | BDE-153 |
| 2,2’,4,4’,5,6’-hexabromodiphenyl ether (BDE-154) | BDE-154 |
| 2,2’,3,4,4’,5’,6-heptabromodiphenyl ether (BDE-183) | BDE-183 |
| 2,2’,3,3’,4,4’,5,5’,6-nonabromodiphenyl ether (BDE-206) | BDE-206 |
| decabromodiphenyl ether (BDE-209) | BDE-209 |
Other examples of parent compounds for this biomarker: Isopropylphenyl diphenyl phosphate, t-Butylphenyl diphenyl phosphate, and EH-DPhP
2.2. Urine Sampling and Analysis
The urine sampling design was described previously(37). Briefly, each worker provided two spot urine samples over two days (pre-shift on the first day and post-shift on the following day). The timing of urine collection was chosen to best determine biomarker differences over two days and to compare to chemical concentrations from two days of air sampling. All participants provided a minimum of 60 milliliters (mL) of urine for each collection.
Following collection, samples were kept in coolers with ice for up to four hours, aliquoted into 10 mL polypropylene vials, and stored at or below −20°C. Specific gravity (SG) was measured in the field with a Master Refractometer (Master-SUR/Nα, Atago, Tokyo, Japan). Urine samples were shipped overnight on dry ice to the CDC Environmental Health Laboratory, and stored at or below −40°C until analysis. After enzymatic hydrolysis of 400-microliters (μL) urine samples and off-line solid phase extraction, the nine target metabolites were separated via reversed phase high-performance liquid chromatography, and detected by isotope dilution-electrospray ionization tandem mass spectrometry(29). Quality control was conducted by repeat analysis of two in-house pools whose target concentrations and confidence limits were previously determined for each metabolite of interest. Creatinine was measured at CDC in spot urine samples using an enzymatic method with a Roche/Hitachi Cobas® c501 chemical analyzer (Roche Diagnostics, Inc., Indianapolis, IN). This study reports specific gravity (SG) adjusted concentrations in the main text, with unadjusted and creatinine-adjusted concentrations in Supplemental Materials to enable comparisons between industries and the U.S. general population.
2.3. Blood Sampling and Analysis
Two blood samples were collected at the same time as the urine samples in two red top collection tubes, and samples were placed in a rack to clot for two hours at room temperature. They were then centrifuged for 15 minutes at 2400 RPM. Using a transfer pipette in the field, serum was aliquoted from the red-top tube into a separate ½ oz glass jar for serum lipid analysis. Lipids were determined using commercially available test kits from Roche Diagnostics Corp (Indianapolis, IN) for the quantitative determination of total triglycerides (Product No. 011002803-0600) and total cholesterol (Product No. 011573303-0600). Blood collection tubes were stored in the freezer (−20°C) until shipment for analysis.
Serum samples were analyzed at CDC for a panel of 12 PBDEs by gas chromatography isotope dilution high resolution mass spectrometry as previously detailed(9,41). Quality control included analysis of three blank and three quality control samples in every set of 30 samples and subtracting any results found in the blanks. PBDE concentrations were adjusted for lipids before statistical analyses.
2.4. Statistical Analysis
Summary statistics were displayed as frequency (%), mean ± standard deviation (SD), median, and range for worker characteristics. The total number of samples (N), percentage of concentrations above the limit of detection (LOD), geometric mean (GM), and geometric standard deviation (GSD) were provided for urinary and serum concentrations by industry. In calculating the descriptive statistics, values assigned to non-detectable concentrations were imputed using LOD divided by square root of two(42–43). Likewise, the National Health and Nutrition Examination Survey (NHANES) data, which were compared with the industrial data, were imputed the same way. Because of long half lives in the body for the PBDEs (e.g., 15 days to 4 years) detected in serum(9,11), concentrations in the two serum samples results were averaged. Urinary pre- and post-shift concentrations and averaged serum concentrations were log transformed because corresponding distributions were right-skewed and log-normal.
A paired t-test was carried out to examine differences between specific gravity (SG) adjusted urinary concentrations for pre-shift day one and post-shift day two. Multiple comparisons were conducted to determine significant differences (p-value < 0.05) among industries of urinary pre-shift and post-shift biomarker concentrations and averaged serum biomarker concentrations. Spearman correlation coefficients for time-weighted average (TWA) air (ng/m3) and hand wipe post-shift (μg/sample) samples, and for SG-adjusted urinary post-shift concentration (ng/mL) by industry were also calculated. Note that the TWA method only applied to the air samples. Welch’s t-test was used to determine differences in unadjusted and creatinine-adjusted urinary concentrations of target biomarkers (shown in Supplemental Materials) between individual industries and the U.S. general population from NHANES 2015-2016 for unweighted urine biomarkers(44). For serum data, median values from the general population from NHANES are provided(45). NHANES data were limited to participants aged 18 and older for urine concentrations and 20 and older for serum concentrations.
A mixed model with industry as a random effect was utilized to account for the statistical correlation among participants from the same industry. The model incorporated the use of maximum likelihood estimation method to reduce bias resulting from the data in the presence of non-detectable biomarker concentrations(46). Univariable and multivariable analyses were carried out using the log-transformed, SG-adjusted urinary post-shift biomarker concentrations (ng/mL) and averaged serum biomarker concentrations (ng/g lipid) as the dependent variables, while adjusting for industry. Logarithmic urinary creatinine level (mg/dL) was also adjusted for in the urinary models in Supplemental Materials(47). Note that we only analyzed the biomarkers or analytes detected in greater than 50% of samples. Covariates treated as fixed effects were evaluated: air and hand wipe concentrations, age, BMI, length of working time, and hand washing practices. A multivariate regression model was conducted using covariates that had p-values ≤ 0.2. A stepwise selection approach was implemented, in which the covariates were entered one at a time into the model until all remaining variables had the greatest impact. All analyses were performed in SAS version 9.4 (SAS Institute, Cary, NC).
3. RESULTS
3.1. Demographics
One hundred eleven workers from 18 companies consisting of eight industries consented to participate in the study. Eight of these participants were excluded because of missing urine or blood samples, resulting in 103 participants. Characteristics of the 103 participants are provided in Table 2. Air and hand wipe samples were only analyzed for select analytes expected in the worker’s industry, as reported previously(27).
Table 2.
Characteristics of Study Participants, N=103 (2015-2017).
| Characteristic | Frequency (%) |
|---|---|
| Gender | |
| Male | 79 (76.7) |
| Female | 24 (23.3) |
| Age, years | Mean ± SD = 35.1 ± 11.2; Median = 34.0; Range = 18.0 – 64.0 |
| Race | |
| White | 79 (76.7) |
| Black | 6 (5.8) |
| Asian | 12 (11.7) |
| Other | 6 (5.8) |
| Ethnicity | |
| Hispanic or Latino | 6 (5.8) |
| Not Hispanic or Latino | 97 (94.2) |
| Creatinine*, mg/dL | Mean ± SD = 186.7 ± 102.9; Median = 169.8; Range = 7.2 – 653.5 |
| Specific gravity (SG), μg/L | Mean ± SD = 1.023 ± 0.007; Median = 1.024; Range = 1.004 – 1.038 |
| BMI, kg/m2 | Mean ± SD = 26.8 ± 5.3; Median = 25.1; Range = 18.9 – 43.0 |
| Length of working time, years | Mean ± SD = 4.4 ± 4.9; Median = 2.5; Range = 0.005 – 23.0 |
| Hand washed** | |
| No | 29 (28.2) |
| Yes | 73 (70.9) |
| Missing | 1 (1.0) |
| Glove worn | |
| No | 30 (29.1) |
| Intermittent | 40 (38.8) |
| Yes | 33 (32.0) |
| Nails polished last week | |
| No | 98 (95.2) |
| Yes | 5 (4.9) |
| Industry (no. of companies) | |
| Chemical Manufacturing (1) | 10 (9.7) |
| Electronic Scrap (2) | 19 (18.5) |
| Foam Manufacturing (2) | 11 (10.7) |
| Gymnastics Schools (1) | 9 (8.7) |
| Install Rigid Board (1) | 3 (2.9) |
| Nail Salons (4) | 12 (11.7) |
| Roofing (1) | 10 (9.7) |
| Spray Polyurethane (6) | 29 (28.2) |
Analyzed from spot urine samples
Workers were asked if they washed their hands since the beginning of their shift.
3.2. Urine Results
Summary and statistical testing results of specific gravity (SG) adjusted urine metabolite concentrations (ng/mL) are provided in Table 3 and Figure 1 (see Supplemental Table S1 and Figure S1 for unadjusted urine metabolite concentrations (ng/mL) and Supplemental Table S2 and Figure S2 for creatinine-adjusted concentrations (μg/g creatinine)). Because some of the participants worked outside on hot days (90°F+) which impacted their urinary creatinine levels, results that have been adjusted for SG could be less affected by hot environments or other factors. However, NHANES does not provide SG-adjusted results so comparisons to the U.S. general population were made using unadjusted and creatinine-adjusted concentrations as shown in Supplemental Materials.
Table 3.
OPE urine metabolite concentrations adjusted for specific gravity (SG) (ng/mL) by industry (2015-2017)*.
| Pre-Shift Concentration (ng/mL) | Post-Shift Concentration (ng/mL) | |||||||||
|---|---|---|---|---|---|---|---|---|---|---|
|
| ||||||||||
| Analyte | Industry | N | % > LOD† | GM (GSD) | Multiple Comparisons‡ | N | % > LOD† | GM (GSD) | Multiple Comparisons‡ | P-value#(Pre vs Post) |
| DPhP | Overall | 102 | 93 | 1.84 (3.14) | 102 | 99 | 3.07 (3.19) | |||
| Chemical Mfg. (C) | 10 | 100 | 17.4 (2.20) | 10 | 100 | 27.3 (2.06) | 0.183 | |||
| Roofing (R) | 9 | 100 | 2.64 (1.86) | C-R | 10 | 100 | 6.07 (1.97) | C-R | 0.020 | |
| Gymnastics (G) | 9 | 100 | 2.43 (1.25) | C-G | 9 | 100 | 2.66 (1.87) | C-G | 0.614 | |
| Electronic Scrap (E) | 19 | 95 | 1.40 (2.72) | C-E | 19 | 100 | 1.96 (1.85) | C-E, R-E, F-E | 0.046 | |
| Spray Poly. (S) | 29 | 97 | 1.32 (2.38) | C-S | 29 | 97 | 2.04 (2.07) | C-S, R-S, F-S | 0.010 | |
| Foam Mfg. (F) | 11 | 91 | 1.28 (3.35) | C-F | 10 | 100 | 5.16 (4.22) | C-F | 0.023 | |
| Nail Salon (N) | 12 | 75 | 1.03 (1.90) | C-N | 12 | 100 | 1.70 (2.15) | C-N, R-N, F-N | 0.010 | |
| Rigid Board (B) | 3 | 67 | 0.86 (2.16) | C-B | 3 | 100 | 0.57 (1.47) | C-B, R-B, F-B | 0.372 | |
|
| ||||||||||
| BDCPP | Overall | 103 | 96 | 3.45 (3.51) | 103 | 97 | 3.83 (4.19) | |||
| Chemical Mfg. | 10 | 100 | 19.9 (2.63) | 10 | 100 | 25.5 (3.03) | 0.471 | |||
| Roofing | 10 | 100 | 7.61 (1.85) | 10 | 100 | 10.9 (2.03) | 0.076 | |||
| Spray Poly. | 29 | 100 | 4.63 (2.56) | C-S | 29 | 100 | 6.08 (2.52) | C-S | 0.043 | |
| Gymnastics | 9 | 100 | 4.61 (1.78) | C-G | 9 | 100 | 5.28 (2.27) | C-G | 0.580 | |
| Electronic Scrap | 19 | 95 | 2.06 (3.21) | C-E, R-E | 19 | 100 | 2.22 (3.11) | C-E, R-E, S-E | 0.591 | |
| Foam Mfg. | 11 | 100 | 2.00 (2.14) | C-F, R-F | 11 | 100 | 2.29 (1.91) | C-F, R-F | 0.417 | |
| Rigid Board | 3 | 67 | 1.25 (3.82) | C-B | 3 | 67 | 0.55 (4.64) | C-B, R-B, S-B, G-B | 0.020 | |
| Nail Salon | 12 | 83 | 0.78 (2.58) | C-N, R-N, S-N, G-N | 12 | 83 | 0.52 (2.71) | C-N, R-N, S-N, G-N, F-N, E-N | 0.007 | |
|
| ||||||||||
| BCPP | Overall | 103 | 89 | 1.69 (8.51) | 103 | 91 | 3.04 (12.7) | |||
| Spray Poly. | 29 | 100 | 28.9 (4.49) | 29 | 100 | 76.4 (4.05) | <0.001 | |||
| Chemical Mfg. | 10 | 100 | 2.65 (1.94) | S-C | 10 | 100 | 4.28 (3.34) | S-C | 0.190 | |
| Roofing | 10 | 100 | 1.00 (1.72) | S-R | 10 | 100 | 4.42 (1.75) | S-R | <0.001 | |
| Foam Mfg. | 11 | 100 | 0.73 (2.02) | S-F | 11 | 100 | 4.03 (2.32) | S-F | <0.001 | |
| Electronic Scrap | 19 | 74 | 0.34 (2.55) | S-E, C-E | 19 | 89 | 0.33 (2.54) | S-E, R-E, C-E, F-E | 0.784 | |
| Gymnastics | 9 | 100 | 0.32 (2.05) | S-G, C-G | 9 | 78 | 0.28 (1.74) | S-G, R-G, C-G, F-G | 0.626 | |
| Nail Salon | 12 | 58 | 0.28 (1.71) | S-N, C-N | 12 | 67 | 0.23 (1.78) | S-N, R-N, C-N, F-N | 0.246 | |
| Rigid Board | 3 | 67 | 0.26 (1.39) | S-B, C-B | 3 | 67 | 0.14 (1.60) | S-B, R-B, C-B, F-B | 0.242 | |
|
| ||||||||||
| DBuP | Overall | 103 | 88 | 0.31 (3.72) | 103 | 93 | 0.45 (4.57) | |||
| Chemical Mfg. | 10 | 100 | 2.31 (2.65) | 10 | 100 | 5.91 (2.40) | 0.013 | |||
| Rigid Board | 3 | 100 | 0.44 (1.60) | 3 | 100 | 0.29 (1.27) | C-B | 0.369 | ||
| Gymnastics | 9 | 100 | 0.40 (2.35) | C-G | 9 | 100 | 0.38 (1.55) | C-G | 0.762 | |
| Foam Mfg. | 11 | 91 | 0.35 (3.17) | C-F | 11 | 100 | 0.47 (1.84) | C-F | 0.453 | |
| Roofing | 10 | 100 | 0.31 (2.00) | C-R | 10 | 100 | 0.42 (1.51) | C-R | 0.086 | |
| Spray Poly. | 29 | 86 | 0.24 (4.51) | C-S | 29 | 86 | 0.52 (6.27) | C-S | 0.002 | |
| Nail Salon | 12 | 75 | 0.21 (2.12) | C-N | 12 | 92 | 0.21 (2.28) | C-N | 0.990 | |
| Electronic Scrap | 19 | 79 | 0.15 (2.73) | C-E | 19 | 89 | 0.18 (3.55) | C-E | 0.562 | |
|
| ||||||||||
| BCEtP | Overall | 103 | 95 | 0.72 (2.62) | 103 | 96 | 0.75 (2.85) | |||
| Roofing | 10 | 100 | 1.16 (2.14) | 10 | 100 | 1.05 (1.97) | 0.649 | |||
| Gymnastics | 9 | 100 | 0.97 (1.82) | 9 | 100 | 0.68 (2.09) | 0.016 | |||
| Electronic Scrap | 19 | 95 | 0.80 (2.58) | 19 | 100 | 1.02 (2.07) | 0.170 | |||
| Spray Poly. | 29 | 90 | 0.79 (3.08) | 29 | 93 | 1.01 (3.26) | 0.272 | |||
| Rigid Board | 3 | 100 | 0.77 (3.15) | 3 | 100 | 0.36 (3.01) | 0.390 | |||
| Foam Mfg. | 11 | 100 | 0.56 (2.77) | 11 | 91 | 0.53 (5.39) | 0.891 | |||
| Nail Salon | 12 | 92 | 0.51 (2.13) | 12 | 92 | 0.46 (2.10) | 0.442 | |||
| Chemical Mfg. | 10 | 100 | 0.44 (2.47) | 10 | 100 | 0.48 (2.13) | 0.766 | |||
|
| ||||||||||
| DpCP | Overall | 103 | 31 | 0.08 (3.84) | 103 | 27 | 0.08 (4.59) | |||
| Chemical Mfg. | 10 | 100 | 2.89 (3.11) | 10 | 100 | 4.74 (3.32) | 0.185 | |||
| Roofing | 10 | 60 | 0.07 (2.27) | C-R | 10 | 60 | 0.08 (2.57) | C-R | 0.225 | |
| Electronic Scrap | 19 | 16 | 0.05 (2.00) | C-E | 19 | 11 | 0.04 (1.61) | C-E | 0.047 | |
| Spray Poly. | 29 | 31 | 0.05 (1.52) | C-S | 29 | 21 | 0.05 (1.75) | C-S | 0.481 | |
| Gymnastics | 9 | 33 | 0.05 (1.44) | C-G | 9 | 33 | 0.07 (1.93) | C-G | 0.278 | |
| Foam Mfg. | 11 | 9 | 0.04 | 11 | 9 | 0.04 | - | |||
| Rigid Board | 3 | 0 | - | 3 | 0 | - | - | |||
| Nail Salon | 12 | 0 | - | 12 | 0 | - | - | |||
|
| ||||||||||
| TBBA | Overall | 103 | 10 | 0.05 (2.08) | 103 | 17 | 0.05 (2.39) | |||
| Spray Poly. | 29 | 24 | 0.07 (2.66) | 29 | 38 | 0.09 (3.49) | 0.078 | |||
| Electronic Scrap | 19 | 5 | 0.05 | 19 | 5 | 0.04 | ||||
| Gymnastics | 9 | 11 | 0.04 | 9 | 44 | 0.07 (1.92) | ||||
| Roofing | 10 | 10 | 0.03 | 10 | 10 | 0.03 | ||||
| Chemical Mfg. | 10 | 0 | - | 10 | 0 | - | ||||
| Foam Mfg. | 11 | 0 | - | 11 | 9 | 0.04 | ||||
| Rigid Board | 3 | 0 | - | 3 | 0 | - | ||||
| Nail Salon | 12 | 0 | - | 12 | 0 | - | ||||
Analytes DBzP and DoCP not listed due to all samples being below limit of detection.
Limit of detection (LOD) for each analyte in ng/mL: DPhP=0.16, BDCPP=0.11, BCPP=0.10, DBuP=0.05, BCEtP=0.08, DpCP=0.05, TBBA=0.05, DBzP=0.05, DoCP=0.05.
Only significant differences in means of log-concentrations are listed.
A one-sample Student’s t-test was utilized to examine differences of logarithm urine pre- and post-shift concentrations.
The abbreviations in the Multiple Comparisons are: Chemical Manufacturing (C), Electronic Scrap (E), Foam Manufacturing (F), Gymnastics (G), Nail Salon (N), Rigid Board Installation (B), Roofing (R), and Spray Polyurethane (S). If the means of log-concentrations for two industries were significantly different, the comparison of the two industries would be presented in the table. For example, “C-E” means that the mean of log-concentrations for chemical manufacturing was significantly different from electronic scrap.
Figure 1.
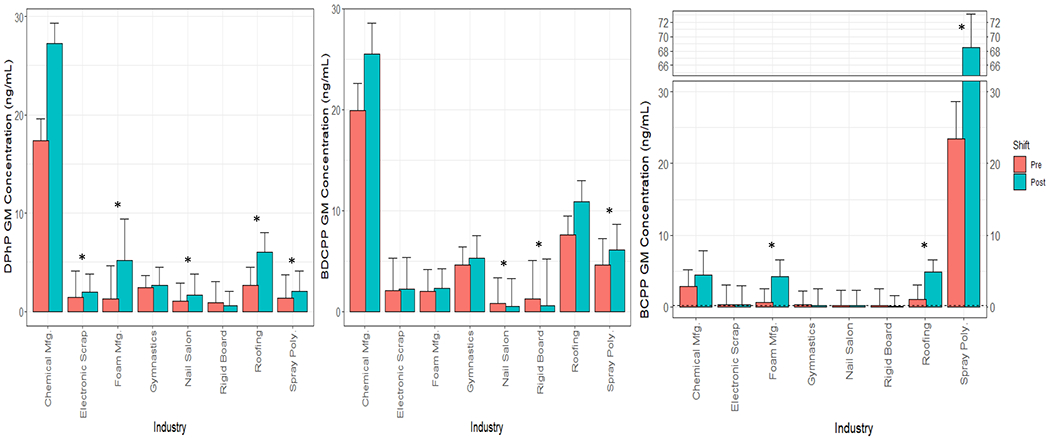
Specific gravity (SG) adjusted urinary geometric mean (GM) concentrations and corresponding geometric standard deviations of DPhP, BDCPP, and BCPP (ng/mL) by industry. Asterisks (*) represent the significant mean differences between pre- and post-shift concentrations by industry and analyte.
Sixty-three (61%) of the participants worked the previous day while 34 participants’ (32%) last shift worked was 3 or more days before. Pre-shift SG-adjusted and creatinine-adjusted urinary concentrations were statistically higher for workers who worked “yesterday” compared to those who last worked “3 or 4 days ago” for BCPP (See Supplemental Tables S3 and S4).
In general, concentrations of OPE metabolites, with the exception of bis(1,3-dichloro-2-propyl) phosphate (BDCPP) increased from pre-shift to post-shift across many industries. BDCPP worker SG-adjusted urinary concentrations from only spray polyurethane foam application increased statistically from pre- to post-shift. For many of the OPEs, both pre- and post-shift unadjusted and creatinine-adjusted levels were orders of magnitude higher than the general populations, likely due to the long half-life (54 days) of BDCPP.
Diphenyl phosphate (DPhP) urinary pre- and post-shift SG-adjusted concentrations in chemical manufacturing workers were significantly higher (p-values <0.001) than those from other industries. Urinary post-shift SG-adjusted GM concentrations of DPhP were significantly higher than pre-shift GM concentrations among roofing, foam manufacturing, spray polyurethane foam, electronic scrap, and nail salon workers. DPhP urinary pre- and post-shift unadjusted and creatinine-adjusted GM concentrations in chemical manufacturing (p-values < 0.001) were significantly higher than the concentrations reported in the U.S. general population(44). In addition, compared to the concentrations reported in the U.S. general population, roofing and foam manufacturing workers had significantly higher DPhP post-shift unadjusted and creatinine-adjusted GM concentrations (all p-values ≤ 0.012).
Chemical manufacturing workers’ BDCPP pre- and post-shift SG-adjusted urinary concentrations were 2.3 - 49 times higher than those of the other industries. Compared to the U.S. general population, chemical manufacturing, roofing, gymnastics instructors, and spray polyurethane foam workers had significantly higher BDCPP pre- and post-shift unadjusted and creatinine-adjusted GM concentrations (all p-values ≤ 0.014).
Bis(1-chloro-2-propyl) phosphate (BCPP) urinary pre- and post-shift SG-adjusted concentrations for spray polyurethane foam workers were notably higher than those for all other industries. Post-shift GM concentrations of BCPP collected from spray polyurethane foam, roofing, and foam manufacturing workers were significantly higher than pre-shift concentrations. Spray polyurethane foam, chemical manufacturing, roofing, and foam manufacturing workers had significantly greater BCPP pre- and post-shift unadjusted and creatinine-adjusted GM concentrations relative to the U.S. general population (all p-values < 0.001).
Dibutyl phosphate (DBuP) pre- and post-shift SG-adjusted concentrations for chemical manufacturing workers were higher than those for all other industries. Post-shift SG-adjusted GM concentrations of DBuP collected from chemical manufacturing and spray polyurethane foam workers were significantly greater than pre-shift GM concentrations (both p-values ≤ 0.013). Chemical manufacturing, gymnastics instructors, and foam manufacturing workers had higher pre- and post-shift GM unadjusted and creatinine-adjusted concentrations than the U.S. general population (p-values ≤ 0.042), while roofing and spray polyurethane foam workers had higher post-shift unadjusted and creatinine-adjusted GM concentrations (p-value ≤ 0.03).
Di-p-cresyl phosphate (DpCP) urinary concentrations were detected in fewer than 50% of samples, but DpCP was detected in 100% of urine samples collected from chemical manufacturing workers and 60% of urine samples collected from roofers (LOD 0.05 ng/mL). 2,3,4,5-Tetrabromobenzoic acid (TBBA) urinary concentrations were detected in fewer than 50% of samples. Concentrations of other urinary biomarkers, dibenzyl phosphate (DBzP) and di-o-cresyl phosphate (DoCP), were all below the LOD of 0.05 ng/mL and will not be discussed further.
The results of the multivariable analysis results using urinary SG-adjusted concentrations are shown in Table 4 (see Supplemental Table S5 for results of univariable analyses). SG-adjusted results were used in these analyses because they may be less impacted by heat, as previously stated. We also included univariable and multivariable analysis results using urinary creatinine-adjusted concentrations in Supplemental Tables S6 and S7, accordingly. Both TCPP TWA air and hand wipe post-shift concentrations were positively associated with BCPP urine post-shift SG-adjusted concentration (p-values = 0.016 and 0.013, respectively). In addition, TPhP hand wipe post-shift concentrations were positively and significantly associated with DPhP urine post-shift SG-adjusted concentration when adjusting for TPhP TWA air concentrations in the model (p-value = 0.036). Note that we excluded DBuP from univariable analyses because air or hand wipe samples were not analyzed for TBuP.
Table 4.
Multivariable analysis results using log-transformed, specific gravity-adjusted OPE urinary post-shift concentration (ng/mL) as the outcome or dependent variable. Industry was adjusted for in the analyses.
| Urinary Outcome (N) | Covariate or Independent Variable | N of Air or Hand Wipe Samples | Estimate (SE) | P-value | Factor † |
|---|---|---|---|---|---|
| DPhP (N=102) | Time-weighted average (TWA) air concentration, ng/m3 * | 66 | 0.12 (0.10) | 0.289 | 1.12 |
| Hand wipe post concentration, μg/sample * | 51 | 1.2×10⁻⁴ (4×10⁻⁵) | 0.036 | 1.00012 | |
| BDCPP (N=103) | Time-weighted average (TWA) air concentration, ng/m3 * | 91 | 0.38 (0.18) | 0.096 | 1.46 |
| Hand wipe post concentration, μg/sample * | 76 | 6×10⁻⁶ (3×10⁻⁶) | 0.151 | 1.00001 | |
| BCPP (N=103) | Time-weighted average (TWA) air concentration, ng/m3 * | 91 | 0.005 (0.001) | 0.016 | 1.005 |
| Hand wipe post concentration, μg/sample * | 90 | 7×10⁻⁶ (2×10⁻⁶) | 0.013 | 1.00001 |
Air and hand wipe environmental measures are for the relevant parent chemical as shown in Table 1. TPhP was compared to DPhP, TDCPP was compared to BDCPP, and TCPP was compared to BCPP.
Exponent of the estimate. E.g., Interpretation of the factor=1.12 is that for every increment that, after adjusting for industry, if TWA air concentration increases by one ng/m3, DPhP increases by 1.12 ng/mL.
Correlation coefficients (r) were calculated overall and by industry group to determine the correlations of TWA air and hand wipe post-shift parent compound concentrations to SG-adjusted concentrations of DPhP, BDCPP, and BCPP, respectively. Significant correlations were found between hand wipe TPhP and DPhP in gymnastic instructors, hand wipe TDCPP and BDCPP in chemical manufacturing workers and gymnastic instructors, and hand wipe TCPP and BCPP in chemical manufacturing and roofing workers (Table 5; see Supplemental Table S8 for unadjusted and creatinine-adjusted urinary concentrations).
Table 5.
Spearman correlation coefficients (r) for time-weighted average (TWA) air (ng/m3) and hand wipe post (μg/sample) samples, and specific gravity-adjusted OPE urinary post-shift concentration (ng/mL).
| SG-Adjusted | DPhP | BDCPP | BCPP | ||||||||||||
|---|---|---|---|---|---|---|---|---|---|---|---|---|---|---|---|
|
| |||||||||||||||
| Air TPhP | Hand TPhP | Air TDCPP | Hand TDCPP | Air TCPP | Hand TCPP | ||||||||||
|
| |||||||||||||||
| Industry | N | Coeff. | P-value§ | Coeff. | P-value§ | N | Coeff. | P-value§ | Coeff. | P-value§ | N | Coeff. | P-value§ | Coeff. | P-value§ |
| Chemical Mfg. | 5 | 0.700 | 0.188 | 0.200 | 0.747 | 10 | 0.479 | 0.162 | 0.794 | 0.006 | 10 | 0.576 | 0.082 | 0.697 | 0.025 |
| Electronic Scrap | 19 | 0.063 | 0.797 | 0.279 | 0.248 | 19 | −0.079 | 0.748 | 0.300 | 0.211 | 19 | 0.032 | 0.898 | 0.393 | 0.096 |
| Foam Mfg. | 0 | 11 | −0.418 | 0.201 | 0.219 | 0.517 | 11 | 0.164 | 0.631 | −0.100 | 0.770 | ||||
| Gymnastics | 9 | 0.400 | 0.286 | 0.917 | <.001 | 9 | −0.033 | 0.932 | 0.717 | 0.030 | 9 | 0.117 | 0.765 | −0.542 | 0.131 |
| Nail Salon | 12* | −0.308 | 0.331 | 0.245 | 0.467 | 0 | 0 | ||||||||
| Roofing | 0 | 10 | 0.176 | 0.627 | 0.248 | 0.489 | 10 | 0.127 | 0.726 | 0.879 | <.001 | ||||
| Spray Poly. | 21† | −0.362 | 0.107 | 0.464 | 0.294 | 29‡ | 0.220 | 0.251 | 0.250 | 0.369 | 29 | 0.227 | 0.237 | 0.170 | 0.378 |
| Overall | 66 | 0.179 | 0.151 | 0.410 | 0.003 | 88 | 0.360 | <.001 | 0.661 | <.001 | 88 | 0.892 | <.001 | 0.828 | <.001 |
N=12, except for hand wipe post TPhP where N=11.
N=21, except for hand wipe post TPhP where N = 7.
N=29, except for hand wipe post TDCPP where N=15.
Red p-values are significantly different from correlation coefficient equal to zero.
3.3. Blood Results
All workers were asked to provide blood samples but could participate in the study without providing them. As a result, serum sampling results were evaluated for 91 participants (Table 6 and Figure 2). Figure 2 shows PBDE results by industry; data for BDE-17 and −66 with relatively low detection frequency (both 12%) are provided in Supplemental Table S9. Electronic scrap workers had greater median serum concentrations than those in the U.S. general population for BDE-183 (0.55 vs. 0.21 ng/g lipid) and −209 (2.97 vs. 1.79 ng/g lipid); their levels were also significantly greater compared to most of the other industries evaluated in this study.
Table 6.
PBDEs average of geometric mean (GM) serum concentrations (ng/g lipid) by industry (2015-2017).
| Analyte | Industry | N | % > LOD* | GM (ng/g lipid) (GSD) | Median (ng/g lipid) | Multiple Comparisons of Industries† |
|---|---|---|---|---|---|---|
| BDE-28 | Overall | 91 | 90.1 | 0.46 (2.20) | 0.43 | |
| Electronic Scrap | 18 | 94.4 | 0.81 (2.23) | 0.85 | ||
| Roofing | 10 | 100.0 | 0.53 (2.39) | 0.57 | ||
| Gymnastics | 9 | 88.9 | 0.47 (2.00) | 0.49 | ||
| Nail Salon | 8 | 100.0 | 0.43 (1.63) | 0.44 | ||
| Spray Poly. | 24 | 87.5 | 0.41 (2.11) | 0.35 | ||
| Chemical Mfg. | 10 | 90.0 | 0.39 (1.55) | 0.41 | ||
| Foam Mfg. | 9 | 77.8 | 0.28 (2.45) | 0.24 | E – F | |
| Rigid Board | 3 | 66.7 | 0.17 (1.28) | 0.17 | E – B | |
| NHANES ‡ | 1637 | 89.1 | 0.74 | |||
|
| ||||||
| BDE-47 | Overall | 91 | 100.0 | 7.71 (2.66) | 7.20 | |
| Electronic Scrap | 18 | 100.0 | 12.25 (2.72) | 13.05 | ||
| Gymnastics | 9 | 100.0 | 11.24 (2.18) | 13.31 | ||
| Roofing | 10 | 100.0 | 10.20 (2.50) | 10.05 | ||
| Spray Poly. | 24 | 100.0 | 7.26 (2.80) | 6.36 | ||
| Chemical Mfg. | 10 | 100.0 | 6.64 (1.88) | 8.25 | ||
| Nail Salon | 8 | 100.0 | 5.84 (1.73) | 6.25 | ||
| Foam Mfg. | 9 | 100.0 | 4.20 (3.25) | 2.40 | ||
| Rigid Board | 3 | 100.0 | 2.11 (1.40) | 2.51 | ||
| NHANES ‡ | 1637 | 100.0 | 12.99 | |||
|
| ||||||
| BDE-85 | Overall | 91 | 47.3 | 0.22 (1.91) | 0.19 | |
| Gymnastics | 9 | 77.8 | 0.36 (1.88) | 0.43 | ||
| Electronic Scrap | 18 | 61.1 | 0.25 (2.38) | 0.21 | ||
| Roofing | 10 | 40.0 | 0.24 (1.54) | 0.24 | ||
| Spray Poly. | 24 | 37.5 | 0.23 (1.90) | 0.19 | ||
| Chemical Mfg. | 10 | 90.0 | 0.22 (1.41) | 0.23 | ||
| Nail Salon | 8 | 12.5 | 0.15 (1.24) | 0.15 | ||
| Foam Mfg. | 9 | 22.2 | 0.14 (1.69) | 0.12 | ||
| Rigid Board | 3 | 0.0 | ||||
| NHANES ‡ | 1637 | 32.8 | 0.17 | |||
|
| ||||||
| BDE-99 | Overall | 91 | 100.0 | 1.53 (2.66) | 1.43 | |
| Gymnastics | 9 | 100.0 | 2.97 (2.32) | 4.17 | ||
| Electronic Scrap | 18 | 100.0 | 2.15 (3.07) | 1.80 | ||
| Roofing | 10 | 100.0 | 1.81 (2.41) | 2.00 | ||
| Chemical Mfg. | 10 | 100.0 | 1.64 (2.09) | 1.80 | ||
| Spray Poly. | 24 | 100.0 | 1.37 (2.48) | 1.23 | ||
| Nail Salon | 8 | 100.0 | 1.23 (1.60) | 1.13 | ||
| Foam Mfg. | 9 | 100.0 | 0.82 (2.68) | 0.48 | ||
| Rigid Board | 3 | 100.0 | 0.32 (1.93) | 0.34 | G – B, E – B | |
| NHANES ‡ | 1637 | 100.0 | 2.45 | |||
|
| ||||||
| BDE-100 | Overall | 91 | 100.0 | 1.70 (2.55) | 1.74 | |
| Gymnastics | 9 | 100.0 | 2.60 (2.08) | 3.30 | ||
| Electronic Scrap | 18 | 100.0 | 2.13 (2.27) | 2.08 | ||
| Roofing | 10 | 100.0 | 1.87 (2.48) | 2.06 | ||
| Chemical Mfg. | 10 | 100.0 | 1.77 (1.98) | 2.00 | ||
| Spray Poly. | 24 | 100.0 | 1.74 (2.96) | 1.57 | ||
| Nail Salon | 8 | 100.0 | 1.29 (1.83) | 1.48 | ||
| Foam Mfg. | 9 | 100.0 | 1.04 (3.56) | 0.90 | ||
| Rigid Board | 3 | 100.0 | 0.54 (1.20) | 0.58 | ||
| NHANES ‡ | 1637 | 100.0 | 2.61 | |||
|
| ||||||
| BDE-153 | Overall | 91 | 100.0 | 7.22 (2.76) | 6.14 | |
| Spray Poly. | 24 | 100.0 | 10.47 (2.51) | 8.17 | ||
| Roofing | 10 | 100.0 | 10.34 (2.80) | 6.72 | ||
| Gymnastics | 9 | 100.0 | 10.33 (2.58) | 9.25 | ||
| Rigid Board | 3 | 100.0 | 7.99 (2.07) | 6.14 | ||
| Chemical Mfg. | 10 | 100.0 | 7.06 (3.20) | 5.36 | ||
| Electronic Scrap | 18 | 100.0 | 5.65 (2.59) | 4.94 | ||
| Foam Mfg. | 9 | 100.0 | 5.35 (2.67) | 4.15 | ||
| Nail Salon | 8 | 100.0 | 2.43 (1.91) | 2.11 | S – N, R – N, G – N | |
| NHANES ‡ | 1637 | 100.0 | 9.73 | |||
|
| ||||||
| BDE-154 | Overall | 91 | 49.5 | 0.21 (1.85) | 0.17 | |
| Gymnastics | 9 | 77.8 | 0.32 (1.84) | 0.39 | ||
| Electronic Scrap | 18 | 61.1 | 0.24 (2.09) | 0.23 | ||
| Chemical Mfg. | 10 | 90.0 | 0.22 (1.48) | 0.22 | ||
| Spray Poly. | 24 | 33.3 | 0.22 (1.96) | 0.17 | ||
| Roofing | 10 | 30.0 | 0.21 (1.47) | 0.19 | ||
| Foam Mfg. | 9 | 44.4 | 0.16 (1.87) | 0.12 | ||
| Nail Salon | 8 | 37.5 | 0.15 (1.34) | 0.14 | ||
| Rigid Board | 3 | 0.0 | ||||
| NHANES ‡ | 1637 | 51.9 | 0.14 | |||
|
| ||||||
| BDE-183 | Overall | 91 | 51.6 | 0.22 (2.20) | 0.17 | |
| Electronic Scrap | 18 | 94.4 | 0.50 (2.44) | 0.55 | ||
| Foam Mfg. | 9 | 55.6 | 0.24 (2.41) | 0.19 | ||
| Spray Poly. | 24 | 50.0 | 0.22 (2.05) | 0.18 | E – S | |
| Roofing | 10 | 40.0 | 0.20 (1.51) | 0.19 | E – R | |
| Gymnastics | 9 | 33.3 | 0.15 (1.45) | 0.13 | E – G | |
| Chemical Mfg. | 10 | 40.0 | 0.14 (1.86) | 0.10 | E – C | |
| Rigid Board | 3 | 33.3 | 0.13 (1.35) | 0.13 | E – B | |
| Nail Salon | 8 | 12.5 | 0.13 (1.12) | 0.14 | E – N | |
| NHANES ‡ | 1637 | 15.9 | 0.21 | |||
|
| ||||||
| BDE-209 | Overall | 91 | 95.6 | 1.79 (1.86) | 1.73 | |
| Electronic Scrap | 18 | 100.0 | 3.35 (1.89) | 2.97 | ||
| Gymnastics | 9 | 100.0 | 1.87 (1.39) | 2.00 | ||
| Spray Poly. | 24 | 87.5 | 1.72 (1.90) | 1.61 | E – S | |
| Nail Salon | 8 | 100.0 | 1.64 (1.54) | 1.55 | E – N | |
| Rigid Board | 3 | 100.0 | 1.57 (1.38) | 1.81 | ||
| Foam Mfg. | 9 | 100.0 | 1.46 (1.71) | 1.43 | E – F | |
| Chemical Mfg. | 10 | 100.0 | 1.27 (1.47) | 1.17 | E – C | |
| Roofing | 10 | 90.0 | 1.14 (1.46) | 1.05 | E – R | |
| NHANES ‡ | 1637 | 98.4 | 1.79 | |||
|
| ||||||
| Sum § | Overall | 91 | 25.65 (2.14) | 21.88 | ||
| Gymnastics | 9 | 35.40 (1.76) | 38.38 | |||
| Electronic Scrap | 18 | 31.54 (2.19) | 32.96 | |||
| Roofing | 10 | 30.17 (2.17) | 32.90 | |||
| Spray Poly. | 24 | 29.12 (2.19) | 23.63 | |||
| Chemical Mfg. | 10 | 23.53 (1.91) | 21.38 | |||
| Foam Mfg. | 9 | 16.65 (2.45) | 14.09 | |||
| Nail Salon | 8 | 14.19 (1.54) | 14.11 | |||
| Rigid Board | 3 | 14.06 (1.57) | 10.90 | |||
| NHANES ‡ | 1637 | 33.59 | ||||
Maximum limit of detection (LOD) divided by the square root of 2 in ng/g lipid for each analyte in the general population (GP): BDE-28=0.37, BDE-47=0.31, BDE-85=0.35, BDE-99=0.30, BDE-100=0.25, BDE-153=0.25, BDE-154=0.24, BDE-183=0.29, and BDE-209=0.92. The maximum LOD divided by the square root of 2 for the serum samples collected: BDE-28=0.21, BDE-85=0.38, BDE-154=0.35, BDE-183=0.23, and BDE-209=0.85. All concentration levels were detected for BDE-47, −99, −100, and −153.
Only significant differences in means of log-concentrations are listed. The abbreviations in the Multiple Comparisons are: Chemical Manufacturing (C), Electronic Scrap (E), Foam Manufacturing (F), Gymnastics (G), Nail Salon (N), Rigid Board Installation (B), Roofing (R), and Spray Polyurethane (S). If the means of log-concentrations for two industries were significantly different, the comparison of the two industries would be presented in the table. For example, “C-E” means that the mean of log-concentrations for chemical manufacturing (C) was significantly different from electronic scrap (E). Red p-values are significantly higher.
The data restricted participants aged 20 years and older are from the National Health and Nutrition Examination Survey (NHANES) during 2015/16: https://wwwn.cdc.gov/Nchs/Nhanes/2015-2016/BFRPOL_I.htm..
Summation of BDE-17, BDE-28, BDE-47, BDE-66, BDE-85, BDE-99, BDE-100, BDE-153, BDE-154, BDE-183, and BDE-209.
Figure 2.

Serum geometric mean (GM) concentrations and corresponding geometric standard deviations of BDE-183 and BDE-209 (ng/g lipid) by industry. Asterisks (*) represent the significant mean differences between electronic scrap and specific industry by analyte.
Univariable results for associations between industry and determinants of exposure are provided for BDE-183 and BDE-209 for electronic scrap workers because they had statistically higher concentrations than most of the other industries (Table 7). BDE-209 hand wipe post-shift concentrations were positively and significantly associated with BDE-209 serum concentrations in electronic scrap workers and in all workers (both p-values < 0.001). Age was significantly related to BDE-183 serum concentrations for all industries’ workers. Results of the multivariable analysis show that for the electronic scrap industry workers BDE-183 serum concentrations increased for every ng/m3 increase in BDE-183 TWA air concentration (p = 0.022) and as working time increased by one year (p = 0.032) (Supplemental Table S10).
Table 7.
Univariable analysis results using log-transformed, averaged PBDE serum concentration (ng/g lipid) as the outcome or dependent variable.
| BDE-183 | ||||||||
|---|---|---|---|---|---|---|---|---|
|
| ||||||||
| Electronic Scrap (N = 18) | All Industries (N = 91) * | |||||||
|
| ||||||||
| Covariate or Independent Variable | N | Estimate (SE) | P-value | Factor † | N | Estimate (SE) | P-value | Factor † |
| Time-weighted average (TWA) air, ng/m3 | 18 | 81.4 (44.1) | 0.084 | 2.2×1035 | 37 | 76.2 (38.1) | 0.054 | 1.2×1033 |
| Hand wipe post, ng/sample | 18 | 0.03 (0.02) | 0.149 | 1.03 | 27 | 0.03 (0.02) | 0.089 | 1.03 |
| Age, years | 18 | 0.03 (0.02) | 0.141 | 1.03 | 91 | 0.02 (0.01) | 0.049 | 1.02 |
| BMI, kg/m2 | 18 | 0.01 (0.04) | 0.838 | 1.01 | 91 | 0.01 (0.01) | 0.380 | 1.01 |
| Length of working time, years | 18 | 0.18 (0.11) | 0.131 | 1.20 | 91 | 0.03 (0.02) | 0.116 | 1.03 |
| Hands wash | 91 | |||||||
| No | 26 | Ref | ||||||
| Yes | 65 | 0.23 (0.22) | 0.307 | 1.26 | ||||
| BDE-209 | ||||||||
|
| ||||||||
| Electronic Scrap (N = 18) | All Industries (N = 91) * | |||||||
|
| ||||||||
| Covariate or Independent Variable | N | Estimate (SE) | P-value | Factor † | N | Estimate (SE) | P-value | Factor † |
|
| ||||||||
| Time-weighted average (TWA) air, ng/m3 | 18 | 2.93 (3.25) | 0.380 | 18.7 | 37 | 1.47 (1.88) | 0.440 | 4.35 |
| Hand wipe post, ng/sample | 18 | 0.0003 (0.0001) | <0.001 | 1.0003 | 27 | 0.0003 (0.0001) | <0.001 | 1.0003 |
| Age, years | 18 | −0.003 (0.01) | 0.789 | 0.997 | 91 | 0.001 (0.01) | 0.841 | 1.001 |
| BMI, kg/m2 | 18 | −0.01 (0.03) | 0.761 | 0.99 | 91 | 0.001 (0.03) | 0.979 | 1.001 |
| Length of working time, years | 18 | 0.12 (0.08) | 0.154 | 1.13 | 91 | 0.001 (0.01) | 0.965 | 1.001 |
| Hands wash | 91 | |||||||
| No | 26 | Ref | ||||||
| Yes | 65 | 0.15 (0.19) | 0.420 | 1.16 | ||||
Industry was adjusted for in the models. Red p-values are significantly higher.
Exponent of the estimate. E.g., Interpretation of the factor=1.03 is that for every increment that, after adjusting for industry, if hand wipe post concentration increases by one ng/sample, BDE-183 increases by 1.03 ng/g lipid.
4. DISCUSSION
This study was designed to characterize exposure to flame retardants through urinary and serum concentrations of FR biomarkers among workers across several industries. These industries were chosen because their workers likely had occupational exposure to one or more flame retardants. Our data suggest that workers from almost all these industries were occupationally exposed to OPEs, and electronic scrap workers were occupationally exposed to PBDEs.
4.1. Comparing urinary OPE results by industry and to the general population
We found that chemical manufacturing workers’ pre- and post-shift unadjusted and creatinine-adjusted GM urinary concentrations of DPhP, BDCPP, BCPP, and DBuP were an order of magnitude higher than those in the U.S. general population. Of note, the chemicals known to be produced by the participating company at the time of sample collection in our study were TDCPP and TCPP, although it was a large plant and had processes elsewhere in the plant. Therefore, the elevated urinary concentrations of the biomarkers of other OPEs (e.g., TPhP) were unexpected, but these other OPEs were also detected in air and hand wipe samples collected from the same workers(27). Pre-shift SG-adjusted GM concentrations for DPhP, BDCPP and DpCP were also elevated among chemical manufacturing workers compared to other industries evaluated in this study. Because the chemical manufacturing workers completed a 12-hour shift (a long shift compared to other workers in this study) the previous day, they were likely still metabolizing and excreting OPEs from their previous shift. This theory is supported by a recent publication(48) that reported urine half-lives for TPhP, TDCPP, TCPP, and TBP are 9.6, 53.8, 15.2, and 4.8 days, respectively, which were longer than previous estimates that were on the order of hours(28). Likewise, the chemical manufacturing workers had statistically higher pre- and post-shift SG-adjusted GM OPE biomarker urinary concentrations than the other industries, with the noted exception of spray polyurethane foam workers’ urinary BCPP concentrations. We were not able to compare DpCP to the general population from 2015-16; but, for 2013-2014(25), only 11% of adults had detectable concentrations.
Spray polyurethane foam workers had pr e- and post-shift unadjusted and creatinine-adjusted GM concentrations of urinary BCPP were an order of magnitude higher than all other industries in this study and two orders of magnitude than those in the U.S. general population. Other investigators reported BCPP urinary metabolites concentrations of polyurethane spray foam workers that were much lower than in this current study(36). The higher concentrations of BCPP, a biomarker of exposure to TCPP, for spray polyurethane foam workers found in this study likely relates, at least in part, to lack of ventilation during use, as spray polyurethane foam workers were observed often applying foam in tight, poorly ventilated spaces like attics or basements. Spray polyurethane foam workers’ PPE use was also sporadic, as several workers wore either no or substandard (i.e., half-face air-purifying respirator) respiratory protection (27). Additionally, the foam making process of mixing two liquid parts to form a reaction were similar in spray polyurethane foam installation and foam manufacturing, whereas rigid board installation and roofing workers were cutting cured, solid foam. These work practices could have contributed to the higher exposures for spray polyurethane foam workers compared to other workers.
Nail salon workers’ DPhP post-shift urinary SG-adjusted GM concentrations were significantly higher than pre-shift. Nail polish often contains TPhP, and indeed our previous manuscript reported that TPhP was detected in eight of the 11 nail polish products that were used for application during sampling(27). Nail salon workers in the current study had GM concentrations below those of nail polish wearing (non-occupational) participants in another study(8). The Mendelsohn et al (2016) study also reported significantly lower GM urinary DPhP concentrations of participants who had nail polish applied to a gloved hand(8). Craig et al (2019) reported similar pre- and post-shift DPhP urinary concentrations as reported here but did not find a correlation between the urinary concentrations and silicon wristband sampling(49). Additionally, we did not find a correlation with hand wipe TPhP concentrations and urinary DPhP concentrations.
There is limited evidence of OPE occupational exposure for electronic scrap workers, as their DPhP SG-adjusted concentrations increased from pre- to post-shift (p=0.046). However, when we compared electronic scrap workers DPHP creatinine-adjusted urinary concentrations to the general population, we did not find significant differences. A 2015 evaluation of U.S. electronic scrap workers reported similar GM post-shift urinary concentrations for DPhP and BDCPP; however, they reported lower or non-detectable concentrations for BCPP and BCEtP(50) . Gravel, Lavoue et al (2020) evaluated occupational exposures to flame retardants among electronic scrap workers in 2017 and 2018 and reported lower urinary concentrations for DPhP and BDCPP compared to the current study(51). The electronic scrap workers’ GM for three OPEs (DPhP, BDCPP, and BCPP) from this study were higher than the electronic scrap workers’ levels from three previous studies in China(38–40). These differences are likely reflective of the FR content in consumer electronic scrap in the two countries.
Carignan et al (2016) evaluated flame retardant exposure in gymnasts and reported higher GM unadjusted urinary post workout concentrations of DPhP (8.40 ng/mL) and lower concentrations of BDCPP (0.62 ng/mL) than reported in this study (1.92 ng/mL and 3.81 ng/mL, respectively)(28). The type of OPE used in the gym foam pit cubes could be the reason for these differences. This study also measured TBBA and reported detection frequencies at 90 to 100%, our study had a detection frequency of 11% and 44% for pre- and post-shift, respectively. However, our LOD for TBBA was higher (0.05 ng/mL) than in the Carignan study (0.017 μg/L)(28).
We also compared our results to previous studies that examined FR exposure for other industries. Firefighters OPE urinary concentrations were lower than workers from several industries (chemical and foam manufacturing, roofers, electronic scrap, gymnastics schools, spray polyurethane foam) evaluated in this study(35,52). Hotel workers in China had urinary concentrations of DPhP, BDCPP, and DBuP that were lower than the concentrations measured in this study(53). However, the Chinese hotel workers had unexpectedly higher unadjusted urinary concentrations of DoCP and DpCP (GM= 0.13 ng/mL) which was greater than all industries considered in this study except chemical manufacturers. Median post-shift DBuP urinary concentrations for aircraft maintenance workers were much higher when compared to the industry with the highest concentration (i.e., chemical manufacturing measured in our study(54). Additionally, aircrew median OPE concentrations were lower than the current study concentrations(55).
4.2. Evaluating the relationship between air and hand wipe samples and urinary OPE results, stratified by industry
We evaluated correlations between DPhP, BDCPP, and BCPP urinary concentrations and the parent chemicals (TPhP, TDCPP, and TCPP, respectively) in hand wipes and air samples because they were consistently above U.S. general population GM levels and most likely to increase from pre-to post-shift. TPhP and TCPP hand wipe concentrations were significantly associated with DPhP and BCPP post-shift urinary SG-adjusted concentrations (adjusted for industry) when conducting univariable analyses (Supplemental Table S5). Univariable analyses also showed TCPP air concentrations were significantly associated with BCPP post-shift urinary SG-adjusted concentrations (Supplemental Table S5). When conducting multivariable analyses (Table 4), hand wipe and air concentrations were significantly related to post-shift urinary BCPP concentration. Additionally, TCPP air concentrations were significantly associated with BCPP urinary concentrations when including hand wipe concentrations
When looking more closely at each industry (Table 5), TPhP hand wipe and DPhP urinary concentrations were strongly correlated for gymnastics instructors (r=0.917, p<0.001). Likewise, there was a strong correlation between TCPP hand wipe and urinary BCPP concentrations for roofing workers (r=0.879, p<0.001) and moderate correlation for chemical manufacturing workers (r=0.697, p=0.025). Hammel et al. (2016) provided correlation coefficients to compare hand wipes concentrations from the parent chemicals to urinary metabolites and reported a significant correlation for TDCPP to BDCPP (0.37, p<0.05)(56). We found a strong Spearman correlation coefficient between gymnastics instructors TDCPP hand wipe and BDCPP urinary SG-adjusted concentrations (r=0.717, p=0.030). This is similar to previous manuscripts, including one that reported a relationship for Chinese hotel workers (0.62, p<0.01)(53) and a low correlation among a group of U.S. mothers who participated in a study to evaluate the effectiveness of house cleaning and hand washing practices to reduce flame retardants exposure (0.26, p=0.18)(57).
These results suggest that both dermal absorption and inhalation are primary routes of exposure for OPEs. Of the industries evaluated in this study, chemical manufacturing workers are exposed through both exposure routes, but dermal is likely the primary route due to the statistically significant correlations with BDCPP and BCPP SG-adjusted urinary concentrations and TDCPP and TCPP hand wipe concentrations, respectively. Gymnastics instructors are also likely exposed through their skin as shown by correlations coefficients with SG-adjusted urinary DPhP and BCPP concentrations and TPhP and TCPP hand wipe concentrations.
4.3. PBDE Flame Retardants
PBDE serum concentrations may be declining(58–59) as a result of the phasing out of PBDE production and use in the United States and internationally. Electronic scrap workers’ median serum concentrations, which reflect the decommissioning phase of the electronic scrap work products, were higher than those of the U.S. general population for BDE-183 and −209 (BDE-183 is detectable in only 16% of the U.S. general population but 94% of electronic scrap workers in this study). The workers from other industries evaluated in this study do not appear to be occupationally exposed to PBDEs; however, gymnastics instructors did have higher detection frequencies for some congeners with lower detection frequencies in the U.S. general population, including BDE-85 (78%) and −154 (78%). Previous studies have suggested electronic scrap workers(26,50) are occupationally exposed to PBDEs. In the current study, electronic scrap workers’ serum concentrations were statistically greater than most of the other industries for BDE-183 and BDE-209 (Table 6). However, the electronic scrap workers in this study had BDE-183 and −209 concentrations that were an order of magnitude lower than female Vietnamese electronic scrap workers(60). Also, electronic scrap workers in this study and the U.S. general population had higher median serum levels than the Vietnamese electronic scrap workers for BDE-47, −99, and −100.
Additionally, electronic scrap workers in our study had higher serum concentrations of BDE-17 and BDE-183 than those reported for U.S. foam recycling and carpet installation workers (BDE-209 was not measured)(31). Pakistani workers (university, clothing store and electronic scrap) had reported BDE-47, 99, and 153 median concentrations at ≤1.1 ng/g lipid which were lower than the present study(61). Chinese chemical manufacturing workers who were producing BDE-209 had blood serum concentrations of BDE-209 that were three orders of magnitude higher than this study’s chemical manufacturing workers, and mostly non-detectable concentrations of BDE-99, −100, and −154, whereas our study has 100%, 100%, and 90% detection rates for these congeners, respectively(62). These observed differences may be an artifact of the differences in PBDE usage between the two countries. Gravel et al (2020) evaluated electronic scrap workers in Canada and found serum concentrations to be higher for BDE-209 compared to the current study (18 vs. 3.35 ng/g lipids). However, the same study reported lower serum concentrations in electronic scrap workers for BDE-153 (4.6 vs. 5.56 ng/g lipids), BDE-47 (3.8 vs. 12.25 ng/g lipids), and BDE-17 (non-detectable vs. 0.19 ng/g lipids) compared to the current study(50).
Positive association between electronic scrap workers’ BDE-209 hand wipe levels and serum concentrations (p<0.001) potentially points to a dermal exposure pathway for BDE-209. BDE-209 has a half-life of 15 days(9,11), so BDE-209 serum concentrations likely result from recent exposures over the last two weeks. BDE-183, on the other hand, has a half-life of 94 days(11), suggesting this could represent accumulated exposure over months and therefore would be less likely to be highly correlated with air and hand wipe samples collected concurrently.
4.4. Limitations and future work
The number of workers in each industry was relatively low which limited some analyses. Additionally, the participants in this study were primarily (over 75%) white Non-Hispanic males, which may not accurately reflect the demographics of workers in these industries across the USA. However, FR occupational exposure data in the USA are rather limited and this study adds relevant information to the body of literature on this topic. Although many of the OPE urinary metabolites are specific for the parent compounds, some OPEs have other metabolites (e.g., hydroxyl triphenyl phosphate for TPhP, 1-hydroxy-2-propyl bis(1-chloro-2- propyl) phosphate for TCPP) that were not measured in this study. Additionally, DPhP is a metabolite for several other compounds and DPhP itself is also applied to some products, meaning DPhP concentrations in urine do not necessarily reflect an exposure to TPhP(63–65). Additionally, the extended half-lives (i.e., 11-54 days) of some of these chemicals (e.g., DPhP, BDCPP, BDE-209) allow for the possibility that other non-occupationally related sources of exposure, including through diet and exposure to consumer products, may contribute to the biomarker concentrations reported here. Also, many of the participants worked the previous day, so the previous day’s work exposure also contributed to the pre-shift urinary concentrations. Nevertheless, results from this study suggest that some inhalation or dermal exposures in this study (e.g., TPhP, TCPP, BDE-209) are associated with increased post-shift concentrations of the chemical biomarkers in the body (e.g., DPhP, BCPP, BDE-209), suggesting workers in these industries were exposed to and absorbed these chemicals during their work shift. Although we have reported higher OPE and PBDE flame retardants biomarker concentrations compared to the general population, it is unclear if these concentrations are associated with health effects. Lastly, as previously mentioned in the results, we primarily reported the SG-adjusted urinary OPE metabolite concentrations but needed to use unadjusted and creatinine-adjusted urinary concentrations to compare to the U.S. general population. Results that have been adjusted for SG are the preferred option for some because it minimizes error due to urine dilution. However, NHANES does not provide SG-adjusted results. All analyses, figures, and tables are provided for SG-adjusted, creatinine-adjusted, and unadjusted results in either the main text or the Supplemental Materials.
Overall, workers from all industries evaluated in this study were exposed to flame retardants, but the specific exposure of concern depended on the industry examined. Results from this study also suggest that inhalation and dermal absorption are both likely routes of workplace exposure to flame retardants, though more research is needed to fully understand how the route of absorption affects excretion rates for the flame retardants analyzed here. Future studies could also provide a larger, more comprehensive exposure assessment on occupations found to have high exposures (e.g., chemical manufacturers, electronic scrap) to flame retardants, which may lead to recommendations for exposure reduction interventions. Moving forward, exposure assessments focusing on emerging flame retardants may be more important than PBDEs, given the global restrictions, and OPEs, given the Consumer Products Safety Commission’s granted petition to declare products are hazardous substances if they contain organohalogen flame retardants(4).
Supplementary Material
5. ACKNOWLEDGEMENTS
Most of all, we thank the workers who participated in this study. We also thank Debbie Sammons, Chrissy Toennis, Shirley Robertson, Barb McKenzie, Kenneth Fent, Melissa Edmondson, Ken Sparks, Kelsey Babik, Catherine Beaucham, Reed Grimes, Myles O’Mara, Kaitlyn Phillips, Jessica Ramsey, and Barb Alexander for assistance in collecting, processing and submitting samples for analysis. We thank Minhthu Le for interpreting at nail salons. We also acknowledge Paula Restrepo for technical assistance in measuring OPE metabolites. We thank Bob Streicher and Jen Roberts for their assistance with understanding environmental sample results. We thank Steve Bertke and Annette Christianson for statistical advice. We thank Lian Luo for assistance with data management. This study was approved by the Institutional Review Board at NIOSH. This study was supported in part by an interagency agreement between NIOSH and the National Institute of Environmental Health Sciences (AES15002) as a collaborative National Toxicology Program research activity. The findings and conclusions in this paper are those of the authors and do not necessarily represent the official position of NIOSH, Centers for Disease Control and Prevention. Mention of any company or product does not constitute endorsement by NIOSH.
Footnotes
SUPPORTING INFORMATION FOR PUBLICATION
Supporting Information: Additional experimental methods for specific gravity and creatinine adjustments. Additional Figures (S1–S2) and Tables (S1–S10) are provided for unadjusted and creatinine-adjusted results, univariable and multivariable analysis results, PBDE serum results for analytes below our reporting threshold (<60% above the limit of detection (LOD), and PBDE multivariable results.
7. REFERENCES
- 1.U.S. Environmental Protection Agency (EPA), Flame retardants used in flexible polyurethane foam: an alternatives assessment update.last revised September 2015. https://www.epa.gov/saferchoice/flame-retardants-used-flexible-polyurethane-foam (accessed 2024-03-15).
- 2.EPA. Polybrominated diphenyl ethers (PBDEs) significant new use rules (SNUR). last revised March 2012. https://www.epa.gov/assessing-and-managing-chemicals-under-tsca/polybrominated-diphenylethers-pbdes-significant-new-use#:~:text=On%20March%2020%2C%202012%2C%20EPA,for%20any%20use%20which%20is (accessed 2024-03-15).
- 3.United Nations Environmental Programme. The new POPs under the Stockholm Convention. Last revised May 2023. https://www.pops.int/TheConvention/ThePOPs/TheNewPOPs/tabid/2511/Default.aspx (accessed 2024-03-15).
- 4.Consumer Product Safety Commission (CPSC). C.P.S.C. Guidance Document on Hazardous Additive, Non-Polymeric Organohalogen Flame Retardants in Certain Consumer Products Federal Register Notice. Last revised 09-28-2017. https://www.federalregister.gov/documents/2017/09/28/2017-20733/guidance-document-on-hazardous-additive-non-polymeric-organohalogen-flame-retardants-in-certain (accessed 2024-03-15).
- 5.EPA. Q&A Consumer Fact Sheet on Flame Retardants. Last revised June 2014. https://www.epa.gov/sites/default/files/2014-06/documents/flameretardant_consumerfactsheet.pdf (accessed 2024-03-15).
- 6.EPA. Alternative Assessment: Partnership to Evaluate Flame Retardants in Printed Circuit Boards. Last revised Summer 2015. https://www.epa.gov/saferchoice/alternatives-assessment-partnership-evaluate-flame-retardants-printed-circuit-boards (accessed 2024-03-15).
- 7.Estill C; Mayer A; Slone J; Chen I; Zhou M; La Guardia M; Jayatilaka N; Ospina M; Calafat A Assessment of triphenyl phosphate (TPhP) exposure to nail salon workers by air, hand wipe, and urine analysis. International Journal of Hygiene and Environmental Health. 2021, 231. 113630. [DOI] [PMC free article] [PubMed] [Google Scholar]
- 8.Mendelsohn E; Hagopian A; Hoffman K; Butt CM; Lorenzo A; Congleton J; Webster TF; Stapleton HM Nail Polish as a Source of Exposure to Triphenyl Phosphate. Environment International. 2016, 86, 45–51. [DOI] [PMC free article] [PubMed] [Google Scholar]
- 9.Sjodin A; Mueller J; Jones R; Schutze A; Wong L; Caudill S; Harden F; Webster T; Torns L Serum elimination half-lives adjusted for ongoing exposure of tri-to hexabrominated diphenyl ethers: determined in persons moving from North America to Australia. Chemosphere. 2020, 248, 1–7. [DOI] [PMC free article] [PubMed] [Google Scholar]
- 10.Sacks VP; Lohman R. Freely dissolved PBDEs in water and porewater of an urban estuary. Environmental Pollution. 2012, 162, 287–293. [DOI] [PubMed] [Google Scholar]
- 11.Thuresson K; Hoglund P; Hagmar L; Sjodin A; Bergman A; Jakobsson K Apparent half-lives of hepta- to decabrominated diphenyl ethers in human serum as determined in occupationally exposed workers. Environmental Health Perspectives. 2006, 114, 176–181. [DOI] [PMC free article] [PubMed] [Google Scholar]
- 12.Carignan C; Mínguez-Alarcón L; Butt C; Williams P; Meeker J; Stapleton H; Toth T; Ford J; Hauser R Urinary Concentrations of Organophosphate Flame Retardant Metabolites and Pregnancy Outcomes among Women Undergoing in Vitro Fertilization. Environmental Health Perspectives. 2017, 125 (8). [DOI] [PMC free article] [PubMed] [Google Scholar]
- 13.Linares VB; Belles M; Domingo J Human exposure to PBDE and critical evaluation of health hazards. Arch Toxicol. 2015, 89 (3), 335–356. [DOI] [PubMed] [Google Scholar]
- 14.Meeker JD; Cooper EM; Stapleton HM; Hauser R Exploratory analysis of urinary metabolites of phosphorus-containing flame retardants in relation to markers of male reproductive health. Endocrine disruptors. 2013, 1 (1), e26306. [DOI] [PMC free article] [PubMed] [Google Scholar]
- 15.EPA. Polybrominated diphenol ethers (PBDEs) action plan. Washington, DC: : US EPA, 2009. [Google Scholar]
- 16.Genuis S; Birkholz D; Genuis S Human Excretion of Polybrominated Diphenyl Ether Flame Retardants: Blood, Urine, and Sweat Study. Biomed Research International. 2017, 3676089. [DOI] [PMC free article] [PubMed] [Google Scholar]
- 17.California Office of Environmental Health Hazard Assessment (OEHHA): The Proposition 65 List. Updated April 21, 2023. [Google Scholar]
- 18.Agency for Toxic Substances and Disease Registry (ATSDR), A.T.S.D.R. Toxicological Profile for Phosphate Ester Flame Retardants. US Dept of Health and Human Services, Public Health Service, 2012, 188–245. [PubMed] [Google Scholar]
- 19.Zhong X; Qiu J; Kang J; Xing X; Shi X; Wei Y Exposure to tris(1,3-dichloro-2-propyl) phosphate (TDCPP) induces vascular toxicity through Nrf2-VEGF pathway in zebrafish and human umbilical vein endothelial cells. Environmental Pollution. 2019, 247, 293–301. [DOI] [PubMed] [Google Scholar]
- 20.Isales G; Hipszer R; Raftery T; Chen A; Stapleton H;Volz D Triphenyl phosphate-induced development toxicity in zebrafish: Potenital role of the retinoic acid receptor. Aquatic Toxicology. 2015, 161, 221–230. [DOI] [PMC free article] [PubMed] [Google Scholar]
- 21.Lee J; Morita Y; Kawai Y; Covaci A; Kubota A Developmental circulatory failure caused by metabolites of organophosphorus flame retardants in zebrafish, Danio rerio. Chemosphere. 2020, 246, 125738. [DOI] [PubMed] [Google Scholar]
- 22.An J; Hu J; Shang Y; Zhong Y; Zhang X; Yu Z The cytotoxicity of organophosphate flame retardants on HepG2, A549 and Caco-2 cells. Journal of Environmental Science and Health. 2016, 51 (11), 980–988. [DOI] [PubMed] [Google Scholar]
- 23.Latronico S; Giordano M; Urso E; Lionetto M; Schettino T Effect of the flame retardant tris (1,3-dichloro-2-propyl) phosphate (TDCPP) on Na+-K+-ATPase and Cl- transport in HeLa cells. Toxicol Mech Methods. 2018, 28 (8), 599–606. [DOI] [PubMed] [Google Scholar]
- 24.Saunders DM; Hagley EB; Hecker M; Mankidy R; Giesy JP In Vitro endocrine disruption and TCDD-like effects of three novel brominated flame retardants: TBPH, TBB, and TBCO. Chemosphere. 2013, 223 (2), 252–259. [DOI] [PubMed] [Google Scholar]
- 25.Ospina M; Jayatilaka NK; Wong L-Y; Restrepo P; Calafat AM Exposure to organophosphate flame retardant chemicals in the U.S. general population: Data from the 2013-2014 National Health and Nutrition Examination Survey. Environment International. 2018, 110, 32–41. [DOI] [PMC free article] [PubMed] [Google Scholar]
- 26.Gravel S; Aubin S; Labreche F Assessment of Occupational Exposure to Organic Flame Retardants: A Systematic Review. Ann Work Expo Health. 2019, 63 (4), 386–406. [DOI] [PubMed] [Google Scholar]
- 27.Estill C; Slone J; Mayer A; Chen I; La Guardia M Worker exposure to flame retardants in manufacturing, construction and service industries. Environment International. 2020, 135, 105349. [DOI] [PMC free article] [PubMed] [Google Scholar]
- 28.Carignan C; Fang M; Stapleton H; Heiger-Bernays W; McClean M; Webster T Urinary biomarkers of flame retardant exposure among collegiate U.S. gymnasts. Environment International. 2016, 362–368. [DOI] [PMC free article] [PubMed] [Google Scholar]
- 29.Jayatilaka NK; Restrepo P; Williams L; Ospina M; Valentin-Blasini L; Calafat AM Quantification of three chlorinated dialkyl phosphates, diphenyl phosphate, 2,3,4,5-tetrabromobenzoic acid, and four other organophosphates in human urine by solid phase extraction-high performance liquid chromatography-tandem mass spectrometry. Anal Bioanal Chem. 2017, 409 (5), 1323–1332. [DOI] [PMC free article] [PubMed] [Google Scholar]
- 30.Shaw SD; Berger ML; Harris JH; Yun SH; Wu Q; Liao C; Blum A; Stefani A; Kannan K Persistent organic pollutants including polychlorinated and polybrominated dibenzo-p-dioxins and dibenzofurans in firefighters from Northern California. Chemosphere. 2013, 91 (10), 1386–1394. [DOI] [PubMed] [Google Scholar]
- 31.Stapleton HM; Sjodin A; Jones RS; Niehuser S; Zhang Y; Patterson DG Serum levels of polybrominated diphenyl ethers (PBDEs) in foam recyclers and carpet installers working in the United States. Environmental Science & Technology. 2008, 42 (9), 3453–3458. [DOI] [PubMed] [Google Scholar]
- 32.Thuresson K; Bergman A; Jakobsson K Occupational exposure to commercial decabromodiphenyl ether in workers manufacturing or handling flame-retarded rubber. Environmental Science & Technology. 2005, 39 (7), 1980–1986. [DOI] [PubMed] [Google Scholar]
- 33.Liang S; Xu F; Tang W; Zhang Z; Zhang W; Liu L; Wang J; Lin K Brominated flame retardants in the hair and serum samples from an e-waste recycling area in southeastern China: the possibility of using hair for biomonitoring. Environ Sci Pollut. 2016, 23, 14889–14897. [DOI] [PubMed] [Google Scholar]
- 34.Wang D; Chen T; Fu Z; Yang L; Li R; Sui S; Wang Y; Shi Z Occupational exposure to polybrominated diphenyl ethers or decabromodiphenyl ethane during chemical manufacturing: Occurrence and health risk assessment. Chemosphere. 2019, 231, 385–392. [DOI] [PubMed] [Google Scholar]
- 35.Mayer A; Fent K; Chen I; Sammons D; Toennis C; Robertson S; Kerber S; Horn G; Smith D; Calafat A; Ospina M; Sjodin A Characterizing exposures to flame retardants, dioxins, and furans among firefighters responding to controlled residential fires. Int J Hyg Environ Health. 2021, 236, 113782 . [DOI] [PMC free article] [PubMed] [Google Scholar]
- 36.Bello A; Carignan C; Xue Y; Stapleton H; Bello D Exposure to organophosphate flame retardants in spray polyurethane foam applicators: Role of dermal exposure. Environment International. 2018, 113, 55–65. [DOI] [PubMed] [Google Scholar]
- 37.Estill C; Slone J; Mayer A; Phillips K; Lu J; Chen I; Christanson A; Streicher R; La Guardia M; Jayatilaka N; Ospina M; Calafat A Assessment of spray polyurethane foam worker exposure to organophosphate flame retardants through measures in air, hand wipes, and urine. J Occup Environ Hyg. 2019, 16 (7), 477–488. [DOI] [PMC free article] [PubMed] [Google Scholar]
- 38.Lu S; Li Y; Zhang T; Cai D; Ruah J; Huang M; Wang L; Zhang J; Qiu R Effect of E-waste Recycling on Urinary Metabolites of Organophosphate Flame Retardants and Plasticizers and Their Association with Oxidative Stress. Environmental Science & Technology. 2017, 51 (4), 2427–2437. [DOI] [PubMed] [Google Scholar]
- 39.Qin R; Tang B; Zhuang X; Wei-Xiang L; Wang M; Zhang L; Hu K Organophosphate flame retardants and diesters in the urine of e-waste dismantling workers: associations with indoor dust and implications for urinary biomonitoring. Environ Sci Process Impacts. 2021, 23, 357–366. [DOI] [PubMed] [Google Scholar]
- 40.Yan X; Zheng X; Wang M; Zheng J; Xu R; Zhuang X; Lin Y Urinary metabolites of phosphate flame retardants in workers occupied with e-waste recycling and incineration. Chemosphere. 2018, 200, 569–575. [DOI] [PubMed] [Google Scholar]
- 41.Jones R; Edenfield E; Anderson S; Zhang Y; Sjodin A Semi-automated Extraction and cleanup method for measuring persistent organic polutants in human serum. Organohalogen Compd. 2012, 74, 97–98. [Google Scholar]
- 42.Burstyn I; Teschke K Studying the determinants of exposure: a review of methods. Am Ind Hyg Assoc J. 1999, 60 (1), 57–72. [DOI] [PubMed] [Google Scholar]
- 43.Hornung R; Reed L Estimation of average concentration in the presence of nondetectable values. Appl Occup Environ Hyg. 1990, 5, 46–51. [Google Scholar]
- 44.Centers for Disease Control and Prevention (CDC). National Center for Health Statistics (NCHS). National Health and Nutrition Examination Survey Data. Hyattsville, MD: U.S. Department of Health and Human Services, Flame Retardantss – Urine (Surplus) (SSFR_I) [last revised July 2022][https://wwwn.cdc.gov/Nchs/Nhanes/2015-2016/SSFR_I.htm]. 2022. [Google Scholar]
- 45.CDC. National Center for Health Statistics (NCHS). National Health and Nutrition Examination Survey Data. Hyattsville, MD: U.S. Department of Health and Human Services, Brominated Flame Retardants (BFRs) – Pooled Samples (BFRPOL_I) [last revised November 2020][https://wwwn.cdc.gov/Nchs/Nhanes/2015-2016/BFRPOL_I.htm]. 2020. [Google Scholar]
- 46.Jin Y; Hein M; Dedden J; Hines C Analysis of Lognormally Distributed Exposure Data with Repeated Measures and Values below the Limit of Detection Using SAS. Annals of Occupational Hygiene. 2011, 55 (1), 97–112. [DOI] [PubMed] [Google Scholar]
- 47.Barr D; Wilder L; Caudill S; Gonzalez A; Needham L; Pirkle J Urinary creatinine concentrations in the U.S. population: implications for urinary biologic monitoring measurements. Environmental Health Perspectives. 2005, 113 (2), 192–200. [DOI] [PMC free article] [PubMed] [Google Scholar]
- 48.Wang X; Zhong W; Hang L; Yang J; Covaci A; Zhu L Estimating renal and hepatic clearance rates of organophosphate esters in humans: impacts of intrinsic metabolism and binding affinity with plasma proteins. Environment International. 2020, 134, 105321. [DOI] [PubMed] [Google Scholar]
- 49.Craig J, Ceballos D, Fruh V, Petrpoulos Z, Allen J, Calafat A, Ospina M, Stapleton H, Hammel S, Gray R, Webster T Exposure of Nail Salon Workers to Phthalates, Di(2-ethylhexyl) Terephthalate, and Organophosphate Esters: A Pilot Study. Environmental Science & Technology. 2019, 53(24), 14630–14637. [DOI] [PMC free article] [PubMed] [Google Scholar]
- 50.National Institute for Occupational Safety and Health (NIOSH). Evaluation of exposure to metals, flame retardants, and nanomaterials at an electronics recycling company. By Beaucham CC, Ceballos D, Page EH, Mueller C, Calafat A, Sjodin A, Ospina M, La Guardia M, Glassford E Cincinnati, OH: U.S. Department of Health and Human Services, Centers for Disease Control and Prevention, National Institute for Occupational Safety and Health, Health Hazard Evaluation Report; 2015-0050-3308. 2018. [Google Scholar]
- 51.Gravel S; Lavoue J; Bakhiyi B; Lavoie J; Roberge B; Patry L; Bouchard M; Verner M; Zayed J; Labreche F Multi-exposures to suspected endocrine disruptors in electronic waste recycling workers: Associations with thyroid and reproductive hormones. International Journal of Hygiene and Environmental Health. 2020, 225, 113445. [DOI] [PubMed] [Google Scholar]
- 52.Trowbridge J; Gerona R; McMaster M; Ona K; Clarity C; Cessonneau V; Rudel R; Buren H; Morello-Frosch R Organophosphate and Organohalogen Flame-Retardant Exposure and Thyroid Hormone Disruption in a Cross-Sectional Study of Female Firefighters and Office Workers from San Francisco. Environmental Science & Technology . 2022, 56 (1), 440–450. [DOI] [PMC free article] [PubMed] [Google Scholar]
- 53.Tao Y; Shang Y; Li J; Feng J; He Z; Covaci A; Wang P; Luo J; Xiang M; Shi B; Hu L; Luo D; Mei S Exposure to organophosphate flame retardants of hotel room attendants in Wuhan City, China. Environmental Pollution. 2018, 236, 626–633. [DOI] [PubMed] [Google Scholar]
- 54.Schindler BK; Koslitz S; Weiss T; Broding HC; Bruning T; Bunger J Exposure of aircraft maintenance technicians to organophosphates from hydraulic fluids and turbine oils: a pilot study. International Journal of Hygiene and Environmental Health. 2014, 217, 34–37. [DOI] [PubMed] [Google Scholar]
- 55.Schindler B; Weiss T; Schutze A; Koslitz S; Groding H; Bunger J; Bruning T Occupational exposure of air crews to tricresyl phosphate isomers and organophosphate flame retardants after fume events. Arch Toxicol. 2013, 87 (4), 645–648. [DOI] [PubMed] [Google Scholar]
- 56.Hammel SC; Hoffman K; Webster TF; Anderson KA; Stapleton HM Measuring Personal Exposure to Organophosphate Flame Retardants Using Silicone Wristbands and Hand Wipes. Environmental Science & Technology. 2016, 50 (8), 4483–4491. [DOI] [PMC free article] [PubMed] [Google Scholar]
- 57.Gibson E; Stapleton H; Calero L; Holmes D; Burke K; Martinez R; Cortes B; Nematollahi A; Evans D; Herbstman J Flame retardant exposure assessment: findings from a behavioral intervention study. J Expo Sci Environ Epidemiol. 2019, 29 (1), 33–48. [DOI] [PMC free article] [PubMed] [Google Scholar]
- 58.Parry E; Zota A; Park J; Woodruff T Polybrominated diphenyl ethers (PBDEs) and hydroxylated PBDE metabolites (OH-PBDEs): A six-year temporal trend in Northern California pregnant women. Chemosphere. 2018, 195, 777–783. [DOI] [PMC free article] [PubMed] [Google Scholar]
- 59.Sjodin A; Jones R; Wong L; Caudill S; Calafat A Polybrominated Diphenyl Ethers and Biphenyl in Serum: Time Trend Study from the National Health and Nutrition Examination Survey for Years 2005/06 through 2013/14. Environmental Science & Technology. 2019, 53, 6018–6024. [DOI] [PMC free article] [PubMed] [Google Scholar]
- 60.Schecter A; Kincaid J; Quynh H; Lanceta J; Tran H; Crandall R; Shropshire W; Birnbaum L Biomonitoring of Metals, Polybrominated Diphenyl Ethers, Polychlorinated Biphenyls, and Persistent Pesticides in Vietnamese Female Electronic Waste Recyclers. J Occup Environ Med. 2018, 60 (2), 191–197. [DOI] [PMC free article] [PubMed] [Google Scholar]
- 61.Ali N; Mehdi T; Malik R; Eqani S; Kamal A; Dirtu A; Neels H; Covaci A Levels and profile of several classes of organic contaminants in matched indoor dust and serum samples from occupational settings of Pakistan. Environmental Pollution. 2014, 193, 269–276. [DOI] [PubMed] [Google Scholar]
- 62.Chen T; Niu P; Kong F; Wang Y; Bai Y; Yu D; Jia J; Yang L; Fu Z; Li R; Li J; Tian L; Sun Z; Wang D; Shi Z Disruption of thyroid hormone levels by decabrominated diphenyl ethers (BDE-209) in occupational workers from a deca-BDE manufacturing plant. Environment International. 2018, 120, 505–515. [DOI] [PubMed] [Google Scholar]
- 63.Shen J; Zhang Y; Yu N; Crump D; Li J; Su H; Letcher R; Su G Organophosphate ester, 2-ethylhexyl diphenyl phosphate (EHDPP), elicits cytotoxic and transcriptomic effects in chicken embryonic hepatocytes and its biotransformation profile compared to humans. Environmental Science & Technology. 2019, 53, 2151–2160. [DOI] [PubMed] [Google Scholar]
- 64.Nishimaki-Mogami T; Minegishi K; Tanaka A; Sato M Isolation and identification of metabolites of 2-ethylhexyl diphenyl phosphate in rats. Arch Toxicol. 1988, 61, 256–264. [DOI] [PubMed] [Google Scholar]
- 65.Phillips A; Herkert N; Ulrich J; Hartman J; Ruis M; Cooper E; Ferguson P; Stapleton H In vitro metabolism of ITPs and TBPPs using human liver subcellular fractions. Chem Res Toxicol. 2020, 33, 1428–1441. [DOI] [PMC free article] [PubMed] [Google Scholar]
Associated Data
This section collects any data citations, data availability statements, or supplementary materials included in this article.