

Abstract
The EFSA Panel on Food Additives and Flavourings (FAF) was requested to evaluate the safety of naringenin [FL‐no: 16.132] as a new flavouring substance, in accordance with Regulation (EC) No 1331/2008. No other substances with sufficient structural similarity have been identified in existing FGEs that could be used to support a read‐across approach. The information provided on the manufacturing process, the composition and the stability of [FL‐no: 16.132] was considered sufficient. From studies carried out with naringenin, the Panel concluded that there is no concern with respect to genotoxicity. The use of naringenin as a flavouring substance at added portions exposure technique (APET) exposure levels is unlikely to pose a risk for drug interaction. For the toxicological evaluation of naringenin, the Panel requested an extended one‐generation toxicity study on naringenin, in line with the requirements of the Procedure and to investigate the consequence of a possible endocrine‐disrupting activity. The Panel considered that changes in thymus weight, litter size, post‐implantation loss and a consistent reduced pup weight in the high‐dose F2 generation could not be dismissed and selected therefore, the mid‐dose of 1320 mg/kg body weight (bw) per day for the parental males as the no observed adverse effect level (NOAEL) of the study. The exposure estimates for [FL‐no: 16.132] (31,500 and 50,000 μg/person per day for children and adults, respectively) were above the threshold of toxicological of concern (TTC) for its structural class (III). Using the NOAEL of 1320 mg/kg bw per day at step A4 of the procedure, margins of exposure (MoE) of 1590 and 630 could be calculated for adults and children, respectively. Based on the calculated MoEs, the Panel concluded that the use of naringenin as a flavouring substance does not raise a safety concern.
Keywords: [FL‐no: 16.132], FGE.413, flavouring, naringenin
1. INTRODUCTION
The present scientific opinion deals with the safety assessment of naringenin [FL‐no: 16.132] to be used as a new flavouring substance in and on food.
1.1. Background and Terms of Reference as provided by the requestor
1.1.1. Background
The use of flavourings in food is regulated under Regulation (EC) No 1334/2008 1 of the European Parliament and Council of 16 December 2008 on flavourings and certain food ingredients with the flavouring properties for use in and on foods. On the basis of Article 9(a) of this Regulation, an evaluation and approval are required for flavouring substances.
Regulation (EC) No 1331/2008 2 applies for the evaluation and approval of new flavouring substances.
The applicant has submitted an application for authorisation of Naringenin (CAS: 480–41‐1) as a new flavouring substance on 30 June 2016. The Commission required the applicant additional information. After having received the additional information the application was considered complete.
According to the applicant Naringenin is related to Naringin (FL‐no: 16.058) and the flavanone flavouring substances considered as part of FGE.32.
In order for the Commission to be able to consider its inclusion in the Union list of flavourings and source materials (Annex I of Regulation (EC) No 1334/2008), EFSA should carry out a safety assessment of this substance.
1.1.2. Terms of Reference
The European Commission requests the European Food Safety Authority to carry out a safety assessment on Naringenin as a new flavouring substance in accordance with Regulation (EC) No 1331/2008 establishing a common authorisation procedure for food additives, food enzymes and food flavourings.
1.2. Existing authorisations and evaluations
Naringenin was evaluated by the expert Panel of the Flavor and Extract Manufacturers Association (FEMA) as ‘Generally recognised as safe’ (GRAS). Naringenin (FEMA No. 4797) was included in the FEMA GRAS 27 list (Cohen et al., 2015a, 2015b). The CEF Panel evaluated naringenin [FL‐no: 16.132] in FGE.410 (EFSA CEF Panel, 2017), where it was concluded that the available data on genotoxicity were not adequate. In addition, the CEF Panel noted that depending on the outcome of the assessment on genotoxicity, more toxicological data would be needed to finalise the evaluation. Naringenin (JECFA no. 2257) was also evaluated by JECFA in 2022 (JECFA, 2022).
2. DATA AND METHODOLOGIES
2.1. Data
The present evaluation is based on data on naringenin [FL‐no: 16.132] provided by the applicant in a dossier (Documentation provided to EFSA No. 1) to support its evaluation as a food flavouring substance. Additional information was provided by the applicant during the risk assessment process on 11 December 2017 (Documentation provided to EFSA No. 2), on 13 May 2019 (Documentation provided to EFSA No. 3), on 23 September 2019 (Documentation provided to EFSA No. 4) and on 10 February 2023 (Documentation provided to EFSA No. 5) in response to requests from EFSA sent on 16 June 2017, 30 January 2018, 1 July 2019 and on 5 November 2019 (with addendum letter sent on 18 October 2022), respectively.
2.2. Methodologies
This opinion was prepared following the principles described in the EFSA Guidance of the Scientific Committee on transparency with regard to scientific aspects of risk assessment (EFSA Scientific Committee, 2009) and following the relevant existing Guidance documents from the EFSA Scientific Committee.
The application on naringenin was submitted to EFSA before the adoption and publication of the latest EFSA guidance on data required for the risk assessment of flavourings to be used in or on foods (EFSA FAF Panel, 2022). Therefore, the safety assessment of naringenin [FL‐no: 16.132] was carried out in accordance with the procedure as outlined in the EFSA scientific opinion ‘Guidance on the data required for the risk assessment of flavourings to be used in or on foods’ (EFSA CEF Panel, 2010a) and the EFSA technical report ‘Proposed template to be used in drafting scientific opinions on flavouring substances (explanatory notes for guidance included)’ (EFSA, 2012).
3. ASSESSMENT
3.1. Technical data
3.1.1. Identity of the substance
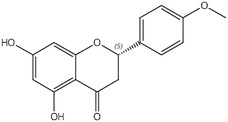
Naringenin (IUPAC name: 4H‐1‐Benzopyran‐4‐one, 2,3‐dihydro‐5,7‐dihydroxy‐2‐(4‐hydroxyphenyl)‐) has been allocated the FLAVIS number [FL‐no: 16.132]. The trivial name of the flavouring substance, naringenin, will be used hereafter. The chemical structure of naringenin and the specification data provided by the applicant are shown in Table 1.
TABLE 1.
Specification data for naringenin as provided by the applicant in the dossier (Documentation provided to EFSA No. 1 and 2).
| Common chemical name IUPAC | CAS no FL‐no FEMA no CoE no JECFA no EINECS no | Structural formula | Phys. form Mol. formula Mol. weight | Solubility a Solubility in ethanol b Solubility in other | Boiling point, °C c Melting point, °C ID test Assay minimum | Refrac. Index d Spec. gravity e | Impurities f | Comments |
|---|---|---|---|---|---|---|---|---|
|
Naringenin 4H‐1‐Benzopyran‐4‐one, 2,3‐dihydro‐5,7‐dihydroxy‐2‐(4‐hydroxyphenyl)‐ |
67604–48‐2 16.132 4797 n.a. n.a. g 207–550‐2 |

|
Beige powder C15H12O5 272.3 (g/mol) |
Almost insoluble; Soluble; Soluble in ether and benzene |
n.a. 251°C IR, NMR, MS ≥ 95% |
– – |
Naringenin‐7‐glucoside, Naringin, Apigenin, Isosakuranetin |
Stereoisomeric composition: R/S (+/−): approximately 50:50% |
Abbreviations: n.a., not applicable; ‘–’, data not available.
Solubility in water, if not otherwise stated.
Solubility in 95% ethanol, if not otherwise stated.
At 760 Torr.
At 20°C, if not otherwise stated.
At 25°C, if not otherwise stated.
See Table 2 for the structural formulas of the impurities.
In 2022 naringenin was evaluated by JECFA with JECFA no. 2257.
3.1.2. Organoleptic characteristics
Naringenin is intended for use as a flavouring substance with flavour modifying properties, in particular, as a bitterness‐masking agent. The applicant provided data on the sensory properties of the flavouring substance to demonstrate its function as a flavour modifier.
3.1.3. Manufacturing process
According to the applicant, naringenin is obtained from grapefruit peels, which contain the precursor glycoside naringin (Documentation provided to EFSA No. 1). Naringin is extracted in hot water and subjected to acid‐mediated hydrolysis after which the solution is subjected to purification steps to obtain naringenin (Figure 1).
FIGURE 1.
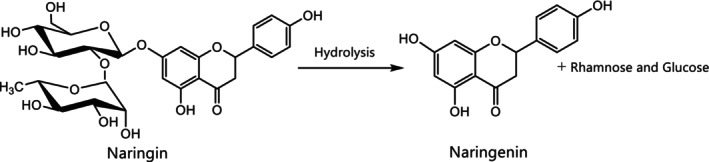
Reaction process to obtain naringenin from the precursor glycoside naringin (Documentation provided to EFSA No. 1).
■■■■■
3.1.4. Proposed specifications
The specifications provided by the applicant for naringenin are summarised in Table 1.
Naringenin has been characterised by infrared spectroscopy (IR), 1H and 13C nuclear magnetic spectroscopy (NMR) and mass spectrometry. The flavouring substance naringenin is a racemate (Table 1).
3.1.4.1. Purity
The purity of naringenin was not less than 95% (i.e. 96.1 ± 0.76%), determined by HPLC in three batches of the flavouring substance. For each batch, a certificate of analysis was provided by the applicant (Documentation provided to EFSA No. 1).
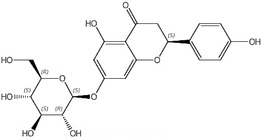
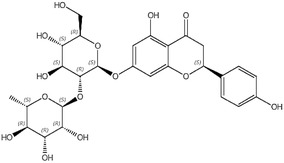
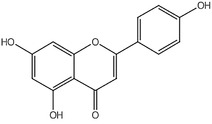
An additional batch (ID088‐L194‐6, purity 98.4%) was tested for impurities, and the following were reported: naringenin‐7‐glucoside and naringin (coeluted; 0.76%), apigenin (0.32%) and isosakuranetin (0.53%) (Documentation provided to EFSA No. 1). Information on the impurities is compiled in Table 2.
TABLE 2.
Impurities identified in naringenin (batch no. ID088‐L194‐6).
| Impurity | FL‐no/CAS‐no | Amount (%) | Structural formula |
|---|---|---|---|
| naringenin 7‐glucoside | 529‐55‐5 | co‐eluting, 0.76 |
|
| naringin | 16.058/10236‐47‐2 |
|
|
| apigenin | 520‐36‐5 | 0.32 |
|
| isosakuranetin | 480‐43‐3 | 0.53 |
|
The presence of toxic elements was investigated in three batches of naringenin. Samples were analysed for lead, cadmium and mercury contents. Samples had levels of toxic elements below the internal specification limits of the applicant, which were 3 mg/kg, 1 mg/kg and 0.1 mg/kg, for Pb, Cd and Hg, respectively (Documentation provided to EFSA No. 1). The Panel noted that arsenic (As) was not investigated by the applicant when performing the analysis for toxic elements. In addition, the same three batches of naringenin were analysed for sulfated ash, the content of which amounted to 0.05 ± 0.04%.
3.1.5. Solubility and particle size
The data on solubility of naringenin in various solvents, as provided by the applicant, are summarised in Table 3. The analytical methods used to determine the solubilities were not specified in the original technical dossier (Documentation provided to EFSA No. 1). The octanol/water partition coefficient of naringenin is 2.52.
TABLE 3.
Solubility data of naringenin as provided by the applicant.
| Solvent (25°C) | Naringenin concentration |
|---|---|
| Water | 50 mg/L |
| Propylene glycol | 2.5% (w/w) corresponding to ~ 25 g/L |
| Ethanol | 10% (w/w) corresponding to ~ 125 g/L |
| Ethanol, 80% | 5% (w/w) corresponding to ~ 60 g/L |
The Panel noted that the solubility of naringenin in water, as reported by the applicant (Table 3), is similar to those reported by Zhang et al. (2013) and Lucas‐Abellán et al. (2019). These two studies showed that the solubility of naringenin in water is moderately increased upon an increase of temperature (e.g. factor of 2; from 25 to 35°C). In addition, Lucas‐Abellán et al. (2019) demonstrated that the solubility of naringenin in water at 25°C increases ~ 20‐fold upon a change of the pH from 6.5 to 8.5. Yeo et al. (2021) and Khan et al. (2015) demonstrated a high solubility of naringenin in lipophilic media.
Following an additional data request from EFSA to assess the potential presence of a fraction of small particles, including nanoparticles (as defined in EFSA Scientific Committee, 2021), in the proposed flavouring substance, the applicant provided results from scanning electron microscopy (SEM) analysis on 10 batches of the product (Documentation provided to EFSA No. 5). The sample was deposited from the dry powder. The applicant reported that particles are not homogeneous and are of random shape (semi‐spherical, rod‐like and other shapes can be found in all the samples) and that the particle size was determined by measuring minimum Feret diameter of the particles (using image analysis software), as requested in the relevant EFSA Guidance on Particle‐TR (EFSA Scientific Committee, 2021). For each batch, 200 representative particles were analysed, and the number‐based size distributions (particle size distribution (PSD)) and descriptive statistics were presented. The latter includes the percentage of the particles smaller than 500 nm, calculated on the total number of particles. The SEM images were captured at ×1500, ×15,000 and ×50,000 magnification, and the PSD was determined based on the ×1,500 and ×15,000 magnification images. The applicant reported that ‘Very small features attached to big particles surface, as can be seen in ×15,000 and ×50,000 images, are not measured, as they can be irregularities that arise from the particles surface. Furthermore, these are not seen on the substrate as single particles’. The results of the analysis show that the percentage of particles (number‐based) with one dimension smaller than 500 nm was ranging from 0% to 6% (average 3.0 ± 2.2%). However, the Panel noted that the SEM images at ×50,000 magnification show small particles in the nanometre scale with well‐defined boundaries, which cannot be considered a part of the irregularity of the surface of the bigger particles, contrary to what is proposed in the report, and should have been considered for the PSD determination.
Therefore, the Panel considered that, based on the data provided, the percentage of small particles including nanoparticles could be higher than reported in the analysis.
3.1.6. Interaction with food components
No data with respect to interactions with food components were submitted. Taking into account the structure, in particular the presence of phenolic groups, possible interactions of naringenin with food components cannot be excluded, however, considering the existing knowledge on other flavonoids in foods, these are not expected to raise a safety concern.
3.1.7. Stability and decomposition products
The stability of naringenin was investigated both as a powder and when in different solutions. The analyses were performed in duplicate. The IDs of the batches subjected to stability testing were not provided.
Stability as powder:
The following experimental conditions were used to test naringenin stability:
Storage at 45 ± 2°C for 1, 2 and 3 weeks (accelerated stability testing). Under accelerated testing conditions, naringenin was shown to remain stable (recovery ranging from 99.9% to 100.4%).
Storage at room temperature (~ 22°C) for 15 and 23 months (long‐term stability testing). Under long‐term testing conditions, representing normal storage conditions, naringenin was shown to remain stable, as indicated by the applicant, for nearly 2 years.
Stability in solution:
The following experimental conditions were used to test the stability of naringenin in solution:
10 g naringenin dissolved in 100 g of propylene glycol and stored at a temperature of 25 ± 2°C with relative humidity of 60 ± 5% for 1, 2, 3 and 4 months.
aqueous buffer solutions (50 mg/kg) adjusted to pH 3, 5 and 7, and incubated at 90°C (accelerated stability testing).
Naringenin was stable for at least 4 months when dissolved in propylene glycol, with recovery ranging from 99.5% to 100.1%. In addition, naringenin was tested in different aqueous buffer solutions (pH 3, 5, 7) at 90°C, and its stability was demonstrated for up to 8 h over the tested pH range.
3.2. Structural/metabolic similarity to substances in an existing FGE
The applicant reported that EFSA assessed the safety of a group of seven related flavonoids for use as flavouring substances in FGE.32 (EFSA CEF Panel, 2010b). These seven flavonoids were all 1,3‐diphenylpropan‐1‐one derivatives with three or four aromatic hydroxy groups. Among these, naringin [FL‐no: 16.058], 5,7‐dihydroxy‐2‐(4‐hydroxy‐3‐methoxyphenyl)‐2,3‐dihydro‐4H‐chromen‐4‐one sodium salt [FL‐no: 16.083] and hesperetin [FL‐no: 16.097] were flavanones and were classified as Cramer Class II. The genotoxicity data available in FGE.32 did not preclude the evaluation through the procedure of these substances.
In FGE.32, the CEF panel concluded that [FL‐no: 16.058, 16.083 and 16.097] can be predicted to be metabolised to innocuous products.
The applicant considered that naringenin is structurally and metabolically related to naringin [FL‐no: 16.058]. Naringenin also is structurally and metabolically related to the two other flavanones considered as part of FGE.32, hesperetin [FL‐no: 16.097] (as well as hesperidin, a glycoside of hesperetin) and 5,7‐dihydroxy‐2‐(4‐hydroxy‐3‐methoxyphenyl)‐2,3‐dihydro‐4H‐chromen‐4‐one sodium salt [FL‐no: 16.083]. Therefore, the applicant proposed that studies conducted with naringin can be used to support the safety of naringenin. For this purpose, the applicant submitted toxicity studies with naringin (Documentation provided to EFSA No. 1).
Initially, the data provided (Documentation provided to EFSA No. 1) were not considered sufficient to support the read‐across between naringenin and naringin, because the different sites of absorption (i.e. naringin has to be metabolised to naringenin by microbial hydrolases in the colon whereas naringenin will be rapidly absorbed from the small intestine) affect the toxicokinetic behaviour of the substance. Further to this, for naringenin, data are available that indicate that this substance may exert oestrogenic activity, a property that was not identified in vitro for the corresponding glycoside naringin. This required substance‐specific information to cover reproductive and developmental toxicity endpoints (see also Section 3.4).
In addition to the newly submitted EOGRT assay (reported in Section 3.4.4.2), the Panel also considered additional ADME data (included in Sections 3.4.1 and 3.4.2). With the information now available, a read‐across between naringin and naringenin is no longer needed.
3.3. Exposure assessment
3.3.1. Natural occurrence in foods
The applicant provided literature data on the natural occurrence of naringenin in food. The substance has been quantified in a wide range of food items (Table 4). The main food providing natural exposure to naringenin are citrus fruits and tomatoes (Bhagwat et al., 2014; Davies & Hobson, 1981; Ho et al., 2000; Paganga et al., 1999; Shirasaka et al., 2013).
TABLE 4.
Natural occurrence levels for naringenin from food and beverages (Documentation provided to EFSA No. 1).
| Food source | Amount of naringenin (mg/kg) | Reference | ||
|---|---|---|---|---|
| Range | Median | Max | ||
| Fresh fruit | 0.108–573.9 | 25 | 573.9 | Davies and Hobson (1981), Justesen et al. (1998), Kawaii et al. (1999), Paganga et al. (1999), Caris‐Veyrat et al. (2004), Biesaga et al. (2009), Bhagwat et al. (2014) a |
| Processed fruit | 25–61.8 | 43.4 | 61.8 | Bugianesi et al. (2002), Caris‐Veyrat et al. (2004) |
| Jams, jellies, marmalades | 45.6 | 45.6 | 45.6 | Bhagwat et al. (2014) a |
| Herbs, spices, seasonings, condiments | 248.6–3720 | 1984.3 | 3720 | Bhagwat et al. (2014) a |
| Vegetables | 19.4–125 | 32.9 | 125 | Bhagwat et al. (2014) a |
| Non‐alcoholic (soft) beverages | 0.00023–425.1 | 23 | 425.1 | Ho et al. (2000), Yáñez et al. (2008), Shirasaka et al. (2013), Bhagwat et al. (2014) a |
| Grape wines | 3.8–17.7 | 16.7 | 17.7 | Bhagwat et al. (2014) a |
| Processed nuts | 4.3 | 4.3 | 4.3 | Bhagwat et al. (2014) a |
The values reported by Bhagwat et al. (2014) are presented as aglycone (naringenin) equivalents. The actual concentration reported for the primary source could be that of the aglycone (naringenin) or a corresponding glycoside (naringin).
The applicant has also provided information on the natural occurrence of structurally related substances (naringin, hesperetin, hesperidin). However, since naringenin is evaluated as a ‘stand‐alone’ flavouring substance, these data are not considered in the evaluation and not presented in this opinion.
3.3.2. Non‐food sources of exposure
Non‐food sources of naringenin were not identified by the applicant.
3.3.3. Chronic dietary exposure
The exposure assessment to be used in the procedure for the safety evaluation of naringenin [FL‐no: 16.132] is the chronic added portions exposure technique (APET) estimate (EFSA CEF Panel, 2010a). The chronic APET for [FL‐no: 16.132] has been calculated for adults and children (see Table 5), and these values, expressed per kg body weight (bw), will be used in the procedure (see Appendices A and B). The chronic APET calculation is based on the proposed normal use levels and the standard portion size (see Appendix B).
TABLE 5.
APET – Chronic dietary exposure as calculated by EFSA.
| Chronic APET | Added as flavouring substance a | Other dietary sources b | Combined c | |||
|---|---|---|---|---|---|---|
| μg/kg bw per day | μg/person per day | μg/kg bw per day | μg/person per day | μg/kg bw per day | μg/person per day | |
| Adults d | 830 | 50,000 | 200 | 12,300 | 950 | 56,900 |
| Children e | 2100 | 31,500 | 500 | 7770 | 2400 | 35,900 |
Abbreviations: APET, added portions exposure technique; bw, body weight.
APET Added is calculated on the basis of the amount of flavouring added to a specific food category.
APET Other dietary sources is calculated based on the natural occurrence of the flavouring in a specified food category.
APET Combined is calculated based on the combined amount of added flavouring and naturally occurring flavouring in a specified food category.
For the adult APET calculation, a 60‐kg person is considered representative.
For the child APET calculation, a 3‐year old child with a 15‐kg bw is considered representative.
Based on the information provided by the applicant, the Panel considered that naringenin is not intended to be used in food category 13.2 (foods for infants and young children).
3.3.4. Acute dietary exposure
The acute APET calculation for [FL‐no: 16.132] is based on the proposed maximum use levels and large portion size (i.e. three times standard portion size) (EFSA CEF Panel, 2010a). According to the applicant, no acute toxicity effects are reported for naringenin, and therefore, no data on acute exposure were provided. Acute exposure has been calculated by EFSA, based on the maximum use levels proposed by the applicant. Results are reported in Table 6.
TABLE 6.
APET – Acute dietary exposure as calculated by EFSA.
| Acute APET | Added as flavouring substance a | Other dietary sources b | Combined c | |||
|---|---|---|---|---|---|---|
| μg/kg bw | μg/person | μg/kg bw | μg/person | μg/kg bw | μg/person | |
| Adults d | 5000 | 300,000 | 6380 | 383,000 | 10,900 | 653,000 |
| Children e | 12,600 | 189,000 | 16,100 | 241,000 | 27,400 | 411,000 |
Abbreviations: APET, added portions exposure technique; bw, body weight.
APET Added is calculated on the basis of the maximum amount of flavouring added to a specific food category.
APET Other dietary sources are calculated based on the natural occurrence of the flavouring in a specified food category.
APET Combined is calculated based on the combined amount of added flavouring and naturally occurring flavouring in a specified food category.
For the adult APET calculation, a 60‐kg person is considered representative.
For the child APET calculation, a 3‐year‐old child with a 15‐kg bw is considered representative.
3.3.5. Cumulative dietary exposure
The applicant calculated the cumulative exposure with naringin [FL‐no: 16.058], hesperetin [FL‐no: 16.097], 5,7‐dihydroxy‐2‐(4‐hydroxy‐3‐methoxyphenyl)‐2,3‐dihydro‐4H‐choromen‐4‐one sodium salt [FL‐no: 16.083] and hesperidin (the glycoside of hesperetin). However, the Panel evaluated naringenin as a ‘stand‐alone’ substance, and therefore, the calculation of the cumulative exposure was not applied.
3.4. Biological and toxicological data
3.4.1. Absorption, distribution, metabolism and elimination
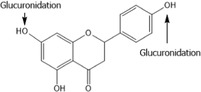
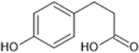
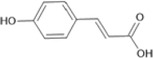
Naringenin is rapidly absorbed following oral administration and is subject to phase I and phase II metabolic reactions (primarily conjugation with glucuronic acid and/or sulfate) following oral administration. This is followed by excretion of naringenin and its conjugates via bile (in rats) and urine. Any remaining naringenin that is not absorbed within the upper portion of the gastrointestinal tract passes into the colon, where it is subject to microbial metabolism to phenolic acids such as p‐hydroxyphenylpropionic acid, p‐coumaric acid and p‐hydroxybenzoic acid (EFSA CEF Panel, 2010b, 2017).
Studies on the toxicokinetics of naringenin in human and animals are reported below.
Human toxicokinetics data
Studies on human toxicokinetics for naringenin were already reviewed by the CEF Panel (EFSA CEF Panel, 2017). Kanaze et al. (2007) studied the toxicokinetics and metabolism of 95% pure racemic naringenin (and hesperetin) in six human volunteers after a single oral dose of 135 mg in a solid dispersion capsule. Naringenin is rapidly absorbed: already after 20 min, it appeared in plasma and reached a peak concentration of 2010 ± 770 ng/mL plasma (7.4 μM, determined as total naringenin, including the glucuronide and sulfate conjugate) after 4 h. Half‐life of elimination was 2.31 ± 0.40 h. Only 5.81 ± 0.81% of the dose was recovered in urine during 24 h after dosing. This suggests a major contribution of metabolism other than conjugation, such as cleavage of the central ring of naringenin in the intestine, as discussed by the authors. They also discuss the difference in toxicokinetics between naringenin and its precursor naringin: The latter is more slowly absorbed after hydrolysis in the colon in humans. This was also observed in studies in the rat receiving a meal with naringenin or naringin (Felgines et al., 2000). The same has been shown for the flavanone hesperidin and its aglycone hesperetin by Nielsen et al. (2006) in a cross‐over trial in human volunteers. Absorption of hesperetin is more rapid when it is a glucoside than when it is in the form of its naturally occurring glycoside hesperidin, containing a rutoside (rhamnose‐glucose) group. The reason is that hesperetin‐glucoside is already rapidly hydrolysed in the small intestine, while the hydrolysis of the rutoside only takes place in the colon (Actis‐Goretta et al., 2015). The FAF Panel noted that the sugar moiety in hesperidin differs from naringin, which may result in different rates of hydrolysis.
Rebello et al. (2020) studied the kinetics of naringenin (present at 24% in a sweet orange extract) given in capsules at 150 or 600 mg (551 μmol or 2204 μmol) to healthy volunteers (n = 6 per dose group). Naringenin reached after 2 h a peak concentration in plasma of 15.8 ± 7.9 μmol/L and 48.5 ± 7.9 μmol/L (as total naringenin, including the glucuronide and sulfate conjugate). Naringenin half‐life in plasma was 3 h (at 150 mg) and 2.65 h (at 600 mg). The AUC0‐24h values were 67.61 ± 24.26 μmol/L × h and 199.05 ± 24.36 μmol/L × h, respectively. The authors did not analyse urine in this study. Conjugated naringenin, but no unconjugated naringenin, was also a main form present in human plasma upon ingestion of tomato paste (Bugianesi et al., 2002).
Further studies analysed plasma kinetics and urinary excretion of naringenin and hesperitin in human volunteers after consumption of citrus fruit juices with the glycoside precursors naringin, narirutin and hesperidin (details in Appendix C, Table C.1). Data reported by Erlund et al. (2001), Gardana et al. (2007), Pereira‐Caro et al. (2014) and Aschoff et al. (2016) confirm the bioavailability of the flavanones from food. Plasma concentration–time curves of individuals consuming the glycosides showed large interindividual variations in C max and AUC0‐24h values for the released aglycones (Erlund et al., 2001; Gardana et al., 2007). The variation in bioavailability among subjects receiving the same dose (μmol/ kg bw) is proposed to be due to differences in their gastrointestinal microbiota. Also the relative urinary excretion of total naringenin varied, depending on the source and dose of precursor provided (between 1% and 30% of the dose in Erlund et al., 2001; 12.9% and 20.3% of the dose in Aschoff et al., 2016). The rather low fraction recovered in urine (virtually completely in the form of conjugates) points to other, non‐renal routes of excretion, i.e. bile and faeces, the main route of excretion in rodents (see below), or to urinary metabolites which were not investigated. In fact, refined analysis of human urines reveals in addition to naringenin conjugates also the presence of phenolic acids (Aschoff et al., 2016; Pereira‐Caro et al., 2014; Zeng et al., 2016). The phenolic acids were not included in earlier studies in humans so that this could not be used for mass balance estimation. However, the reporting by Pereira‐Caro et al. (2014) is too limited to calculate a mass balance for naringenin from the study.
In the Kanaze et al. (2007) study, a peak plasma level of naringenin was observed 3.5 h after ingestion of the substance. Peak plasma levels of naringenin were observed by Erlund et al. (2001) and by Gardana et al. (2007) at approximately the same time after ingestion of orange or grapefruit juice, which contains naringenin predominantly in the form of naringin. This may indicate that the site of absorption of naringenin may not depend on the form in which it is ingested (aglycone or glycoside). However, these studies are not directly comparable and considering the other information available (e.g. Felgines et al., 2000; Nielsen et al., 2006), the Panel concluded that the assumption (made in the opinion FGE.410 [EFSA CEF Panel, 2017]) that naringenin (aglycone) is absorbed in the upper part of the GI tract, while naringenin ingested as glycoside (i.e. naringin) is absorbed in the lower part of the GI tract, cannot be entirely dismissed.
The human studies indicate that when naringenin is released from flavanone glycosides (naringin, narirutin) by intestinal bacterial enzymes, its further fate in the organism concurs with that described above in the kinetic study with the aglycone (Kanaze et al., 2007). The main metabolites found in plasma and excreted in human urines are glucuronides and sulfates. Moreover, several products of microbial flavanone degradation have been identified in human urine (Aschoff et al., 2016; Pereira‐Caro et al., 2014; Zeng et al., 2016). The products from microbial metabolism of flavanones have been found also in incubations with faecal preparations from humans or pigs as well as several other species (see Table C.4 in Appendix C).
Animal toxicokinetics data
As reported in FGE.410 (EFSA CEF Panel, 2017), similar rapid absorption of naringenin after oral administration was also observed in several other species, such as mouse, rat and rabbit (Hsiu et al., 2002; Ke et al., 2013; Ma et al., 2006).
Ma et al. (2006) studied toxicokinetics of naringenin in the rat. Naringenin (purity > 95%) was administered to male and female Wistar rats (5/sex/group) at doses of 30, 90 or 270 mg/kg bw by oral gavage following an overnight fast. They also investigated the role of biliary excretion and enterohepatic recirculation of naringenin in bile duct‐cannulated rats. The maximum plasma concentration (Cmax) of unconjugated naringenin was reached within 15 min of naringenin administration (2.9, 3.7 and 4.4 ng/mL for the 30, 90 or 270 mg/kg bw groups, respectively), whereas the Cmax for total naringenin (including the conjugates) was reached at 0.5, 2 and 2 h following administration of 30, 90 or 270 mg naringenin/kg bw, respectively (16.9, 28 and 43.8 ng/mL, respectively). A dose‐dependent increase in the area under the curve (AUC) of unconjugated and total naringenin was observed. The plasma half‐life of total naringenin was determined to be 7.6 and 10.5 h for the 90 and 270 mg/kg bw groups, respectively, and the respective mean residence time was 7.9 and 8.6 h. The authors noted that the slow rate of elimination of naringenin may be attributed to glucuronidation and enterohepatic circulation: Naringenin was excreted in bile as a glucuronide conjugate. Twice as much naringenin was excreted in bile (12%) than in urine (6.25%). In comparison to rats without bile duct cannulation, the plasma concentration of total naringenin in bile duct‐cannulated rats was lower and the concentration versus time profile lacked double peaks, confirming that naringenin undergoes enterohepatic circulation under normal circumstances.
Two studies were conducted to assess potential differences in the toxicokinetics related to the different enantiomers (R/S) of naringenin (Wan et al., 2011; Yáñez et al., 2008). Following oral administration to rats, the toxicokinetic parameters for the two enantiomers were largely similar.
Wang et al. (2006) studied the kinetics of naringenin and of naringin in groups of male Sprague Dawely rats (8 animals per group) given an equimolar dose (184 μmol/kg bw) of the aglycone (50 mg/kg bw) or the glycoside (107 mg/kg bw) by gavage. Serum samples obtained between 5 and 1440 min were analysed prior and after enzymatic hydrolysis with ß‐glucuronidase and sulfatase, respectively, to quantify both unconjugated and conjugated metabolites. Concentration–time profiles revealed higher levels of sulfates than glucuronides after administration of naringenin or naringin; unmetabolised flavanone was not detected in most serum samples. The C max and AUC values for naringenin conjugates were 3‐ to 10‐fold higher after administration of naringenin than dosing with naringin and the time for C max levels were shorter after aglycone compared to glycoside administration. The data indicate higher bioavailability for naringenin than naringin in rats and thus confirm findings from an earlier study by Felgines et al. (2000).
3.4.2. Metabolism
Metabolism of naringenin
Metabolism of naringenin takes place primarily in the cells of the intestine walls, the liver and the microbiota in the colon.
As reported in FGE.410 (EFSA CEF Panel, 2017), conjugation of naringenin to form sulfate and glucuronide conjugates is a major pathway of metabolism. However, in the available studies, most of the compound administered is unaccounted for: recovery in urine as (un)conjugated [FL‐no: 16.132] is relatively low (5%–30% in 24 h). Presumably, most of it is either excreted with the faeces and/or metabolised (by the colon microbiota) to other metabolites (see below) which are not routinely detected. Results of studies with stomach and intestinal perfusions in mice demonstrated that naringenin was also metabolised to apigenin (Orrego‐Lagarón et al., 2016). Ring cleavage by the intestinal microbiota has been reported, resulting in metabolites such as p‐hydroxyphenylpropionic acid, p‐coumaric acid and p‐hydroxybenzoic acid (Felgines et al., 2000). These authors fed a diet containing 9.2 mmol/kg feed of naringenin to rats for one meal, resulting in an intake of approximately 230 μmol/rat. In urine, ~ 30% was excreted as conjugated naringenin and 10% as ring‐cleaved metabolites in the next 24 h (calculations by the CEF Panel (EFSA CEF Panel, 2017)). Naringenin was also found in caecal contents (15 μmol/caecum) at 10 h post dosing, but faecal excretion was not further quantified (Felgines et al., 2000).
The Panel considered that microbiota in the GI‐tract play an important role in the metabolism of naringenin. However, since most of the available studies are in rodents and there could be differences with the human microbiota, it is important to clarify if in humans only innocuous metabolites are expected. 3 This is particularly relevant considering the high exposure proposed for naringenin which is above the TTC for Class III (90 μg/person/day). Therefore, the Panel requested a detailed assessment of all available relevant evidence to determine whether there is sufficient similarity in the metabolic fate of naringenin between humans and rodents.
Following this request, the applicant provided literature data on metabolism, in particular by microbiota, of naringenin and other flavanones in different species (Documentation provided to EFSA No. 4). In humans volunteers the characterisation of naringenin metabolites is restricted to the glucuronic acid and sulfate conjugates, accounting for only ~ 20% of the dose. In addition, human faecal bacterial cultures can convert naringenin to 3‐phenylpropionic acid, 4‐hydroxyphenylacetic acid and 4‐hydroxybenzoic acid (see Table 7), all of which have been shown to be metabolites of naringenin and of naringin in either rats or mice. A further metabolite found in rats (4‐hydroxycinnamic acid) and a further two metabolites found in mice (4‐hydroxyhippuric acid and hippuric acid) were not produced by human microbiota. In addition, it is noted that upon dosing of rats with naringin, material residing in tissues consists virtually completely of conjugates of naringenin (Lin et al., 2014).
TABLE 7.
Metabolites of naringenin detected in mice (M), rats (R), rabbits (L), humans (H) and in incubations with human faecal microorganisms (F) or specific bacteria strains (B) (Documentation provided to EFSA No. 3).
| Metabolites | Species | Reference |
|---|---|---|
|
Naringenin glucuronide
|
M,R, L,H | Abd El Mohsen et al. (2004), Abe et al. (1993), Booth et al. (1957), Felgines et al. (2000), Kanaze et al. (2007), Orrego‐Lagarón et al. (2015), Orrego‐Lagarón et al. (2016), Shinkaruk et al. (2010), Wang et al. (2006), Yáñez et al. (2008) |
|
Naringenin sulfate
|
M,R,L,H | Abe et al. (1993), Felgines et al. (2000), Kanaze et al. (2007), Orrego‐Lagarón et al. (2015), Orrego‐Lagarón et al. (2016), Shinkaruk et al. (2010), Wang et al. (2006) |
|
Phloroglucinol
|
M,F | Justesen et al. (2000), Kim et al. (1998), Labib et al. (2004), Orrego‐Lagarón et al. (2016), Rechner et al. (2004) |
|
3‐(4‐hydroxyphenyl)propionic acid
|
M,R,F,B | Abd El Mohsen et al. (2004), Felgines et al. (2000), Justesen et al. (2000), Labib et al. (2004), Orrego‐Lagarón et al. (2015), Orrego‐Lagarón et al. (2016), Pereira‐Caro et al. (2015), Rechner et al. (2004), Schneider and Blaut (2000), Schoefer et al. (2003), Zou et al. (2015) |
|
3‐phenylpropionic acid
|
M,F,B | Labib et al. (2004), Orrego‐Lagarón et al. (2015), Orrego‐Lagarón et al. (2016), Pereira‐Caro et al. (2015), Pereira‐Caro et al. (2016), Pereira‐Caro et al. (2018) |
|
4‐hydroxyphenylacetic acid
|
M,F | Kim et al. (1998), Orrego‐Lagarón et al. (2015), Orrego‐Lagarón et al. (2016), Pereira‐Caro et al. (2015) |
|
4‐hydroxycinnamic acid
|
R | Felgines et al. (2000) |
|
4‐hydroxybenzoic acid
|
R,F | Abd El Mohsen et al. (2004), Felgines et al. (2000), Kim et al. (1998) |
|
4‐hydroxyhippuric acid
|
M | Orrego‐Lagarón et al. (2015), Orrego‐Lagarón et al. (2016) |
|
Hippuric acid
|
M | Orrego‐Lagarón et al. (2015), Orrego‐Lagarón et al. (2016) |


Previously, the CEF panel noted that the two flavanones hesperetin and naringenin are excreted in rats as glucuronic acid and sulfate conjugates thereby demonstrating similar metabolism (EFSA CEF Panel, 2017). In light of the information (above) provided on the metabolites produced from naringenin by human microbiota, the FAF Panel considered that there is sufficient evidence to support the conclusion that the metabolic profiles of naringenin and its glycoside naringin are similar and that although their kinetics might be different and that no full mass balance is available for naringenin, it can be concluded that naringenin is metabolised to innocuous substances only. Consequently, the Panel considered that naringenin can be evaluated via the A side of the procedure (see Appendix A, Figure A.1).
3.4.3. Genotoxicity
The applicant provided literature data on naringenin tested in bacterial reverse mutation assays (Brown & Dietrich, 1979; Nagao et al., 1981; Sugimura et al., 1977). These studies (Documentation provided to EFSA No. 1) presented some shortcomings (e.g. Salmonella typhimurium strain TA102 or Escherichia coli WP2 were not tested) and were not fully reliable. Therefore, the applicant was requested to test naringenin in a bacterial reverse mutation assay and in an in vitro micronucleus (MN) assay, according to OECD test guidelines (TG) 471 and 487, respectively. In case of positive results, an in vivo follow‐up study should be performed as recommended by the EFSA Scientific Committee Genotoxicity testing strategy (EFSA Scientific Committee, 2011). The applicant provided: a bacterial reverse mutation assay (Envigo Research Limited, 2018a), an in vitro MN assay (Envigo Research Limited, 2018b) and an in vivo combined MN and comet assay (Eurofins Biopharma, 2019a, 2019b). These studies are described below and summarised in Appendix D.
3.4.3.1. Bacterial reverse mutation assay
Naringenin (purity 96.1%) was tested in a bacterial reverse mutation assay in tester strains of Salmonella typhimurium (TA98, TA100, TA102, TA1535, TA1537) and E. coli WP2uvrA. The substance was tested with plate incorporation and pre‐incubation methods in triplicate, both in the presence and in the absence of metabolic activation (S9‐mix, from phenobarbital/β‐naphthoflavone induced rats). Vehicle control (dimethyl sulfoxide (DMSO)) and appropriate positive controls were included (Envigo Research Limited, 2018a). This study met the acceptability criteria of OECD TG 471 (OECD, 1997) and was in compliance with GLP.
Although the test was conducted according to GLP, the study authors indicated that no analysis was carried out to determine homogeneity, concentration or stability of the test item formulation. However, the test item formulation (in DMSO) was prepared within 4 h before testing. The study authors assumed that the formulation was stable during that time. In the light of the information on solubility and on stability (Section 3.1), the Panel concurs with this view.
In a concentration range‐finder experiment, naringenin was tested (in triplicate) at concentrations ranging from 1.5 to 5000 μg/plate, using the plate incorporation method both in the absence and in the presence of S9‐mix. Reduction in the growth of the bacterial background lawns was observed from 1500 μg/plate for TA1537 and at 5000 μg/plate for all bacterial strains. In this experiment, no increase in the frequency of revertant colonies was observed; therefore, the main experiment was performed applying the pre‐incubation method using the same concentrations (ranging from 1.5 to 5000 μg/plate).
In the main experiment, a slightly stronger toxicity was observed with a reduction of the bacterial background lawns observed from 1500 μg/plate (TA100, TA102, TA1535 and TA1537) and at 5000 μg/plate (TA98 and E. coli WP2uvrA) both in the absence and in the presence of S9‐mix.
No test item precipitate was observed in both experiments.
Only in strain TA102, a statistically significant increase (p < 0.05) in the frequency of revertant colonies was observed at one testing concentration (50 μg/plate) in the absence of S9‐mix (262 ± 23.8). This value was inside the range of historical controls (observed range from 216 to 340) and was considered not biologically relevant. No biologically relevant increase in the number of revertant colonies was reported in any other strain tested, with or without S9‐mix. Thus, the result of the study was considered negative.
The Panel concluded that naringenin did not induce gene mutations in bacteria under the conditions of this study.
The Panel considered the study reliable without restrictions and the result of high relevance.
3.4.3.2. In vitro micronucleus assay
Naringenin (purity 96.1%) was tested in an in vitro micronucleus assay in human peripheral blood lymphocytes both in the presence and in the absence of metabolic activation (S9‐mix, from phenobarbital/β‐naphthoflavone induced rats). Vehicle control (DMSO) and appropriate positive controls were included: mitomycin C (MMC), cyclophosphamide (CP), demecolcine (DC) (Envigo Research Limited, 2018b). Treatment with naringenin started after a 48‐h stimulation period with phytohaemagglutinin. The study met the acceptability criteria of OECD TG 487 (OECD, 2016a) and was in compliance with GLP.
Although the test was conducted according to GLP, the study authors indicated that no analysis was carried out to determine homogeneity, concentration or stability of the test item formulation. However, the test item formulation (in DMSO) was prepared within 2 h before testing. The study authors assumed that the formulation was stable during that time. In the light of the information on solubility and on stability (Section 3.1), the panel concurs with this view.
Cytochalasin B (cytoB) was applied in all testing conditions: 4 h treatment followed by 24 h of recovery period (4 + 24 h) in the presence or absence of S9‐mix and 24‐h treatment followed by 24 h of recovery period (24 + 24 h). In this extended treatment, cytoB was added only at the end of the 24‐h treatment and then incubated for further 24 h. The Panel noted that the extended treatment exposure conditions differed from the suggested cell treatment schedule in OECD TG 487 (OECD, 2016a). However, the Panel considered that the protocol applied for the extended treatment could potentially enhance the sensitivity of the MN test (Whitwell et al., 2019a). Therefore, the Panel did not consider this aspect as a limitation.
In a concentration range‐finder experiment, naringenin was tested at concentrations ranging from 7.81 to 2000 μg/mL. From this study, 250 μg/mL was selected as the highest concentration for the main test, based on cytotoxicity, evaluated as decreased Cytokinesis Block Proliferative Index (CBPI).
In the main experiment, concentrations from 25 to 250 μg/mL were tested for all three testing conditions in duplicate. The frequency of micronucleated cells in 2000 binucleated cells per concentration was analysed.
Cytotoxicity was similar to that observed in the preliminary experiment. A concentration‐related inhibition of CBPI was observed in all the three treatment conditions. No precipitate was observed.
Based on the level of cytotoxicity observed, the highest concentrations selected for the analysis of binucleated cells with micronuclei (MNBN) were 250 μg/mL and 200 μg/mL for the 4 + 24h treatment in the absence and in the presence of S9‐mix, respectively, and 150 μg/mL for the 24 h + 24 h treatment.
At 4 h + 24 h treatment in the absence of S9‐mix, a statistically significant increase in MNBN frequency was observed at 200 μg/mL (2.3%) and 250 μg/mL (3.2%) (cytostasis of 39% and 75%, respectively) compared to the vehicle control (1.15%).
At 4 h + 24 h treatment in the presence of S9‐mix, a statistically significant increase in MNBN frequency was observed at 200 μg/mL (4.75%, cytostasis of 35%) compared to the vehicle control (1.2%).
At 24 h + 24 h treatment, no statistically significant increase in MNBN frequency was observed.
For all the treatments, the MNBN frequency observed in the vehicle control was above the upper bound of the 95% confidence interval of historical controls, but inside the observed historical control range.
The study authors analysed not only binucleated cells but also mononucleated cells for the presence of MN. Since no statistically significant increase in MN was observed in mononucleated cells, the study authors concluded that naringenin was clastogenic. However, the Panel did not consider that the evidence was sufficient for this conclusion and requested to further investigate the mechanism of MN induction through an in vitro MN assay with fluorescence in situ hybridization (FISH) analysis.
The FISH analysis was applied to the following slides from the in vitro micronucleus assay (Envigo Research Limited, 2018b; Creative Bioarray, 2019): vehicle control, positive control (CP), naringenin 75, 200 and 250 μg/mL (4‐h treatment with or without S9‐mix). The positive control for clastogenicity (CP) showed 80% of MN centromere‐negative. No control for aneugenicity was included. Naringenin samples showed that MN were predominantly centromere negative (> 64% for all concentrations tested, in the presence or in the absence of S9‐mix) (Creative Bioarray, 2019). The Panel concluded that naringenin induced micronuclei in human peripheral blood lymphocytes, via predominant clastogenic mechanism.
The Panel considered the study reliable without restrictions and the results of high relevance.
Since in vitro data showed that naringenin induced MN via a clastogenic mechanism, this effect was studied in vivo in a combined MN (peripheral blood erythrocytes) and comet assay (liver and duodenum).
3.4.3.3. In vivo combined MN and comet assay
The genotoxic potential of naringenin (purity 95.9%) was assessed in vivo using the mammalian erythrocyte micronucleus test combined with the comet assay in Wistar rats (Eurofins Biopharma, 2019a, 2019b). The study was conducted in compliance with GLP. The micronucleus assay and the comet assay were conducted in accordance with OECD TG 474 (OECD, 2016b) and OECD TG 489 (OECD, 2016c), respectively.
Rats were dosed via gavage at 0, 24 and 45 h. Naringenin was suspended in aqua ad iniectabilia (used as vehicle control) at a concentration of 200 mg/mL. Animals received a single volume of 10 mL/kg bw per day. As positive control for the comet assay, ethyl methanesulfonate (EMS) 200 mg/kg bw was administered by gavage 4 h before sacrifice. As positive control for the MN assay, cyclophosphamide (CPA) 10 mg/kg bw was administered 48 h before sacrifice (Eurofins Biopharma, 2019a, 2019b).
In order to determine the maximum tolerated dose (MTD), one male and one female rat were administered naringenin three times (at 0, 24 and 45 h) at a dose level of 2000 mg/kg bw per day. Since no signs of toxicity were observed, two additional male and female rats were tested. The study authors considered 2000 mg/kg bw per day as the MTD. No results on toxicity are reported in the study. As no gender‐specific effects were seen, only male rats were used in the main study.
In the main experiment, male rats (5 animals per dose group) were dosed at 500, 1000, 2000 mg/kg bw per day for three consecutive days. To verify systemic exposure, blood samples were collected from animals of the highest dose group at 1 and 2 h after the last administration. At sacrifice, blood was sampled from all animals of the vehicle and of the highest dose group. No clinical signs of toxicity and no variations in body weight were observed.
In an attempt to demonstrate systemic exposure, analysis of the plasma samples collected during this study was performed (Eurofins Biopharma, 2019c). Naringenin in rat plasma was quantified via a precipitation method followed by LC‐MS/MS detection. Ten rat plasma samples from animals of the highest dose group were analysed for quantification of naringenin. The data of the plasma analysis showed concentrations of naringenin ranging between 676 and 5355 ng/mL (calibration of standard curve in the range of 10–2000 ng/mL) at 1‐, 2‐ and 3‐h post‐dosing demonstrating systemic exposure to naringenin.
Micronucleus assay
Peripheral blood samples were collected 3 h after the last administration. For all dose groups, 10,000 polychromatic erythrocytes (PCE) per animal were scored for the incidence of micronucleated polychromatic erythrocytes (MNPCE) through flow cytometry. The positive control CPA produced a statistically significant increase in the frequency of MNPCE (0.93 ± 0.16% MNPCE). Naringenin induced a maximum % MNPCE frequency of 0.08 ± 0.01%, at the mid‐dose, which was not statistically significantly different from the negative controls (0.10 ± 0.02%). At the naringenin doses of 500 and 2000 mg/kg bw per day, a statistically significant decrease in MNPCE was observed (0.06 ± 0.01% and 0.06 ± 0.02%). The values of MNPCE % for blood cells from vehicle control and from naringenin dosed animals were inside the range of historical negative control (95% confidence range 0.04%–0.12%, based on four experiments only).
The study authors reported that no clinical signs of toxicity were observed (although data on the parameters analysed were not included in the study report). The analysis of naringenin in plasma of animals of the highest dose group indicates systemic exposure to naringenin. Moreover, the mean values for % PCE (relative to the total erythrocyte counts) were 0.87%, 0.89% and 0.86% for 500, 1000 and 2000 mg/kg, respectively, compared to 1.28% for the negative control suggesting evidence for cytotoxicity, which also indicates bone marrow exposure.
Thus, the in vivo MN assay in peripheral blood can be considered reliable without restrictions and the result of high relevance.
Comet assay
Liver and duodenum cells were prepared for comet analysis. Tail intensity (%) of a total of 150 cells per animal was recorded. Both in liver and duodenum, no statistically significant increase in group mean tail intensity values was observed in any test substance treatment group compared to the vehicle control group. The positive control provided statistically significant increases in % tail intensity of 19.67 and 18.30 for duodenum and liver, respectively. For the naringenin treatment groups, the mean % tail intensities ranged from 1.26 to 1.5 in either tissue compared to 1.13 and 1.91 for the vehicle control in duodenum and liver, respectively. The values for naringenin treatments were also within the historical control values.
The Panel concluded that naringenin did not induce primary DNA damage in either tissue. The Panel considered the study reliable without restrictions and the result of high relevance.
3.4.3.4. Conclusion on genotoxicity
Naringenin did not induce gene mutations in the bacterial reverse mutation assay. Naringenin was clastogenic in the in vitro micronucleus assay. However, it was not genotoxic in the in vivo comet assay in liver and duodenum and in the in vivo micronucleus assay in peripheral blood. Therefore, there is no concern with respect to genotoxicity and the substance can be evaluated through the Procedure.
3.4.4. Toxicity data
In the first data submission (Documentation provided to EFSA No. 1), the applicant submitted studies on naringenin related to different effects, e.g. effects of naringenin on gastric carcinogenesis induced by N‐methyl‐N′‐nitro‐N‐nitrosoguanidine (MNNG)/saturated sodium chloride in rats (Ganapathy et al., 2008); the in vivo antidiabetic effects of naringenin in normoglycaemic and streptozotoxin‐induced diabetic rat models (Ortiz‐Andrade et al., 2008) and the effect of naringenin on simvastatin‐induced hepatic damage in rats (Motawi et al., 2014). Since these studies address possible beneficial effects of naringenin rather than its toxicity, they will not be discussed here further. Short summaries are presented in Appendix E, focusing on some toxicological parameters analysed in these studies. According to the applicant, naringenin did not show toxicity in these publications, but these studies were not designed to investigate the toxicity of naringenin, except for the one by Ortiz‐Andrade et al. (2008), who included acute toxicity (LD50) studies in mice and rats in their investigations. A separate LD50 acute toxicity study with naringenin by Selvam and Kaliyaperumal (2015) was also submitted. For the safety evaluation, the applicant submitted further toxicity studies on the naringenin‐precursor naringin [FL‐no: 16.058] proposed as supporting substance: acute and 13‐week oral toxicity studies in rats (Li et al., 2013) and a 6‐month oral toxicity study, also in rats (Li et al., 2014).
Some statistically significant changes were observed in these studies (e.g. decrease body weight gain in both males and females, effects on haematological parameters), which were considered by the study authors (Li et al., 2013, 2014) as not toxicologically relevant. Therefore, they proposed a NOAEL for naringin higher than the highest dose tested (1250 mg/kg bw per day). The Panel noted that these studies complied only partially with the OECD TG 408 (OECD, 2018a) requirements (e.g. dosing was 6 days per week instead of 7 days per week).
The studies by Li et al. (2013, 2014) reported above were on the glycoside naringin rather than the aglycone naringenin. An anticipated difference in the site of absorption between naringenin administered as aglycone or naringenin administered in the form of its glycoside could lead to differences in plasma kinetics of naringenin, depending on the form in which it is administered. In addition, for naringenin data indicated that it could interact with oestrogen receptors while for naringin no such indications were available. Therefore, the Panel considered that the toxicity studies on naringin could not be used for the safety evaluation of naringenin and requested data from toxicological studies with naringenin itself. The data on naringenin received following this request were evaluated as follows.
3.4.4.1. Naringenin and oestrogenic activity
The CEF Panel already discussed in FGE.32 (EFSA CEF Panel, 2010b) the potential oestrogenic activity of naringenin.
The applicant submitted extensive literature data (Documentation provided to EFSA No. 1 and No. 4) demonstrating that naringenin interacts in vitro with oestrogen receptors alpha and beta (e.g. Branham et al., 2002; Takeuchi et al., 2009; Amer et al., 2010; Huang et al., 2010; Kim and Park, 2013) inducing both genomic and non‐genomic signalling (Totta et al., 2004).
In the available in vivo studies, naringenin induced uterotrophic effects in mice (Breinholt et al., 2004; Swarnkar et al., 2012) but not in rats (Ruh et al., 1995; Saarinen et al., 2001). In all four studies, ovariectomised or sexually immature animals were used.
The applicant provided data from a 28‐day dose range‐finding study in Wistar rats with exposure starting at the age of 7–8 weeks, including the assessment of uterus weight (BSL Bioservice, 2019). Naringenin was administered via gavage at doses from 1000 to 5000 mg/kg bw per day. Mortality was observed at the highest dose tested. No test item‐related effects were observed up to 4000 mg/kg bw per day (including haematological, clinical chemistry parameters and organ weights). Although no effects on uterus weight were found, this cannot be considered as convincing evidence of the absence of uterotrophic activity since this should be studied in ovariectomised or sexually immature animals.
The applicant considered the human‐relevant potency threshold (HRPT) according to the procedure proposed by Borgert et al. (2018). The HRPT is defined as the minimum level of mechanistic potency necessary for a chemical to be able to act via a particular mode of action in humans. Based on in vitro ERα agonism and in vivo uterotrophic activity, Borgert et al. (2018) proposed an HRPT for ERα agonism of 10−4, relative to the potency of 17β‐oestradiol. Naringenin has been reported to have relative potency compared to 17β‐oestradiol for oestrogenic activity ranging from 1.9 × 10⁻⁶ to 2 × 10⁻⁴, (Borgert et al., 2018), which by the criterion it may be considered as an indication of possible endocrine activity in humans. The Panel noted that the HRPT was established only for ERα receptor.
The Panel also noted that in vitro studies showed that naringenin has a stronger affinity with ERβ than ERα (Helle et al., 2015). Considering also some indications on a possible anti‐androgenic activity of naringenin in vivo (Zierau et al., 2012), the panel considered that potential adverse effects on male and female reproduction should be investigated.
In order to evaluate the potential adverse effects induced by naringenin's endocrine/endocrine‐disrupting activity and based on the data requirements of the evaluation scheme (Appendix A), the Panel requested an extended one‐generation toxicity (EOGRT) study on naringenin (OECD TG 443) including at least the cohorts that address subchronic, developmental and reproductive toxicity (i.e. cohorts 1A and 1B) and an investigation of reproductive performance and fertility of the 1B cohort in a follow‐up mating in the F1 generation.
3.4.4.2. Extended one‐generation reproductive toxicity study
The extended one‐generation reproductive toxicity (EOGRT) study was performed in male and female rats according to OECD TG 443 (OECD, 2018b) and good laboratory practice (GLP) compliance (Bioneeds, 2022).
3.4.4.2.1. Dose‐range finding study
A dose range‐finding study was performed to identify the appropriate dose levels for the EOGRT assay. The study design followed broadly the OECD TG 421 (OECD, 2016d) for a combined 28‐day oral toxicity/developmental toxicity study, but it did not include a functional observational battery (FOB).
Sprague Dawley rats (10 animals per sex and per group) were treated at dietary concentrations of naringenin (purity 95.8%) of 0, 16,000, 20,000 and 25,000 mg/kg (dose groups G1–G4) equal to 0, 1394, 1724 and 2205 mg/kg bw per day in males and 0, 1671, 2192 and 2724 mg/kg bw per day in females. Naringenin was administered as an admixture with rodent powder diet (Bioneeds, 2021a).
Homogeneity and test diet concentrations were not verified, but stability of naringenin in rodent feed diet was determined in a separate study and was demonstrated to be sufficient over the duration of the study (Bioneeds, 2021b).
Males were dosed for 14 days pre‐mating and up to a total of 29 days before sacrifice on day 30. Females were dosed for 14 days premating then up to day 13 of lactation, totalling 51–62 days. During premating and then mating periods animals were housed in pairs until mating confirmed. Feed consumption was not measured during these paired periods. However, feed consumption was measured in both pregnant and non‐pregnant females.
Mean feed consumption during pre‐mating, gestation and lactation periods did not reveal any changes between treated and control groups.
No clinical signs of toxicity, no mortality or morbidity were noted in any of the animals.
Mean absolute body weights were not affected by the test item administration in males or females, and during gestational and lactation periods.
Haematological, clinical chemistry and urinalysis parameters were analysed for five animals per sex from each group at termination. There were no haematological, clinical chemistry, urinalysis or gross pathological changes, and the mean absolute and relative organ weights were not affected by naringenin administration.
The Panel noted that a dose‐related decrease in both absolute and relative adrenal and ovary weights was noted in females, reaching > 10% reduction compared to controls at the high‐dose level (G4); these findings were not statistically significant.
Regarding reproduction toxicity, no effects were noted on mating and fertility in both males and females. No substance‐related irregularities were seen in oestrus cycle, pre‐coital interval, gestation length and gestation/fertility/parturition indices. The Panel noted that cohabitation time in all groups was long (the mean pre‐coital interval was 7.7, 8.5, 7.6 and 8.3 days for the various dose groups) compared to what is usually reported for this strain of rats 4 (Marty et al., 2009). Parturition endpoints were not affected. The number of implantations sites, percent of post‐implantation loss per dam and postnatal observations did not reveal any changes in all tested dose groups.
For developmental toxicity, no external anomalies or behavioural changes were noted in any of the pups during the post‐natal period. Mean pup weight of either sex per litter was not affected by naringenin administration and no gross pathological changes were observed in any of the pups in the study (sacrifice at post‐natal day (PND) 13).
Based on the results of the dose range‐finding study, the study authors concluded that naringenin did not produce toxicity up to 25,000 mg/kg feed corresponding to 2205 and 2724 mg/kg bw per day in males and females, respectively. Hence, doses up to 25,000 mg/kg feed, approximately equivalent to 2500 mg/kg bw per day, were selected for the subsequent EOGRT study.
3.4.4.2.2. EOGRT study
Naringenin (batches 020H025 [purity: 95.8%] and 021F024 [purity: 96.0%]) was administered through the diet continuously in graduated doses to three groups of male and female Sprague Dawley rats (Bioneeds, 2022).
In the parental (P) generation (25 males and 25 females per group), naringenin was administered in the diet at doses of 0 (rodent powder diet as such), 16,000, 20,000 or 25,000 ppm for a period of 10 weeks prior to mating, 2 weeks during mating and continued until scheduled sacrifice for males or until weaning of the F1 generation for females. The study design accounts for litter effects.
For the F1 generation, 160 males and 160 females (one each per litter) were selected on the day of weaning (PND21) and randomly assigned to two cohorts (C1A and C1B), each consisting of four treatment groups as for the parental generation, each group having 20 males and 20 females per group.
Animals of the F1‐C1A cohort were dosed from weaning (PND 21) until adulthood (PND 96). The F1‐C1B cohort rats were dosed for a 10‐week premating period and 2‐week mating period. The F1‐C1B cohort females treatment continued throughout gestation and lactation periods until termination following weaning of respective litters (PND 21). Duration of dosing depended on the cohort assignment, with the longest duration of treatment up to 22 weeks. The F2 generation was exposed through the milk until the termination of the study on PND 21.
Average exposure to naringenin in the P generation and the F1 cohorts, as calculated by the study authors, is reported in Table 8. For the P generation and the F1‐C1B cohort, the estimates were calculated from the feed intake during the pre‐cohabitation period of 10 weeks and the body weights for the entire dosing period (13 weeks). For the F1‐C1A cohort, the estimates were calculated based on feed intake and body weight over the period from weaning to euthanasia (approximately PND 21 to PND 96).
TABLE 8.
Average exposure to naringenin in the P generation and the F1 cohorts, based on feed consumption over the entire dosing period (calculated by study authors).
| mg/kg feed | Naringenin exposure (mg/kg bw per day; mean values) | |||||
|---|---|---|---|---|---|---|
| P generation | F1‐C1A | F1‐C1B | ||||
| Males | Females | Males | Females | Males | Females | |
| 0 (G1) | 0 | 0 | 0 | 0 | 0 | 0 |
| 16,000 (G2) | 900 | 1600 | 1570 | 1830 | 1420 | 1570 |
| 20,000 (G3) | 1200 | 2050 | 1820 | 2190 | 1570 | 1870 |
| 25,000 (G4) | 1500 | 2580 | 2400 | 2800 | 2150 | 2410 |
The Panel noted that exposure estimates should have been calculated for the pre‐cohabitation period only, which means that only feed intake and body weight data should have been used for this period (i.e. the first 10 weeks of the entire exposure period, per generation). The estimates calculated in this way are reported in Table 9.
TABLE 9.
Average exposure to naringenin in the P generation and the F1 cohorts, based on feed consumption and body weight over the pre‐cohabitation* period (calculated by EFSA).
| mg/kg feed | Naringenin exposure (mg/kg bw per day; mean values) | |||
|---|---|---|---|---|
| P generation | F1‐C1B | |||
| Males | Females | Males | Females | |
| 0 (G1) | 0 | 0 | 0 | 0 |
| 16,000 (G2) | 1000 | 1550 | 1530 | 1800 |
| 20,000 (G3) | 1320 | 2040 | 1700 | 2140 |
| 25,000 (G4) | 1650 | 2560 | 2300 | 2780 |
Not applicable for the F1‐C1A animals.
3.4.4.2.3. Parameters considered in the EOGRT study
Endpoints included were consistent with those specified in OECD TG 443 (OECD, 2018b) in order to ensure the investigation of reproductive and developmental toxicity of naringenin. FOB determinations were studied in F1 and F2 pups and limited to reflex and sensory tests – surface righting, auditory startle and air righting reflexes. In the absence of indications for neurotoxic effects from the neurohistopathological examinations, no further neurobehavioural studies were carried out, which is a shortcoming of the study. Immunotoxicity evaluation was conducted by histopathology of thymus, spleen and lymph nodes and more in detail in F1 pups by splenic lymphocyte subpopulation analysis; histopathology was carried out on controls and high dose level animals. Historical control data were provided for statistically significant findings, but only a range was given, and not mean values, or details on the respective studies, such as number of studies included, dates of their conduct, number of animals and respective strain.
The parameters considered in the EOGRT study and a qualitative overview of the parameters for which statistically significant deviations from control values were observed are given in Appendix F.
3.4.4.2.4. General observations
The Panel noted that the range of exposure between the highest and lowest doses for the different generations was only a factor of ~ 2, which is suboptimal according to OECD TG 443. The average cohabitation period indicates that time to pregnancy was substantially prolonged in all groups (for the P generation, the mean pre‐coital interval was 7.4, 6.3, 5.8 and 8 days for the various groups; for F1‐CB cohort, the mean pre‐coital interval was 8.5, 8.4, 7.6 and 8.4 days for the various groups).4 In addition, the litter sizes were unexpectedly low, e.g. less than 10 animals per litter compared to a range of 10–15 animals per litter as reported for Sprague–Dawley rats (Evans, 1986; Marty et al., 2009) and less than the litter size reported in the dose‐range finding study. This could affect the sensitivity of the study for certain endpoints.
3.4.4.2.5. Survival
All adult animals survived until the scheduled necropsy. There were no test item‐related mortalities noted in pups from any of the test item administered groups at birth and during the post‐natal period.
3.4.4.2.6. Clinical observations, body weight and feed consumption
P generation
In the P animals, no clinical signs of toxicity or changes in general behaviour or external appearance were noted in any treatment group of either sex.
Statistically significant changes in mean body weight and body weight gain observed during pre‐mating period in males and females were not considered adverse by the study authors, but potentially test item related and stress induced; the values were within the in‐house historical control data (HCD) of the same species and strain. The Panel noted that these changes were not clearly dose‐related and agreed with the view of the study authors.
No test item‐related changes in feed consumption between control and treatment groups was observed in males and females during pre‐mating, gestation and lactation.
F1 generation (cohort 1A and 1B) and F2 generation
In the F1 generation cohort 1A and 1B animals and in F2 generation, no clinical signs of toxicity or changes in general behaviour or external appearance were noted in any treatment group of either sex.
Mean body weight, percent change in mean body weight gains and feed consumption were not affected by naringenin administration in any of the tested dose groups of both sexes throughout the experimental period when compared with vehicle control group.
Sporadic statistically significant findings were considered as incidental and unrelated to test item administration considering the lack of a dose–response relationship (referring to either decrease or increase in organ weight, body weight and body weight gain), its temporary nature and small magnitude.
3.4.4.2.7. Clinical pathology
Haematology, biochemical analysis and urinalysis were performed on P and F1 cohort 1A generations.
Haematology
P generation
The only statistically significant haematological change observed was reduced absolute eosinophil count in males at the mid‐ and high‐dose levels, both by ~ 40%. The values were still within the in‐house range of HCD. Cell counts for other leucocytes cell populations were not statistically significantly affected. The study authors concluded that this finding was not test substance related.
F1 generation cohort 1 A
The only change observed was an increase (25%) in mean platelet count in the high‐dose group of C1A females with a dose response trend. The study authors considered this as an incidental finding, as the mean values were within the in‐house HCD of the same species and strain (in‐house HCD: 687.67–1200.61 × 103 cells/μL; mean value in the high‐dose group: 1138.20 vs. 908.20 × 10³ cells/μL in concurrent controls).
Clinical chemistry
P generation
There were no changes in the obtained mean clinical chemistry values in any of the tested dose groups of both sexes when compared with the vehicle control group.
F1 generation cohort 1A
No changes were noted in the mean clinical chemistry values in any of the tested dose groups of both sexes when compared with the vehicle control group.
Urinalysis
P generation
Regarding the examined urinalysis parameters, no test substance‐related differences were noted between the control group and all treatment groups in the P generation.
It was noted a statistically significant decrease in mean pH value (12% decrease) and increase (1%) in mean specific gravity level in males high‐dose group when compared with vehicle control group. However, the values remained within in‐house HCD range, and therefore, these changes were considered as incidental and unrelated to treatment by the study authors. Regarding the variability of these parameters during the day, and in the absence of changes in other urinary parameters and in creatinine and urea in the clinical chemistry, the Panel concurs with this view.
F1 generation cohort 1A
There were no changes observed in the urinalysis investigations mean values in any of the tested dose groups of both sexes when compared with the vehicle control group.
Overall conclusions on clinical pathology
Overall, although there were occasional statistically significant differences between controls and treated groups, these were considered not to be of toxicological relevance because they were within the range of historical control data. Reduced eosinophil counts, and mean platelet counts were not accompanied by changes in other related parameters (e.g. other white blood cells count or blood clothing time). The low urinary pH and the increased specific gravity are not seen as an indication of disturbed renal function as other parameters of the renal function (e.g. creatinine) remained unchanged. There was no evidence for treatment‐related effects on any of the investigated clinical pathology parameters.
3.4.4.2.8. Thyroid function
Thyroid hormones (T4 and TSH)
Thyroid hormones (thyroxine (T4) and thyroid‐stimulating hormone (TSH)) were measured in randomly selected 10 males and 10 females of the P generation at necropsy, in the F1 pups (T4 at PND 4, and T4 and TSH at PND 21) and in F1‐C1A cohort (at termination PND 96) in accordance with OECD TG 443.
P generation
There was no statistically significant change in T4 and TSH levels (pooled per litter) between the control and treatment groups in either male or female P animals.
F1 Pups
According to the study authors, there were no test substance‐related differences in T4 on PND 4 and PND 21) between F1 pups control and treatment groups.
On PND 4, a statistically significant increase (7%) in T4 levels was noted in the low‐dose group and on PND 21, a statistically significant decrease (13%) was noted in the high‐dose group when compared with vehicle control. These changes were within in‐house HCD of the same species and strain.
In addition, no changes were noted in mean serum TSH levels of PND 21 pups per litter in any tested dose groups when compared with the control group, which in the view of the panel indicates that changes in T4 are chance findings.
F1 generation cohort 1A
A statistically significant increase in mean TSH levels was noted in the low‐dose group of C1A females when compared with vehicle control. This change was considered as incidental and unrelated to test item exposure as the change did not occur in a dose‐dependent manner.
There were no changes in the mean serum TSH and T4 levels in any of the other tested dose groups of both sexes when compared with vehicle control group.
3.4.4.2.9. Pathology
All or a subset of the animals in each cohort – depending on the cohort to which they were assigned – were subjected to an extensive macroscopic and microscopic examination, in accordance with OECD TG 443. Necropsy of the P generation was scheduled after 90–97 days treatment for males and 114–129 days of treatment for females (after weaning) or 97–110 days of treatment for non‐pregnant females. Necropsy of the F1 and F2 generations was scheduled on PND 21 (surplus F1 pups, after reflex and sensory testing, and only macroscopical examination for F2 pups), all C1A animals on PND 96 (including immunological tissues), C1B males after completion of mating procedure, C1B not littering females on the 26th day from mating confirmation and C1B littering females on lactation day (LD) 22, the latter for reproductive, immunological and endocrine tissues only. Special attention was paid to the organs of the reproductive system of both sexes and reproductive organs of all animals suspected of reduced fertility from all the dose groups and they were subjected to histopathological examination. Organ weights were recorded, paired organs were weighed together. Histopathology examination was performed in accordance with OECD TG 443. Accordingly, the histopathological investigations were conducted on all the tissues collected from the vehicle control (G1) and high‐dose (G4) group animals and were not extended to the lower dose groups as there were no treatment‐related effects noted at the high‐dose level during microscopic examinations.
In males, qualitative stages of spermatogenesis and histopathology of interstitial testicular structure were studied on one testicle and one epididymis. In females, histopathological examination of ovaries included quantitative evaluation of primordial and small growing follicles together with corpora lutea. Corpora lutea assessment was conducted in parallel with oestrus cyclicity testing by considering the stage of the cycle for the assessment. Male and female organs were examined for appropriate organ‐typic development.
Neurohistopathology was performed on brain (representative regions including cerebrum, cerebellum, and medulla/pons); the eye with optic nerve, muscle (skeletal), nerve (sciatic) and spinal cord (3 sections) were also studied, these performed according to OECD 443 for the respective cohorts (P, F1‐C1A).
Organ weight
P generation
In females, absolute and relative thyroid (plus parathyroids) weight was decreased in all test groups, which became statistically significant in the mid‐ (22%) and high‐dose groups (24%) compared to the controls. No effects were observed in males. The Panel noted that the mean absolute and relative thyroid (plus parathyroids) weight of the control group was approximately 10% above the HCD range.
The Panel considered the thyroid organ weight data as unreliable. Given that there were no histopathological changes or consistent dose–response changes in T4 and TSH, the Panel considered that there were no adverse effects on thyroid function.
F1 generation surplus pups
In the F1 PND 21 surplus pups, no test item‐related changes in absolute or relative organ weights (litter wise) were noted.
No gross pathological changes were noted in any of these organs in the highest tested dose group animals.
F1‐C1A cohort
In the F1‐C1A cohort, no test item‐related changes were noted in mean absolute/relative organ weights and terminal body weight, except that male in all dose groups had lighter iliac lymph nodes (absolute decreased by 39, 30, 34%; weight normalised decreased by 39, 35, 33%), without an obvious dose–response. Since, all relative and absolute lymph node weights remain within the HCD range, and in the absence of histopathological effects in the lymph nodes, these weight changes were considered to be not toxicologically relevant.
In addition, females in the middle and highest dose groups had heavier thymus glands (31%, 24%). No differences were observed for the relative thymus weight compared with controls. In the absence of histopathological effects in the thymus, these weight changes were considered to be not toxicologically relevant.
There were no toxicologically relevant changes in the splenic lymphocyte subpopulations.
Daily sperm production was reduced, without a dose response in all treatment groups (7%, 11%, 2%). These changes were considered to be not toxicologically relevant.
F1‐C1B cohort
In the cohort F1‐C1B, no test item‐related changes were noted in mean absolute/relative organ weights and terminal body weight in any of the tested dose groups of both sexes when compared with vehicle control group. Some statistically significant changes were noted in some of the dose groups. These included an increase in mean absolute thymus weight (males) in the mid‐dose group and an increase in mean absolute and relative thymus weight (females) in the high‐dose group, but no pathological changes noted.
Gross pathology
There were no gross pathological changes observed during necropsy in any of the adult animals and in F1/F2 pups.
Histopathology
There were no histopathological findings noted in vehicle control group and high‐dose group animals of both parental and C1A animals. In C1A males, caput, corpus and cauda of epididymides and vas deferens were examined for appropriate organ‐typic development and were found to be within normal histological limits.
In C1A females, ovary with oviduct, uterus and vagina were examined for organ‐typic development and were found to be within normal histological limits.
Few of the microscopic findings observed in this study such as ultimobranchial cyst(s) in thyroid gland, epithelial cyst(s) in thymus and all other findings were considered incidental as they occurred randomly across the dose groups including concurrent controls and/or were expected for laboratory rats.
Quantitative ovarian follicular assessment (primordial and primary follicles) in randomly selected parental and C1A females of control and high‐dose groups did not reveal any test item‐related variations. In addition, quantitative evaluation of corpora luteal count in C1A females of control and high‐dose group did not reveal any test item‐related variations.
3.4.4.2.10. Reproductive and developmental toxicity
Evaluation of sexual function and fertility
Male fertility
No statistically significant or dose‐related effects on sperm motility, in mean spermatid head count/concentration or daily testicular sperm production per gram and per animal were noted in any of the tested dose groups when compared with the vehicle control group in the P generation and in the F1‐C1A cohort.
There were no test item‐related sperm morphological changes in any of the tested dose groups of the P generation when compared with vehicle control group. In the F1‐C1A cohort significant dose‐responsive effects on sperm morphology was observed but in both directions. Decreased head abnormalities (54%), increased neck (171%), tail (130%) and sperm with abnormalities (50%) and decreased normal sperm. It must be noted that the latter showed by far the smallest changes (~1%) although with a clear dose–response. A 1% change in normal sperm together with contradictory changes in abnormal sperm does not indicate a major adverse effect on sperm.
Male mating index were observed in the P and F1‐C1B generations during initial cohabitation period (within 14 days). There were no statistically significant differences noted for male fertility index in any of the tested groups when compared with the vehicle control group.
There were no statistically significant effects on sperm motility and sperm morphology in the cohort 1A.
Female fertility
There were no statistically significant dose‐related changes in the mean pre‐coital interval, which in all groups was longer than what is usual for this rat strain (see section on general observations), gestation length, mating and fertility indexes, implantation sites, viable pups, post‐implantation loss or postnatal loss in either the P or F1‐C1B generations. Female mating indices were recorded in the P and F1‐C1B generations during initial cohabitation period (within 14 days). All pregnant females were confirmed with live born pups. Measured fertility indices (pregnancy, parturition and gestation) were 100% for all tested dose groups and vehicle control group of both P and F1‐C1B generations. In the P generation, the total litter size was not statistically reduced, but there was a slight dose‐related trend. Similarly, there was an increased post‐implantation loss in the high‐dose P females (8.7% loss in the control group; 12.6% loss in the high‐dose group). Birth parameters, such as number of live pups born, sex ratio (m/f) and live birth index, were not affected by naringenin exposure. Oestrous cycle length was up to 6% longer following exposure, significantly in the lowest and highest exposed groups. The study authors concluded that there were no test item‐related effects on mean oestrus cycle duration in P animals as there were no effects in the reproductive endpoints and no endocrine disruptive observations in the animals from these dose groups; the mean values were stated as being within the range of in‐house HCD (HCD not reported); this parameter was not affected in the F1 generation, cohorts 1A and 1B at any dose level.
Conclusions on sexual function and fertility
No pronounced effects of naringenin on sexual function and fertility were observed in either males or females. A dose‐related decrease in litter size and a corresponding increase post‐implantation loss were observed for the high‐dose P females. However, statistical significance was not reached.
Evaluation of developmental toxicity
Pre‐ and postnatal lethality, structural abnormalities
There were no external abnormalities or behavioural changes noted in F1 and F2 pups during daily observation during postnatal period. No treatment‐related effects were observed on birth weights and growth of the F1 pups. Regarding the F2 generation, statistically significant decreases in mean pup weight on PND 1 (males; −4%), 4 (females; −8%) and 14 (females; −5%) in group G4‐C1B and a decrease in mean pup weight on PND 14 (females; −5%) in group G3‐C1B were observed. Even though these changes disappeared at PND 21, the panel considered them as potentially toxicologically relevant. Of particular concern is the fact that although not statistically significant, in the high‐dose group, the reduction in mean pup weight could be seen throughout the lactation period. Despite the rather narrow dose range studied, a dose–response trend is seen.
The pup survival index per litter during lactation period was unaffected by the test item in all the tested dose groups in F1 and F2 when compared with the vehicle control groups.
Growth and sexual development
In F1 pups, at PND4, anogenital distance (AGD) was reduced in the highest dose females (4%) and AGD ratio (mm/cube root bw) was reduced in females in the highest and middle dose groups (0.96‐fold). Given the small effect, uncertainty about what, if anything, reduced female AGD means and even though there was a dose–response trend for AGD, this is unlikely to be an adverse effect. There were no test item‐related changes in male AGD and its ratio per litter on PND 4 and in nipples retention in males at PND 13 in either F1 or F2 generations.
No test item‐related changes/delays were noted in mean occurrences of postnatal developmental landmarks of F1 and F2 pups such as pinna unfolding, fur development, incisor eruption, eye opening and testes descent evaluated during postnatal period in any of the tested dose groups when compared with vehicle control group.
No effects were observed in mean occurrences of sexual maturation (day of occurrence of balanopreputial separation) and no test item‐related changes were noted in mean body weight on the day of sexual maturation in any of the tested dose group males when compared with vehicle control group. The mean occurrences of sexual maturation (day of occurrence of vaginal patency/opening) and mean body weight on the day of sexual maturation were comparable between the control and treated groups. The mean occurrence of first cornified cells (days) and mean time interval between vaginal patency to occurrence of first cornified cells were not affected by the naringenin administration.
Conclusions on developmental toxicity
The Panel considered that naringenin did not induce structural abnormalities, but affected the postnatal growth in the high‐dose F2 generation.
3.4.4.2.11. Neurofunctional screening
All the surviving F1 pups from each litter and all F2 pups were observed/evaluated for surface righting reflex starting from PND 4, auditory startle reflex starting from PND 10 and air righting reflex starting from PND 17 and continued until occurrence was recorded.
There were no changes/delays noted in mean responses of sensory reflexes of F1 and F2 pups for the parameters evaluated during postnatal period in any of the tested dose groups when compared with vehicle control group. The investigation of neurobehavioural toxicity does not fully comply with the requirements of the OECD TG 443.
3.4.4.2.12. Developmental Immunotoxicity
Effects on developmental immunotoxicity were determined in the F1 cohort 1A animals, 10 males and 10 females per group (1 male or 1 female per litter randomly selected) through splenic lymphocyte subpopulation analysis. No dose‐related changes were observed.
3.4.4.2.13. Conclusion on the EOGRT study
The Panel considered that the reduced litter size and prolonged cohabitation time for the rat strain used suggest that the performance of the animals in the test deviates from what is expected for the standard Sprague–Dawley rat strain. The applied concentration in feed resulted in a suboptimal dose range, which preferably should be with a factor of 2–4 between the consecutive individual doses. These observations necessitate a prudent interpretation of the study results. For some parameters (Appendix F), statistically significant changes were observed, but mainly without a clear dose–response; others dose‐related changes were seen, but these were either without statistical significance or transient in nature. The Panel considered that the changes in thymus weight (F1‐C1A females – mid‐ and high‐dose groups; F1‐C1B females – high‐dose group, increase; F1‐C1B males – mid‐dose group, increase), in litter size (P animals high‐dose group, decrease), post‐implantation loss (P animals high‐dose group, increase) and the consistent reduced pup weight in the high‐dose F2 generation could not be dismissed. Therefore, the Panel selected the mid‐dose of 20,000 mg/kg feed equal to 1320 mg/kg bw per day for the P males as the NOAEL of the study.
3.4.4.3. Naringenin and drug interactions
The applicant referred to the EFSA CEF Panel conclusion in FGE.32 (EFSA CEF Panel, 2010b) according to which ‘the potential for drug interactions from the intakes of the candidate flavones based on the MSDI approach does not give rise to concern’. However, the maximised survey derived daily intake (MSDI) does no longer apply for the estimation of the exposure to flavouring substances falling within the remit of Regulation (EC) No 1331/2008. Moreover, the flavones of FGE.32 did not include the candidate substance naringenin, but its precursor, naringin.
The Panel noted that naringenin, being an inhibitor of certain CYP450 isoforms (see e.g. Lu et al., 2011 and see below) with IC50 or Ki values in the order of 10 μM, may interfere more strongly with the metabolic elimination of medicines than naringin because naringenin will be present as such in the duodenum and small intestine, where it may interfere directly with metabolism of medicines in the GI‐tract wall. Furthermore, naringin may release naringenin mainly in the colon at a slow rate, after hydrolysis by the colon microbiota, reducing the likelihood of interference with the metabolism of medicines in the GI tract (since medicines are usually absorbed higher up in the GI tract, and since the delayed release of naringenin will result in lower naringenin concentrations in the liver).
The applicant referred also to one study that investigated the pharmacokinetic (PK) interaction between rasagiline mesylate and the flavanones hesperetin or naringenin via oral administration in rats (Pingili et al., 2016). Rats were administered with a single dose or a repeated dose (for 15 days) with rasagiline (2 mg/kg bw) alone or with rasagiline (2 mg/kg bw) and naringenin (12.5 and 25 mg/kg bw). In the presence of naringenin, a statistically significant increase in C max and AUC0‐24 and a significant reduction in clearance parameters were observed in comparison to rasagiline alone. The study authors investigated also the role of P‐glycoprotein (P‐gp) in the absorption of rasagiline both in the absence and presence of naringenin, using reverted sacs of rat ileum. Serosal fluid was collected at 10, 20, 30 and 60 min of incubation and analysed to measure the concentration of rasagiline. No statistically significant differences were observed between the samples. According to the study authors, these data suggest that the enhanced systemic exposure to rasagiline observed when co‐administered with naringenin, might be through the inhibition of its metabolism (CYP450), but not due to the interaction of naringenin with P‐gp. However, the Panel noted also that P‐gp may be inhibited by naringenin (Alotaibi, 2023). The Panel considered these data not sufficient also in light of species specificity of transporters.
Consequently, the Panel requested the applicant to demonstrate convincingly that pre‐systemic drug interactions with naringenin in humans at the estimated exposure levels (APET) are not to be expected.
The applicant responded (Documentation provided to EFSA No. 2) that regarding the potential naringenin–drug interactions occurring in the small intestine, the most relevant of the CYP isoforms would be CYP3A4, which is the most abundant CYP isoform in the human intestine (Paine et al., 2006). However, the Panel noted that, in addition to the inhibition of CYP3A4 (Miniscalco et al., 1992), a number of other CYP isoforms (CYP19, CYP2C9 and CYP2C19) were inhibited by naringenin with IC50 values below 5 μM. No appreciable inhibition of CYP2B6 or CYP2D6 was observed at concentrations up to 10 μM by naringenin (Lu et al., 2011).
Many in vitro experiments have been conducted with human liver microsomes, which contain the CYP3A isoform. In these studies, the metabolising enzymes were incubated with a known substrate and with naringenin, in order to measure the potential effect of naringenin on the metabolising enzymes using 50% inhibitory concentration (IC50).
Naringenin is known to inhibit the metabolism of e.g. simvastatin in rat and human hepatocytes and microsomes (Ki 5–30 μM; Ubeaud et al., 1999), and to inhibit various cytochrome P450 isoforms. The IC50 for CYP3A4 metabolism of testosterone (10 μM) was 17.4 μM (Lu et al., 2011). Other studies using higher concentrations of testosterone showed IC50 values of 50–200 μM (Bailey et al., 2000; Fukuda et al., 1997). The IC50 values for metabolism of other substrates (felodipine and quinine) in human liver microsomes were 122 and 139–188 μM, respectively (Fasinu et al., 2013; Ho et al., 2001). In a study by Fasinu et al. (2010), naringenin inhibition of felodipine metabolism by pig intestinal tissue slices was measured. The IC50 was 180 μM. Furthermore, naringenin inhibited in Wistar rats in vivo the metabolism of felodipine (Surya Sandeep et al., 2014).
The Panel considered that Ki values are more valuable in determining drug interactions than IC50 values because they are independent of the substrate concentration. Ubeaud et al. (1999) determined Ki values of 23 and 30 μM for simvastatin metabolism in human and rat liver microsomes, respectively. Based on guidelines on investigations on drug interactions (EMA, 2012), a critical factor is the [I]/Ki (i.e. the ratio between the concentration of the inhibitor in the gut content and the Ki value of the inhibitor). If this ratio is ≥ 10, there is concern for interaction. Based on the chronic combined exposure estimate ~ 60,000 μg/person per day, equal to 220 μM/person per day and the volume of fluids excreted in the upper gastro‐intestinal tract (5.1 L; sum of saliva (1.2 L), gastric (2 L) and pancreatic (1.2 L) fluids and bile (0.7 L) as reported by the International Commission on Radiological Protection (ICRP, 2002), the day‐average concentration of naringenin in the upper GI tract can be estimated to be 43 μM. Based on the reported Ki values (see above), the [I]/Ki ratio for simvastatin (as example) is 1.8, which is clearly below 10 and accordingly the Panel considered that the use of naringenin as a flavouring substance at APET exposure levels is unlikely to pose a risk for drug interactions. 5 Furthermore, although in the scientific literature, naringenin was initially held (at least partly) responsible in humans for interaction of grapefruit juice with pharmacokinetics of medicinal products, later on it has been demonstrated that this interaction by grapefruit juice is related to the presence of furanocoumarins in the juice, rather than to naringenin (Guo and Yamazoe, 2004; Hanley et al., 2011, Bailey et al., 2013). This is in line with the above consideration of the Panel that naringenin as a flavouring substance at APET exposure levels is unlikely to pose a risk for drug interactions.
3.5. Application of the procedure
The Panel considered the structural/metabolic similarity of naringenin with flavouring substances in other FGEs as not sufficient to apply the group‐based approach for the safety evaluation.
Since naringenin [FL‐no: 16.132] does not raise a concern for genotoxicity, it is appropriate to evaluate the use of [FL‐no: 16.132] as a flavouring substance following the stepwise evaluation procedure for individual substances as outlined in the ‘Guidance on the data required for the risk assessment of flavourings to be used in or on foods’ (EFSA CEF Panel, 2010a, 2010b) and Appendix A.
Step 1
Naringenin [FL‐no: 16.132] is allocated to structural class III. 6
Step 2
On the basis of the data available, the panel anticipated that naringenin is converted to innocuous metabolites. Hence, the substance can be evaluated via the left (A‐)side of the procedure (see Appendix A, Figure A.1).
Step A3–A4
The conditions of use as flavouring substance result in chronic APET exposure estimates of 830 and 2100 μg/kg bw per day (50,000 and 31,500 μg/person per day), for adults and children, respectively. These estimates are above the TTC for Cramer Class III (90 μg/person per day) and above 10‐fold this TTC (900 μg/person per day). Therefore, a 90‐day toxicity study and a developmental toxicity study are needed. Since naringenin is known to interact with oestrogen receptors, also data on reproductive toxicity are needed. Upon request by EFSA, an EOGRT study was submitted including the cohorts that address subchronic, developmental and reproductive toxicity.
The Panel considered that changes in thymus weight, in litter size (P‐generation in the high‐dose group, decrease), decrease pup weight (F2 generation in the high‐dose group) and post‐implantation loss observed in the EOGRT study in the highest dose group, could not be dismissed. Therefore, the mid‐dose of 20,000 mg/kg feed equal to 1320 mg/kg bw per day over the pre‐cohabitation period for the P males was selected as the NOAEL of the EOGRT study.
Using the NOAEL of 1320 mg/kg bw per day at step A4 of the Procedure, margins of exposure (MoE) of 1590 and 630 could be calculated for adults and children, respectively, when assessing the intake based on APET.
3.6. Assessment of acute, combined and cumulative exposure
3.6.1. Safety evaluation of the acute combined exposure
The estimates for acute combined exposure (653 and 411 mg/person for adults and children, respectively) are higher than the TTC for structural class III (90 μg/person per day). However, this TTC is related to subchronic rather than acute toxicity. Two inconsistent studies are available to indicate that the LD50 of naringenin is about 330 mg/kg bw (rats) or is > 5000 mg/kg bw (mice and rats). However, in several studies described in this opinion, dose levels have been administered that are far above 330 mg/kg bw on a daily basis for prolonged periods of time without any reporting of mortality. Therefore, the LD50 of 330 mg/kg bw cannot be considered to be reliable. The acute combined exposure estimates mentioned above correspond to 10,900 or 27,400 μg/kg bw or 10.9 or 27.4 mg/kg bw for adults and children, respectively, which are factors of 48–121 below the NOAEL of 1320 mg/kg bw per day obtained from an EOGRT study (Bioneeds, 2022) with rats, with exposures lasting for up to approximately 10 weeks (males; P generation). Also taking into account the conservative nature of the exposure estimates, this indicates that the acute exposure resulting from the use of naringenin as a flavouring substance in food and from exposure through other sources is not of safety concern.
3.6.2. Safety evaluation of the chronic combined exposure
The estimates for chronic combined exposure (56,900 and 35,900 μg/person per day for adults and children, respectively) are higher than the TTC for structural class III (90 μg/person per day). These estimates correspond to 950 or 2400 μg/kg bw (0.95 or 2.4 mg/kg bw per day) for adults and children, respectively, and are factors of 550–1390 below the NOAEL of 1320 mg/kg bw per day, obtained from an EOGRT study (Bioneeds, 2022) with rats, with exposures lasting for up to approximately 10 weeks (males; P generation). This indicates that the chronic exposure resulting from the use of naringenin as a flavouring substance in food and from exposure through other sources is not of safety concern.
Because naringenin is evaluated through the Procedure as a ‘stand‐alone’ substance, a safety assessment for cumulative exposure is not included in this FGE.
4. DISCUSSION
The European Commission requested EFSA to carry out the safety assessment of the substance naringenin [FL‐no: 16.132] (CAS no. 67604‐48‐2) as a new flavouring substance in accordance with Regulation (EC) No 1331/2008.
EFSA evaluated naringenin [FL‐no: 16.132] (CAS no. 67604‐48‐2) in Flavouring Group Evaluation 413 (FGE.413) and used the Procedure as referred to in Regulation (EC) No 1334/2008. No other substances with sufficient structural similarity to the flavouring substance have been identified in existing FGEs that could be used to support a read‐across approach. The substance is known to occur naturally in a wide range of food items, the main of which are citrus fruits and tomatoes. In the current evaluation, the proposed food flavouring is obtained through a process of extraction from grapefruit.
The provided specifications, which include ≥ 95% purity requirement, are considered adequate. The flavouring substance possess a chiral centre and exists as a racemic mixture. The information provided on the manufacturing process, the composition and the stability of the flavouring substance was considered sufficient. As regards the presence of toxic elements, the Panel noted that the applicant provided only information on the presence of lead, mercury and cadmium, but not on arsenic. However, this is not a requirement under the applicable EFSA guidance (EFSA CEF Panel, 2010a). The Panel noted that the percentage of particles (number‐based) with one dimension smaller than 500 nm could be higher than the reported value of 6% because SEM images at larger magnification show small particles in the nanometre scale with well‐defined boundaries that were not considered for the PSD determination.
Nonetheless, the Panel also noted that naringenin is highly soluble in lipophilic media, and it is expected to be fully dissolved in food matrices relatively rich in fats, such as, milk and dairy‐based drinks, cocoa and chocolate products, processed meats, etc. In water‐based matrices and solid matrices, naringenin may not reach full dissolution, at the proposed use levels in the respective foods. However, the Panel considered that taking into account the volume of gastric secretion (ranging from 215 mL within a single meal to 2000 mL daily; ICRP, 2002; Mudie et al., 2014), the proposed food flavouring is expected to be further diluted following ingestion of the foods in which is added, with subsequent dissolution in the GI tract. In addition, increase of food temperature upon ingestion and raise of pH in the GI tract can be anticipated to result in a higher solubility of naringenin in the GI tract, compared to its solubility in water at ambient temperature.
Therefore, the Panel concluded there is no concern with regard to the potential exposure of consumers to small particles, including nanoparticles, in naringenin when used as a food flavouring at the proposed use levels, and considered that an assessment as indicated in the ‘Guidance on technical requirements for regulated food and feed product applications to establish the presence of small particles including nanoparticles’ (EFSA Scientific Committee, 2021) is not required. The risk assessment of naringenin can be performed following the conventional risk assessment, i.e. the EFSA Guidance on the data required for the risk assessment of flavourings (EFSA CEF Panel, 2010a).
When tested in powder form, naringenin was stable at 45°C (accelerated testing conditions) and at room temperature (normal storage conditions) for nearly 2 years. In the study performed in buffer solutions (pH 3, 5 and 7 at 90°C), the stability of naringenin was demonstrated for up to 8 h, which, taken into account the accelerated testing conditions, is considered sufficient by the Panel.
Chronic exposure estimates to naringenin when used as flavouring substance, based on the APET technique, amounted to 830 and 2100 μg/kg bw per day in adults and children, respectively. Combined chronic exposure estimates, taking into account also exposure to naringenin from other food sources amounted to 950 or 2400 μg/kg bw per day, respectively. Acute combined exposure estimates for naringenin, taking into account both exposure from use as flavouring substance and exposure from other food sources amounted to 10,900 μg/kg bw for adults and to 27,400 μg/kg bw for children.
Upon ingestion, naringenin can be anticipated to be absorbed from the GI tract already in the duodenum. After absorption, naringenin is rapidly conjugated with glucuronic acid or with sulfate. Levels of unconjugated naringenin in plasma are very low or not detectable. The extent of the absorption is not known. Urinary excretion of naringenin (mainly as conjugates) amounts to approximately 30% of the dose; excretion via the bile has also been demonstrated. Any naringenin which is not absorbed in the duodenum, or which is excreted via the bile can also be (re)absorbed in the lower parts of the GI tract or will be subject to degradation by the gut microbiota. Other identified urinary metabolites are e.g. phloroglucinol, 3‐(4‐hydroxyphenyl)propionic acid, 4‐hydroxycinnamic acid and 4‐hydroxybenzoic acid, which originate from opening of the non‐aromatic ring and further break‐down. The available evidence indicates that naringenin can be anticipated to be metabolised to innocuous metabolites only.
Naringenin has the potential to interact with the metabolism of several medicinal products due to inhibition of CYP enzymes. Based on the anticipated maximum concentration of naringenin in the GI‐tract (see Section 3.4.4.3), when used as flavouring substance as intended, and the reported potency for inhibition of these CYP enzymes, the Panel considered that the concern for this interaction could be dismissed.
For naringenin, reliable genotoxicity studies have been submitted that provide evidence that naringenin is not mutagenic in a bacterial reverse mutation assay, but that it is clastogenic in an in vitro micronucleus assay. However, when studied in vivo in combined micronucleus assay/comet assays in liver and duodenum, clastogenicity was not observed. Consequently, the Panel considered that naringenin does not raise a concern with respect to genotoxicity and that the substance can be evaluated through the Procedure.
As determined by the OECD QSAR Toolbox, naringenin should be classified as a structural class III compound for which a TTC of 90 μg/person per day (1.5 μg/kg bw per day) is applicable. The chronic exposure estimates for naringenin are more than a factor of 10 above this value and therefore the Panel requested submission of an EOGRT study, also taking into account that naringenin is known to interact with oestrogen receptors (Section 3.4.4.1). Although there was no difference in pre‐coital time between control and test groups, the Panel noted that in all groups, including the control, the pre‐coital time was increased in the P generation and F1B cohort compared to what is usually reported for Sprague Dawley rats (Marty et al., 2009). In addition, the Panel noted that, irrespective of dose‐related changes, the litters in the F1 and F2 generations were smaller than expected for this strain (Evans, 1986; Marty et al., 2009). These conditions may have affected the sensitivity of the study and necessitate a prudent interpretation of its results. Based on increases in thymus weight, decreases in litter size, increases in post‐implantation loss and the reduced pup weight observed at the highest dose level in the EOGRT study, the Panel identified the mid‐dose of 1320 mg/kg bw per day as a NOAEL.
In the absence of adequate data on acute toxicity, the Panel compared the acute exposure estimates with the NOAEL of 1320 mg/kg bw per day for chronic exposure. The resulting MoEs were 121 (adults) or 48 (children). Taking into account that the NOAEL was from a chronic (EOGRT) study, the Panel considered that these MOEs do not raise a concern for acute exposure.
For chronic exposure, based on using the NOAEL of 1320 mg/kg bw per day, MoEs of 1590 (adults) and 630 (children) were calculated for the intended use of naringenin as flavouring substance. When exposure from other food sources was also taken into account, these MoEs were reduced to 1390 and 550, respectively. Despite the uncertainty related to the sensitivity of the EOGRT study with respect to reproductive toxicity, the Panel considered these MOEs sufficiently large.
5. CONCLUSIONS
The Panel concluded that the use of naringenin as flavouring substance does not raise a concern with respect to genotoxicity or with respect to interaction with medicinal products. Based on the calculated MoEs, the Panel concluded that the use of naringenin as a flavouring substance does not raise a safety concern.
6. DOCUMENTATION AS PROVIDED TO EFSA
Application for the Authorisation of Naringenin as a Flavouring Substance Pursuant to Regulation (EC) No 1334/2008 of the European Parliament and of the Council of 16 December 2008. Technical dossier. June 2016. Submitted by Interquim S.A.
Additional information received on 11 December 2017, submitted by Interquim S.A. in response to a request from EFSA (16 June 2017).
Additional information received on 13 May 2019, submitted by Interquim S.A. in response to a request from EFSA (30 January 2018).
Additional information received on 23 September 2019, submitted by HealthTech Bio Actives S.L.U. in response to a request from EFSA (1 July 2019).
Additional information received on 10 February 2023, submitted by HealthTech Bio Actives S.L.U. in response to a request from EFSA (5 November 2019 and 18 October 2022).
Bioneeds, 2021a. Dose range‐finding study for the extended one‐generation reproductive toxicity [EOGRT] study of naringenin by oral (dietary) route in Sprague–Dawley rats. Bioneeds, study number BIO‐DTX 061. November 2021. Submitted by HealthTech Bio Actives, S.L.U.
Bioneeds, 2021b. Validation of the analytical method to determine the content of naringenin in rodent feed diet by HPLC. Bioneeds, study number BIO‐ANM 1731. April 2021. Submitted by HealthTech Bio Actives, S.L.U.
Bioneeds, 2022. Extended one‐generation reproductive toxicity [EOGRT] study of naringenin by oral (dietary) route in Sprague–Dawley rats. Bioneeds, study number BIO‐DTX 062. November 2022. Submitted by HealthTech Bio Actives, S.L.U.
BSL Bioservice, 2019. 28‐day dose range finding oral toxicity study in Wistar rats with naringenin. BSL Munich study No. 188472. March 2019. Submitted by HealthTech Bio Actives, S.L.U.
Creative Bioarray, 2019. Cytogenetic report. Creative Bioarray, order# CBAZM0294. February 2019. Submitted by Interquim, S.A.
Envigo Research Limited, 2018a. Naringenin: reverse mutation assay “ames test” using Salmonella typhimurium and Escherichia coli (OECD 471). Envigo Research Limited, study number LM02ST. June 2018. Submitted by Interquim, S.A.
Envigo Research Limited, 2018b. Naringenin: Micronucleus Test in human lymphocytes in vitro. Envigo Research Limited, study number NH22VH. July 2018. Submitted by Interquim, S.A.
Eurofins BioPharma, 2019a. In vivo mammalian alkaline comet assay of liver and duodenum cells in rats with naringenin (CAS 67604‐48‐2) administered on 3 consecutive days. Eurofins Munich / BSL Munich, study number 188466. April 2019. Submitted by Interquim, S.A.
Eurofins BioPharma, 2019b. In vivo mammalian alkaline comet assay of liver and duodenum cells in rats with naringenin (CAS 67604‐48‐2) administered on 3 consecutive days: mammalian micronucleus test of rat peripheral blood cells with naringenin (CAS 67604‐48‐2). Eurofins Munich / BSL Munich, study number 188466, study Phase number 188467. April 2019. Submitted by Interquim, S.A.
Eurofins BioPharma, 2019c. In vivo mammalian alkaline comet assay of liver and duodenum cells in rats with naringenin (CAS 67604‐48‐2) administered on 3 consecutive days: method validation for analysis of naringenin in rat plasma samples by LC–MS/MS and analysis of naringenin in rat plasma samples by LC–MS/MS. Eurofins Munich/BSL Munich, study number 188466, study phase number 188469/188470. April 2019. Submitted by Interquim, S.A.
Interquim S.A., 2016. R/S Distribution – Naringenin. April 2016. Submitted by Interquim, S.A.
ABBREVIATIONS
- APET
Added Portions Exposure Technique
- AUC
Area Under the Curve
- BW
body weight
- CAS
Chemical Abstract Service
- CBPI
cytokinesis block proliferative index
- CEF
Food Contact Materials, Enzymes, Flavourings and Processing Aids (Panel)
- CYP
Cytochrome
- DMSO
Dimethyl Sulfoxide
- EINECS
European Inventory of Existing Commercial chemical Substances
- EOGRT
Extended One‐Generation Reproductive Toxicity
- ER
Oestrogen Receptors
- FAF
Food Additives and Flavourings (Panel)
- FEMA
Flavor and Extract Manufacturers Association
- FGE
Flavouring Group Evaluation
- FLAVIS
Flavour Information System database
- GI
Gastrointestinal
- GRAS
Generally Recognised As Safe
- GLP
Good Laboratory Practise
- HCD
Historical Control Data
- HRPT
Human‐Relevant Potency Threshold
- IOFI
The International Organization of the Flavor Industry
- IR
Infra‐red
- JECFA
The Joint FAO/WHO Expert Committee on Food Additives
- LC–MS/MS
Liquid Chromatography–Mass Spectrometry
- LD50
Median Lethal Dose
- MN
Micronucleus
- MNPCE
Micronucleated Polychromatic Erythrocytes
- MoE
Margin of Exposure
- MSDI
Maximised Survey‐Derived Daily Intake
- MTD
Maximum Tolerated Dose
- NMR
Nuclear Magnetic Resonance
- No
Number
- NOAEL
No Observed Adverse Effect Level
- OECD
Organisation for Economic Co‐operation and Development
- PCE
Polychromatic Erythrocytes
- PND
Post‐natal Day
- PSD
Particle Size Distribution
- QSAR
Quantitative Structure–Activity Relationship
- SCF
Scientific Committee on Food
- SEM
Scanning Electron Microscopy
- TTC
Threshold of Toxicological Concern
CONFLICT OF INTEREST
If you wish to access the declaration of interests of any expert contributing to an EFSA scientific assessment, please contact interestmanagement@efsa.europa.eu.
REQUESTOR
European Commission
QUESTION NUMBER
EFSA‐Q‐2017‐00001
COPYRIGHT FOR NON‐EFSA CONTENT
EFSA may include images or other content for which it does not hold copyright. In such cases, EFSA indicates the copyright holder and users should seek permission to reproduce the content from the original source.
PANEL MEMBERS
Maged Younes, Gabriele Aquilina, Laurence Castle, Gisela Degen Karl‐Heinz Engel, Paul J Fowler, Maria José Frutos Fernandez, Peter Fürst, Ursula Gundert‐Remy, Rainer Gürtler, Trine Husøy, Melania Manco, Wim Mennes, Peter Moldeus, Sabina Passamonti, Romina Shah, Ine Waalkens‐Berendsen, and Matthew Wright.
LEGAL NOTICE
The full opinion will be published in accordance with Article 12(3) of Regulation (EC) No 1331/2008 once the decision on confidentiality will be received from the European Commission.
ACKNOWLEDGEMENTS
The Panel wishes to thank the following for the support provided to this scientific output: Ana Rincon, the members of the WG on specifications of food additives: Eric Gaffet, Katrin Loeschner, Jan Mast and Anna Undas. Furthermore, the panel wishes to thank the following for the preparatory work performed for the assessment of the extended one‐generation reproductive toxicity study: Danièle Court Marques.
APPENDIX A. Procedure for the safety evaluation of ‘stand‐alone’ chemically defined flavouring substances
A.1.
FIGURE A.1.

Procedure applied for the safety evaluation of naringenin according to the data requirements for the risk assessment of flavourings (EFSA CEF Panel, 2010a).
APPENDIX B. Food categories and use levels provided for naringenin
B.1.
TABLE B.1 Food categories and use levels (only these food categories are included for which use levels were provided). Portion sizes are according to the EFSA Guidance on the data required for the risk assessment of flavourings to be used in or on foods (EFSA CEF Panel, 2010a) (Documentation provided to EFSA No. 1).
| CODEX code | Food categories a | Standard portions b (g) | Intended use level as flavouring substance (mg/kg) | Occurrence level from other sources (mg/kg) | Combined occurrence level from all sources (mg/kg) | |||
|---|---|---|---|---|---|---|---|---|
| Normal | Maximum | Normal c | Maximum | Normal | Maximum | |||
| 01.1 | Milk and dairy‐based drinks | 200 | 100 | 500 | 100 | 500 | ||
| 01.6 | Cheese and analogues | 40 | 100 | 200 | 100 | 200 | ||
| 01.7 | Dairy‐based desserts (e.g., pudding, fruit or flavoured yoghurt) | 125 | 100 | 500 | 100 | 500 | ||
| 03.0 | Edible ices, including sherbet and sorbet | 50 | 100 | 200 | 100 | 200 | ||
| 04.1.1 | Fresh fruit | 140 | 25 | 573.9 | 25 | 573.9 | ||
| 04.1.2 | Processed fruit | 125 | 43.4 | 61.8 | 43.4 | 61.8 | ||
| 04.1.2.5 | Jams, jellies, marmalades | 30 | 45.6 | 45.6 | 45.6 | 45.6 | ||
| 04.2.2.5 | Vegetables (including mushrooms and fungi, roots and tubers, pulses and legumes, and aloe vera), seaweed, and nut and seed purees and spreads (e.g. peanut butter) | 30 | 32.9 | 125 | 32.9 | 125 | ||
| 05.1 | Cocoa products and chocolate products, including imitations and chocolate substitutes | 40 | 200 | 400 | 200 | 400 | ||
| 05.2 | Confectionery, including hard and soft candy, nougats, etc., other than 05.1,05.3 and 05.4 | 30 | 100 | 400 | 100 | 400 | ||
| 05.3 | Chewing gum | 3 | 100 | 400 | 100 | 400 | ||
| 06.3 | Breakfast cereals, including rolled oats | 30 | 100 | 200 | 100 | 200 | ||
| 06.8 | Soya bean products (excluding soya bean products of food category 12.9 and fermented soya bean products of food category 12.10) | 100 | 100 | 500 | 100 | 500 | ||
| 08.2 | Processed meat, poultry and game products in whole pieces or cuts | 100 | 100 | 200 | 100 | 200 | ||
| 08.3 | Processed comminute meat, poultry and game products | 100 | 100 | 200 | 100 | 200 | ||
| 11.6 | Table‐top sweeteners, including those containing high‐intensity sweeteners | 1 | 100 | 200 | 100 | 200 | ||
| 12.2 | Herbs, spices, seasonings and condiments (e.g. seasoning for instant noodles) | 1 | 500 | 1000 | 1984.3 | 3720 | 2484.3 | 4720 |
| 12.5 | Soups and broths | 200 | 100 | 200 | 100 | 200 | ||
| 14.1 | Non‐alcoholic (‘soft’) beverages | 300 | 100 | 300 | 23 | 425.1 | 123 | 725.1 |
| 14.2.3 d | Grape wines | 150 | 16.7 | 17.7 | 16.7 | 17.7 | ||
| 15.1 | Snacks, potato‐, cereal‐, flour‐ or starch‐based (from roots and tubers, pulses and legumes) | 30 | 100 | 400 | 100 | 400 | ||
| 15.2 | Processed nuts, including coated nuts and nut mixtures (with e.g. dried fruit) | 30 | 4.3 | 4.3 | 4.3 | 4.3 | ||
Most of the categories reported are the sub‐categories of Codex GSFA (General Standard for Food Additives, available at https://www.fao.org/gsfaonline/foods/index.html) used by the JECFA (FAO/WHO, 2008).
- 1/25 for powder used to prepare water‐based drinks such as coffee, containing no additional ingredients,
- 1/10 for powder used to prepare water‐based drinks containing additional ingredients such as sugars (ice tea, squashes, etc.),
- 1/7 for powder used to prepare milk, soups and puddings,
- 1/3 for condensed milk.
In order to estimate normal values in each category, only foods and beverages in which the substance is present in significant amount have been considered (in each category, the normal concentration is the median concentration observed in all foods within it where the flavouring substance is known to occur).
The applicant reported the Codex code 14.2.2 for the food category ‘Grape wines’ according to EFSA Guidance on the data required for the risk assessment of flavourings to be used in or on foods (EFSA CEF Panel, 2010a). The updated Codex code for the food category ‘Grape wines’ is 14.2.3 according to Codex GSFA.
APPENDIX C. ADME data from human studies
C.1.
This appendix describes the available toxicokinetic data for naringin and naringenin. Table C.1 gives an overview and a short description of the various studies. Table C.2 gives a summary of the most pertinent toxicokinetic data. A comparison of dose‐corrected Cmax and AUC values for naringin and naringenin is reported in Table C.3. In Table C.4, an overview is given of the in vitro studies on the microbial metabolism of naringenin and naringin.
TABLE C.1.
Short description of toxicokinetic studies in humans.
| Number of subjects | Dose/formulation | Parameters measured | Results | Reference |
|---|---|---|---|---|
| 6 healthy volunteers (5 males and 1 female) | Single oral dose 135 mg of each, hesperetin and naringenin in the form of solid dispersion capsules, along with 240 mL of water, under fasting conditions |
Blood samples were drawn at 0, 20, 35, 50, 70, 100, 150 min and at 3, 4, 5, 6, 8, 10, 12 h Urine was collected in 5 sequential intervals: 0–3, 3–6, 6–9, 9–12, 12–24 h Plasma and urine hesperetin and naringenin concentrations were quantified after hydrolysis of samples with ß‐glucuronidase/sulfatase, by HPLC analysis |
Naringenin was rapidly absorbed and its concentrations in plasma observed 20 min after dosing and reached a peak in 3.5 h The elimination half‐life for naringenin was 2.31 ± 0.40 h. The mean values of the relative cumulative urinary excretion, as percentage of the administered dose was 5.81 ± 0.81%. The cumulative urinary recovery data indicated low bioavailability due to extensive first‐pass metabolism partly by cleavage of the central ring by the enzymes of intestinal bacteria leading to degradation products such as phenolic acids. For detailed data on toxicokinetic parameters see Table C.2 |
Kanaze et al. (2007) |
| 6 healthy humans per dose group | Dose capsules with 150 mg or 600 mg naringenin (as present in sweet orange extract) | Blood was drawn prior to ingestion of placebo and naringenin and at 2, 3, 3.5, 4, 4.5, 6, 8 and 12 h post‐dose | After 2 h a peak concentration in plasma of 15.8 ± 7.9 μmol/L and 48.5 ± 7.9 μmol/L was measured for naringenin 150 mg and 600 mg, respectively. Naringenin half‐life in plasma was 3 h (at 150 mg) and 2.65 h (at 600 mg). The AUC0‐24h values were 67.61 ± 24.26 μmol/L × h and 199.05 ± 24.36 μmol/L × h, respectively. For detailed data on toxicokinetic parameters see Table C.2 | Rebello et al. (2020) |
| 5 non‐smoking healthy men | A 3.8 mg naringenin intake with a test meal (containing 150 mg of cooked tomato paste with 30 g of corn oil) The polyphenolic composition of the commercial tomato paste, expressed as mg/100 g of wet weight, was 2.53 ± 0.12 naringenin |
Determination of naringenin in plasma at 0 h and at 2, 4, 6, 8 and 24 h after the meal, by HPLC analysis Plasma naringenin was extracted with or without enzymatic hydrolysis of the conjugated forms |
C max ranging from 0.07 to 0.12 μmol/L after administration of 3.8 mg of naringenin aglycone with the test meal. The peak plasma concentration was 0.12 μmol/L ± 0.03 μmol/L 2 h after the meal. The authors did not find unconjugated naringenin in plasma samples and concluded that naringenin is largely metabolised in the liver and enters the general circulation as the conjugated form. For detailed data on toxicokinetic parameters see Table C.2 | Bugianesi et al. (2002) |
| 13 healthy humans (8 subjects ingested orange juice (OJ); 5 subjects ingested grapefruit juice (GJ)) | A single oral intake of OJ or GJ (8 mL/kg bw) given once to fasted subjects, with naringenin equivalents of 23 ± 2 mg (OJ) or 199 ± 42 mg (GJ) |
Blood and urine samples were collected between 0 and 24 h after juice administration Naringenin (and hesperetin) concentrations measured after hydrolysis of all samples with ß‐glucuronidase/sulfatase by HPLC‐ECD analysis |
Rather high plasma concentrations were observed (e.g., C max 6 μmol/L after GJ dosing); considerable inter‐interindividual variability in bioavailability was observed perhaps due to differences in GI microbiota; for detailed data on toxicokinetic parameters see Table C.2 | Erlund et al. (2001) |
| 7 females cross‐over study |
Blood orange juice (BOJ) 150 or 300 mL providing 6 or 12 mg naringenin and 51 or 102 mg hesperetin, respectively BOJ was administered in random order on two occasions 1 month apart |
Plasma samples collected each hour for 8 and 24 h after BOJ administration. Naringenin (and hesperetin) concentrations in juice and plasma were measured after hydrolysis of all samples with ß‐glucuronidase/sulfatase by LC‐DAD‐MS and LC–MS/MS, respectively | Flavanone plasma concentrations were dose‐dependent and peak levels reached about 5 h after BOJ intake: mean C max Naringenin 16.4 and 34 ng/mL (for hesperetin 43 and 80 ng/mL) after 150 and 300 mL intake, respectively. The flavanones are mostly present as conjugated forms. For detailed data on toxicokinetic parameters see Table C.2 | Gardana et al. (2007) |
| 12 healthy human (6 males and 6 females) |
A single drinking of 250 mL pulp‐enriched orange juice, which contained 584 μmol (poly)phenols of which 537 μmol were flavanones After a 2‐week washout, the procedure was repeated and a placebo drink was consumed |
Urine collected for a 24‐h period was analysed qualitatively and quantitatively by using HPLC‐MS (GC–MS) |
14 metabolites were identified and quantified in urine: hesperetin‐O glucuronides, naringenin‐O‐glucuronides, and hesperetin‐3’‐O‐sulfate were the main metabolites The overall urinary excretion of flavanone metabolites corresponded to 16% of the intake of 584 mmol (poly)phenols. Eight urinary catabolites were identified: 3‐(3′‐methoxy‐4′‐hydroxyphenyl)propionic acid, 3‐(3′‐hydroxy‐4′ methoxy‐phenyl)propionic acid, 3‐(3′‐hydroxy‐4′‐methoxyphenyl)hydracrylic acid, 3‐(3′‐hydroxyphenyl)hydracrylic acid, 3′‐methoxy‐4′‐hydroxyphenylacetic acid, hippuric acid, 3′‐hydroxy‐hippuric acid, and 4′‐hydroxyhippuric acid. These aromatic acids originated from the colonic microbiota‐mediated breakdown of orange juice (poly) phenols. Since many of the metabolites could not be attributed specifically to naringenin, calculation of mass balance for naringenin was not possible |
Pereira‐Caro et al. (2014) |
| 12 healthy human cross‐over design | A single test meal of 400 g fresh oranges or 719 g pasteurised orange juice delivering 1774 and 751 μmol of total citrus flavanones, respectively |
24 h urine samples were collected from 11 subjects Hesperidin and narirutin in meals quantified by HPLC‐DAD; Naringenin/Hesperitin were quantified in urines after enzymatic hydrolysis with glucuronidase/sulfatase by HPLC‐MS/MS; catabolites were quantified by UHPLC–MS/MS |
Deglucuronidated and desulfated hesperitin, naringenin and the flavanone catabolites 3‐(3′‐hydroxy‐4′‐methoxyphenyl)propionic acid, 3‐(3′‐hydroxyphenyl)hydracrylic acid, 4‐hydroxyhippuric acid, and hippuric acid quantified in 24 h urines. Despite the much higher hesperetin content in the test meals, subjects excreted a higher proportion of naringenin in the urine after orange fruit (12.9%) and orange juice (20.3%) | Aschoff et al. (2016) |
| 7 healthy humans | Tablets: 320 mg Naringin & water | Urine and faeces collected at different times Analysis with an UFLC‐Q‐TOF‐MS/MS system | 16 conjugative metabolites and 5 polyphenols identified in urine and faeces. Naringenin underwent extensive phase II metabolism. Differences detected among individuals in metabolic profile | Zeng et al. (2016) |
TABLE C.2.
Summary of the most pertinent toxicokinetic data for naringin (NAR‐G) and naringenin (NAR‐A).
| Reference (# persons) | Amount per person and as NAR‐A dose | T max | C max | C max/D × 103 | AUC | AUC/D × 103 | Plasma half‐life |
|---|---|---|---|---|---|---|---|
|
Kanaze et al. (2007) (6) |
NAR‐A 135 mg (496 μmol) (Capsule + water) |
3.5 h (3–5) |
2000 ± 770 ng/mL | 15.1 | 8800 (ng × h/mL) | 64.9 | T ½ ~ 2.3 h |
| 7.5 μmol/L | 32.18 μmol/L × h | ||||||
|
Rebello et al. (2020) (6) |
Nar‐A 150 mg (551 μmol) Sweet orange extrac a |
3.2 ± 0.7 h | 15.8 ± 7.9 μmol/L | 28.7 | 67.61 ± 24.26 μmol/L × h | 122.7 | T ½ = 3.0 h |
|
NAR‐A 600 mg (2204 μmol) Sweet orange extract a |
2.4 ± 0.7 h | 48.5 ± 7.9 μmol/L | 22.0 | 199.05 ± 24.36 μmol/L × h | 90.3 | T ½ = 2.65 h | |
|
Bugianesi et al. (2002) (5) |
NAR‐A 3.8 mg (14 μmol) Tomato paste/oil |
2 h (1st sample) | 32 ± 8 ng/mL | 8.5 | Decline by 2 h and later | ||
| 0.12 μmol/L | |||||||
|
Erlund et al. (2001) (8 or 5) |
NAR‐G (OJ) 23 ± 2 mg (85 μmol) | 5.5 ± 2.9 h | 175 ± 110 ng/mL |
7.5 |
719 (ng × h/mL) | 31.3 | T ½ ~ 1.3 h |
| 0.64 μmol/L | 2.63 μmol/L × h | ||||||
| NAR‐G (GJ) 200 ± 40 mg (731 μmol) | 4.8 ± 1.1 h | 1628 ± 1160 ng/mL | 8.1 | 7534 (ng × h/mL) | 37.6 | T ½ ~ 2.2 h | |
| 5.99 μmol/L | 27.55 μmol/L × h | ||||||
|
Gardana et al. (2007) (7) |
NAR‐G (BOJ 150 mL) 6 mg (22 μmol) |
5.0 ± 0.6 h | 16.4 ± 12 ng/mL | 2.7 | 53.9 ng × h/mL | 8.6 | |
| 0.19 μmol/L × h | |||||||
|
(BOJ 300 mL) 12 mg (44 μmol) |
34.0 ± 21 ng/mL | 2.8 | 95.6 ng × h/mL | 7.7 | |||
| 0.337 μmol/L × h |
Abbreviations: AUC, area under curve; C max, maximum concentration; D, dose; T max, time to achieve C max, OJ, orange juice; GJ, grapefruit juice; BOJ, blood orange juice.
Sweet orange extract with 24% NAR‐A.
TABLE C.3.
Comparison of dose‐corrected C max and AUC values for naringin (NAR‐G) and naringenin (NAR‐A) (on a molar basis for Dose, C max and AUC upon dosing NAR‐A or NAR‐G).
| Reference | Amount per person as NAR‐Aglycone | C max/D × 103 | Average C max | AUC/D × 103 | Average AUC | Comment |
|---|---|---|---|---|---|---|
|
Kanaze et al. (2007) NAR‐A |
NAR‐A 135 mg | 15.1 | 21.93 | 64.9 | 92.63 | Naringenin is absorbed in the small intestine and results in higher plasma peak concentrations and AUC values than observed after naringin administration |
| 496 μmol | ||||||
|
Rebello et al. (2020) NAR‐A Sweet orange extract |
NAR‐A 150 mg | 28.7 | 122.7 | |||
| 551 μmol | ||||||
| NAR‐A 600 mg | 22.0 | 90.3 | ||||
| 2204 μmol | ||||||
|
Erlund et al. (2001) NAR‐G |
NAR‐G (OJ) 23 ± 2 mg |
7.5 | 7.86 | 31.3 | 34.55 |
Naringenin release upon hydrolysis of naringin in the colon ➔ C max and AUC values are about 3‐fold lower compared to naringin – Interindividual variability was observed |
| 85 μmol | ||||||
|
NAR‐G (GJ) 200 ± 40 mg |
8.1 | 37.6 | ||||
| 731 μmol | ||||||
|
RATIO NAR‐A/NAR‐G |
2.78 | 2.68 | Naringenin in plasma is conjugated (glucuronic acid/sulfate) |
Abbreviations: AUC, area under curve; C max: maximum concentration; D, dose; OJ, orange juice; GJ, grapefruit juice.
TABLE C.4.
In vitro studies on the microbial metabolism of naringenin [FL‐no: 16.132] and naringin [FL‐no: 16.058].
| FL‐no | Test system | Test conditions | Results | Reference |
|---|---|---|---|---|
| 16.132 | Pig caecum model |
Pig caecum was used under anaerobic conditions to metabolise flavonoids from several classes. Compounds were incubated under anaerobic conditions with the inoculum for 0, 2, 4, 6, 8, 10 and 24 h The time course of microbial conversion of naringenin was determined by HPLC‐DAD analysis, revealing slow degradation |
Naringenin was transformed to 3‐(4‐hydroxyphenyl)‐propionic acid and 3‐phenylpropionic acid | Labib et al. (2004) |
| 16.132 | Degradation experiments using human faecal slurries |
Naringenin (50 μmol) was incubated with faecal suspensions +0.5 g glucose Samples were taken after 0, 1, 2, 4, 6, 8, and 24 h HPLC and GC–MS analysis were performed |
Human microbiota converted naringenin slowly as considerable amounts remained: 26–36 μmol after 4 h of incubation; 13–28 μmol after 6 h of incubation; 3–8 μmol after 24 h of incubation The main degradation products of naringenin were: 3‐(4′‐hydroxyphenyl)propionic acid and 3‐ (phenyl)propionic acid |
Pereira‐Caro et al. (2015) |
| 16.132 | Degradation experiments using Bifidobacterium longum R0175 and Lactobacillus rhamnosus subsp. Rhamnosus NCTC 10302 cultures |
Naringenin (25 μg/mL) was incubated with the bacteria culture. Samples were taken after incubation for 0, 12, 24, 36 and 48 h HPLC‐HR‐MS analysis was performed |
Ring fission of naringenin resulted in the appearance of 3‐(4′‐hydroxyphenyl)propionic acid and lower amounts of 3‐(phenyl)propionic acid Recovery was 83% and 88% from cultures of L. rhamnosus and B. longum, respectively |
Pereira‐Caro et al. (2016) |
| 16.132 | Degradation experiments using Eubacterium ramulus (isolated from human faeces) |
Naringenin (1 mM) was incubated, in the absence or in the presence of glucose [10 mM], with E. ramulus. Samples were analysed after 72 h HPLC or LC–MS/MS analysis were performed |
Naringenin was not metabolised in absence of glucose, until 72 h of incubation However, in presence of glucose, it was degraded to 3‐(4‐hydroxyphenyl) propionic acid, with 25% recovery |
Schneider and Blaut (2000) |
| 16.058 | Human faeces |
Fermentation suspensions of naringin were incubated at a concentration of 600–800 mg/L for 48 h HPLC and GC–MS analysis were performed |
The fermentation suspensions of naringin after incubation for 48 h revealed varying stages of colonic degradation, via naringenin, 3‐(4‐hydroxyphenyl)‐propionic acid, and 3‐phenylpropionic acid, depending on the faecal donor. Fermentation of faecal samples showed continued degradation of naringenin, through an apparent cleavage of the C‐ring yielding a transient appearance of a product detected and identified as phloroglucinol by HPLC, derived probably from the A‐ring fragment, as well as the cleaved B‐ring fragment identified as 3‐(4‐ hydroxyphenyl)‐propionic acid. In one fermentation, 3‐(4‐hydroxyphenyl)‐propionic acid represented the major phenolic end product whereas, in two other fermentations subsequent dehydroxylation to 3‐phenylpropionic acid, the final end product was seen | Rechner et al. (2004) |
| 16.058 | Degradation experiments using human faeces | Naringin (1.7 mM) was incubated with faecal water for 0, 0.5, 1, 2, 4, 6, 8 or 12 h |
Naringin was a substrate for enzymes of human intestinal microbiota. The deglycosylation of naringin and degradation of naringenin were observed The production of‐3‐(4‐hydroxyphenyl)propionic acid (4‐HPPA) from the degradation of naringenin, was observed only for one donor. Differences among donors were observed also for 4‐HPPA degradation The abilities of degrading 4‐HPPA were different among human intestinal microbial enzyme |
Zou et al. (2015) |
| 16.132 and 16.058 | Fermentation system to study human faecal flora metabolism |
100 mg of flavonoid substrate were fermented under anaerobic conditions for 0, 4, 8, 24, 48, and 72 h Substrate degradation and metabolite formation were determined by HPLC and MS |
Naringenin, as a product of deglycosylation, was linearly accumulated over the whole fermentation period. The aglycone itself was slowly fermentable, with significant levels still present after 72 h of incubation of naringenin and naringin Two metabolites of naringin were detected after 48 h incubation, one of the metabolites is assumed to be phloroglucinol |
Justesen et al. (2000) |
| 16.132 and 16.058 | Intestinal bacteria isolated from human faeces | Bacteria were inoculated and incubated anaerobically for 2 days in 50 mL broth containing 5 mg flavonoids |
Naringin was metabolised to naringenin at early time and then to 4‐hydroxybenzoic acid, phloroglucinol, 2,4,6‐trihydroxybenzatdehyde and 4‐hydroxyphenylacetic acid Naringenin was transformed to phenolic acids by Streptococcus S‐2, Lactobacillus L‐2, and Bacteroides JY‐6 |
Kim et al. (1998) |
| 16.132 and 16.058 | Degradation experiments using Clostridium orbiscindens (quercetin‐degrading bacteria) from human faeces |
Naringin or naringenin (50 mM) were incubated with C. orbiscindens. Samples were taken immediately after inoculation and hourly from 2 to 12 h and at 24 and 48 h HPLC analysis was performed |
C. orbiscindens did not convert flavonoid glycosides such as naringin C. orbiscindens converted 0.5 mM naringenin to 3‐(4‐hydroxyphenyl) propionic acid |
Schoefer et al. (2003) |
APPENDIX D. Genotoxicity Studies on naringenin
D.1.
TABLE D.1 Summary of newly submitted in vitro genotoxicity studies on naringenin (Documentation provided to EFSA No. 2 and 3).
| Chemical name [FL‐no] | Test system in vitro | Test object | Concentrations a and test conditions | Result | Reliability/comments | Relevance of test system/relevance of the result | Reference |
|---|---|---|---|---|---|---|---|
|
Naringenin [16.132] |
Reverse Mutation test |
S. Typhimurium TA98, TA100, TA102, TA1535, TA1537 E. Coli WP2 uvrA |
Experiment 1: 1.5–5000 μg/plate (+/− S9, plate incorporation) |
Negative |
Reliable without restrictions Study performed according to OECD TG 471 and in compliance with GLP |
High/High | Envigo Research Limited (2018a) |
|
Experiment 2: 1.5–5000 μg/plate (+/− S9, pre‐incubation) | |||||||
| Micronucleus assay with FISH analysis | Human peripheral blood lymphocytes | 125, 150, 200, 250 μg/mL (4 h + 24 h, –S9) |
Positive FISH analysis indicates that naringenin induced micronuclei by a clastogenic mechanism |
Reliable without restrictions. Study performed according to OECD TG 487 and in compliance with GLP | High/High | Envigo Research Limited (2018b) | |
| 125, 150, 200 μg/mL (4 h + 24 h, +S9) | |||||||
| 100, 125, 150 μg/mL (24 h + 24 h, –S9) |
Abbreviations: FISH, fluorescence in situ hybridisation; GLP, good laboratory practice; OECD, Organisation for Economic Co‐operation and Development.
For the in vitro MN study, the given concentrations are those for the cultures that were scored for micronuclei.
TABLE D.2 Summary of newly submitted in vivo genotoxicity studies on naringenin (Documentation provided to EFSA No. 2 and 3).
| Chemical name [FL‐no] | Test system in vivo | Test object route | Doses (mg/kg bw per day) | Result | Reliability/comments | Relevance of test system/Relevance of the result | Reference |
|---|---|---|---|---|---|---|---|
|
Naringenin [16.132] |
Micronucleus assay in peripheral blood |
Wistar rats, M Gavage |
500, 1000, 2000 a | Negative | Reliable without restriction. Study performed according to OECD TG 474 and in compliance with GLP | High/High | Eurofins Biopharma (2019a, 2019b) |
| Comet assay in liver and duodenum |
Wistar rats, M Gavage |
Negative | Reliable without restriction. Study performed according to OECD TG 489 and in compliance with GLP | High/High | Eurofins Biopharma (2019a) |
Abbreviations: bw, body weight; GLP, good laboratory practice; M, males; OECD, Organisation for Economic Co‐operation and Development.
Naringenin was administered at 0, 24 and 45 h. Tissues were collected at 3 h after the final administration.
APPENDIX E. Toxicity data on naringenin
E.1.
Studies submitted by the applicant (Documentation provided to EFSA No. 1) reporting some toxicologically relevant parameters for naringenin are briefly summarised below.
5‐Day rat study with naringenin (Ortiz‐Andrade et al., 2008)
In a study primarily designed to assess the potential anti‐diabetic effects of naringenin in non‐insulin‐dependent diabetes mellitus (NIDDM) rats, the effects of naringenin on glucose and a few plasma lipid parameters were also investigated in normoglycaemic rats (Ortiz‐Andrade et al., 2008). Groups of Wistar rats (5/group; sex not reported) were administered naringenin by oral gavage at doses of 0 or 50 mg/kg bw per day for 1 or 5 days. In the single dose experiment, a statistically significant decrease in blood glucose levels (~ 10%) was observed in normoglycaemic animals compared to the control group, which disappeared 1 h after the administration. In the repeated dose study, no consistent effect on plasma glucose levels was observed. In addition, levels of total cholesterol, and HDL were significantly increased in animals treated with 5 mg/kg bw naringenin for 5 days, as compared to control animals. In an oral glucose tolerance test in rats, a single dose of naringenin (5 or 50 mg/kg bw) prevented or suppressed the increase in plasma glucose levels after subsequent administration of 2 g/kg bw glucose or sucrose. The study authors concluded that naringenin might delay glucose uptake from the GI tract. The observed effects were not such that they could be considered adverse.
In addition the study authors investigated the lethality of orally administered naringenin in mice and rats following the ‘acute toxic class’ method (OECD TG 423, version 1996). This study was not transparently reported, but the authors stated that its results indicated that naringenin should be classified for acute toxicity in Class 5, meaning that the LD50 was > 5000 mg/kg bw (Table E.1).
4‐Week rat study with naringenin (Motawi et al., 2014)
A study was conducted to evaluate the effects of naringenin administration on simvastatin‐induced liver damage in rats (Motawi et al., 2014). Female adult Wistar rats (8/group) were orally administered 50 mg/kg bw per day of naringenin for 4 weeks by gavage. The control group received tween 80 (the vehicle for simvastatin and naringenin). Blood samples were collected at the end of each week for haemoglobin and serum biochemistry analysis (ALT, AST, lactate dehydrogenase, creatine kinase, total protein, and albumin). At the end of the study period, the liver was examined for histopathological changes.
No significant differences in serum levels of AST, ALT, lactate dehydrogenase, creatine kinase, total protein, or albumin were noted between the naringenin‐only group and the control group. Serum levels of superoxide dismutase, glutathione and catalase were significantly increased. Levels of malondialdehyde, and glutathione S‐transferase activity were significantly decreased. With the exception of slight inflammatory cell infiltration in the portal areas, no significant changes were noted upon histopathological examination of the liver in the naringenin‐only group. Administration of naringenin together with simvastatin attenuated the adverse hepatic effects of simvastatin‐alone. The authors concluded that naringenin may have a protective effect on simvastatin‐induced hepatotoxicity.
20‐Week rat study with naringenin (Ganapathy et al., 2008)
A study was conducted to assess the effects of naringenin on chemically induced gastric carcinogenesis in rats (Ganapathy et al., 2008). As part of this study, one group of male Wistar rats (6 animals/group) was administered naringenin by gavage at a dose of 200 mg/kg bw per day for 20 weeks. The following biochemical parameters were analysed in stomach and liver samples: lipid peroxidation, reduced and oxidised glutathione concentrations, glutathione reductase activity, glutathione peroxidase activity, succinate dehydrogenase, cytochrome P450 reductase, cytochrome b5, nicotinamide adenine dinucleotide phosphate‐cytochrome c reductase and uridine 5′‐diphospho‐glucuronosyl transferase activity.
In the group of rats administered naringenin only, no significant effects were observed on any of the assessed biochemical parameters compared to the corn oil control group. The gastric mucosa of the naringenin‐only treated group was comparable to that of the control group. The authors concluded that naringenin could have a protective effect against MNNG‐induced gastric cancer.
TABLE E.1.
Summary of acute toxicity studies on naringenin [FL‐no: 16.132].
| Strain; sex; no/group | Route of administration | LD50 (mg/kg bw) | Reference | Comments |
|---|---|---|---|---|
| Mice (strain not specified); M; 3/group | Gavage | > 5000 | Ortiz‐Andrade et al. (2008) |
|
| Wistar rats; M; 3/group | Gavage | > 5000 | Ortiz‐Andrade et al. (2008) |
|
| Wistar rats; M; 10/group | Gavage | 340 and 331 | Selvam and Kaliyaperumal (2015) | An LD50 of 340 mg/kg bw was estimated using an arithmetic method; an LD50 of 331 mg/kg bw was obtained from probit analysis of mortality data |
Abbreviations: bw, body weight; M, male; LD50, median lethal dose; OECD, Organisation for Economic Co‐operation and Development.
APPENDIX F. Parameters analysed in the EOGRT study
F.1.
TABLE F.1 Parameters considered in the EOGRT study with the corresponding generation/cohort/number of animals for each.
| Generation | P | F1 pups (surplus) | F1 C1A | F1 C1B | F2 |
|---|---|---|---|---|---|
| Number of animals examined/sex per group | 25 | All | 20 | 20 | All |
| Mortality | X | X | X | X | X |
| Clinical signs | X | X | X | X | |
| Behavioural examination during lactation | X | X | X | X | |
| Detailed clinical examination | X | X | X | X | X |
| Body weight | X | X | X | X | X |
| Feed consumption | X | X | X | ||
| Haematology | X | X | |||
| Clinical biochemistry | X | X | |||
| Lymphocyte typing (spleen) | X | ||||
| Urinalysis | X | X | |||
| Thyroid hormone levels | X | X | X | ||
| Sexual maturation | X | X | X | ||
| Oestrous cycle data | X | X | X | ||
| Sperm parameters | X | X | |||
| Necropsy and gross pathology | X | X | X | X | X |
| Organ weight | X | X | X | X | |
| Histopathology | X | X | |||
| Reproductive parameters | X | X | |||
| Pre‐postnatal development | X | X | X | X | X |
| Sensory reflexes | X | X | X | X |
Note: A qualitative overview of the parameters analysed in the EOGRT study on naringenin is summarised in the tables below for each generation (P, F1 and F2). For the measured parameters, it is reported if a statistically significant change was observed (increase (↑) or decrease (↓)) or not (−). For a detailed explanation, see Section 3.4.4.2.
F.1. P generation
TABLE F.2 Parameters examined in animals of the parental (P) generation. Only statistically significant changes are reported; ‘–’: no statistically significant changes were observed; Dose groups: G1: 0, G2: 16,000, G3: 20,000, G4: 25,000 mg/kg feed. Unless specified differently, the reported values for the respective parameters are within the historical control ranges.
| Parameters examined | P generation | P generation |
|---|---|---|
| Males | Females | |
| Mortality | – | – |
| Clinical signs | – | – |
| Behavioural examination during lactation | – | – |
| Body weight during pre‐mating period | Changes in mean body weight and body weight gain, but not dose‐related | |
| Body weight during gestational period | n.a. | Mean gestational body weight on:
|
| Body weight during lactation | n.a. | Mean body weight on:
|
| Feed consumption during pre‐mating period | Mean feed consumption: during week 6, ↑G4 | Mean feed consumption: during week 10, ↑G3 and G4 |
| Haematology | Absolute eosinophil count: ↓G3 and G4 | – |
| Clinical biochemistry | – | – |
| Urinalysis |
|
– |
| Thyroid hormone levels | – | – |
| Oestrous cycle data | n.a. | Mean oestrus cycle duration: ↑G2 and G4 |
| Sperm parameters | Sperm with abnormalities: ↑G3 and G4 | n.a. |
| Necropsy and gross pathology | – | – |
| Organ weight | – | Absolute and relative thyroid+parathyroid weights: ↓G3 |
| Histopathology | – | – |
| Pre‐coital time | – | –, but longer than anticipated for Sprague–Dawley rats |
| Litter size | n.a. | –, but a dose‐related trend ↓ was observed |
| Post‐implantation loss | n.a. | –, but a dose‐related trend ↑ was observed |
Abbreviations: ‘–’, statistically not significant; ↑, increase; ↓, decrease; G, dose group; GD, gestational period; LD, lactation day; n.a., not applicable.
F.2. F1 generation
TABLE F.3 Parameters examined in F1 generation animals. Only statistically significant changes are reported; ‘–’: no statistically significant changes were observed. Dose groups: G1: 0, G2: 16,000, G3: 20,000, G4: 25,000 mg/kg feed. Unless specified differently, the reported values for the respective parameters are within the historical control ranges.
| Parameters examined | F1 pups (surplus) | F1 pups (surplus) | F1 C1A | F1 C1A | F1 C1B | F1 C1B |
|---|---|---|---|---|---|---|
| Males | Females | Males | Females | Males | Females | |
| Mortality | – | – | – | – | – | – |
| Clinical signs | n.d. | n.d. | – | – | – | – |
| Behavioural examination during lactation | – | – | – | – | – | – |
| Detailed clinical examination | n.d. | n.d. | – | – | – | – |
| Mean body weight | PND21, ↓ G2 | PND21, ↓ G2 | PND21, 28, 35, 42: ↓ G2 | PND21, 28: ↓ G2 | PND 49, 56 to 112: ↑ G3 | PND 21 to 42: ↓ G2 |
| PND 95: ↑ G3 | ||||||
| Mean body weight gain | n.d. | n.d. | – | PND 21 to 42: ↑ G3 | PND 21–42 to 21–112: ↑ G3 | – |
| Feed consumption (during gestation) | n.a. | n.a. | n.a. | n.a. | n.a. | GD 1–7: ↑ G2 and G3 |
| GD 14–20: ↑ G2 | ||||||
| Haematology | n.d. | n.d. | – | Platelet count: ↑ G4 | n.d. | n.d. |
| Clinical biochemistry | n.d. | n.d. | – | – | n.d. | n.d. |
| Lymphocyte typing (spleen) | n.d. | n.d. |
T helper cells (CD4+): ↑ G2, G3 and G4, no dose‐related trend |
– | n.d. | n.d. |
| Urinalysis | n.d. | n.d. | – | – | n.d. | n.d. |
| Thyroid hormone levels |
TSH: PND 21, − |
TSH: PND 21, − |
TSH: – | TSH: ↑ G2 | n.d. | n.d. |
|
T4: PND4, ↑ G2; PND21, ↓ G4 |
T4: PND4, ↑ G2; PND21, ↓ G4 |
T4: – | T4: – | n.d. | n.d. | |
| Sexual maturation (body weight at balanopreputial separation) | n.d. | n.a. | ↓ G2 and G3 | n.a. | – | n.a. |
| Oestrous cycle data | n.a. | n.d. | n.a. | – | n.a. | – |
| Sperm parameters (mean daily sperm production) | n.d. | n.a. | ↓ G2 and G3 | n.a. | n.d. | n.a. |
| Necropsy and gross pathology | – | – | – | – | – | – |
| Histopathology | n.d | n.d. | – | – | n.d. | n.d. |
| Absolute organ weight |
PND 21: ↑ G3 spleen |
PND 21: ↓ G2 spleen; ↑ G3 spleen; ↓ G2 brain |
↓ G2 and G3 testes and iliac lymph nodes | ↑ G3, G4 thymus | ↑ G3 thymus | ↑ G4 thymus |
|
↓ G4 iliac lymph nodes |
↑ G4 spleen and iliac lymph nodes | ↑ G3 uterus with cervix | ||||
| Relative organ weight |
PND 21: ↑ G3 spleen |
PND 21: ↑ G3 spleen |
↓ G2, G3, G4 Iliac lymph nodes ↓ G3 testes, brain, liver ↑ G3 terminal bw |
– | ↓ G3 testes | ↑ G4 thymus |
| Reproductive parameters | n.d. | n.d. | n.d. | n.d. | – | – |
| Pre‐postnatal development | – | – | – | – | – | – |
| Pinna unfold and eye opening | ↓ G4 | ↓ G4 | ↓ G4 | ↓ G4 | ↓ G4 | ↓ G4 |
| Mean anogenital distance per litter | – | ↓ G4 | – | ↓ G4 | – | ↓ G4 |
| Anogenital distance ratio per litter | – | ↓ G3 and G4 | – | ↓ G3 and G4 | – | ↓ G3 and G4 |
| Sensory reflexes | – | – | – | – | – | – |
Abbreviations: ↑, increase; ↓, decrease; ‘–’, statistically not significant; G, dose group; GD, gestation day; PND, post‐natal day; n.a., not applicable; n.d., not determined.
F.3. F2 generation
TABLE F.4 Parameters examined in F2 generation animals. Only statistically significant changes are reported; ‘‐’: no statistically significant changes were observed. Dose groups: G1: 0, G2: 16,000, G3: 20,000, G4: 25,000 mg/kg feed. Unless specified differently, the reported values for the respective parameters are within the historical control ranges.
| Parameters examined | F2 males | F2 females |
|---|---|---|
| Sex ratio and litter size | – | – |
| Mortality | – | – |
| Clinical signs | – | – |
| Behavioural examination during lactation | – | – |
| Detailed clinical examination | – | – |
| Body weight | PND1: ↓ G4 | PND4: ↓ G4 |
| PND14: ↓ G3 and G4 | ||
| Sexual maturation (AGD and AGD ratio) | ↑ G4 | – |
| Necropsy and gross pathology | – | – |
| Pre‐postnatal development (postnatal fur development) | ↑ G3 | ↑ G3 |
| Sensory reflexes | – | – |
Abbreviations: ‘–’, statistically not significant; ↑, increase; ↓, decrease; G, dose group; PND, post‐natal day.
EFSA FAF Panel (EFSA Panel on Food Additives and Flavourings) , Younes, M. , Aquilina, G. , Castle, L. , Degen, G. , Engel, K.‐H. , Fowler, P. J. , Frutos Fernandez, M. J. , Fürst, P. , Gundert‐Remy, U. , Gürtler, R. , Husøy, T. , Manco, M. , Moldeus, P. , Passamonti, S. , Shah, R. , Waalkens‐Berendsen, I. , Wright, M. , Benigni, R. , … Mennes, W. (2024). Flavouring Group Evaluation 413 (FGE.413): Naringenin. EFSA Journal, 22(5), e8747. 10.2903/j.efsa.2024.8747
Adopted: 20 March 2024
Notes
Regulation (EC) No 1334/2008 of the European Parliament and of the Council of 16 December 2008 on flavourings and certain food ingredients with flavouring properties for use in and on foods and amending Council Regulation (EEC) No 1601/91, Regulations (EC) No 2232/96 and (EC) No 110/2008 and Directive 2000/13/EC. OJ L 354, 31.12.2008, p. 34–50.
Regulation (EC) No 1331/2008 of the European Parliament and of the Council of 16 December 2008 establishing a common authorisation procedure for food additives, food enzymes and food flavourings. OJ L354, 31.12.2008, p. 1–6.
In FGE.410 (EFSA CEF Panel, 2017), EFSA CEF Panel concluded that naringenin could not be predicted to be metabolised to innocuous metabolites, because of an incomplete mass balance in the available human ADME studies.
For Sprague Dawley (derived) rats, the cohabitation period has been reported to be between 1.8 and 4.4 days (mean: 2.9 ± 0.6 days) in the P generation and between 2.4 and 4.0 days (mean: 3.1 ± 0.5 days) for the F1 parental animals (Marty et al., 2009).
The conclusion reached here with respect to the potential interaction of naringenin with the kinetics of medicinal products is strictly applicable to the use of naringenin as flavouring substance. It should not impact on the common medical practice to warn against consumption of grapefruit juice in combination with the use of certain medicinal products.
Determined with OECD QSAR Toolbox (version 4.6 available at https://qsartoolbox.org/).
REFERENCES
- Abd El Mohsen, M. , Marks, J. , Kuhnle, G. , Rice‐Evans, C. , Moore, K. , Gibson, G. , Debnam, E. , & Srai, K. (2004). The differential tissue distribution of the citrus flavanone Naringenin following gastric instillation. Free Radical Research, 38, 1329–1340. [DOI] [PubMed] [Google Scholar]
- Abe, K. , Nakada, Y. , Suziku, A. , & Yumioka, E. (1993). Biliary metabolites of hesperetin in rats. Traditional Chinese Medicine Research Lab, 47(1), 43–46. [Google Scholar]
- Actis‐Goretta, L. , Dew, T. P. , Lévèques, A. , Pereira‐Caro, G. , Rein, M. , Teml, A. , Schäfer, C. , Hofmann, U. , Schwab, M. , Eichelbaum, M. , Crozier, A. , & Williamson, G. (2015). Gastrointestinal absorption and metabolism of hesperetin‐7‐O‐rutinoside and hesperetin‐7‐O‐glucoside in healthy humans. Molecular Nutrition & Food Research, 59, 1651–1662. [DOI] [PubMed] [Google Scholar]
- Alotaibi, F. (2023). Naringenin alters the pharmacokinetics of ranolazine in part through the inhibition of cytochrome P450 (3A4) and P‐glycoprotein. Future Journal of Pharmaceutical Sciences, 9(23), 1–11.36620352 [Google Scholar]
- Amer, D. A. M. , Kretzschmar, G. , Müller, N. , Stanke, N. , Lindemann, D. , & Vollmer, G. (2010). Activation of transgenic estrogen receptor‐beta by selected phytoestrogens in a stably transduced rat serotonergic cell line. The Journal of Steroid Biochemistry and Molecular Biology, 120, 208–217. [DOI] [PubMed] [Google Scholar]
- Aschoff, J. K. , Riedl, K. M. , Cooperstone, J. L. , Högel, J. , Bosy‐Westphal, A. , Schwartz, S. J. , Carle, R. , & Schweiggert, R. M. (2016). Urinary excretion of citrus flavanones and their major catabolites after consumption of fresh oranges and pasteurized orange juice: A randomized cross‐over study. Molecular Nutrition & Food Research, 60(12), 2602–2610. [DOI] [PMC free article] [PubMed] [Google Scholar]
- Bailey, D. G. , Dresser, G. , & Arnold, J. M. (2013). Grapefruit‐medication interactions: Forbidden fruit or avoidable consequences? Canadian Medical Association Journal, 185(4), 309–316. [DOI] [PMC free article] [PubMed] [Google Scholar]
- Bailey, D. G. , Dresser, G. K. , Kreeft, J. H. , Munoz, C. , Freeman, D. J. , & Bend, J. R. (2000). Grapefruit‐felodipine interaction: Effect of unprocessed fruit and probable active ingredients. Clinical Pharmacology and Therapeutics, 68(5), 468–477. [DOI] [PubMed] [Google Scholar]
- Bhagwat, S. , Haytowitz, D. B. , & Holden, J. M. (2014). USDA database for the flavonoid content of selected foods, release 3.1. U.S. Department of Agriculture and Agricultural Research. Nutrient Data Laboratory Home Page. http://www.ars.usda.gov/nutrientdata/flav
- Biesaga, M. , Ochnik, U. , & Pyrzynska, K. (2009). Fast analysis of prominent flavonoids in tomato using a monolithic column and isocratic HPLC. Journal of Separation Science, 32, 2835–2840. [DOI] [PubMed] [Google Scholar]
- Booth, A. N. , Emerson, O. H. , Jones, F. T. , & Deeds, F. (1957). Urinary metabolites of caffeic and chlorogenic acids. The Journal of Biological Chemistry, 229(1), 51–59. [PubMed] [Google Scholar]
- Borgert, C. J. , Matthews, J. C. , & Baker, S. P. (2018). Human‐relevant potency threshold (HRPT) for ERα agonism. Archives of Toxicology, 92(5), 1685–1702. [DOI] [PMC free article] [PubMed] [Google Scholar]
- Branham, W. S. , Dial, S. L. , Moland, C. L. , Hass, B. S. , Blair, R. M. , Fang, H. , Shi, L. , Tong, W. , Perkins, R. G. , & Sheehan, D. M. (2002). Phytoestrogens and mycoestrogens bind to the rat uterine estrogen receptor. The Journal of Nutrition, 132, 658–664. [DOI] [PubMed] [Google Scholar]
- Breinholt, V. M. , Svendsen, G. W. , Dragsted, L. O. , & Hossaini, A. (2004). The citrus‐derived flavonoid naringenin exerts uterotrophic effects in female mice at human relevant doses. Basic & Clinical Pharmacology & Toxicology, 94, 30–36. [PubMed] [Google Scholar]
- Brown, J. P. , & Dietrich, P. S. (1979). Mutagenicity of plant flavonols in the salmonella/mammalian microsome test: Activation of flavonol glycosides by mixed glycosidases from rat cecal bacteria and other sources. Mutation Research, 66, 223–240. [DOI] [PubMed] [Google Scholar]
- Bugianesi, R. , Catasta, G. , Spigno, P. , D'Uva, A. , & Maiani, G. (2002). Naringenin from cooked tomato paste is bioavailable in men. The Journal of Nutrition, 132, 3349–3352. [DOI] [PubMed] [Google Scholar]
- Caris‐Veyrat, C. , Amiot, M. J. , Tyssandier, V. , Grasselly, D. , Buret, M. , Mikolajczak, M. , Guilland, J. C. , Bouteloup‐Demange, C. , & Borel, P. (2004). Influence of organic versus conventional agricultural practice on the antioxidant microconstituent content of tomatoes and derived purees; consequences on antioxidant plasma status in humans. Journal of Agricultural and Food Chemistry, 52(21), 6503–6509. [DOI] [PubMed] [Google Scholar]
- Cohen, S. M. , Fukushima, S. , Goodermam, N. J. , Hecht, S. S. , Marnett, L. J. , Rietjens, I. M. C. M. , & Smith, R. L. (2015a). GRAS 27 flavoring substances [FEMA expert panel]. Food Technology, 69, 40–59. [including supplementary information]. [Google Scholar]
- Cohen, S. M. , Fukushima, S. , Goodermam, N. J. , Hecht, S. S. , Marnett, L. J. , Rietjens, I. M. C. M. , & Smith, R. L. (2015b). GRAS 27 Flavoring Substances (List of substances, Accompanying Use Level Tables and Supplementary Information). Flavor & Extract Manufacturers Association (FEMA), Expert Panel, Washington, DC.
- Davies, J. N. , & Hobson, G. E. (1981). The constituents of tomato fruit‐the influence of environment, nutrition, and genotype. CRC Critical Reviews in Food Science and Nutrition, 15, 205–280. [DOI] [PubMed] [Google Scholar]
- EFSA (European Food Safety Authority) . (2012). Proposed template to be used in drafting scientific opinion on flavouring substances (explanatory notes for guidance included). EFSA Journal, 10(1), 218. 10.2903/sp.efsa.2012.EN-218 [DOI] [Google Scholar]
- EFSA CEF Panel (EFSA Panel on Food Contact Materials, Enzymes, Flavourings and Processing Aids) . (2010a). Guidance on the data required for the risk assessment of flavourings to be used in or on foods. EFSA Journal, 8(6), 1623. 10.2093/j.efsa.2010.1623 [DOI] [Google Scholar]
- EFSA CEF Panel (EFSA Panel on Food Contact Materials, Enzymes, Flavourings and Processing Aids) . (2010b). Scientific opinion on Flavouring group evaluation 32 (FGE.32): Flavonoids (flavanones and dihydrochalcones) from chemical groups 25 and 30. EFSA Journal, 8(9), 1065. 10.2903/j.efsa.2010.1065 [DOI] [Google Scholar]
- EFSA CEF Panel (EFSA Panel on Food Contact Materials, Enzymes, Flavourings and Processing Aids) . (2017). Scientific opinion of Flavouring group evaluation 410 (FGE.410): 4′,5,7‐trihydroxyflavanone from chemical group 25 (phenol derivatives containing ring‐alkyl, ring‐alkoxy, and side‐chains with an oxygenated functional group). EFSA Journal, 15(11), 5011. 10.2903/j.efsa.2017.5011 [DOI] [PMC free article] [PubMed] [Google Scholar]
- EFSA FAF Panel (EFSA Panel on Food Additives and Flavourings) . (2022). Scientific guidance on the data required for the risk assessment of flavourings to be used in or on foods. EFSA Journal, 20(12), 7673. 10.2903/j.efsa.2022.7673 [DOI] [PMC free article] [PubMed] [Google Scholar]
- EFSA Scientific Committee . (2009). Guidance of the scientific committee on transparency in the scientific aspects of risk assessments carried out by EFSA. Part 2: General principles. EFSA Journal, 7(7), 1051. 10.2903/j.efsa.2009.1051 [DOI] [Google Scholar]
- EFSA Scientific Committee . (2011). Scientific opinion on genotoxicity testing strategies applicable to food and feed safety assessment. EFSA Journal, 9(9), 2379. 10.2903/j.efsa.2011.2379 [DOI] [Google Scholar]
- EFSA Scientific Committee . (2021). Guidance on technical requirements for regulated food and feed product applications to establish the presence of small particles including nanoparticles. EFSA Journal, 19(8), 6769. 10.2903/j.efsa.2021.6769 [DOI] [PMC free article] [PubMed] [Google Scholar]
- EMA (European Medicines Agency) . (2012). Guideline on the investigation of drug interactions . https://www.ema.europa.eu/en/investigation‐drug‐interactions‐scientific‐guideline
- Erlund, I. , Meririnne, E. , Alfthan, G. , & Aro, A. (2001). Plasma kinetics and urinary excretion of the flavanones naringenin and hesperetin in humans after ingestion of orange juice and grapefruit juice. The Journal of Nutrition, 131(2), 235–241. [DOI] [PubMed] [Google Scholar]
- Evans, A. M. (1986). Age at puberty and first litter size in early and late paired rats. Biology of Reproduction, 34(2), 322–326. [DOI] [PubMed] [Google Scholar]
- FAO/WHO . (2008). Joint FAO/WHO Expert Committee on Food Additives. Sixty‐ninth meeting, Rome, Italy, 17–26 June 2008. Summary and conclusions. Issued 4 July 2008. Available at: https://www.fao.org/documents/card/en/c/c1dfe308‐c04e‐444d‐9885‐e2b20ef6bb07/
- Fasinu, P. , Choonara, Y. E. , Khan, R. A. , Du Toit, L. C. , Kumar, P. , Ndesendo, V. M. , & Pillay, V. (2013). Flavonoids and polymer derivatives as CYP3A4 inhibitors for improved oral drug bioavailability. Journal of Pharmaceutical Sciences, 102(2), 541–555. [DOI] [PubMed] [Google Scholar]
- Fasinu, P. , Choonara, Y. E. , & Pillay, V. (2010). Improving the oral bioavailability of drugs through the design of modeled pre‐systemic cytochrome P450 inhibitors. [Master's thesis]. Faculty of Health Sciences, University of the Witwatersrand. [Google Scholar]
- Felgines, C. , Texier, O. , Morand, C. , Manach, C. , Scalbert, A. , Régerat, F. , & Rémésy, C. (2000). Bioavailability of the flavanone naringenin and its glycosides in rats. American journal of physiology. Gastrointestinal and Liver Physiology, 279, G1148–G1154. [DOI] [PubMed] [Google Scholar]
- Fukuda, K. , Ohta, T. , & Yamazoe, Y. (1997). Grapefruit component interacting with rat and human P450 CYP3A: Possible involvement of non‐flavonoid components in drug interaction. Biological and Pharmaceutical Bulletin, 20(5), 560–564. [DOI] [PubMed] [Google Scholar]
- Ganapathy, E. , Peramaiyan, R. , Rajasekaran, D. , Venkataraman, M. , & Dhanapal, S. (2008). Modulatory effect of naringenin on N‐methyl‐N'‐nitro‐N‐nitrosoguanidine‐ and saturated sodium chloride‐induced gastric carcinogenesis in male Wistar rats. Clinical and Experimental Pharmacology & Physiology, 35, 1190–1196. [DOI] [PubMed] [Google Scholar]
- Gardana, C. , Guarnieri, S. , Riso, P. , Simonetti, P. , & Porrini, M. (2007). Flavanone plasma pharmacokinetics from blood orange juice in human subjects. British Journal of Nutrition, 98, 165–172. [DOI] [PubMed] [Google Scholar]
- Guo, L. Q. , & Yamazoe, Y. (2004). Inhibition of cytochrome P450 by furanocoumarins in grapefruit juice and herbal medicines. Acta Pharmacologica Sinica, 25(2), 129–136. [PubMed] [Google Scholar]
- Hanley, M. J. , Cancalon, P. , Widmer, W. W. , & Greenblatt, D. J. (2011). The effect of grapefruit juice on drug disposition. Expert Opinion on Drug Metabolism & Toxicology, 7(3), 267–286. [DOI] [PMC free article] [PubMed] [Google Scholar]
- Helle, J. , Zierau, O. , Kräker, K. , Keiler, A. , Vollmer, G. , Welsh, J. E. , & Kretzschmar, G. (2015). Estimation of safety/risk profile of the phytoestrogens 8‐prenylnaringenin, 6‐(1.1‐ dimethylallyl)naringenin and naringenin in MCF‐7 cells and the rat mammary gland. Experimental and Clinical Endocrinology & Diabetes, abstract, 122(3). [Google Scholar]
- Ho, P. C. , Saville, D. J. , Coville, P. F. , & Wanwimolruk, S. (2000). Content of CYP3A4 inhibitors, naringin, naringenin and bergapten in grapefruit and grapefruit juice products. Pharmaceutica Acta Helvetiae, 74, 379–385. [DOI] [PubMed] [Google Scholar]
- Ho, P. C. , Saville, D. J. , & Wanwimolruk, S. (2001). Inhibition of human CYP3A4 activity by grapefruit flavonoids, furanocoumarins and related compounds. Journal of Pharmacy and Pharmaceutical Sciences, 4(3), 217–227. [PubMed] [Google Scholar]
- Hsiu, S. L. , Huang, T. Y. , Hou, Y. C. , Chin, D. H. , & Chap, P. D. (2002). Comparison of metabolic pharmacokinetics of naringin and naringenin in rabbits. Life Sciences, 70, 1481–1489. [DOI] [PubMed] [Google Scholar]
- Huang, Z. , Fang, F. , Wang, J. , & Wong, C.‐W. (2010). Structural activity relationship of flavonoids with estrogen‐related receptor gamma. FEBS Letters, 584, 22–26. [DOI] [PubMed] [Google Scholar]
- ICRP (International Commission on Radiological Protection) . (2002). Basic Anatomical and Physiological Data for Use in Radiological Protection Reference Values. ICRP Publication 89. Annals of the ICRP, volume 32, No. 3–4. 10.1177/ANIB_32_3-4 [DOI] [PubMed]
- JECFA (Joint FAO/WHO Expert Committee on Food Additives) . (2022). Safety evaluation of certain food additives: prepared by the eighty‐ninth meeting of the Joint FAO/WHO Expert Committee on Food Additives (JECFA). World Health Organization and Food and Agriculture Organization of the United Nations, Geneva (WHO Food Additives Series, No. 80).
- Justesen, U. , Arrigoni, E. , Larsen, B. R. , & Amado, R. (2000). Degradation of flavonoid glycosides and Aglycones during in vitro fermentation with human Faecal Flora. LWT‐ Food Science and Technology, 33, 424–430. [Google Scholar]
- Justesen, U. , Knuthsen, P. , & Leth, T. (1998). Quantitative analysis of flavonols, flavones, and flavanones in fruits, vegetables and beverages by high‐performance liquid chromatograph with photo‐diode array and mass spectrometric detection. Journal of Chromatography, A799, 101–110. [DOI] [PubMed] [Google Scholar]
- Kanaze, F. I. , Bounartzi, M. I. , Georgarakis, M. , & Niopas, I. (2007). Pharmacokinetics of the citrus flavanone aglycones hesperetin and naringenin after single oral administration in human subjects. European Journal of Clinical Nutrition, 61, 472–477. [DOI] [PubMed] [Google Scholar]
- Kawaii, S. , Tomono, Y. , Katase, E. , Ogawa, K. , & Yano, M. (1999). Quantitation of flavonoid constituents in citrus fruits. Journal of Agricultural and Food Chemistry, 47, 3565–3571. [DOI] [PubMed] [Google Scholar]
- Ke, J.‐Y. , Schwartz, S. J. , Riedl, K. M. , Yee, L. D. , Kliewer, K. L. , & Belury, M. A. (2013). Accumulation of dietary naringenin and metabolites in mice. The FASEB Journal, 27(1, Suppl) 636.2–636.2. [Google Scholar]
- Khan, A. W. , Kotta, S. , Ansari, A. H. , Sharma, R. K. , & Ali, J. (2015). Self‐nanoemulsifying drug delivery system (SNEDDS) of poorly water‐soluble grapefruit flavonoid Naringenin: Design, characterization, in vitro and in vivo evaluation. Drug Delivery, 22(4), 552–561. [DOI] [PubMed] [Google Scholar]
- Kim, D. H. , Jung, E. A. , Sohng, I. S. , Han, J. A. , Kim, T. H. , & Han, M. J. (1998). Intestinal bacterial metabolism of flavonoids and its relation to some biological activities. Archives of Pharmacal Research, 21(1), 17–23. [DOI] [PubMed] [Google Scholar]
- Kim, S. , & Park, T. I. (2013). Naringenin: A partial agonist on estrogen receptor in T47D‐KBluc breast cancer cells. International Journal of Clinical and Experimental Medicine, 6, 890–899. [PMC free article] [PubMed] [Google Scholar]
- Labib, S. , Erb, A. , Kraus, M. , Wickert, T. , & Richling, E. (2004). The pig caecum model: A suitable tool to study the intestinal metabolism of flavonoids. Molecular Nutrition & Food Research, 48, 326–332. [DOI] [PubMed] [Google Scholar]
- Li, P. , Wang, S. , Guan, X. , Cen, X. , Hu, C. , Peng, W. , Wang, Y. , & Su, W. (2014). Six months chronic toxicological evaluation of naringin in Sprague–Dawley rats. Food and Chemical Toxicology, 66, 65–75. [DOI] [PubMed] [Google Scholar]
- Li, P. , Wang, S. , Guan, X. , Liu, B. , Wang, Y. , Xu, K. , Peng, W. , Su, W. , & Zhang, K. (2013). Acute and 13 weeks subchronic toxicological evaluation of naringin in Sprague‐Dawley rats. Food and Chemical Toxicology, 60, 1–9. [DOI] [PubMed] [Google Scholar]
- Lin, S. P. , Hou, Y. C. , Tsai, S. Y. , Wang, M. J. , & Chao, P. D. (2014). Tissue distribution of naringenin conjugated metabolites following repeated dosing of naringin to rats. Biomedicine (Taipei), 4(3), 16. [DOI] [PMC free article] [PubMed] [Google Scholar]
- Lu, W. J. , Ferlito, V. , Xu, C. , Flockhart, D. A. , & Caccamese, S. (2011). Enantiomers of naringenin as pleiotropic, stereoselective inhibitors of cytochrome P450 isoforms. Chirality, 23(10), 891–896. [DOI] [PMC free article] [PubMed] [Google Scholar]
- Lucas‐Abellán, C. , Pérez‐Abril, M. , Castillo, J. , Serrano, A. , Mercader, M. T. , Fortea, M. I. , Gabaldón, J. A. , & Núñez‐Delicado, E. (2019). Effect of temperature, pH, β‐ and HP‐β‐cds on the solubility and stability of flavanones: Naringenin and hesperetin. LWT, 108, 233–239. [Google Scholar]
- Ma, Y. , Li, P. , Chen, D. , Fang, T. , Li, H. , & Su, W. (2006). LC/MS/MS quantitation assay for pharmacokinetics of naringenin and double peaks phenomenon in rats plasma. International Journal of Pharmaceutics, 307, 292–299. [DOI] [PubMed] [Google Scholar]
- Marty, M. S. , Allen, B. , Chapin, R. E. , Cooper, R. , Daston, G. P. , Flaws, J. A. , Foster, P. M. D. , Makris, S. L. , Mylchreest, E. , Sandler, D. , & Tyl, R. W. (2009). Inter‐laboratory control data for reproductive endpoints required in the OPPTS 870.3800/OECD 416 reproduction and fertility test. Birth Defects Research (Part B), 86, 470–489. [DOI] [PubMed] [Google Scholar]
- Miniscalco, A. , Lundahl, J. , Regårdh, C. G. , Edgar, B. , & Eriksson, U. G. (1992). Inhibition of dihydropyridine metabolism in rat and human liver microsomes by flavonoids found in grapefruit juice. The Journal of Pharmacology and Experimental Therapeutics, 261(3), 1195–1199. [PubMed] [Google Scholar]
- Motawi, T. K. , Teleb, Z. A. , El‐Boghdady, N. A. , & Ibrahim, S. A. (2014). Effect of simvastatin and naringenin coadministration on rat liver DNA fragmentation and cytochrome P450 activity: An in vivo and in vitro study. Journal of Physiology and Biochemistry, 70, 225–237. [DOI] [PubMed] [Google Scholar]
- Mudie, D. M. , Murray, K. , Hoad, C. L. , Pritchard, S. E. , Garnett, M. C. , Gordon, L. , Amidon, G. L. , Gowland, P. A. , Spiller, R. C. , Amidon, G. E. , & Marciani, L. (2014). Quantification of gastrointestinal liquid volumes and distribution following a 240 mL dose of water in the fasted state. Molecular Pharmaceutics, 11, 3039–3047. [DOI] [PubMed] [Google Scholar]
- Nagao, M. , Morita, N. , Yahagi, T. , Shimizu, M. , Kuroyanagi, M. , Fukuoka, M. , Yoshihira, K. , Matori, S. , Fujino, T. , & Sugimura, T. (1981). Mutagenicities of 61 flavonoids and 11 related compounds. Environmental Mutagenesis, 3, 401–419. [DOI] [PubMed] [Google Scholar]
- Nielsen, I. L. , Chee, W. S. , Poulsen, L. , Offord‐Cavin, E. , Rasmussen, S. E. , Frederiksen, H. , Enslen, M. , Barron, D. , Horcajada, M. N. , & Williamson, G. (2006). Bioavailability is improved by enzymatic modification of the citrus flavonoid hesperidin in humans: A randomized, double‐blind, crossover trial. The Journal of Nutrition, 136, 404–408. [DOI] [PubMed] [Google Scholar]
- OECD (Organisation for Economic Co‐operation and Development) . (1997). Test No. 471: Bacterial Reverse Mutation Test. OECD Guidelines for the Testing of Chemicals, Section 4. 10.1787/9789264071247-en [DOI]
- OECD (Organisation for Economic Co‐operation and Development) . (2016a). Test No. 487: In Vitro Mammalian Cell Micronucleus Test. OECD Guidelines for the Testing of Chemicals, Section 4. 10.1787/9789264264861-en [DOI]
- OECD (Organisation for Economic Co‐operation and Development) . (2016b). Test No. 474: Mammalian Erythrocyte Micronucleus Test. OECD Guidelines for the Testing of Chemicals, Section 4. 10.1787/9789264264762-en [DOI]
- OECD (Organisation for Economic Co‐operation and Development) . (2016c). Test No. 489: In Vivo Mammalian Alkaline Comet Assay. OECD Guidelines for the Testing of Chemicals, Section 4. 10.1787/9789264264885-en [DOI]
- OECD (Organisation for Economic Co‐operation and Development) . (2016d). Test No. 421: Reproduction/Developmental Toxicity Screening Test. OECD Guidelines for the Testing of Chemicals, Section 4. 10.1787/9789264264380-en [DOI]
- OECD (Organisation for Economic Co‐operation and Development) . (2018a). Test No. 408: Repeated Dose 90‐DayOral Toxicity Study in Rodents (OECD TG), in Revised Guidance Document 150 on Standardised Test Guidelines for Evaluating Chemicals for Endocrine Disruption, OECD Publishing, Paris. 10.1787/9789264304741-en [DOI]
- OECD (Organisation for Economic Co‐operation and Development) . (2018b). Test No. 443: Extended One‐Generation Reproductive Toxicity Study. OECD Guidelines for the Testing of Chemicals, Section 4. 10.1787/9789264185371-en [DOI]
- Orrego‐Lagarón, N. , Martínez‐Huélamo, M. , Vallverdú‐Queralt, A. , Lamuela‐Raventos, R. M. , & Escribano‐Ferrer, E. (2015). High gastrointestinal permeability and local metabolism of naringenin: Influence of antibiotic treatment on absorption and metabolism. British Journal of Nutrition, 114, 169–180. [DOI] [PubMed] [Google Scholar]
- Orrego‐Lagarón, N. , Vallverdú‐Queralt, A. , Martínez‐Huélamo, M. , Lamuela‐Raventos, R. M. , & Escribano‐Ferrer, E. (2016). Metabolic profile of naringenin in the stomach and colon using liquid chromatography/electrospray ionization linear ion trap quadrupole‐Orbitrap‐mass spectrometry (LC‐ESI‐LTQ‐Orbitrap‐MS) and LC‐ESI‐MS/MS. Journal of Pharmaceutical and Biomedical Analysis, 120, 38–45. [DOI] [PubMed] [Google Scholar]
- Ortiz‐Andrade, R. R. , Sánchez‐Salgado, J. C. , Navarrete‐Vázquez, G. , Webster, S. P. , Binnie, M. , García‐Jiménez, S. , León‐Rivera, I. , Cigarroa‐Vázquez, P. , Villalobos‐Molina, R. , & Estrada‐Soto, S. (2008). Antidiabetic and toxicological evaluations of naringenin in normoglycaemic and NIDDM rat models and its implications on extra‐pancreatic glucose regulation. Diabetes, Obesity & Metabolism, 10, 1097–1104. [DOI] [PubMed] [Google Scholar]
- Paganga, G. , Miller, N. , & Rice‐Evans, C. A. (1999). The polyphenolic content of fruit and vegetables and their antioxidant activities. What does a serving constitute? Free Radical Research, 30, 153–162. [DOI] [PubMed] [Google Scholar]
- Paine, M. F. , Hart, H. L. , Ludington, S. S. , Haining, R. L. , Rettie, A. E. , & Zeldin, D. C. (2006). The human intestinal cytochrome P450 "pie". Drug Metabolism and Disposition, 34(5), 880–886. [DOI] [PMC free article] [PubMed] [Google Scholar]
- Pereira‐Caro, G. , Borges, G. , Ky, I. , Ribas, A. , Calani, L. , Del Rio, D. , Clifford, M. N. , Roberts, S. A. , & Crozier, A. (2015). In vitro colonic catabolism of orange juice (poly)phenols. Molecular Nutrition & Food Research, 59(3), 465–475. [DOI] [PubMed] [Google Scholar]
- Pereira‐Caro, G. , Borges, G. , van der Hooft, J. , Clifford, M. N. , Del Rio, D. , Lean, M. E. , Roberts, S. A. , Kellerhals, M. B. , & Crozier, A. (2014). Orange juice (poly)phenols are highly bioavailable in humans. The American Journal of Clinical Nutrition, 100, 1378–1384. [DOI] [PubMed] [Google Scholar]
- Pereira‐Caro, G. , Fernández‐Quirós, B. , Ludwig, I. , Pradas, I. , Crozier, A. , & Moreno‐Rojas, J. M. (2016). Catabolism of citrus flavanones by the probiotics Bifidobacterium longum and lactobacillus rhamnosus . European Journal of Nutrition, 57, 231–242. [DOI] [PubMed] [Google Scholar]
- Pereira‐Caro, G. , Ordóñez, J. L. , Ludwig, I. , Gaillet, S. , Mena, P. , Del Rio, D. , Rouanet, J. M. , Bindon, K. A. , Moreno‐Rojas, J. M. , & Crozier, A. (2018). Development and validation of an UHPLC‐HRMS protocol for the analysis of flavan‐3‐ol metabolites and catabolites in urine, plasma and feces of rats fed a red wine proanthocyanidin extract. Food Chemistry, 252, 49–60. [DOI] [PubMed] [Google Scholar]
- Pingili, R. , Vemulapalli, S. , Mullapudi, S. S. , Nuthakki, S. , Pendyala, S. , & Kilaru, N. (2016). Pharmacokinetic interaction study between flavanones (hesperetin, naringenin) and rasagiline mesylate in wistar rats. Drug Development and Industrial Pharmacy, 42, 1110–1117. [DOI] [PubMed] [Google Scholar]
- Rebello, C. J. , Beyl, R. A. , Lertora, J. J. L. , Greenway, F. L. , Ravussin, E. , Ribnicky, D. M. , Poulev, A. , Kennedy, B. J. , Castro, H. F. , Campagna, S. R. , Coulter, A. A. , & Redman, L. M. (2020). Safety and pharmacokinetics of naringenin: A randomized, controlled, single‐ascending‐dose clinical trial. Diabetes, Obesity and Metabolism, 22(1), 91–98. [DOI] [PMC free article] [PubMed] [Google Scholar]
- Rechner, A. R. , Smith, M. A. , Kuhnle, G. , Gibson, G. R. , Debnam, E. S. , Srai, S. K. , Moore, K. P. , & Rice‐Evans, C. A. (2004). Colonic metabolism of dietary polyphenols: Influence of structure on microbial fermentation products. Free Radical Biology and Medicine, 36(2), 212–225. [DOI] [PubMed] [Google Scholar]
- Ruh, M. F. , Zacharewski, T. , Connor, K. , Howell, J. , Chen, I. , & Safe, S. (1995). Naringenin: A weakly estrogenic bioflavonoid that exhibits antiestrogenic activity. Biochemical Pharmacology, 50, 1485–1493. [DOI] [PubMed] [Google Scholar]
- Saarinen, N. , Joshi, S. C. , Ahotupa, M. , Li, X. , Ammala, J. , Makela, S. , & Santti, R. (2001). No evidence for the in vivo activity of aromatase‐inhibiting flavonoids. The Journal of Steroid Biochemistry and Molecular Biology, 78, 231–239. [DOI] [PubMed] [Google Scholar]
- Schneider, H. , & Blaut, M. (2000). Anaerobic degradation of flavonoids by Eubacterium ramulus . Archives of Microbiology, 173, 71–75. [DOI] [PubMed] [Google Scholar]
- Schoefer, L. , Mohan, R. , Schwiertz, A. , Braune, A. , & Blaut, M. (2003). Anaerobic degradation of flavonoids by clostridium orbiscindens . Applied and Environmental Microbiology, 69(10), 5849–5854. [DOI] [PMC free article] [PubMed] [Google Scholar]
- Selvam, M. , & Kaliyaperumal, M. (2015). Determination of LD50 of Naringenin for its effects on diabetic nephropathy in rats‐ a pilot study. Journal of Chemical and Pharmaceutical Research, 7(6), 559–553. [Google Scholar]
- Shinkaruk, S. , Lamothe, V. , Schmitter, J. M. , Manach, C. , Morand, C. , Berard, A. , Bennetau, B. , & Bennetau‐Pelissero, C. (2010). Development and validation of two new sensitive ELISAs for Hesperetin and Naringenin in biological fluids. Food Chemistry, 118(2), 472–481. [Google Scholar]
- Shirasaka, Y. , Shichiri, M. , Mori, T. , Nakanishi, T. , & Tamai, I. (2013). Major active components in grapefruit, orange, and apple juices responsible for OATP2B1‐mediated drug interactions. Journal of Pharmaceutical Sciences, 102, 280–288. [DOI] [PubMed] [Google Scholar]
- Sugimura, T. , Nagao, M. , Matsushima, T. , Yahagi, T. , Seino, Y. , Shirai, A. , Sawamura, M. , Natori, S. , Yoshihira, K. , Fukuoka, M. , & Kuroyanagi, M. (1977). Mutagenicity of flavone derivatives. Proceedings of the Japan Academy. Series B, Physical and Biological Sciences, 53B, 194–197. [Google Scholar]
- Surya Sandeep, M. , Sridhar, V. , Puneeth, Y. , Ravindra Babu, P. , & Naveen Babu, K. (2014). Enhanced oral bioavailability of felodipine by naringenin in Wistar rats and inhibition of P‐glycoprotein in everted rat gut sacs in vitro. Drug Development and Industrial Pharmacy, 40(10), 1371–1377. [DOI] [PubMed] [Google Scholar]
- Swarnkar, G. , Sharan, K. , Siddiqui, J. A. , Mishra, J. S. , Khan, K. , Khan, M. P. , Gupta, V. , Rawat, P. , Maurya, R. , Dwivedi, A. K. , Sanyal, S. , & Chattopadhyay, N. (2012). A naturally occurring naringenin derivative exerts potent bone anabolic effects by mimicking oestrogen action on osteoblasts. British Journal of Pharmacology, 165(5), 1526–1542. [DOI] [PMC free article] [PubMed] [Google Scholar]
- Takeuchi, S. , Takahashi, T. , Sawada, Y. , Iida, M. , Matsuda, T. , & Kojima, H. (2009). Comparative study on the nuclear hormone receptor activity of various phytochemicals and their metabolites by reporter gene assays using Chinese hamster ovary cells. Biological and Pharmaceutical Bulletin, 32(2), 195–202. [DOI] [PubMed] [Google Scholar]
- Totta, P. , Acconcia, F. , Leone, S. , Cardillo, I. , & Marino, M. (2004). Mechanisms of naringenin‐induced apoptotic cascade in cancer cells: Involvement of estrogen receptor α and β signalling. IUBMB Life, 56(8), 491–499. [DOI] [PubMed] [Google Scholar]
- Ubeaud, G. , Hagenbach, J. , Vandenschrieck, S. , Jung, L. , & Koffel, J. C. (1999). In vitro inhibition of simvastatin metabolism in rat and human liver by naringenin. Life Sciences, 65(13), 1403–1412. [DOI] [PubMed] [Google Scholar]
- Wan, L. , Sun, X. , Wang, X. , Li, Y. , Yu, Q. , & Guo, C. (2011). A stereospecific HPLC method and its application in determination of pharmacokinetics profile of two enantiomers of naringenin in rats. Journal of Chromatographic Science, 49, 316–320. [DOI] [PubMed] [Google Scholar]
- Wang, M. , Chao, P. L. , Hou, Y. , Hsiu, S. , Wen, K. , & Tsai, S. (2006). Pharmacokinetics and conjugation metabolism of Naringin and Naringenin in rats after single dose and multiple dose administrations. Journal of Food and Drug Analysis, 14(3), 247–253. [Google Scholar]
- Whitwell, J. , Smith, R. , Chirom, T. , Watters, G. , Hargreaves, V. , Lloyd, M. , Phillips, S. , & Clements, J. (2019). Inclusion of an extended treatment with recovery improves the results for the human peripheral blood lymphocyte micronucleus assay. Mutagenesis, 34, 217–237. [DOI] [PubMed] [Google Scholar]
- Yáñez, J. A. , Remsberg, C. M. , Miranda, N. D. , Vega‐Villa, K. R. , Andrews, P. K. , & Davies, N. M. (2008). Pharmacokinetics of selected chiral flavonoids: Hesperetin, naringenin and eriodictyol in rats and their content in fruit juices. Free Radical Research, 29, 63–82. [DOI] [PubMed] [Google Scholar]
- Yeo, E. , Yew Chieng, C. J. , Choudhury, H. , Pandey, M. , & Gorain, B. (2021). Tocotrienols‐rich naringenin nanoemulgel for the management of diabetic wound: Fabrication, characterization and comparative in vitro evaluations. Current Research in Pharmacolology and Drug Discovery, 2, 100019. [DOI] [PMC free article] [PubMed] [Google Scholar]
- Zeng, X. , Bai, Y. , Peng, W. , & Su, W. (2016). Identification of Naringin metabolites in human urine and feces. European Journal of Drug Metabolism and Pharmacokinetics, 42, 647–656. [DOI] [PubMed] [Google Scholar]
- Zhang, P. , Lin, R. , Yang, G. , Zhang, J. , Zhou, L. , & Liu, T. (2013). Solubility of Naringenin in ethanol and water mixtures. Journal of Chemical and Engineering Data, 58, 2402–2404. [Google Scholar]
- Zierau, O. , Blei, T. , Kretzschmar, G. , Moeller, F. J. , & Vollmer, G. (2012). In vivo anti‐androgenic activity of naringenin type phytoestrogens. Endocrine Reviews, 33(3, Suppl) [abstract SAT‐565]. [Google Scholar]
- Zou, W. , Luo, Y. , Liu, M. , Chen, S. , Wang, S. , Nie, Y. , Cheng, G. , Su, W. , & Zhang, K. (2015). Human intestinal microbial metabolism of naringin. European Journal of Drug Metabolism and Pharmacokinetics, 40(3), 363–367. [DOI] [PubMed] [Google Scholar]