Abstract
PURPOSE
We aim to examine the long-term outcomes of patients who underwent multiparametric prostate magnetic resonance imaging (mp-MRI) for suspected prostate cancer (PCa), specifically based on their initial Prostate Imaging Reporting and Data System (PI-RADS) categories and various clinical factors. Our secondary aim is to evaluate the prognostic value of the PI-RADS through the National Comprehensive Cancer Network (NCCN) risk group distribution.
METHODS
This research was conducted as a single-center retrospective cohort study in a tertiary care hospital. A total of 1,359 cases having at least one histopathological examination after the initial mp-MRI and/or adequate clinical/radiological follow-up data were included in the clinically significant PCa (cs-PCa) diagnosis-free survival analysis. Initial mp-MRI dates were accepted as the start of follow-up for the time-to-event analysis. The event was defined as cs-PCa diagnosis (International Society of Urological Pathology ≥2). Patients who were not diagnosed with cs-PCa during follow-up were censored according to predefined literature-based criteria at the end of the maximum follow-up duration with no reasonable suspicion of PCa and no biopsy indication. The impact of various factors on survival was assessed using a log-rank test and multivariable Cox regression. Subsequently, 394 cases diagnosed with PCa during follow-up were evaluated, based on initial PI-RADS categories and NCCN risk groups.
RESULTS
Three main risk factors for cs-PCa diagnosis during follow-up were an initial PI-RADS 5 category, initial PI-RADS 4 category, and high MRI-defined PSA density (mPSAD), with average hazard ratios of 29.52, 14.46, and 3.12, respectively. The PI-RADS 3 category, advanced age group, and biopsy-naïve status were identified as additional risk factors (hazard ratios: 2.03, 1.54–1.98, and 1.79, respectively). In the PI-RADS 1–2 cohort, 1, 3, and 5-year cs-PCa diagnosis-free survival rates were 99.1%, 96.5%, and 93.8%, respectively. For the PI-RADS 3 cohort, 1, 3, and 5-year cs-PCa diagnosis-free survival rates were 94.9%, 90.9%, and 89.1%, respectively. For the PI-RADS 4 cohort, 1, 3, and 5-year cs-PCa diagnosis-free survival rates were 56.6%, 55.1%, and 55.1%, respectively. These rates were found to all be 24.2% in the PI-RADS 5 cohort. Considering the 394 cases diagnosed with PCa during follow-up, PI-RADS ≥4 cases were more likely to harbor unfavorable PCa compared to PI-RADS ≤3 cases (P < 0.001). In the PI-RADS 3 subgroup analysis, a low mPSAD (<0.15 ng/mL2) was found to be a protective prognostic factor against unfavorable PCa (P = 0.005).
CONCLUSION
The PI-RADS category has a significant impact on patient management and provides important diagnostic and prognostic information. Higher initial PI-RADS categories are associated with decreased follow-up losses, a shorter time to PCa diagnosis, increased biopsy rates, a higher likelihood of developing cs-PCa during follow-up, and a worse PCa prognosis. Combining mPSAD with PI-RADS categories could enhance diagnostic stratification in the identification of cs-PCa.
Keywords: Prostatic neoplasm, follow-up studies, multiparametric magnetic resonance imaging, prognosis, diagnosis, biopsy
Main points
• Beyond its role in standardizing multiparametric prostate magnetic resonance imaging (mp-MRI) reporting, the Prostate Imaging Reporting and Data System (PI-RADS) category has a significant impact on patient management and provides important diagnostic and prognostic insights.
• Combining MRI-defined prostate-specific antigen density (mPSAD) with the PI-RADS can potentially enhance diagnostic stratification for identifying clinically significant prostate cancer (cs-PCa).
• Conservative management seems reasonable for PI-RADS 1–2 cases because of high long-term cs-PCa diagnosis-free survival probabilities.
• For PI-RADS 3 cases, a low initial mPSAD (<0.15 ng/mL2) or a history of prior negative biopsy may favor the adoption of conservative management based on reassuring follow-up results.
• Histopathological examination appears to be the most reliable approach for PI-RADS ≥4 cases, even when considering all variable-based subgroups.
Prostate cancer (PCa) is one of the most common cancers among men worldwide. It encompasses a broad and heterogeneous spectrum of diseases, ranging from low-grade clinically insignificant tumors to metastatic disease with high morbidity and mortality. The clinical heterogeneity and significant differences in prognosis have led to the search for risk stratification in PCa management. Classification systems incorporating biochemical, clinical, and histopathological data, such as the National Comprehensive Cancer Network (NCCN) guidelines and the D’Amico risk scale, are frequently used in urology practice and effectively employed in patient management.1,2
As another effective tool, multiparametric prostate magnetic resonance imaging (mp-MRI) is widely used for the early detection, staging, and monitoring of prostate tumors. Efforts to integrate mp-MRI with diagnostic algorithms have gained momentum following the implementation of the Prostate Imaging Reporting and Data System (PI-RADS) categories. This standardized reporting system has facilitated the assessment of mp-MRI findings and enabled objective stratification for suspected clinically significant PCa (cs-PCa).3 The increasing body of literature elucidated the potential diagnostic value of mp-MRI, and, eventually, the European Association of Urology guideline recommended conducting an mp-MRI before the initial biopsy.4
Our study aims to evaluate the long-term follow-up outcomes of patients who underwent mp-MRI for suspected PCa, explicitly focusing on initial PI-RADS assessment categories. We will determine cs-PCa diagnosis-free survival probabilities across different PI-RADS cohorts, calculate the hazard ratios of key clinical parameters influencing the outcome, assess the prognostic value of the PI-RADS by examining NCCN risk group distribution, and discuss possible management strategies for different patient subgroups in light of our results and current literature.
Methods
This study was approved by the Hacettepe University Non-Invasive Clinical Research Ethics Committee (decision number: 2022/01-30, date: 10.05.2022), with a waiver of informed consent.
The workflow of the study is summarized in Figure 1.
Figure 1.
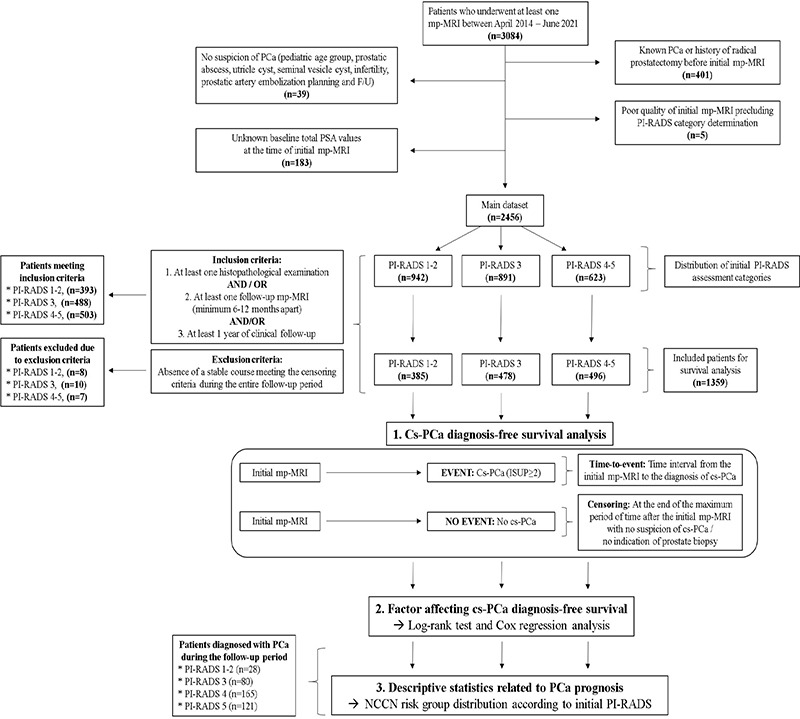
Workflow of the study. PCa, prostate cancer; PSA, prostate-specific antigen; mp-MRI, multiparametric prostate magnetic resonance imaging; PI-RADS, Prostate Imaging Reporting and Data System; cs-PCa, clinically significant prostate cancer; NCCN, National Comprehensive Cancer Network.
Data collection
Patients who underwent mp-MRI in our institution between April 2014 and June 2021 were identified using the hospital’s information system. Relevant clinical, radiological, and histopathological data were extracted for these patients throughout their follow-up period (until June 2022).
Definitions and basic considerations
Baseline prostate-specific antigen (PSA): PSA values at the time of initial mp-MRI were considered as the baseline PSA.
Prostate volume: Prostate volume was calculated using the ellipsoid formula (length × width × height × π/6) on the initial mp-MRI.5
MRI-defined PSA density (mPSAD): mPSAD was calculated by dividing the baseline PSA by the prostate volume. A cut-off value of 0.15 ng/mL2 was used for mPSAD.4
PSA velocity (PSAV): PSAV was calculated using the first-to-last method in patients with at least three PSA values covering at least one year of follow-up interval.6
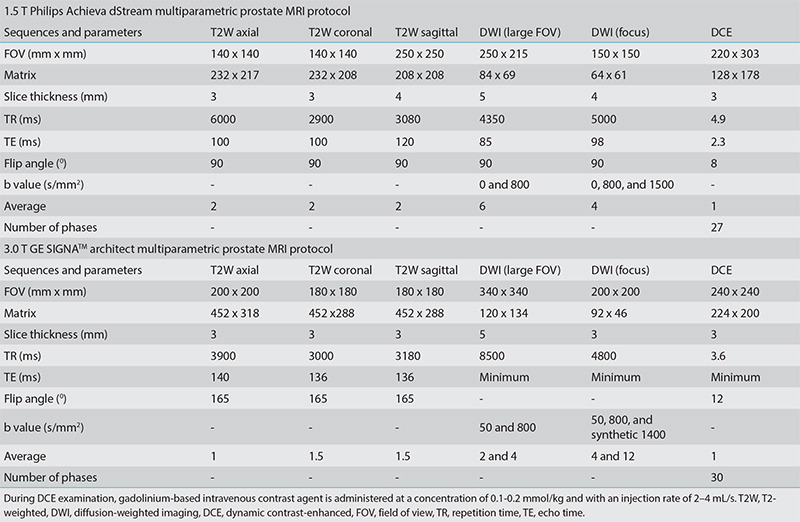
mp-MRI evaluation: The PI-RADS categories of cases were extracted directly from the mp-MRI reports in the hospital’s information system and were used without making any retrospective category changes, even in the presence of radiopathology discrepancies. This methodology aimed to maintain the cause-and-effect relationship between the already reported PI-RADS categories and the subsequent diagnostic management, ensure that category assigners remained blinded and unbiased, and obtain results that reflected everyday practice rather than ideal conditions. In accordance with our center’s routine radiology practices, each mp-MRI was categorized into one of four PI-RADS assessment groups (PI-RADS 1–2, 3, 4, and 5 categories). These assignments were carried out by one of four readers, each with at least 10 years of experience in abdominal radiology and following the guidelines of PI-RADSv2 and PI-RADSv2.1. All mp-MRI examinations were performed on five MRI (two 3.0 Tesla and three 1.5 Tesla) scanners, using imaging protocols in line with PI-RADS recommendations. The imaging protocols of the two most commonly used devices are provided as Supplementary Table 1.
Supplementary Table 1. Multiparametric prostate MRI protocols of the two most commonly used devices at our center.
Histopathological examination types: In our institution, PI-RADS 1–2 cases requiring biopsy undergo transrectal ultrasound (TRUS)-guided systematic biopsy in the urology department and rarely in the interventional radiology unit. On the other hand, PI-RADS ≥3 cases typically undergo MRI-TRUS fusion biopsy combined with systematic biopsy, performed by interventional radiologists.
Histopathological examination results: All available core biopsy results and, if present, radical prostatectomy results of the patients were extracted from the hospital’s information system. Normal prostate tissue, inflammation, atypical small acinar proliferation, and prostatic intraepithelial neoplasia were considered non-neoplastic. In cases diagnosed with PCa, biopsy results were recorded according to the International Society of Urological Pathology (ISUP) grade group system. The highest ISUP grade in the sample was accepted as the final result; ISUP = 1 PCa cases were classified as clinically insignificant PCa, and ISUP ≥2 cases were considered cs-PCa.
NCCN risk groups: The risk stratification of patients was completed by urologists using the clinical and histopathological results according to the NCCN guidelines. Patients included in the very low, low, and intermediate-favorable risk groups, which had the option of undergoing active surveillance, were accepted as “favorable PCa”. The intermediate-unfavorable, high, and very high-risk groups were categorized as “unfavorable PCa”.1
Case selection: The main dataset was created by excluding patients with no suspicion of PCa, a previous diagnosis of PCa, a history of radical prostatectomy, an unknown baseline total PSA value, and low-quality initial mp-MRI precluding PI-RADS category assessment. Subsequently, patients with at least one histopathological examination and/or at least one follow-up mp-MRI performed a minimum of 6–12 months apart, and/or clinical follow-up records spanning at least 1 year in the urology clinic, were included in the cs-PCa diagnosis-free survival analysis. A small number of indeterminate cases (n = 25) that did not show any stable course and had an unknown outcome were excluded from the survival analysis (Figure 1).
Follow-up considerations
Start of follow-up: Defined as the date of the first mp-MRI.
Event: Cs-PCa (ISUP ≥2) diagnosis based on histopathological examination.
PI-RADS cohort: A group of patients who shared the same initial PI-RADS category and were eligible for cs-PCa diagnosis-free survival analysis.
Censored observations: Patients not diagnosed with cs-PCa during the follow-up were censored based on our pre-established censoring criteria. This censoring was performed at the end of the maximum follow-up period without suspicion of malignancy and without the need for biopsy. Censoring points were decided according to the histopathological examination results, radiological follow-up findings, and clinical stability during follow-up (in order of decreasing significance) to determine cs-PCa diagnosis-free survival times.
Censoring based on histopathological examination: Non-neoplastic or ISUP = 1 PCa results.
Censoring based on follow-up mp-MRI: PI-RADS 1–2, stable or regressing PI-RADS 3, a PI-RADS downgrade from PI-RADS 4–5 to PI-RADS 3, and a PI-RADS upgrade from PI-RADS 1–2 to PI-RADS 3 with at least 1-year subsequent clinical stability and/or subsequent radiological stability.
Censoring based on clinical follow-up
Cases meeting the following three criteria were censored based on clinical follow-up:
ii) Final total PSA value not exceeding 20 ng/mL,
iii) Total PSA value within age-based normal range or PSAV below 0.75 ng/mL/year,7,8
iii) No suspicious digital rectal examination (DRE) findings
Our schematic algorithm and illustrative case examples explaining follow-up evaluation in detail are given as Supplementary Figure 1 and 2, respectively.
Supplementary Figure 1.
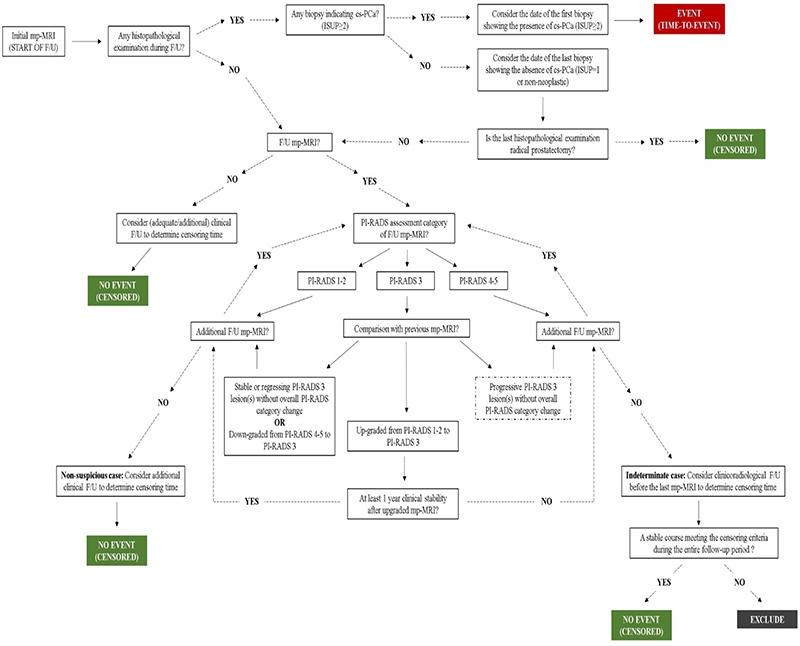
Schematic algorithm for follow-up evaluation. ISUP, International Society of Urological Pathology; cs-PCa, clinically significant prostate cancer; mp-MRI, multiparametric prostate magnetic resonance imaging; PI-RADS, Prostate Imaging Reporting and Data System.
Supplementary Figure 2.
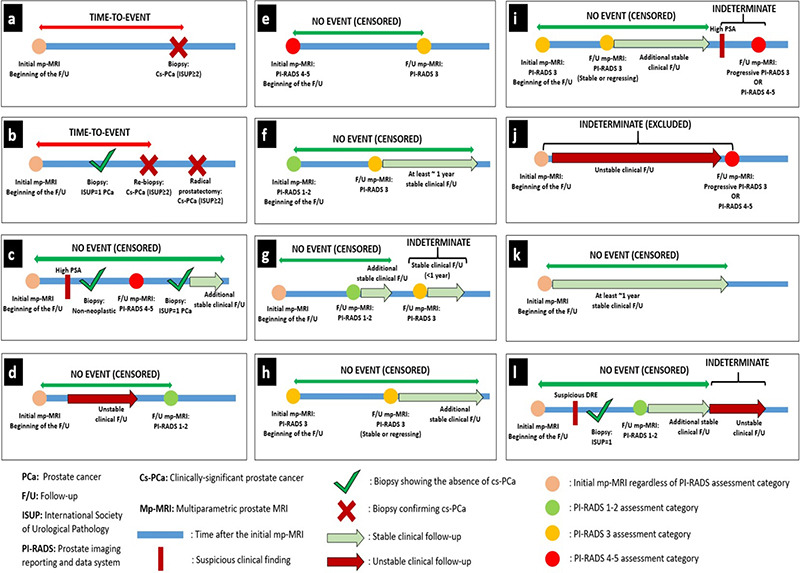
Illustrative case examples explaining follow-up evaluation. (a, b) The time-to-event was calculated considering the first detection time of cs-PCa (ISUP ≥2). (c) Cases without cs-PCa diagnosis during follow-up were considered cs-PCa-diagnosis-free at the points where histopathological examination results indicated non-neoplastic pathology or ISUP = 1 PCa, regardless of interim clinical or radiological follow-up findings. After biopsy, the final censoring time was determined based on additional clinical and/or radiological stability, if available. In the absence of any histopathological examination during an evaluated follow-up interval or in the subsequent follow-up period after a histopathological examination confirming the absence of cs-PCa, radiological stability was examined first and then clinical stability was considered to determine the final censoring time. (d) Cases with follow-up PI-RADS category 1–2 were considered cs-PCa diagnosis-free at the time of the follow-up mp-MRI, independent of previous clinical follow-up findings. After mp-MRI, the final censoring time was determined based on additional clinical and radiological follow-up, if available.
(e-i) The approach to cases with follow-up PI-RADS category 3 was determined based on the previous PI-RADS. (e) Cases with a PI-RADS downgrade from PI-RADS 4–5 to PI-RADS 3 were considered cs-PCa diagnosis-free at the time of follow-up mp-MRI. The final censoring time was determined based on additional clinical and radiological follow-up, if available. (f) Cases with a PI-RADS upgrade from PI-RADS 1–2 to PI-RADS 3 were evaluated for the presence of at least 1-year stable subsequent clinical follow-up or further radiological stability to be considered as cs-PCa diagnosis-free. (g) PI-RADS 3 cases that did not meet these criteria were considered indeterminate at the end of follow-up. Censoring was done based on the stable clinical and/or radiological follow-up interval between the first mp- MRI and the indeterminate follow-up interval. Cases without such a stable follow-up interval were excluded from survival analysis. (h) PI-RADS 3 cases that did not show any PI-RADS change and radiological progression in the follow-up mp-MRI were considered as cs-PCa-diagnosis-free at the time of follow-up mp-MRI. The final censoring time was determined based on additional clinical and radiological follow-up, if available. (i) Cases with progressive PI-RADS 3 lesion(s) or follow-up PI-RADS category of 4–5 were considered indeterminate regardless of interim clinical follow-up, unless a subsequent histopathological examination was performed. Censoring was done based on the stable clinical and/or radiological follow-up interval between the first mp-MRI and the indeterminate follow-up interval. (j) Cases without such a follow-up interval were excluded from survival analysis. (k) In the absence of histopathological or radiological examination during the evaluated follow-up interval or in the subsequent follow-up period after these examinations, clinical stability was evaluated to determine the final censoring time. Cases showing at least 1 year of clinical stability, regardless of baseline PI-RADS category, were censored as cs-PCa diagnosis-free. (l) Cases where the criteria for clinical stability were not met during a certain time interval were considered indeterminate. Censoring was done based on the stable clinical interval between the first mp- MRI and the indeterminate follow-up interval. cs-PCa, clinically significant prostate cancer; ISUP, International Society of Urological Pathology; PCa, prostate cancer; PI-RADS, Prostate Imaging Reporting and Data System; mp-MRI, multiparametric prostate magnetic resonance imaging
Statistical analysis
The SPSS Statistics (v.11.5) software (Chicago, SPSS Inc.) was used for conducting data analysis. Descriptive statistics were presented in the form of mean ± standard deviation or standard error, median (minimum–maximum) for quantitative variables, and number of patients (percentage) for qualitative variables. A chi-square test was used to examine the association between two categorical variables. An independent samples t-test and one-way analysis of variance were utilized to compare the means of independent groups. A Kaplan–Meier test was used for survival analysis. The impact of various factors on survival was assessed using a log-rank test and multivariable Cox regression analysis. The P value threshold for statistical significance was accepted as 0.05.
Results
Basic descriptive statistics of the main dataset by initial PI-RADS categories and the distribution percentages of follow-up status for each PI-RADS subgroup are given in Figure 2. Table 1 presents the descriptive statistics of each PI-RADS cohort eligible for cs-PCa diagnosis-free survival analysis. No statistically significant differences were observed when each PI-RADS subgroup in the main dataset was compared with the corresponding PI-RADS cohort in terms of primary clinical variables (P > 0.19). On the other hand, significant differences were identified among PI-RADS 1–2, 3, and 4–5 cohorts regarding baseline PSA and initial mPSAD values, both of which were positively correlated with the PI-RADS categories (P values 0.002 and 0.01, respectively). The PI-RADS 1–2 and 3 cohorts were comparable in terms of age and prior biopsy status (P values 0.72 and 0.48, respectively). However, the PI-RADS 4–5 cohort demonstrated significantly higher age and biopsy-naïve status percentages than the PI-RADS ≤3 cohort (P values <0.001 and 0.02, respectively).
Figure 2.
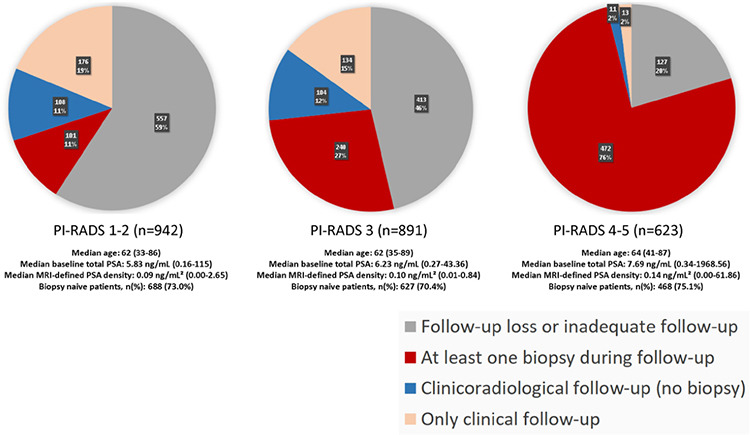
In the main dataset, the rates of follow-up loss for Prostate Imaging Reporting and Data System (PI-RADS) 1–2, PI-RADS 3, and PI-RADS 4–5 subgroups are 59%, 46%, and 20%, respectively. Meanwhile, the rates of undergoing at least one biopsy during follow-up are 11%, 27%, and 76% for these categories, in the order given. Consequently, as the initial PI-RADS category increases, follow-up losses decrease, and the probability of undergoing biopsy during follow-up increases. Each distinct PI-RADS subgroup within the main dataset exhibits similar characteristics concerning age, baseline prostate-specific antigen (PSA) levels, magnetic resonance imaging-defined PSA density, and prior biopsy status, with corresponding PI-RADS cohorts included in the survival analysis.
Table 1. Descriptive statistics of the cases included in the survival analysis.
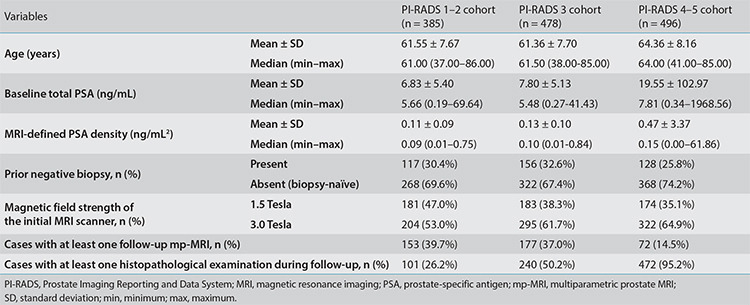
Of the 1,359 cases included in the survival analysis, 252 (18.5%) were diagnosed with cs-PCa at the end of follow-up. The follow-up durations of the remaining event-free 1,107 cases, stratified by the initial PI-RADS categories of 1–2, 3, and 4–5, were as follows (format, mean ± standard error): 28.21 ± 1.01, 24.78 ± 0.95, and 16.03 ± 1.25 months, respectively. Notably, among these censored cases, a negative correlation between the initial PI-RADS category and event-free follow-up duration was identified (P < 0.001).
The multivariable Cox regression analysis revealed that the initial PI-RADS category, mPSAD, age (cut-off, 60 years), and prior biopsy status significantly affected cs-PCa diagnosis-free survival (Table 2). Figure 3a shows the survival curves of each PI-RADS cohort, demonstrating statistically significant differences among all groups (P < 0.001). The cs-PCa diagnosis-free survival durations of PI-RADS 1–2, 3, 4, and 5 cohorts were as follows (format, mean ± standard error): 81.57 ± 1.38, 74.30 ± 1.21, 47.02 ± 2.72, and 21.17 ± 3.41 months, respectively (Table 3).
Table 2. Cox regression of the risk factors for cs-PCa diagnosis in all follow-up cases.
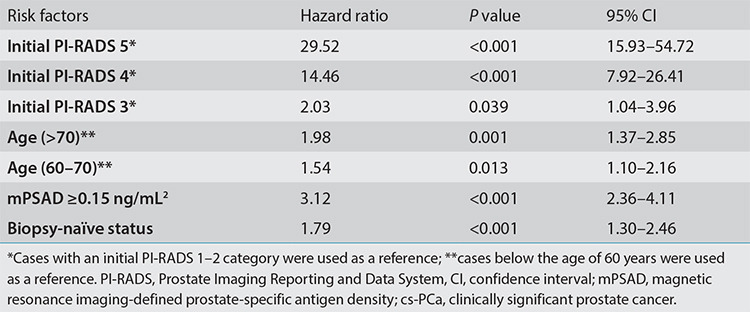
Figure 3.
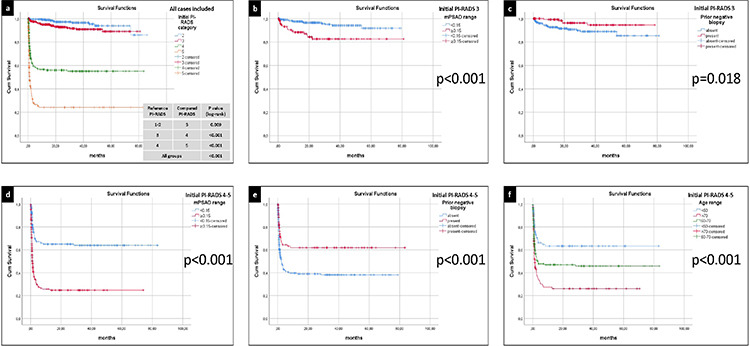
(a) The clinically significant prostate cancer (cs-PCa) diagnosis-free survival curves of all cases included in the survival analysis, stratified by the initial Prostate Imaging Reporting and Data System (PI-RADS) category. Among all PI-RADS cohorts, a statistically significant inverse correlation was identified between the initial PI-RADS category and cs-PCa diagnosis-free survival (P < 0.001). (b) The cs-PCa diagnosis-free survival curves of the PI-RADS 3 cohort, stratified by initial magnetic resonance imaging-defined prostate-specific antigen density (mPSAD) range. A higher probability of survival was observed in the low mPSAD (<0.15 ng/mL2) subgroup (P < 0.001). (c) The cs-PCa diagnosis-free survival curves of the PI-RADS 3 cohort, stratified by prior biopsy status. Biopsy-naïve cases exhibited a lower probability of cs-PCa diagnosis-free survival (P = 0.018). (d) The cs-PCa diagnosis-free survival curves of the PI-RADS 4–5 cohort, stratified by initial mPSAD range. The subgroup with a high mPSAD (≥0.15 ng/mL2) demonstrated a lower probability of cs-PCa diagnosis-free survival (P < 0.001). (e) The cs-PCa diagnosis-free survival curves of the PI-RADS 4–5 cohort, stratified by prior biopsy status. Cases with a history of prior negative biopsy displayed a higher probability of survival without a cs-PCa diagnosis (P < 0.001). (f) The cs-PCa diagnosis-free survival curves of the PI-RADS 4–5 cohort, stratified by age group. A negative correlation was observed between the age range and the probability of a cs-PCa diagnosis-free survival (P < 0.001).
Table 3. The cs-PCa diagnosis-free survival results of PI-RADS cohorts and variable-based subgroups.
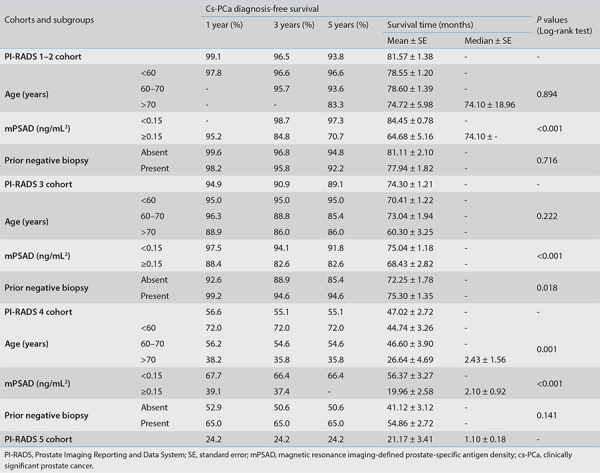
In the survival analyses, 1, 3, and 5-year cs-PCa diagnosis-free survival rates for the PI-RADS 1–2 cohort were 99.1%, 96.5%, and 93.8%, respectively. Only the initial mPSAD was found to affect cs-PCa diagnosis-free survival in the PI-RADS 1–2 cohort (Table 3).
For the PI-RADS 3 cohort, 1, 3, and 5-year cs-PCa diagnosis-free survival rates were 94.9%, 90.9%, and 89.1%, respectively (Table 3). Initial mPSAD and prior biopsy status were the two factors affecting cs-PCa diagnosis-free survival in the PI-RADS 3 cohort (Figure 3b, c). According to Cox multivariable regression analysis, a high mPSAD and biopsy-naïve status were significantly associated with the development of cs-PCa during the follow-up of the PI-RADS 3 cohort [hazard ratio (95% confidence interval): 3.97 (1.92–8.20) and 3.61 (1.35–9.70), respectively].
For the PI-RADS 4 cohort, the 1, 3, and 5-year cs-PCa diagnosis-free survival rates were 56.6%, 55.1%, and 55.1%, respectively. These rates were found to all be 24.2% in the PI-RADS 5 cohort (Table 3). Factor-based evaluation in the combined PI-RADS 4–5 cohort revealed that initial mPSAD, prior biopsy status, and the age group affected cs-PCa diagnosis-free survival (Figure 3d-f).
Considering the 394 cases diagnosed with PCa during follow-up, distributions of ISUP grade groups and NCCN risk groups according to the initial PI-RADS categories are provided in Table 4. Figure 4 demonstrates the percentages of favorable and unfavorable PCa cases and subgroup analysis results for PI-RADS 3 cases. In PI-RADS 1–2, 3, 4, and 5 cases that were eventually diagnosed with PCa, the initial mp-MRI-to-PCa diagnosis time intervals were observed as median (minimum–maximum) values of 300 (7–2,398) days, 75 (3–1,616) days, 28 (6–1,360) days, and 23 (1–233) days, respectively. Correspondingly, in mean ± standard error format, these intervals were 545.8 ± 121.4, 236.3 ± 38.0, 67.4 ± 12.6, and 32.7 ± 3.2 days, in the given order. Thus, a negative correlation between the PI-RADS category and the time to PCa diagnosis was evident.
Table 4. Histopathological examination results and the prognostic risk groups of cases diagnosed with PCa during follow-up.

Figure 4.
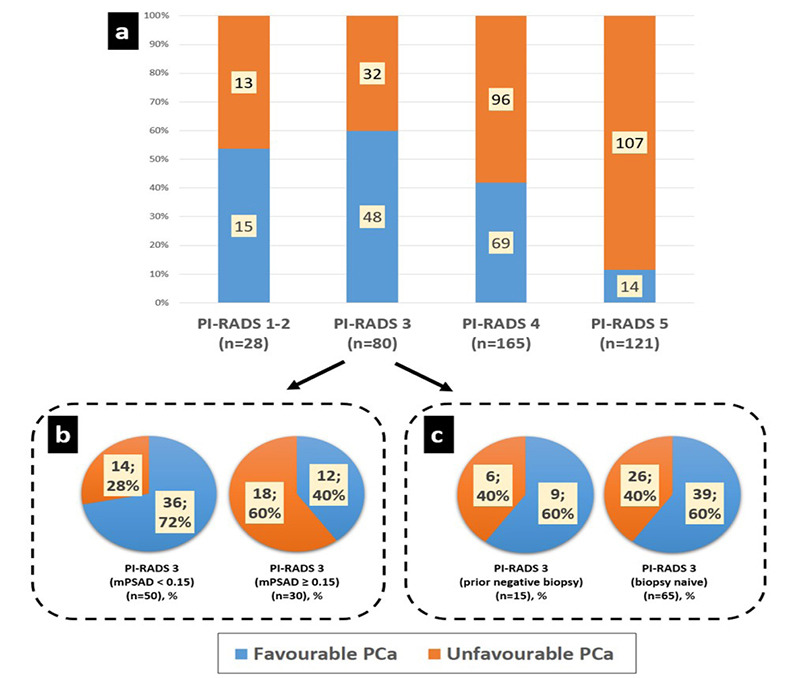
(a) Unfavorable prostate cancer (PCa) percentages in Prostate Imaging Reporting and Data System (PI-RADS) 1–2, 3, 4, and 5 groups were 46%, 40%, 58%, and 88%, respectively. The PI-RADS 1–2 and 3 groups exhibited similar prognostic distribution regarding unfavorable PCa (P = 0.55). However, comparing PI-RADS ≤3, 4, and 5 subgroups revealed statistically significant differences concerning unfavorable PCa rates, which were positively correlated with the initial PI-RADS category (P < 0.001). (b, c) In subgroup analyses, the PI-RADS 3 group was evaluated in terms of magnetic resonance imaging-defined prostate-specific antigen density (mPSAD) range (b) and prior biopsy status (c) for prognostic assessment. The rate of unfavorable PCa was 28% in the low mPSAD (<0.15 ng/mL2) subgroup and increased to 60% in the high mPSAD (≥0.15 ng/mL2) subgroup (P = 0.005). Conversely, prior biopsy status had no statistically significant impact on prognostic distribution (P = 1).
Very low-risk, low-risk, and intermediate risk-favorable PCa cases according to National Comprehensive Cancer Network (NCCN) classification were accepted as favorable PCa. Intermediate risk-unfavorable, high-risk, and very high-risk PCa cases according to NCCN classification were accepted as unfavorable PCa.
Discussion
Our findings showed that the PI-RADS offered important insights for prognostic evaluation and patient management. As the initial PI-RADS category increased, follow-up losses and time to PCa diagnosis decreased, the probabilities of undergoing biopsy and developing cs-PCa during follow-up increased, and the PCa prognosis worsened. Following the initial PI-RADS category, mPSAD was the second significant variable and was strongly associated with long-term follow-up results. The combination of the PI-RADS and mPSAD could, accordingly, improve diagnostic stratification regarding cs-PCa. According to the cs-PCa diagnosis-free survival analysis, conservative management appeared reasonable for cases with initial PI-RADS 1–2 categories, based on reassuring follow-up results. Similarly, a conservative approach may be advisable in PI-RADS 3 cases, particularly if the initial mPSAD was low (<0.15 ng/mL2) or if there was a history of prior negative biopsy, both of which provided reassuring follow-up outcomes. Histopathological examination still appeared to be the most reliable approach for cases graded as PI-RADS ≥4, a finding that held even when examining different subgroups of PI-RADS ≥4 cases based on variable clinical factors.
In terms of methodology, we evaluated cases with sufficient follow-up data according to a follow-up scheme that utilized clinico-radiological follow-up findings and histopathological examination results. The clinical and radiological criteria in this scheme were determined through a multidisciplinary approach, considering literature-based evidence and our institutional experience. In event-free cases, the maximum duration without reasonable PCa suspicion or biopsy indication was accepted as the end of follow-up to avoid overestimating cs-PCa diagnosis-free survival.
There are several existing mp-MRI-based follow-up studies. In a study conducted by Venderink et al.9, cases classified as PI-RADS 1–2 on the follow-up mp-MRI were censored as cs-PCa diagnosis-free at the time of mp-MRI. In a prospective follow-up study conducted by Hauth et al.10 on PI-RADS 3 and 4 cases, a PI-RADS downgrade (from PI-RADS 3 to 2, and PI-RADS 4 to 3), as well as stable PI-RADS 3 category during follow-up, were considered negative indicators for malignancy. We based our methodology on these two studies to establish the censoring points for radiological follow-up in our study. Additionally, in Hauth et al.’s10 study, cases with a PI-RADS upgrade (from 3 to 4 and 4 to 5), as well as stable PI-RADS 4 cases during follow-up, were reported to harbor at least a 50% possibility of cs-PCa, emphasizing the necessity for performing a biopsy. Therefore, we decided to consider these cases “indeterminate” unless a biopsy was performed during subsequent follow-up. Conversely, we accepted cases showing a PI-RADS upgrade from PI-RADS 1–2 to 3 as cs-PCa diagnosis-free if follow-up radiological stability was present or at least 1 year of subsequent clinical stability was observed. We based this approach on a prospective study by van der Sar et al.11, which compared “immediate biopsy” and “close surveillance” approaches for radiologically indeterminate cases, and a literature review by Rivas et al.12 on the conservative management of indeterminate lesions.
The integration of clinical follow-up with radiological and histopathological findings is one of the important methodological differences in our study. Unlike the studies mentioned above, determining cs-PCa diagnosis-free survival based solely on mp-MRI or biopsy results does not fully reflect clinical practice, as only some patients undergo mp-MRI or biopsy (unless indicated). A significant portion of patients is only clinically monitored with PSA follow-up and DRE, if necessary. Therefore, it can be assumed that patients are cs-PCa diagnosis-free as long as there is clinical stability, no significant increase in follow-up PSA values, no suspicious DRE findings, and no indication for performing a biopsy or mp-MRI. The necessity of this approach was also emphasized in Venderink et al.’s9 study on cs-PCa diagnosis-free survival of PI-RADS 1–2 cases, suggesting that future studies should focus on longer follow-up periods using a systematic design that includes PSA monitoring and follow-up mp-MRI. However, this integration of clinical follow-up also includes some inevitable uncertainties. The variability of PSA values during follow-up, the subjectivity of DRE, and the lack of standardization for PSA monitoring make this integration methodologically challenging. Nevertheless, different opinions have been reported in the literature about at what point the suspicion of malignancy arises and which PSA kinetics should be used in PSA follow-up, reflecting differences in practice between clinical centers. When establishing the criteria for clinical follow-up stability in our study, we considered the urology literature on PSAV, active surveillance recommendations, and our own clinical experience.
In the 1990s, Carter et al.8 proposed a PSAV cut-off value of 0.75 ng/mL/year to distinguish cases with and without PCa. It was stated that at least three consecutive PSA values covering a long-term follow-up period were necessary for accurate measurement.8 Conversely, Venderink et al.9 reported that cases with a PSA increase of more than 25% during follow-up were referred for further evaluation (mp-MRI or biopsy) in their institution. Regarding active surveillance recommendations, Hefermehl et al.13 and Hagmann et al.14 accepted a threshold value of 0.5 ng/mL/year for repeat biopsy during clinical follow-up. In comparison, Nelson et al.15 reported an optimal cut-off value of 1.18 ng/mL/year for clinical progression in the non-Hispanic white population under active surveillance. Another source states that cases with a PSA doubling time of fewer than 36 months require further evaluation with mp-MRI or biopsy during active surveillance.16 We considered patients with PSA levels within the age-based normal range or with a PSAV below 0.75 ng/mL/year as clinically stable, as long as there were no suspicious DRE findings. Considering that the majority of our cases had PSA values greater than 3 ng/mL, it is mathematically evident that our PSA monitoring criteria were more stringent compared to the 25% PSA increase criterion mentioned by Venderink et al.9 and the above-mentioned PSA doubling time criterion recommended for active surveillance.16 Therefore, the cut-off value we determined appears safer than the aforementioned approaches, except for Hefermehl et al.13 and Hagmann et al.14 thresholds. In clinical follow-up evaluation, we sought the presence of at least a 1-year follow-up and at least three PSA measurements to overcome PSA variations that could occur within short time intervals.8 If the censoring was based solely on clinical monitoring, the follow-up was ended in the presence of procedures such as transurethral resection of the prostate or open prostatectomy, which can significantly lower the PSA level and make it challenging to evaluate clinical stability. Furthermore, in our study, for clinical follow-up to be considered stable in the absence of biopsy or mp-MRI, the final PSA value was required to not exceed 20 ng/mL. We based this criterion on a study conducted by Agnihotri et al.17, which indicated a high probability of malignancy (above 60%) in cases with PSA values greater than 20 ng/mL, even in the absence of suspicious DRE findings.
The additive impact of mPSAD and PI-RADS category on cs-PCa prediction has been emphasized in several studies.18,19 Frisbie et al.20 underlined that these two variables complemented one another in stratifying the risk of cs-PCa. Wang et al.21, in their study evaluating risk factors associated with progression in patients undergoing active surveillance for PCa, found that both PI-RADS category and PSAD were significant factors in both univariable and multivariable analyses. Ma et al.22 included age as a variable in their predictive model for cs-PCa, in addition to the PI-RADS category and PSAD, and achieved an AUC of 0.914 after external validation. Patel et al.23 emphasized the importance of prior biopsy status and reported that the percentages of PCa and cs-PCa in biopsy-naïve cases were approximately twice as high as those in cases with prior negative biopsies. In the same study, after multivariable analyses, age, PSA, PSAD, prostate volume, and PI-RADS 4–5 categories were also found to be significantly associated with cs-PCa. Unlike our study, this study found no statistically significant increase in cs-PCa risk for the PI-RADS 3 group (compared to PI-RADS 1–2 as a reference).23
High cs-PCa diagnosis-free survival in our PI-RADS 1–2 cohort was similar to the results reported in the studies by Panebianco et al.24 and Venderink et al.9, supporting the low likelihood of detecting cs-PCa during follow-up. In their survival analysis on PI-RADS 1–2 cases, Panebianco et al.24 found that a 4-year cs-PCa diagnosis-free survival probability was 95% in the biopsy-naïve group and 96% in patients with prior negative biopsies. In Panebianco et al.’s24 work, PSA was also found to be associated with cs-PCa, in addition to PSAD. Venderink et al.9 performed survival analysis on 361 PI-RADS 1–2 cases who had a subsequent histopathological examination or follow-up mp-MRI. According to the study results, the 3- and 6-year cs-PCa diagnosis-free survival probabilities in patients with an initial mp-MRI result of PI-RADS 1-2 were 99.6% and 94.1%, respectively.9 In contrast to our findings, Venderink’s et al.9 study found a significant association between patients’ age and the likelihood of cs-PCa diagnosis, while no significant association was found between PSA level, PSAD, or prior biopsy status and the probability of cs-PCa.
Our findings indicate that the probability of cs-PCa development during long-term follow-up in the PI-RADS 3 cohort was approximately 10%. Therefore, the conservative follow-up approach recommended in the literature, comprising PSA monitoring and/or follow-up mp-MRI, may be a reasonable option for managing PI-RADS 3 cases. van der Sar et al.11 proposed a surveillance strategy for radiologically indeterminate cases, comprising PSA monitoring, if necessary, followed by mp-MRI and, if necessary, delayed biopsy. The majority of patients (57%) preferred this approach over immediate biopsy. No difference in PCa risk profiles was observed between the two approaches. Moreover, a significant portion of PI-RADS 3 cases (39%), where patients selected the conservative pathway, were followed clinically with PSA monitoring only, without the need for follow-up mp-MRI or biopsy, thereby avoiding the risks and costs associated with unnecessary procedures. Rivas et al.12 similarly stated that surveillance without biopsy may be a viable alternative approach for radiologically indeterminate lesions. Hauth et al.10, in their prospective study, reported that only 4% of patients with PI-RADS 3 lesions on initial mp-MRI developed cs-PCa during follow-up. In Hauth’s et al.10 work, a follow-up mp-MRI one year later was recommended for PI-RADS 3 cases to exclude the possibility of high-grade cancer development, and the majority of PI-RADS 3 lesions remained stable or decreased in size during follow-up imaging. Similarly, Steinkohl et al.25 suggested that the ideal timing for follow-up mp-MRI in PI-RADS 3 cases was approximately 12.4 months after the initial examination. Another study on the follow-up of PI-RADS 3 cases indicated that mp-MRI performed 12–24 months later could eliminate the need for biopsy. The same study emphasized the low percentage of cs-PCa in the PI-RADS 3 group (4%) and stated that a PI-RADS upgrade was observed on the pre-biopsy follow-up mp-MRIs in cases eventually diagnosed with cs-PCa.26 For the PI-RADS 3 cohort, we found that a low mPSAD and the presence of a prior negative biopsy were two protective factors against the development of cs-PCa, based on both univariable and multivariable analyses. These findings demonstrate that conservative follow-up can be even more reliable in these specific subgroups of PI-RADS 3 cases.
According to 1-year follow-up results, cs-PCa detection in approximately 43% of the PI-RADS 4 cohort and 76% of the PI-RADS 5 cohort reflected the positive predictive value of PI-RADS category aligning with reported cs-PCa detection rates in the literature [59% (39%–78%) and 85% (73%–94%) for PI-RADS 4 and 5 cases, respectively] and emphasized the necessity of a biopsy.27 The literature recommends an immediate biopsy for PI-RADS 4–5 cases, and even if the initial biopsy is negative, the need for re-biopsy or follow-up mp-MRI is underscored.10 Meng et al.28 discussed the follow-up of patients initially categorized as PI-RADS 4–5 with a subsequent nonmalignant targeted biopsy. In follow-up mp-MRIs, a PI-RADS category downgrade was observed in 73% of cases, while PI-RADS 4–5 lesions persisted in 27%. Among cases that were downgraded to PI-RADS 2–3, malignancy was observed in 23%, whereas 62.5% of cases with persistent lesions were diagnosed with cancer.28 Similarly, Barletta et al. emphasized the high positive predictive value of follow-up mp-MRI and its strong association with the presence of cs-PCa.29 These studies showed that radiological follow-up could be effective in the diagnostic management of PI-RADS 4–5 cases.
Due to the relatively high percentage of cs-PCa expected in PI-RADS 4–5 cases, there is a paucity of evidence and no widely accepted recommendations regarding conservative follow-up without biopsy. However, it is well-known that not every PI-RADS 4–5 case is malignant, and mimickers such as prostatitis can cause diagnostic confusion.30 Long-term follow-up findings, such as a PI-RADS category downgrade and PSA regression, may help distinguish between PCa and prostatitis.31 Therefore, we included 11 patients who had an initial PI-RADS 4–5 mp-MRI but were managed with follow-up mp-MRI and clinical monitoring without undergoing biopsy due to patient preference. In all of these cases, a downgrade to PI-RADS 2–3 was observed on follow-up MRI [median (minimum–maximum) follow-up time, 12.4 (7.00–44.27) months]. Additionally, we included 13 cases with an initial PI-RADS 4 category that were only managed with close clinical monitoring (PSA and DRE), without any biopsy or follow-up mp-MRI, and eventually showed PSA regression [median (minimum-maximum) follow-up time: 36.90 (18.97–50.00) months]. We had no patients in the PI-RADS 5 cohort who were managed only with clinical follow-up. Our study identified advanced age, high mPSAD, and biopsy-naïve status as key risk factors that further increased the likelihood of cs-PCa in the PI-RADS 4–5 cohort. In subgroup analyses of the PI-RADS 4–5 cohort, unlike PI-RADS ≤3 cohorts, cs-PCa diagnosis-free survival probabilities were not reliably high enough to support the conservative follow-up approach.
In our study, PCa cases initially characterized as PI-RADS ≥4 categories were in higher NCCN risk groups, indicating an increased likelihood of definitive treatment requirement and a decreased probability of an active surveillance option compared to PCa cases with initial PI-RADS ≤3. This finding highlights the prognostic value of the initial PI-RADS category. Numerous studies in the literature investigated the relationship between PI-RADS categories and various prognostic factors. Morote et al.32 demonstrated the association between the PI-RADS group and PCa aggressiveness. Similar to our study, Morote et al.’s32 work also found that the PI-RADS ≥4 patient group was significantly more associated with aggressive cancers compared to the PI-RADS ≤3 group. Alessi et al.33 reported that a low PI-RADS score (PI-RADS ≤3) independently excluded the presence of extraprostatic extension with a sensitivity of 99% and a negative predictive value of 98%, irrespective of clinical risk group. Pockros et al.34 showed that a high PI-RADS category was an independent risk factor for postoperative stage upgrade. The same study reported that lymph node metastasis was only observed in PI-RADS ≥4 cases. In a recent meta-analysis by Rajwa et al.35, the pre-treatment PI-RADS categories of patients who received definitive local treatment for PCa were found to be associated with post-treatment biochemical recurrence. Another study indicated that the initial PI-RADS category was associated with distant metastasis in intermediate/high-risk PCa cases treated with primary radiation therapy.36 Another notable finding in our study is the prognostic effect of mPSAD in the PI-RADS 3 cases. The rate of unfavorable PCa in PI-RADS 3 cases with a high mPSAD (≥0.15 ng/mL2) was similar to that in PI-RADS 4 cases. This finding supports the approach of making a biopsy decision based on a PSAD threshold value of 0.15 ng/mL2 in PI-RADS 3 cases.37,38,39,40,41 Indeed, in our study, a significant portion (72%) of PI-RADS 3 cases with a low mPSAD (<0.15 ng/mL2) were in the favorable PCa group, from a prognostic perspective.
The main strength of our study is the evaluation of histopathological, radiological, and clinical follow-up data from more than 1,300 cases by a multidisciplinary team in a format comparable to a real-life setting.
The limitations of this study include an inability to establish a uniform follow-up protocol due to the research’s retrospective design, a heterogeneous dataset spanning 8 years (including variable image acquisition quality on different MRI scanners, improved mp-MRI evaluation over time by different mp-MRI readers, developing MRI-TRUS fusion biopsy experience, and evolving institutional experience regarding management strategies such as mp-MRI referral and clinical follow-up), and potential selection biases that may have occurred due to high follow-up losses in the PI-RADS ≤3 cohorts. Conversely, the comparison of cases in the main dataset with cases that were eligible for survival analysis suggests similarities in various characteristics between the included and excluded cases, offering relative reassurance for having circumvented selection biases.
Another limitation of this study is that the censoring criteria we defined, such as at least ~1 year of clinical stability, PI-RADS 1–2 category on follow-up mp-MRI, radiologically and/or clinically stable PI-RADS 3 cases during follow-up, PI-RADS downgrade to category 3, and even core biopsy results indicating a non-neoplastic pathology or ISUP = 1 PCa, did not provide 100% reassurance for the absence of cs-PCa.42 However, since it is not feasible to perform whole-mount histopathological examinations, which are considered the gold standard for PCa diagnosis, for most patients, cases were censored based on current evidence and comprehensive clinical judgment. In this way, we aimed to mirror the fundamental clinical approach and increase the applicability of the findings to daily practice.
In conclusion, PI-RADS category significantly influences patient care and offers vital diagnostic and prognostic insights. The combined use of PI-RADS, particularly with mPSAD and other clinical variables, holds promise for serving as a navigational tool for risk stratification and patient management strategies. In the future, multi-center prospective studies with longer follow-up periods and well-standardized follow-up protocols may be able to shed more light on the role and importance of PI-RADS category in patient management.
Acknowledgments
This study was presented as an oral scientific presentation at the 27th Annual Meeting of the Turkish Society of Magnetic Resonance (Türkiye, 2023) and the European Congress of Radiology (Vienna, 2023). The authors thank Dr. Aynur Azizova for her valuable suggestions regarding the manuscript and Batuhan Bakırarar for his advice on statistical analysis.
Footnotes
Conflict of interest disclosure
Hacettepe University Department of Radiology is one of the 20 partners of the Pro-CAncer-I project as a data provider. D.A. is the principal investigator, and A.D.K., M.K., and M.N.Ö. are researchers for the ProCAncer-I project, which has received funding from the European Union’s Horizon 2020 research and innovation programme under grant agreement no: 952159. Other authors (Ö.Ö., M.A., Y.Y., V.G., M.S.Y., and B.A.) declare no conflict of interest.
References
- 1.Mohler JL, Antonarakis ES, Armstrong AJ, et al. Prostate cancer, version 2.2019, NCCN clinical practice guidelines in oncology. J Natl Compr Canc Netw. 2019;17(5):479–505. doi: 10.6004/jnccn.2019.0023. [DOI] [PubMed] [Google Scholar]
- 2.Hernandez DJ, Nielsen ME, Han M, Partin AW. Contemporary evaluation of the D’amico risk classification of prostate cancer. Urology. 2007;70(5):931–935. doi: 10.1016/j.urology.2007.08.055. [DOI] [PubMed] [Google Scholar]
- 3.Gupta RT, Mehta KA, Turkbey B, Verma S. PI‐RADS: Past, present, and future. J Magn Reson Imaging. 2020;52(1):33–53. doi: 10.1002/jmri.26896. [DOI] [PubMed] [Google Scholar]
- 4.Mottet N, van den Bergh RC, Briers E, et al. EAU-EANM-ESTRO-ESUR-SIOG guidelines on prostate cancer-2020 update Part 1: screening, diagnosis, and local treatment with curative intent. Eur Urol. 2021;79(2):243–262. doi: 10.1016/j.eururo.2020.09.042. [DOI] [PubMed] [Google Scholar]
- 5.Scott R, Misser SK, Cioni D, Neri E. PI-RADS v2. 1: what has changed and how to report. SA J Radiol. 2021;25:2062. doi: 10.4102/sajr.v25i1.2062. [DOI] [PMC free article] [PubMed] [Google Scholar]
- 6.Connolly D, Black A, Murray LJ, Napolitano G, Gavin A, Keane PF. Methods of calculating prostate-specific antigen velocity. Eur Urol. 2007;52(4):1044–1050. doi: 10.1016/j.eururo.2006.12.017. [DOI] [PubMed] [Google Scholar]
- 7.Oesterling JE, Jacobsen SJ, Chute CG, et al. Serum prostate-specific antigen in a community-based population of healthy men: establishment of age-specific reference ranges. JAMA. 1993;270(7):860–864. [PubMed] [Google Scholar]
- 8.Carter HB, Pearson JD, Metter EJ, et al. Longitudinal evaluation of prostate-specific antigen levels in men with and without prostate disease. JAMA. 1992;267(16):2215–2220. [PMC free article] [PubMed] [Google Scholar]
- 9.Venderink W, van Luijtelaar A, van der Leest M, et al. Multiparametric magnetic resonance imaging and follow‐up to avoid prostate biopsy in 4259 men. BJU Int. 2019;124(5):775–784. doi: 10.1111/bju.14853. [DOI] [PubMed] [Google Scholar]
- 10.Hauth E, Jaeger H, Hohmuth H, Beer M. Follow-up MR imaging of PI-RADS 3 and PI-RADS 4 prostate lesions. Clin Imaging. 2017;43:64–68. doi: 10.1016/j.clinimag.2017.01.016. [DOI] [PubMed] [Google Scholar]
- 11.van der Sar ECA, Kasivisvanathan V, Brizmohun M, et al. Management of radiologically indeterminate magnetic resonance imaging signals in men at risk of prostate cancer. Eur Urol Focus. 2019;5(1):62–68. doi: 10.1016/j.euf.2017.03.016. [DOI] [PubMed] [Google Scholar]
- 12.Rivas JG, Giganti F, Álvarez-Maestro M, et al. Prostate indeterminate lesions on magnetic resonance imaging-biopsy versus surveillance: a literature review. Eur Urol Focus. 2019;5(5):799–806. doi: 10.1016/j.euf.2018.02.012. [DOI] [PubMed] [Google Scholar]
- 13.Hefermehl LJ, Disteldorf D, Lehmann K. Acknowledging unreported problems with active surveillance for prostate cancer: a prospective single-centre observational study. BMJ Open. 2016;6(2):e010191. doi: 10.1136/bmjopen-2015-010191. [DOI] [PMC free article] [PubMed] [Google Scholar]
- 14.Hagmann S, Ramakrishnan V, Tamalunas A, et al. Two decades of active surveillance for prostate cancer in a single-center cohort: favorable outcomes after transurethral resection of the prostate. Cancers. 2022;14(2):368. doi: 10.3390/cancers14020368. [DOI] [PMC free article] [PubMed] [Google Scholar]
- 15.Nelson TJ, Javier-DesLoges J, Deka R, et al. Association of prostate-specific antigen velocity with clinical progression among African American and non-Hispanic white men treated for low-risk prostate cancer with active surveillance. JAMA Netw Open. 2021;4(5):e219452. doi: 10.1001/jamanetworkopen.2021.9452. [DOI] [PMC free article] [PubMed] [Google Scholar]
- 16.Punnen S, Carroll MPR, Washington SL. Active surveillance for males with clinically localized prostate cancer. In: Lee WR, Richie JP, Yushak M, eds. UpToDate. 2022. [Google Scholar]
- 17.Agnihotri S, Mittal RD, Kapoor R, Mandhani A. Raising cut-off value of prostate specific antigen (PSA) for biopsy in symptomatic men in India to reduce unnecessary biopsy. Indian J Med Res. 2014;139(6):851–856. [PMC free article] [PubMed] [Google Scholar]
- 18.Jordan EJ, Fiske C, Zagoria RJ, Westphalen AC. Evaluating the performance of PI-RADS v2 in the non-academic setting. Abdom Radiol (NY) 2017;42:2725–2731. doi: 10.1007/s00261-017-1169-5. [DOI] [PubMed] [Google Scholar]
- 19.Wei X, Xu J, Zhong S, et al. Diagnostic value of combining PI-RADS v2 1 with PSAD in clinically significant prostate cancer. Abdom Radiol (NY) 2022;47(10):3574–3582. doi: 10.1007/s00261-022-03592-4. [DOI] [PubMed] [Google Scholar]
- 20.Frisbie JW, Van Besien AJ, Lee A, et al. PSA density is complementary to prostate MP-MRI PI-RADS scoring system for risk stratification of clinically significant prostate cancer. Prostate Cancer Prostatic Dis. 2023;26(2):347–352. doi: 10.1038/s41391-022-00549-y. [DOI] [PubMed] [Google Scholar]
- 21.Wang AZ, O’Connor LP, Yerram N, et al. Association of PI-RADS categories and PSA density with active surveillance progression in patients with prostate cancer. J Clin Oncol. 2020;38(6 Suppl):293. [Google Scholar]
- 22.Ma Z, Wang X, Zhang W, et al. Developing a predictive model for clinically significant prostate cancer by combining age, PSA density, and mpMRI. World J Surg Oncol. 2023;21(1):83. doi: 10.1186/s12957-023-02959-1. [DOI] [PMC free article] [PubMed] [Google Scholar]
- 23.Patel HD, Koehne EL, Shea SM, et al. Risk of prostate cancer for men with prior negative biopsies undergoing magnetic resonance imaging compared with biopsy‐naive men: a prospective evaluation of the PLUM cohort. Cancer. 2022;128(1):75–84. doi: 10.1002/cncr.33875. [DOI] [PubMed] [Google Scholar]
- 24.Panebianco V, Barchetti G, Simone G, et al. Negative multiparametric magnetic resonance imaging for prostate cancer: what’s next? Eur Urol. 2018;74(1):48–54. doi: 10.1016/j.eururo.2018.03.007. [DOI] [PubMed] [Google Scholar]
- 25.Steinkohl F, Gruber L, Bektic J, et al. Retrospective analysis of the development of PIRADS 3 lesions over time: when is a follow-up MRI reasonable? World J Urol. 2018;36(3):367–373. doi: 10.1007/s00345-017-2135-0. [DOI] [PubMed] [Google Scholar]
- 26.Boschheidgen M, Schimmöller L, Doerfler S, et al. Single center analysis of an advisable control interval for follow-up of patients with PI-RADS category 3 in multiparametric MRI of the prostate. Sci Rep. 2022;12(1):6746. doi: 10.1038/s41598-022-10859-9. [DOI] [PMC free article] [PubMed] [Google Scholar]
- 27.Oerther B, Engel H, Bamberg F, Sigle A, Gratzke C, Benndorf M. Cancer detection rates of the PI-RADSv2 1 assessment categories: systematic review and meta-analysis on lesion level and patient level. Prostate Cancer Prostatic Dis. 2022;25(2):256–263. doi: 10.1038/s41391-021-00417-1. [DOI] [PMC free article] [PubMed] [Google Scholar]
- 28.Meng X, Chao B, Chen F, Huang R, Taneja SS, Deng FM. Followup of men with PI-RADS™ 4 or 5 abnormality on prostate magnetic resonance imaging and nonmalignant pathological findings on initial targeted prostate biopsy. J Urol. 2021;205(3):748–754. doi: 10.1097/JU.0000000000001424. [DOI] [PubMed] [Google Scholar]
- 29.Barletta F, Stabile A, Mazzone E, et al. How to optimize follow-up in patients with a suspicious multiparametric MRI and a subsequent negative targeted prostate biopsy Results from a large, single-institution series. Urol Oncol. 2022;40(3):103. doi: 10.1016/j.urolonc.2021.09.015. [DOI] [PubMed] [Google Scholar]
- 30.Uysal A, Karaosmanoğlu AD, Karcaaltıncaba M, et al. Prostatitis, the great mimicker of prostate cancer: can we differentiate them quantitatively with multiparametric MRI? AJR Am J Roentgenol. 2020;215(5):1104–1112. doi: 10.2214/AJR.20.22843. [DOI] [PubMed] [Google Scholar]
- 31.Azab S, Osama A, Rafaat M. Does normalizing PSA after successful treatment of chronic prostatitis with high PSA value exclude prostatic biopsy? Transl Androl Urol. 2012;1(3):148–152. doi: 10.3978/j.issn.2223-4683.2012.07.02. [DOI] [PMC free article] [PubMed] [Google Scholar]
- 32.Morote J, Borque-Fernando A, Triquell M, et al. Multiparametric magnetic resonance imaging grades the aggressiveness of prostate cancer. Cancers (Basel) 2022;14(7):1828. doi: 10.3390/cancers14071828. [DOI] [PMC free article] [PubMed] [Google Scholar]
- 33.Alessi S, Pricolo P, Summers P, et al. Low PI-RADS assessment category excludes Long-term follow-up results of mp-MRI and the prognostic value of PI-RADS • extraprostatic extension (≥ pT3a) of prostate cancer: a histology-validated study including 301 operated patients. Eur Radiol. 2019;29(10):5478–5487. doi: 10.1007/s00330-019-06092-0. [DOI] [PMC free article] [PubMed] [Google Scholar]
- 34.Pockros B, Stensland KD, Parries M, Frankenberger E, Canes D, Moinzadeh A. Preoperative MRI PI‐RADS scores are associated with prostate cancer upstaging on surgical pathology. Prostate. 2022;82(3):352–358. doi: 10.1002/pros.24280. [DOI] [PubMed] [Google Scholar]
- 35.Rajwa P, Mori K, Huebner NA, et al. The prognostic association of prostate MRI PI-RADS™ v2 assessment category and risk of biochemical recurrence after definitive local therapy for prostate cancer: a systematic review and meta-analysis. J Urol. 2021;206(3):507–516. doi: 10.1097/JU.0000000000001821. [DOI] [PubMed] [Google Scholar]
- 36.Turchan WT, Kauffmann G, Patel P, Oto A, Liauw SL. PI-RADS score is associated with biochemical control and distant metastasis in men with intermediate-risk and high-risk prostate cancer treated with radiation therapy. Urol Oncol. 2020;38(6):600. doi: 10.1016/j.urolonc.2019.12.015. [DOI] [PubMed] [Google Scholar]
- 37.Venderink W, van Luijtelaar A, Bomers JGR, et al. Results of targeted biopsy in men with magnetic resonance imaging lesions classified equivocal, likely or highly likely to be clinically significant prostate cancer. Eur Urol. 2018;73(3):353–360. doi: 10.1016/j.eururo.2017.02.021. [DOI] [PubMed] [Google Scholar]
- 38.Messina E, Pecoraro M, Laschena L, et al. Low cancer yield in PI-RADS 3 upgraded to 4 by dynamic contrast-enhanced MRI: is it time to reconsider scoring categorization? Eur Radiol. 2023;33(8):5828–5839. doi: 10.1007/s00330-023-09605-0. [DOI] [PMC free article] [PubMed] [Google Scholar]
- 39.Vourganti S, Rastinehad A, Yerram NK, et al. Multiparametric magnetic resonance imaging and ultrasound fusion biopsy detect prostate cancer in patients with prior negative transrectal ultrasound biopsies. J Urol. 2012;188(6):2152–2157. doi: 10.1016/j.juro.2012.08.025. [DOI] [PMC free article] [PubMed] [Google Scholar]
- 40.Distler FA, Radtke JP, Bonekamp D, et al. The value of PSA density in combination with PI-RADS™ for the accuracy of prostate cancer prediction. J Urol. 2017;198(3):575–582. doi: 10.1016/j.juro.2017.03.130. [DOI] [PubMed] [Google Scholar]
- 41.Washino S, Okochi T, Saito K, et al. Combination of prostate imaging reporting and data system (PI‐RADS) score and prostate‐specific antigen (PSA) density predicts biopsy outcome in prostate biopsy naïve patients. BJU Int. 2017;119(2):225–233. doi: 10.1111/bju.13465. [DOI] [PubMed] [Google Scholar]
- 42.Ahmed HU, Bosaily AES, Brown LC, et al. Diagnostic accuracy of multi-parametric MRI and TRUS biopsy in prostate cancer (PROMIS): a paired validating confirmatory study. Lancet. 2017;389(10071):815–822. doi: 10.1016/S0140-6736(16)32401-1. [DOI] [PubMed] [Google Scholar]


