

Abstract
There is a need to fully understand intra‐skeletal variability within different populations to develop and improve age‐at‐death estimation methods. This study evaluates age‐related histomorphometric changes in three different bones intra‐individually in a modern Australian sample. Four female and 13 male elderly Australian adult donors (67–93 years) were examined for osteon population density (OPD), osteon area (On.Ar), and Haversian canal area (H.Ar) of secondary osteons to compare between femora, ribs, and humeri and assess against age. In the pooled sex sample, no statistically significant correlations were observed between age and each histological variable. In the males, OPD of the femur increased significantly with age, as did porosity in the rib. In the male humeri, OPD increased moderately with age, while H.Ar was decreased moderately with age. Intra‐bone comparisons showed that males had significantly higher osteon counts in their ribs compared to their femora, while their ribs showed statistically significantly less porosity than their humeri. When bone size was accounted for, by adjusting the femur and humerus histology data by robusticity indices, histology values were found to be similar between bones within the same individual. This is despite the upper and lower limbs receiving different ranges and types of biomechanical load. Our findings demonstrate that bone size influences histomorphometry, and this could confound age‐at‐death estimations that have not been adjusted for robusticity. Future studies would benefit from examining bone histomorphometry within a larger sample size and incorporating bone robusticity measures into histology analyses.
Keywords: age‐related histomorphometry, intra‐skeletal variation, osteon, remodelling, robusticity index
This study evaluated age‐related histomorphometric changes (osteon population density (OPD), osteon area (On.Ar), and Haversian canal area (H.Ar)) in three different bones intra‐individually in a modern Australian sample. Femur and humerus histology data were adjusted with robusticity indices, and our findings demonstrate that bone size influences histomorphometry, and this could confound age‐at‐death estimations that have not been adjusted for robusticity.

1. INTRODUCTION
Forensic anthropologists and bioarchaeologists have been embracing quantitative bone histology to establish age at death by utilising changes in bone microstructure that are known to correlate with advancing age (Crowder & Dominguez, 2013; Khan et al., 2017). Basic structural units in bone, secondary osteons, are evidence of bone remodelling processes. These osteons are the key feature of most histological age estimation methods that typically use regression analyses to correlate independent histological variables, such as the tendency with advancing age to see an increase in the size of vascular pores and secondary osteon population density (OPD), and a corresponding decrease in overall osteon size (Ahlqvist & Damsten, 1969; Ericksen, 1991; Kerley, 1965; Stout & Paine, 1992; Yoshino et al., 1994).
Remodelling does not occur uniformly throughout the skeleton, so age estimation methods are developed on specific bones, most commonly the femur and the rib (Crowder & Dominguez, 2013; Gocha et al., 2019). Varying rates of remodelling are reported not only between different bones of an individual skeleton (Cole et al., 2022; Karydi et al., 2022) but also within different regions of a bone (Chan et al., 2007; Dominguez et al., 2020; Gocha & Agnew, 2016) depending on biomechanical loading regimes and metabolic activity. Increasing knowledge of intraskeletal histomorphometric variation is critical to improving accuracy in age‐at‐death estimation, particularly in older adults (Stout & Crowder, 2012).
Curated Australian human skeletal histological material accessible to researchers has been largely limited to the Melbourne Femur Research Collection (MFRC), which was established in 1991 at the University of Melbourne in Victoria (Thomas & Clement, 2011). Over the years, many national and international research articles have used this collection to document histomorphometric properties of the femur. However, what has been lacking is a skeletal reference collection that includes several different bones to evaluate intraskeletal variability in a modern Australian population. Documenting intraskeletal variability in bone remodelling within different populations is a critical step in understanding individual and regional trends, with implications for developing population‐specific age estimation techniques. This will be the first study to evaluate sections from three different bones that have been collected intra‐individually from an Australian sample.
The Australian histological bone sample used in this study was recently established at James Cook University in Townsville, Australia in 2021 (The James Cook University Human Skeletal Histology Collection [JCUHSHC]). This present study is a unique opportunity to assess age‐progressive features of cortical bone remodelling by measuring secondary OPD, and size of Haversian canals and intact secondary osteons in the femur, humerus, and rib of elderly Australians. The aim is to test the degree to which histological features used in age estimation methods vary intra‐skeletally within this population. It is hypothesised that localised biomechanical forces and metabolic activity would cause variation in remodelling. This study will contribute to a greater understanding of the normal range of histological variation that is yet to be fully explored in an Australian population.
Research on the femora of modern Australians has been relatively prolific, largely due to the large femoral sample held at the MFRC which is complemented by cadaveric samples from the Victorian Institute of Forensic Medicine (VIFM). Key findings for age‐dependent histological changes in the femur show that there are similarities and contradictions between these studies. Britz et al. (2009) found that age statistically significantly correlated with increasing osteon circularity, and they observed decreasing osteon size in the femoral midshaft, with females having statistically significantly smaller osteons compared to males. Hennig et al. (2015) were able to confirm that osteon circularity increases with age in the anterior femoral midshaft of females; however, they did not find an age‐associated decrease in osteon size. Two‐dimensional microradiograph analysis did not identify significant correlations between cortical porosity (total and individual pore area, and number of pores) in the midshaft femur compared to an individual's height or weight (Stein et al., 1999), yet later 3D analysis showed that adults with lower body weight had significantly larger mean pore diameter (Cooper et al., 2007). Both studies found the most significant correlation to porosity to be age, and the differences in significance for weight may well be down to the very different methods of measuring porosity. It has also been observed that, compared to younger Australians, older individuals had a substantially thinner cortical zone in the upper femoral neck (Mayhew et al., 2005) and a tendency for new osteons to remodel within previously formed Haversian systems (Maggiano et al., 2016).
Most of these Australian studies focus on remodelling in the anterior midshaft region of the femur, while this present study will record changes in the posterior region, in addition to the rib and the humerus, which increases the current knowledge on inter‐bone variability. This is key to better inform future archaeological and forensic efforts of age‐at‐death estimation from incompletely preserved and fragmentary human remains, where only some bones may be available for examination. Further, it is important to know which regions of bone will produce different OPD counts within an individual as this will impact age‐at‐death estimations (Dominguez et al., 2020). For example, statistically significant differences in OPD are observed between the anterior and posterior regions of transverse mid‐shaft cross‐sections of ribs (Dominguez et al., 2020). In contrast, only a statistically non‐significant difference in OPD was discovered between the anterior and posterior femoral midshaft (Maggio & Franklin, 2021), whereas the anterolateral region recorded statistically significantly higher OPD, presumably depending on the degree of bending stress and axial loading placed on each region (Gocha & Agnew, 2016).
The current lack of research into age‐related changes to secondary osteons in bones other than the femur in the Australian population is concerning for the future development of population‐specific of age‐at‐death estimation methods, especially as it is well‐documented that different bones are under varying degrees of metabolic stress and mechanical loading which tandemly effect cortical remodelling (Eleazer & Jankauskas, 2016; Stewart et al., 2021). The femur usually experiences the greatest magnitude of biomechanical loading to support body weight in bipedal motion, and it is subjected to compression and torsional forces with movement (Pfeiffer et al., 2006; Ruff et al., 1993). These forces instigate microscopic damage to bone which is then targeted for repair by remodelling (Robling & Stout, 2003). In comparison, the humerus is under less weight‐bearing loading but experiences axial loading forces from manipulative movements of the hands and arms (Sumner & Andriacchi, 1996), and, in turn, the ribs are under consistent, but low‐level loading from breathing (Skedros et al., 2013). Ribs are more sensitive to hormonal changes and experience more metabolic bone loss than the femur and humerus, which can have an effect on remodelling rates (Eleazer & Jankauskas, 2016). These three skeletal elements also vary in cortical width and length. Human and non‐human animal studies have determined that intracortical bone remodelling responds to bone size (Currey, 2003). Bone robusticity, an increase in diaphyseal length relative to width, is viewed as a naturally programmed response to compensate for increased porosity from metabolic activity (Eleazer & Jankauskas, 2016; Goldman et al., 2014). Short and wide bones will generally have an increased cortical region and more remodelling events compared to long and thin bones (Currey, 2003; Jepsen et al., 2015). More robust bones will have a higher OPD and larger osteons and Haversian canals than bones that are more gracile (Goldman et al., 2014). These studies highlight just how important it is to account for gross bone size when measuring microscopic geometric features within its cortex, yet it is not commonly accounted for (Miszkiewicz & Mahoney, 2019). This study will test for the effects of bone robusticity and aims to address the uncertainty of intraskeletal variation between the microstructure of the femur, humerus, and rib within a modern Australian sample, and which of the histological variables (OPD and osteon and Haversian canal size) have the highest correlation to age, specifically in males that have reached their 7th or 8th decade of life.
2. MATERIALS AND METHODS
2.1. Skeletal sample
Bone samples examined in the present study derive from human cadavers received as donations in the Human Bequest Program at James Cook University (JCU), Townsville, Queensland, Australia. Ethics protocols were filed and approved (JCU #H8352 and University of Queensland #2022/HE000860) to obtain and analyse bone samples from individual donors that had been embalmed and used for medical training in the JCU College of Medicine and Dentistry. The sample in this study consisted of 17 adults, four of whom were female and 13 of whom were male (Table 1). Age at death ranged from 67 to 93 years (mean 82.4 years ± SD 6.04 years). The females ranged in age from 67 to 88 years (mean age 80.5 years ± SD 9.95 years), and male age range was 75–93 years (mean age 83 years ± SD 4.73 years). Body donors in this study were bequeathed between 2014 and 2019, from within a 400 km radius of the regional city of Townsville in north Queensland. Donor information on record primarily includes sex, date of birth, age at death, and cause of death. No individuals of Aboriginal or Torres Strait Islander ancestry were included in this study.
TABLE 1.
JCU sample size subdivided by sex.
| n | Age range (years) | Mean age (years) | SD | |
|---|---|---|---|---|
| All adults | 17 | 67–93 | 82.4 | 6.04 |
| Females | 4 | 67–88 | 80.5 | 9.95 |
| Males | 13 | 75–93 | 83.0 | 4.73 |
Abbreviation: JCU, James Cook University.
2.2. Bone robusticity measurements and sectioning
Three bone sampling sites were chosen from each donor, incorporating a lower limb (femur), an upper limb (humerus), and the thorax (rib). The soft tissues surrounding the sites of interest were first dissected using a scalpel and knife, and the joints disarticulated at the knee and hip for the femur, and at the elbow and shoulder for the humerus. Maximum bone length and midshaft circumference were recorded (cm) using a standard tape measure to enable the robusticity index (RI) to be calculated for the femur and humerus. The robusticity index (RI = circumference/bone length × 100) (Ruff et al., 1993) was used to account for the effect of bone size on histology data. A limitation of this study was that RI could not be estimated for the rib as circumference and length measurements for this bone could not be obtained at the time of sample collection.
For sampling to be minimally invasive, yet sufficient, only a 1–2 cm thickness wedge section of cortical bone was removed (e.g., Maat et al., 2006; Mays et al., 2013; Miszkiewicz & Mahoney, 2019) from (1) the anterior midshaft of the humerus, incorporating the lower aspect of the deltoid tuberosity, (2) the posterior midshaft of the femur, incorporating the linea aspera, and (3) a cross‐section from the midshaft of the 7th rib (Figure 1). Two individuals did not have ribs available for sampling, therefore a total of 49 bone sections were extracted from the 17 individuals. Sections were consistently taken from the right bone, with the exception of one individual (JCU 197‐17) who only had bones on their left side available for sampling. Sections were removed using a hand‐held electric rotary autopsy saw and then immediately fixed in a 70% ethanol solution and placed in cold storage (4°C) until further processing (Ries, 2003).
FIGURE 1.
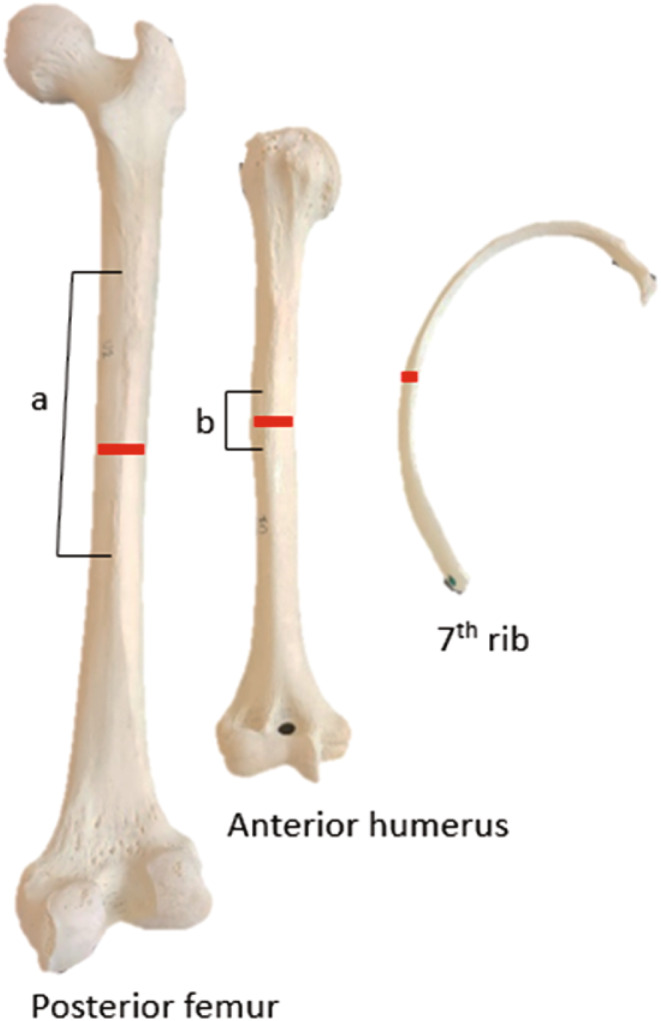
Midshaft sample locations from right bone. The samples incorporated the linea aspera (a) on femora and the deltoid tuberosity of the humerus (b).
2.3. Histological preparation
Standard histological methods were followed to prepare thin sections (Bancroft & Gamble, 2008). Using a portable hotplate (Thermo Fisher Scientific Cimarec®), extracted bone sections were gently macerated in a warm water and enzymatic laundry detergent mix over low heat (55 ± 5°C) for approximately 12 h, with the water and detergent mix replenished three times (Uhre et al., 2015). This is a quick, effective, and gentle process that does not damage the bone microstructure. Adhering soft tissue was then removed with the assistance of a plastic spatula and soft toothbrush. The undecalcified bone samples were placed in a fume cabinet to air dry for 24 h before being dehydrated in a graded ethanol series and cleared with xylene (An et al., 2003). Each section was embedded in resin (Buehler EpoxiCure™2). Sections of ~400 μm thickness were cut from the embedded blocks using a Buehler® IsoMet™ Low Speed Precision Cutter with a diamond blade, to obtain a transverse cross‐section (Bancroft & Gamble, 2008). Each section was ground using a Gemmasta™ GF4 faceting machine with a diamond lap, and then hand‐polished to 100 ± 25 μm thickness using diamond paste and a polishing cloth, before being washed, dried, cleaned in an ultrasonic bath, dehydrated, and mounted onto a glass microscope slide and sealed with a cover slip (Bancroft & Gamble, 2008).
2.4. Selection of regions of interest
Each slide was viewed under a high‐powered microscope (Olympus BX43), and images of six regions of interest (ROIs) (Figure 2) were taken with a mounted microscope camera (Olympus EP50 with 0.5 camera adapter) (1) under transmitted light and (2) with a polarising filter. The technique used to select ROIs greatly varies between studies and lacks standardisation (Villa & Lynnerup, 2010). In this study, ROIs were selected within the mid‐cortical region. For the femur and humerus, the positions of ROI 1 and 2 were selected to be slightly offset either side of an arbitrary midline of the peri‐curve (Figure 2), ROIs 3 and 4 were parallel to ROIs 1 and 2 but positioned toward the endosteum, ROI 5 was adjacent to ROIs 1 and 4, and ROI 6 was adjacent to ROIs 2 and 3. For the ribs, ROI 1 was selected on the cutaneous side toward the costal groove (if identifiable), then moving in an anti‐clockwise direction ROI 2 was positioned in the mid‐section, ROIs 3 and 4 opposite each other on the superior edge, ROI 5 opposite ROI 2, and ROI 6 opposite ROI 1. The position of each ROI was consistent to ensure replicability and to prevent osteons from one ROI being included in an adjacent ROI. This ensured that the same osteons would not be counted twice. The humerus from several individuals had a narrow cortical width so the six ROI images had to be positioned side by side, mediolaterally, instead of the window pattern in Figure 2.
FIGURE 2.
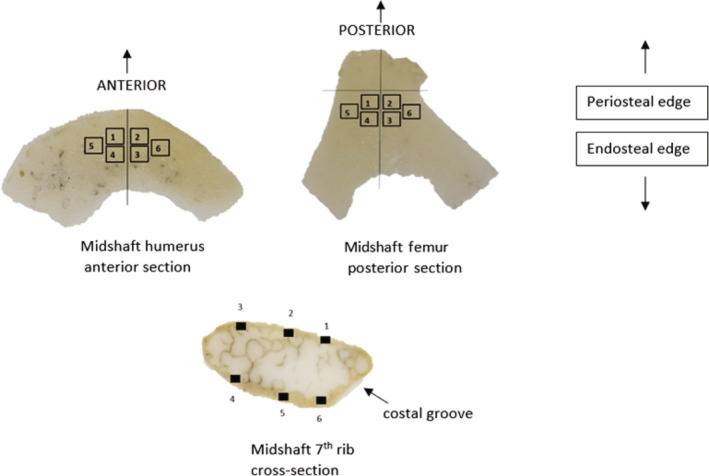
Selection of the regions of interest (ROI). Six ROIs were selected in the sub‐periosteal layer of intracortical bone for the anterior midshaft of the humerus, posterior midshaft of the femur, and rib mid‐shaft (bones not to scale and position of ROIs are approximate).
A ×20 objective was used for the ribs, and a ×10 objective for the humerus and femur (with 10× oculars). With the camera adapter, this produced a rectangular field of view of 1.182 mm2 for each ROI of a femur and humerus and 0.285 mm2 for each ROI of the rib. This gave a total area of 7.09 mm2 for each femur and humerus bone section and 1.71 mm2 for each rib bone section. The average intact osteon count for sections of the femur was 30.6, humerus 28.8, and ribs 12.0. Bone size variability was accounted for by incorporating robusticity indices into the statistical analyses. Bone robusticity is a measure that is commonly utilised to interpret the allometric relationship between bone size and quantifiable characteristics of cortical bone remodelling (Miszkiewicz & Mahoney, 2019).
2.5. Quantification of histomorphometric variables
Histomorphological features such as osteon cement lines and lamellae were most clearly observed on the polarised light images, while the perimeter of Haversian canals was best viewed on the transmitted light images. Features were recorded and labelled on corresponding images using imaging software (open access FIJI/ImageJ®) (Schindelin et al., 2015) with a range of drawing and point counting tools: the ‘multi‐point’ and ‘freehand selection’ tools (Figure 3). Table 2 defines each histological variable. While this study focuses on the elderly, and it is known that the OPD asymptote can erase real OPD in individuals older than 50 (Crowder & Dominguez, 2013), OPD was recorded as part of the histomorphometric standards and included in analyses. However, the effect of OPD asymptote on OPD data will be taken into account when interpreting and discussing data. The number of intact and fragmented osteons per ROI was recorded on polarised light images and counts used to calculate OPD/mm2 (#intact osteons + #fragmentary osteons divided by image area [mm2]). On transmitted light images, the perimeter of each Haversian canal was traced using a stylus and laptop, creating the variable Haversian canal area (H.Ar in μm2), while the perimeter of each intact osteon was traced on polarised images and recorded as secondary osteon area (On.Ar in μm2) (Maggio & Franklin, 2021).
FIGURE 3.
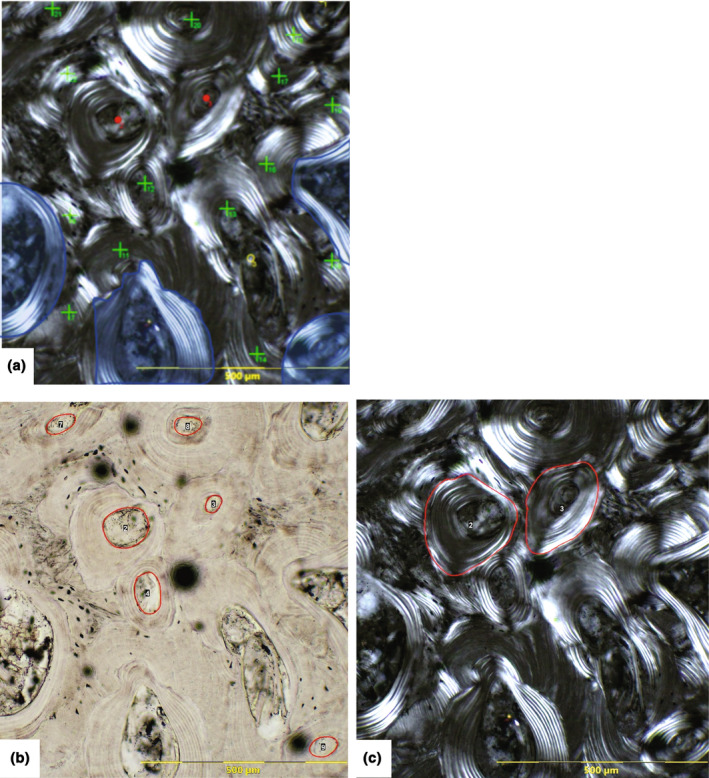
Examples of histomorphometric features recorded on each ROI in this study: (a) count of intact osteons (red dot), fragmentary osteons (green cross), resorption cavity (yellow circle); osteons cut off by the image border were not counted if it could not be determined if they were intact or fragmentary (opaque blue); (b) Haversian canal area measurements (μm2) (red circles) (black dots are artefacts of sample processing); (c) intact osteon area measurement (μm2) (red circles).
TABLE 2.
Definitions of histological variables examined in this study.
|
Intact osteons Osteon that is completely surrounded by a cement (reversal) line, its Haversian canal is intact, and it has not been breached by a resorption space/walls of a later osteon. This is a type I osteon. If they follow the above criteria, included are osteons that have either completed filling or are still being filled, osteons breached by a Volkmann's canal, and type II osteons (osteon embedded within the cement line of a pre‐existing osteon). If two or more osteons appear to share a Haversian canal and/ or share a cement line due to the plane of sectioning, including a branching event, then they are counted as one intact osteon. |
|
Fragmentary osteons A pre‐existing osteon that has had its lamellae and/or the Haversian canal breached by subsequent generations of osteons or a resorption cavity. Concentric lamellae fragments that are clearly identifiable as previous osteons, that is have part of a cement line visible and osteocytes/lacunae between the lamellae, were included. |
|
Osteon population density (OPD) Total count of intact (N.On) and fragmentary osteons (N.On.fg) per region of interest (N.On + N.On.Fg/mm2). |
|
Resorption cavity (RC) An area of resorbed bone, bordered by scalloped edge of a Howship's lacuna. |
|
(mean) Osteon area (On.Ar) The reversal line of each intact secondary osteon was traced, and the internal area was calculated in μm2. For each bone section, the mean On.Ar was used in analyses (summed On.Ar from all ROIs/number of measured osteons). |
|
(mean) Haversian canal area (H.Ar) Complete Haversian canals without any indication of resorption were traced, and the internal area in μm2 was calculated. For each bone section, the mean H.Ar was used in analyses (summed H.Ar from all ROIs/number of measured canals). |
2.6. Statistical analyses
The data were analysed in IBM SPSS® 29.0, at p = 0.05. Intra‐observer error was assessed by re‐taking measurements on 10% of ROIs and comparing them against original values by performing paired non‐parametric correlations (Wilcoxon signed‐rank test). As this was a relatively small sample, non‐normal distribution was assumed, and thus non‐parametric testing was chosen (Depuy & Pappas, 2004). As there were only four females, sex differences in histology were not tested for. Instead, correlations were first tested on the pooled sex group and then on the male‐only group. A Spearman's rank‐order correlation tested the relationship between age and three histological variables (OPD, On.Ar, and H.Ar). To account for robusticity of the femur and humerus, and the allometric/isometric effect of bone size on the histological variables, Spearman's rank‐order tests were also recalculated with the histology variables adjusted by the robusticity index (RI) (e.g., H.Ar Lg10).
Next, the significance of the relationship of each of the histological variables was tested between the three bones (femur, humerus, and rib) using Friedman two‐way analysis of variance by ranks test. This was followed by post hoc Wilcoxon signed‐rank tests (with the Bonferroni correction for multiple comparisons) to determine which of the bones was most sensitive to remodelling. Two of the males did not have ribs available for sampling (JCU195/17 and JCU197/17) so were removed from this part of the analysis, this reduced the entire dataset to 15 individuals, and the male dataset to 10 individuals for Friedman two‐way and post hoc analyses.
Correlations between age groups were not sought as most of the sample fit into a narrow age at death range between 75 and 88 years (n = 15). A 93‐year‐old male (JCU141/14) was excluded from the analyses as this was the only individual in their 9th decade of life and their OPD was a strong outlier. This elderly male will be discussed as an individual case. Therefore, the results of this study can best be used to interpret the bone microstructure of elderly adult Australian males in their 7th and 8th decade of life.
3. RESULTS
3.1. Intra‐observer tests and the effects of age
There were no statistically significant intra‐observer differences between the original and repeated measures (paired correlations, n = 51, z = −2.722 to −1.255, p = >0.05). Spearman's test of correlations within the pooled sex group showed no statistically significant relationships between age and each of the histological variables (OPD, On.Ar, and H.Ar). A moderate positive correlation was observed between age and Haversian canal area in the rib (r s = 0.442, p = 0.099) which is illustrated in Figure 4. The rest of the correlations for the pooled sexes were weak and are presented in Figure S1.
FIGURE 4.
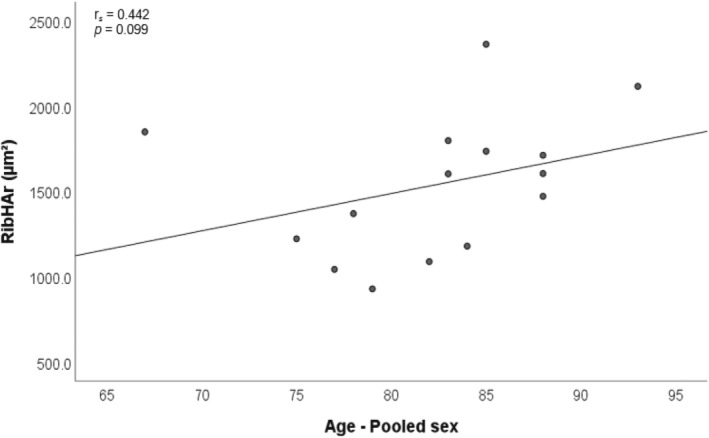
Scatter plot with line of best fit illustrating the moderate positive relationship between age and Haversian canal size of the rib within the pooled sex group.
For the male group, scatter plots illustrating the four strongest relationships with moderate correlations are provided in Figure 5 and all other correlations (weak) are illustrated in Figure S2. There was a statistically significant positive relationship between age and OPD of the femur (r s = 0.603, p = 0.038), and the Haversian canal area in the rib (r s = 0.646, p = 0.043). A moderate positive relationship was recorded between age and OPD of the humerus (r s = 0.529, p = 0.077) along with a corresponding moderate negative correlation with Haversian canal area in the humerus (r s = −0.423, p = 0.170).
FIGURE 5.
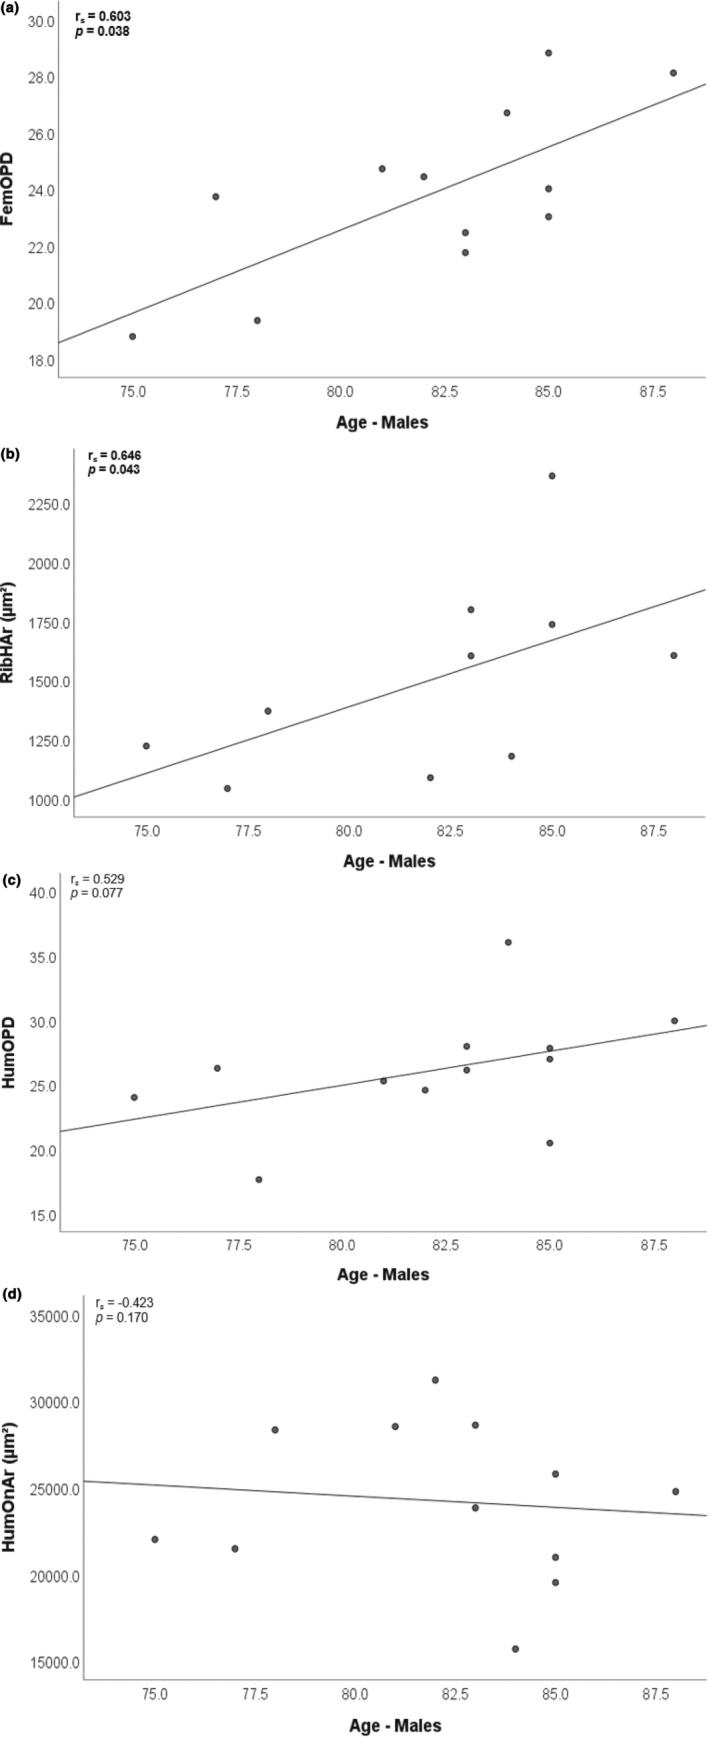
Examples of the four best correlations with age within the male sample: statistically significant positive relationships (bold‐faced) with OPD of the femur (a) and Haversian canal area of the rib (b); moderate positive correlation with humerus OPD (c), and moderate negative correlation with humerus Haversian canal size (d).
3.2. Intra‐skeletal differences
The Friedman test identified statistically significant differences in OPD count, osteon area, and Haversian canal area (pooled sample: ꭓ 2 = 14.533–19.600, p < 0.001, n = 15) (male sample: ꭓ 2 = 9.800–12.800, p = 0.007–0.002, n = 10) between at least two of the bones (Table 3). Subsequent corresponding post hoc analysis on the entire dataset identified that the rib had statistically significantly more osteons, as well as statistically significantly smaller osteons and Haversian canals, in comparison to both the femur and the humerus (Table 4). In males, the rib had a significantly higher osteon count than the femur (Z = −2.803, p = 0.005), and rib Haversian canals were statistically significantly smaller than in the humerus (Z = −2.803, p = 0.005). No significant differences were found between the femur and humerus for any of the histological variables. Descriptive statistics (Table S1) show that the mean for OPD, osteon area, and Haversian canal area are always similar between the femur and humerus, but the rib is different.
TABLE 3.
Friedman test of significant relationships between bones by sample.
| Pooled sex n = 15 | ꭓ 2 | Sig. | Males n = 10 | ꭓ 2 | Sig. |
|---|---|---|---|---|---|
| OPD | 19.600 | <0.001 | OPD | 12.800 | 0.002 |
| On.Ar | 14.533 | <0.001 | On.Ar | 9.800 | 0.007 |
| H.Ar | 18.533 | <0.001 | H.Ar | 11.400 | 0.003 |
TABLE 4.
Post hoc Wilcoxon test.
| Pooled sex n = 15 | Z | Sig.* | Males n = 10 | Z | Sig.* |
|---|---|---|---|---|---|
| Humerus OPD—Femur OPD | 2.385 a | 0.017 | Humerus OPD—Femur OPD | 2.293 a | 0.022 |
| Rib OPD—Femur OPD | 3.408 a | <0.001 | Rib OPD—Femur OPD | 2.803 a | 0.005 |
| Rib OPD—Humerus OPD | 3.237 a | 0.001 | Rib OPD—Humerus OPD | 2.497 a | 0.013 |
| Humerus On.Ar—Femur On.Ar | 1.136 | 0.256 | Humerus On.Ar—Femur On.Ar | 0.968 b | 0.333 |
| Rib On.Ar—Femur On.Ar | 3.010 b | 0.003 | Rib On.Ar—Femur On.Ar | 2.497 b | 0.013 |
| Rib On.Ar—Humerus On.Ar | 3.237 b | 0.001 | Rib On.Ar—Humerus On.Ar | 2.701 b | 0.007 |
| Humerus H.Ar—Femur H.Ar | 0.966 b | 0.334 | Humerus H.Ar—Femur H.Ar | 1.172 b | 0.241 |
| Rib H.Ar—Femur H.Ar | 3.408 b | <0.001 | Rib H.Ar—Femur H.Ar | 2.803 b | 0.005 |
| Rib H.Ar—Humerus H.Ar | 3.124 b | 0.002 | Rib H.Ar—Humerus H.Ar | 2.293 b | 0.022 |
Based on negative ranks.
Based on positive ranks.
Bonferroni adjusted p value of 0.006; statistically significant results are in bold.
3.3. RI‐adjusted data for the femur and humerus
3.3.1. The effects of age
When bone size of the femur and humerus were taken into account by adjusting the histological values with RI, there was a change in correlation strength (Tables 5 and 6). Spearman's test of correlations between age and the three adjusted histological variables within the pooled sex group showed all correlations were still weak. Scatter plots for these relationships are illustrated in Figure S3, with the humerus showing the weakest relationship (On.ArLg10, r s = −0.007, p = 0.978), and the strongest relationship with age (OPDLg10, r s = −0.219, p = 0.398) compared to the femur.
TABLE 5.
Spearman's correlation tests comparing results of original values to RI‐adjusted values for the femur and humerus.
| Pooled sex | Original values | RI‐adjusted values | ||
|---|---|---|---|---|
| r s | Sig. | r s | Sig. | |
| FemOPD | −0.053 | 0.840 | −0.189 | 0.469 |
| FemOn.Ar | −0.010 | 0.970 | −0.166 | 0.523 |
| FemH.Ar | −0.087 | 0.738 | −0.169 | 0.517 |
| HumOPD | 0.229 | 0.376 | 0.211 | 0.417 |
| HumOn.Ar | −0.078 | 0.767 | −0.007 | 0.978 |
| HumH.Ar | −0.239 | 0.355 | −0.219 | 0.398 |
| Males | Original values | RI‐adjusted values | ||
|---|---|---|---|---|
| r s | Sig. | r s | Sig. | |
| FemOPD | 0.603 * | 0.038 | 0.476 | 0.118 |
| FemOn.Ar | −0.339 | 0.282 | −0.360 | 0.251 |
| FemH.Ar | −0.159 | 0.622 | −0.360 | 0.256 |
| HumOPD | 0.529 | 0.077 | 0.174 | 0.819 |
| HumOn.Ar | −0.243 | 0.446 | −0.109 | 0.735 |
| HumH.Ar | −0.423 | 0.170 | −0.536 | 0.072 |
Note: Italicized values are moderate correlations Taylor (1990).
Abbreviation: RI, robusticity index.
The only significant relationship with age (p ≤ 0.05) is bold‐faced.
TABLE 6.
Wilcoxon signed ranks test comparing significance of original values and RI adjusted values for the femur and humerus.
| Pooled sex | Original values | RI‐adjusted values | ||
|---|---|---|---|---|
| Z | Sig. | Z | Sig. | |
| HumOPD—FemOPD | −2.107 a * | 0.035 | −1.112 a | 0.266 |
| HumOn.Ar—FemOn.Ar | −0.639 b | 0.256 | −1.254 b | 0.210 |
| HumH.Ar—FemH.Ar | −0.254 b | 0.334 | −1.538 b | 0.124 |
| Males | Original values | RI‐adjusted values | ||
|---|---|---|---|---|
| Z | Sig. | Z | Sig. | |
| HumOPD—FemOPD | −1.961 a * | 0.050 | −1.083 a | 0.279 |
| HumOn.Ar—FemOn.Ar | −0.157 b | 0.875 | −1.433 b | 0.152 |
| HumH.Ar—FemH.Ar | −1.569 b | 0.177 | −2.201 b * | 0.028 |
Abbreviation: RI, robusticity index.
Based on negative ranks.
Based on positive ranks.
Significant differences (p ≤ 0.05) are bold‐faced.
In the male group, once bone robusticity was accounted for, some of the relationships with age became stronger (Haversian canal size in the femur and humerus), while others became weaker (OPD in the femur and humerus, and humerus osteon area), or remained similar between the original and RI‐adjusted values (femur osteon area). Moderate correlations between all three adjusted histological variables and age were observed in the femur (OPD Lg10, r s = 0.476, p = 0.118; On.ArLg10, r s = −0.360, p = 0.251; and H.Ar Lg10, r s = −0.360, p = 0.256) (Table 5). However in the humerus, the only moderate correlation with age was in Haversian canal size (H.Ar Lg10, r s = −0.536, p = 0.072) (and this was also the strongest of all correlations with age). Scatter plots for each relationship are illustrated in Figure S4.
3.3.2. Intra‐skeletal differences
When the variable of bone size was removed, there was no longer a statistically significant difference in OPD between the femur and humerus for individuals in the pooled sample (Table 6). Male individuals were found to have statistically significantly smaller Haversian canals in their humerus compared to their femur (Z = −2.201, p = 0.028). No other relationship between the femur and humerus was statistically significant.
4. DISCUSSION
In this study, the secondary osteons of elderly modern Australians are examined to (1) evaluate the relationship between age and measures of cortical bone remodelling (OPD and size of osteons and Haversian canals); (2) intra‐skeletally compare remodelling between different bones of the axial (rib) and appendicular (femur and humerus) skeleton that are subject to different rates of metabolic and biomechanical stresses; (3) examine the relationship between a skeletal element's macroscopic size and the microarchitecture within its cortical bone. In ageing research, it is more common for studies to evaluate histological geometric variables without adjusting for bone size, but this study will discuss the results using both the ‘raw’ data and the ‘adjusted’ data which takes into account the effect of bone size on the underlying histological features.
In the pooled sex sample, age only weakly affected OPD, osteon area, and Haversian canal area within all three bones, with the exception of a moderate increase in Haversian canal size within the rib. Even when bone robusticity was accounted for, the correlation of age with each of the three histological variables remained weak within the femur and humerus. These results are likely an effect of combining the sexes, as rates of bone remodelling are reported to differ between males and females (Abdullah et al., 2018; Ericksen, 1991). Descriptive statistics of the JCU sample show that females have larger mean osteon area in all three bones compared to males; however, the relatively small female sample size meant that significance between the sexes could not be reliably tested. Some studies have observed only weak sexual dimorphism in osteon area (Pfeiffer, 1998; Pfeiffer et al., 2006), while others reported that males had statistically significantly smaller osteons than females, attributable to greater body mass in males and the likelihood to have participated in more physically strenuous activities (Mulhern & van Gerven, 1997). Britz et al. (2009) also found an inverse relationship between body weight and osteon size, but they observed that Australian females have statistically significantly smaller osteons than males in the anterior midshaft of the femur, with menopause likely impacting the rate of remodelling in females (Cho & Stout, 2011). In this present study, female mean Haversian canal area is also larger in all three bones compared to males. The females are all over 67 years of age and would be post‐menopause. Estrogen deficiency causes an imbalance in bone metabolism and remodelling (Tobias & Compston, 1999), with greater bone resorption (Riggs, 2000), and an increased rate of cortical thinning (Seeman, 2013). The mean OPD is lower in females than males in the femur and humerus, but not the rib. Sexual dimorphism in hormones, diet, body mass, and genetics (Cho & Stout, 2011) would likely explain the different pattern of remodelling observed in sexes.
As there were only four females in the sample, the remainder of analyses was restricted to males who comprised three‐quarters of the sample. With increasing age, male femora showed a statistically significant increase in OPD as did Haversian canal area in the rib. This means that as males age, they generally accumulated more osteons in the femur compared to their humerus and rib. Vascular canals in the rib get larger as remodelling activity becomes out of balance and the filling of osteons is arrested (Pfeiffer et al., 2006). For a given loading environment, the rib is expected to be under the most metabolic influence, the femur minimal, and the humerus intermediate (Eleazer & Jankauskas, 2016). Minimal bending forces and dynamic loading are experienced by the rib (Robling & Stout, 2003) and at a rate that is relatively uniform across individuals (Bonicelli et al., 2022). These factors affect vascular porosity, visible in the form of larger Haversian canals and greater variability in size of the canals (Pfeiffer et al., 2006). On the other hand, the literature generally reports the femur to be placed under greater biomechanical loading (Ruff et al., 1991), causing locally intensified remodelling to aid microcrack repair (Wasserman et al., 2008). This generally constrains the size of vascular pores and more of the smaller osteons remodel the space (Miszkiewicz, 2016), generating a higher OPD. Alternatively, some studies report declined OPD in the femur compared to the rib which is under less mechanical strain and therefore is better able to reflect mineral homeostasis and hormonal responses (Skedros et al., 2013).
Males in the present study also showed a moderate positive relationship between age and OPD of the humerus along with a corresponding moderate inverse relationship with Haversian canal area in the humerus. Biomechanics affect the humerus to a lesser extent than the femur but this is still likely confounding the remodelling process (Skedros et al., 2013), whereby as the males age there is an accumulation of osteons in the humerus accompanied by smaller Haversian canals. Upper limb bones such as the humerus are typically non‐weightbearing, but muscle pull and strain from the wide range of motion in the arm and shoulder (Santos et al., 2018) subjects the limb to axial loading and bending and torsional forces (Trinkaus et al., 1994). Descriptive statistics (Table S1) show that the means for OPD, osteon area, and Haversian canal area are similar between the femur and humerus, but the rib is different. OPD in the rib tends to be higher and osteon and canal size lower compared to the long bones. This shows that the rib in the axial skeleton has a unique pattern of remodelling compared to the femora and humeri in the appendicular skeleton. Robusticity indices were used to account for the effect of bone size on remodelling rates (Miszkiewicz & Mahoney, 2019). In this study, the robusticity of the rib could not be accounted for as length and width measurements were not collected at the time of sampling. Adjusting for bone robusticity in the femora and humeri changed the strength of the relationships between age and the three histological variables in males, but the overall pattern of remodelling remained valid. OPD tended to increase with age, while the size of osteons and Haversian canals tended to decrease with age. With the effect of bone size removed, it appears that bone tissue in the femur and humerus has similar quality within one individual despite the leg and the arm being used in slightly different ways. The only statistically significant result was that Haversian canals were smaller in the humerus compared to the femur, whereas OPD and size of osteons were relatively similar between the long bones. This shows there is a tight anatomical relationship between bone macro‐ and microscopic size.
The mean age of the male sample in this present study was 82 years, with age at death ranging from 75 to 88 years; therefore, the results best represent elderly Australian males. Most age‐related cortical bone loss occurs after the age of 60 years (Seeman, 2013), with a decrease in vascular pore numbers corresponding with an increase in pore size (Bousson et al., 2001). Age‐related increase in pore size in older adults may be relatable to the coalescence of pre‐existing Haversian canals and new resorption cavities (Andreasen et al., 2020; Seeman, 2013). There is much individual variability, especially in the elderly who are at increased risk of metabolic bone diseases such as osteoporosis (Kulminski et al., 2006) and a lifestyle with less physical activity and reduced muscle mass (Cvecka et al., 2015). Increasing levels of physical inactivity and nutrient‐deficient diet in the elderly are regularly reported in clinical literature for their detrimental effects on bone health and interruption to remodelling processes (Bonjour et al., 2009). Additionally, many elderly seek therapeutic treatment for osteoporosis and metastatic bone diseases and cancers that deliberately target bone resorption and formation by inhibiting bone resorption and/or formation (Skjødt et al., 2019).
One male of 93 years age at death was removed from the male sample as their OPD counts made them a strong outlier. The remodelling in this individual's femur was unique compared to the other males. This individual has the lowest mean OPD count for the femur but also the largest mean osteon area (except for JCU 247/19, an 82‐year‐old male). Porosity in this individual's femur was more pronounced than the younger males. Their large resorption cavities had removed evidence of earlier osteons and therefore reduced the OPD count and interfered with osteon area measurements. The intact osteons are visibly smaller than the remnants of fragmentary osteons. This is consistent with studies that report osteon size decreasing with age (Dominguez & Agnew, 2016; Maggio & Franklin, 2021; Narasaki, 1990). Takahashi et al. (1965) made the point that the well‐documented decrease in osteon area could largely be due to an increased likelihood of the largest and most irregularly shaped osteons being remodelled, with only smaller intact osteons left to measure. This male also has one of the lowest OPD counts for the humerus and rib, compared to all the other males who are younger, and almost the lowest mean canal area in both the humerus and rib. A factor to consider is that the age of OPD asymptote may have been reached in at least one of the bones in this individual. Asymptomatic values indicate that the cortical bone has been completely remodelled, in which case any new secondary osteons will simply be replacing already remodelled bone that is saturated with fragmentary osteons (Frost, 1987a). This means that the mean annual OPD will not increase and will no longer correlate with age (Frost, 1987b). Fewer intact osteons with an uninterrupted cement line will remain to measure osteon area, and this issue is compounded by the narrowing of cortical bone with age, especially in the rib, which further decreases the number of intact and fragmentary osteons to count and measure (García‐Donas et al., 2021). The age at which asymptote occurs varies between bones depending on osteon size, bone turnover rate, and cortical area (Andronowski & Crowder, 2019). For example, asymptote is recorded to occur in the 5th or 6th decade of life in ribs at an OPD of 30/mm2 (Cho et al., 2002; Stout & Paine, 1994), likely due to the narrow cortical area being completely remodelled before the thicker and denser cortex of the femur (Frost, 1987a). Asymptote in the femoral midshaft is documented to be reached when OPD count is approximately 50–55/mm2, after the 8th decade of life (Gocha & Agnew, 2014). The sex and ancestry have an effect on bone remodelling and thus are likely to each have an effect on OPD asymptote but this requires further investigation on more genetically diverse populations to fully understand the correlation (Pfeiffer, 1992).
In the present study, males showed few statistically significant relationships between age and the three histological variables, and in the intraskeletal comparisons, but this still shows some potential for the use of histology in ageing research. However, even the non‐significant relationships have provided a useful account of the remodelling processes within this modern Australian sample. To summarise this present study, OPD in elderly males tended to increase with age within the femur and humerus but decline within the rib. This is most likely tied in with higher targeted mechanical loading placed on the posterior femur and anterior humerus, compared to the less strenuous but constant loading placed on ribs. This study suggests that research on the Australian population would benefit from focusing on the rib because it will not be as impacted by biomechanical stress as the femur and may therefore have greater potential for age estimation via histomorphometry. Osteon and canal size tended to decrease with age in the femur and humerus whereas they increased in the rib with advancing age, and this could be accounted by ribs experiencing greater porosity with age due to greater metabolic influences than the bones from the appendicular skeleton are subjected to. Differences in bone size, and therefore the amount of cortical bone area, may be confounding raw histology measurements. Accounting for bone size in males tended to weaken most of the relationships between age and histomorphometric values within the femur but tended to strengthen more of them within the humerus. Significantly smaller Haversian canals were observed in the humerus compared to the femur, whereas osteon and canal size were relatively similar between the two bones. These results support prior work on other populations which has shown that bone size has an underlying effect on its internal microarchitecture (Goldman et al., 2014; Miszkiewicz & Mahoney, 2019).
5. LIMITATIONS
The sampling was restricted by the scarcity of young adult and female donors. Differences between the sexes and between young and older adults could therefore not be examined. The age and sex biases reflect the nature of body donation for medical education and research within Australia. Studies have found that even when an individual expresses their willingness to donate, there are psychological (i.e., emotional), religious, cultural, or social factors that may hinder family members from providing final consent for body donation. Thus, this study does not reflect the full extent of histomorphometric variation in the Australian population. It is expected that as the JCUHSHC grows over time it will gradually gain more female and younger donors. Future studies can then build upon this study with a larger and more representative sample. Adjustments for robusticity could not include the rib, as the maximum length and midshaft circumference measurements were only obtained for the femur and humerus before bone samples were taken from the donors. Additionally, full shaft cross‐section area of the femur and the humerus could not be included in robusticity calculations as the ethics protocol stipulated minimally invasive sectioning and CT scanning was not possible on the bones immediately pre‐cremation. As the amount of research on the JCUHBHC increases, the sampling procedures will also be refined to include more measurements. It is well‐documented that genetics, health, metabolic processes, and biomechanical loading influence osteon geometric properties (Stout et al., 2019), and the effect of one may mask or mimic the effect of the other (Eleazer & Jankauskas, 2016). This information has not been collected from the donors who self‐report medical and personal information. Donors are not required to provide details such as occupation and physical activity levels, so it is difficult to determine how these are affecting interpretations of remodelling rates. It is possible that future ethics applications may be adjusted to allow for this data to be collected from donors.
6. CONCLUSION
The motivation for this study was to enhance the understanding of intra‐skeletal variation of cross‐sectional geometric properties, and in particular, how these properties correlate to age in a modern Australian sample. The sex and age biases in this sample mean that the results best measure cortical remodelling of elderly Australian males. This study confirms that bone size has an underlying effect on histology, changing the strength of the correlation with age. It is recommended that future studies in age estimation research should consider bone macro‐ and micro‐measurements together. With robusticity accounted for, the one statistically significant result in males (statistically significantly smaller Haversian canals in the humerus compared to femur) shows some potential for the use of histology in ageing research. This study suggests that the rib will not be as impacted by biomechanical stress as the femur and may therefore have greater potential for age estimation via histomorphometry.
AUTHOR CONTRIBUTIONS
LP: conceived the study, composed the overall question, background research, and wrote the manuscript, prepared the sample, conducted statistical tests, and interpreted the results; JM: provided expert advice on content and input into interpretation of the data and editing the manuscript, LC: provided expertise in sample preparation and laboratory procedures; AW provided critical review of the manuscript; KD: was responsible for conception and editing.
CONFLICT OF INTEREST STATEMENT
The authors have no conflicts of interest.
Supporting information
Figure S1.
Figure S2.
Figure S3.
Figure S4.
Table S1.
ACKNOWLEDGEMENTS
The authors thank the anatomy laboratory staff at the James Cook University College of Medicine and Dentistry for their assistance in the collection of bone samples used in this study. This research was supported by an Australian Government Research Training Program (RTP) Scholarship. Open access publishing facilitated by James Cook University, as part of the Wiley ‐ James Cook University agreement via the Council of Australian University Librarians.
Pedersen, L.T. , Miszkiewicz, J. , Cheah, L.C. , Willis, A. & Domett, K.M. (2024) Age‐dependent change and intraskeletal variability in secondary osteons of elderly Australians. Journal of Anatomy, 244, 1078–1092. Available from: 10.1111/joa.14010
DATA AVAILABILITY STATEMENT
The data that supports the findings of this study are available in the supplementary material of this article.
REFERENCES
- Abdullah, H. , Jamil, M.M.A. , Ambar, R. & Nor, F.M. (2018) Bone histology: a key for human sex determination after death. Journal of Physics: Conference Series, 1019, 012010. [Google Scholar]
- Ahlqvist, J. & Damsten, O. (1969) A modification of Kerley's method for the microscopic determination of age in human bone. Journal of Forensic Science, 14, 205–212. [PubMed] [Google Scholar]
- An, Y.H. , Moreira, P.L. , Kang, Q.K. & Gruber, H.E. (2003) Principles of embedding and common protocols. In: An, Y. & Martin, K.L. (Eds.) Handbook of histology methods for bone and cartilage. New York: Springer. [Google Scholar]
- Andreasen, C.M. , Bakalova, L.P. , Brüel, A. , Hauge, E.M. , Kiil, B.J. , Delaisse, J.M. et al. (2020) The generation of enlarged eroded pores upon existing intracortical canals is a major contributor to endocortical trabecularization. Bone, 130, 115–127. [DOI] [PubMed] [Google Scholar]
- Andronowski, J.M. & Crowder, C. (2019) Bone area histomorphometry. Journal of Forensic Sciences, 64, 486–493. [DOI] [PubMed] [Google Scholar]
- Bancroft, J.D. & Gamble, M. (Eds.). (2008) Theory and practice of histological techniques. New York: Churchill Livingstone: Elsevier Health Sciences. [Google Scholar]
- Bonicelli, A. , Kranioti, E.F. , Xhemali, B. , Arnold, E. & Zioupos, P. (2022) Assessing bone maturity: compositional and mechanical properties of rib cortical bone at different ages. Bone, 155, 116265. [DOI] [PubMed] [Google Scholar]
- Bonjour, J.‐P. , Benoit, V. , Pourchaire, O. , Ferry, M. , Rousseau, B. & Souberbielle, J.C. (2009) Inhibition of markers of bone resorption by consumption of vitamin D and calcium‐fortified soft plain cheese by institutionalised elderly women. British Journal of Nutrition, 102, 962–966. [DOI] [PubMed] [Google Scholar]
- Bousson, V. , Meunier, A. , Bergot, C. , Vicaut, É. , Rocha, M.A. , Morais, M.H. et al. (2001) Distribution of intracortical porosity in human midfemoral cortex by age and gender. Journal of Bone and Mineral Research, 16, 1308–1317. [DOI] [PubMed] [Google Scholar]
- Britz, H.M. , Thomas, C.D.L. , Clement, J.G. & Cooper, D.M.L. (2009) The relation of femoral osteon geometry to age, sex, height and weight. Bone, 45, 77–83. [DOI] [PubMed] [Google Scholar]
- Chan, A.H.W. , Crowder, C.M. & Rogers, T.L. (2007) Variation in cortical bone histology within the human femur and its impact on estimating age at death. American Journal of Physical Anthropology, 132, 80–88. [DOI] [PubMed] [Google Scholar]
- Cho, H. & Stout, S.D. (2011) Age‐associated bone loss and intraskeletal variability in the Imperial Romans. Journal of Anthropological Sciences, 89, 109–125. [DOI] [PubMed] [Google Scholar]
- Cho, H. , Stout, S.D. , Madsen, R.W. & Streeter, M.A. (2002) Population‐specific histological age‐estimating method: a model for known African‐American and European‐American skeletal remains. Journal of Forensic Science, 47, 12–18. [PubMed] [Google Scholar]
- Cole, M.E. , Stout, S.D. , Dominguez, V.M. & Agnew, A.M. (2022) Pore Extractor 2D: an ImageJ toolkit for quantifying cortical pore morphometry on histological bone images, with application to intraskeletal and regional patterning. American Journal of Biological Anthropology, 179, 365–385. [Google Scholar]
- Cooper, D.M. , Thomas, C.D.L. , Clement, J.G. , Turinsky, A.L. , Sensen, C.W. & Hallgrímsson, B. (2007) Age‐dependent change in the 3D structure of cortical porosity at the human femoral midshaft. Bone, 40, 957–965. [DOI] [PubMed] [Google Scholar]
- Crowder, C. & Dominguez, V. (2013) Estimation of age at death using cortical bone histomorphometry. Washington: US Department of Justice. National Institute of Justice, pp. 1–86. [Google Scholar]
- Crowder, C. , Dominguez, V.M. , Heinrich, J. , Pinto, D. & Mavroudas, S. (2022) Analysis of histomorphometric variables: proposal and validation of osteon definitions. Journal of Forensic Sciences, 67, 80–91. [DOI] [PubMed] [Google Scholar]
- Currey, J.D. (2003) The many adaptations of bone. Journal of Biomechanics, 36, 1487–1495. [DOI] [PubMed] [Google Scholar]
- Cvecka, J. , Tirpakova, V. , Sedliak, M. , Kern, H. , Mayr, W. & Hamar, D. (2015) Physical activity in elderly. European Journal of Translational Myology, 25, 249–252. [DOI] [PMC free article] [PubMed] [Google Scholar]
- Depuy, V. & Pappas, P.A. (2004) Perusing, choosing, and not mis‐using: non‐parametric vs. parametric tests in SAS. In: 17th North East SAS Users Group Conference, Baltimore, MD. pp. 1–5.
- Dominguez, V.M. & Agnew, A.M. (2016) Examination of factors potentially influencing osteon size in the human rib. The Anatomical Record, 299, 313–324. [DOI] [PubMed] [Google Scholar]
- Dominguez, V.M. , Harden, A.L. , Wascher, M. & Agnew, A.M. (2020) Rib variation at multiple locations and implications for histological age estimation. Journal of Forensic Sciences, 65, 2108–2111. [DOI] [PubMed] [Google Scholar]
- Eleazer, C.D. & Jankauskas, R. (2016) Mechanical and metabolic interactions in cortical bone development. American Journal of Physical Anthropology, 160, 317–333. [DOI] [PubMed] [Google Scholar]
- Ericksen, M.F. (1991) Histologic estimation of age at death using the anterior cortex of the femur. American Journal of Physical Anthropology, 84, 171–179. [DOI] [PubMed] [Google Scholar]
- Frost, H.M. (1987a) Secondary osteon population densities: an algorithm for estimating the missing osteons. American Journal of Physical Anthropology, 30, 239–254. [Google Scholar]
- Frost, H.M. (1987b) Secondary osteon populations: an algorithm for determining mean bone tissue age. American Journal of Physical Anthropology, 30, 221–238. [Google Scholar]
- García‐Donas, J.G. , Bonicelli, A. , Scholl, A.R. , Lill, C. , Paine, R.R. & Kranioti, E.F. (2021) Rib histomorphometry: a reliability and validation study with a critical review of histological techniques for forensic age estimation. Legal Medicine, 49, 1–35. [DOI] [PubMed] [Google Scholar]
- Gocha, T.P. & Agnew, A.M. (2014) Regional variation in osteon population density at the femoral midshaft—implications for the asymptote. Boston: AAPA Annual Conference. [Google Scholar]
- Gocha, T.P. & Agnew, A.M. (2016) Spatial variation in osteon population density at the human femoral midshaft: histomorphometric adaptations to habitual load environment. Journal of Anatomy, 228, 733–745. [DOI] [PMC free article] [PubMed] [Google Scholar]
- Gocha, T.P. , Robling, A.G. & Stout, S.D. (2019) Histomorphometry of human cortical bone: applications to age estimation. In: Katzenberg, M.A. & Grauer, A.L. (Eds.) Biological anthropology of the human skeleton, 3rd edition. Hoboken, NJ: John Wiley & Sons Inc. [Google Scholar]
- Goldman, H.M. , Hampson, N.A. , Guth, J.J. , Lin, D. & Jepsen, K.J. (2014) Intracortical remodeling parameters are associated with measures of bone robustness. The Anatomical Record, 297, 1817–1828. [DOI] [PMC free article] [PubMed] [Google Scholar]
- Hennig, C. , Thomas, C.D.L. , Clement, J.G. & Cooper, D.M. (2015) Does 3D orientation account for variation in osteon morphology assessed by 2D histology? Journal of Anatomy, 227, 497–505. [DOI] [PMC free article] [PubMed] [Google Scholar]
- Jepsen, K.J. , Bigelow, E.M. & Schlecht, S.H. (2015) Women build long bones with less cortical mass relative to body size and bone size compared with men. Clinical Orthopaedics and Related Research, 473, 2530–2539. [DOI] [PMC free article] [PubMed] [Google Scholar]
- Karydi, C. , García‐Donas, J.G. , Tsiminikaki, K. , Bonicelli, A. , Moraitis, K. & Kranioti, E.F. (2022) Estimation of age‐at‐death using cortical bone histomorphometry of the rib and femur: a validation study on a British population. Biology, 11, 1615. [DOI] [PMC free article] [PubMed] [Google Scholar]
- Kerley, E.R. (1965) The microscopic determination of age in human bone. American Journal of Physical Anthropology, 23, 149–163. [DOI] [PubMed] [Google Scholar]
- Khan, I. , Jamil, M. & Nor, F. (2017) Evaluation and reliability of bone histological age estimation methods. Journal of Fundamental and Applied Sciences, 9, 663–680. [Google Scholar]
- Kulminski, A. , Yashin, A. , Ukraintseva, S. , Akushevich, I. , Arbeev, K. , Land, K. et al. (2006) Accumulation of health disorders as a systemic measure of aging: findings from the NLTCS data. Mechanisms of Ageing and Development, 127, 840–848. [DOI] [PMC free article] [PubMed] [Google Scholar]
- Maat, G.J.R. , Maes, A. , Aarents, M.J. & Nagelkerke, N.J.D. (2006) Histological age prediction from the femur in a contemporary Dutch sample: the decrease of nonremodeled bone in the anterior cortex. Journal of Forensic Sciences, 51, 230–237. [DOI] [PubMed] [Google Scholar]
- Maggiano, I.S. , Maggiano, C.M. , Clement, J.G. , Thomas, C.D.L. , Carter, Y. & Cooper, D.M.L. (2016) Three‐dimensional reconstruction of Haversian systems in human cortical bone using synchrotron radiation‐based micro‐CT: morphology and quantification of branching and transverse connections across age. Journal of Anatomy, 228, 719–732. [DOI] [PMC free article] [PubMed] [Google Scholar]
- Maggio, A. & Franklin, D. (2021) An examination of histomorphometric relationships in the anterior and posterior human femoral cortex. Journal of Bone and Mineral Metabolism, 39, 649–660. [DOI] [PubMed] [Google Scholar]
- Mayhew, P.M. , Thomas, C.D. , Clement, J.G. , Loveridge, N. , Beck, T.J. , Bonfield, W. et al. (2005) Relation between age, femoral neck cortical stability, and hip fracture risk. The Lancet, 366, 129–135. [DOI] [PubMed] [Google Scholar]
- Mays, S. , Elders, J. , Humphrey, L. , White, W. & Marshall, P. (2013) Science and the dead: a guideline for the destructive sampling of archaeological human remains for scientific analysis. Advisory Panel on the Archaeology of Burials in England. Swindon: English Heritage. [Google Scholar]
- Miszkiewicz, J.J. (2016) Investigating histomorphometric relationships at the human femoral midshaft in a biomechanical context. Journal of Bone and Mineral Metabolism, 34, 179–192. [DOI] [PubMed] [Google Scholar]
- Miszkiewicz, J.J. & Mahoney, P. (2019) Histomorphometry and cortical robusticity of the adult human femur. Journal of Bone and Mineral Metabolism, 37, 90–104. [DOI] [PubMed] [Google Scholar]
- Mulhern, D.M. & van Gerven, D.P. (1997) Patterns of femoral bone remodeling dynamics in a medieval Nubian population. American Journal of Physical Anthropology: The Official Publication of the American Association of Physical Anthropologists, 104, 133–146. [DOI] [PubMed] [Google Scholar]
- Narasaki, S. (1990) Estimation of age at death by femoral osteon remodeling: application of Thompson's core technique to modern Japanese. Journal of the Anthropological Society of Nippon, 98, 29–38. [Google Scholar]
- Pfeiffer, S. (1992) Cortical bone age estimates from historically known adults. Zeitschrift für Morphologie und Anthropologie, 79, 1–10. [PubMed] [Google Scholar]
- Pfeiffer, S. (1998) Variability in osteon size in recent human populations. American Journal of Physical Anthropology: The Official Publication of the American Association of Physical Anthropologists, 106, 219–227. [DOI] [PubMed] [Google Scholar]
- Pfeiffer, S. , Crowder, C. , Harrington, L. & Brown, M. (2006) Secondary osteon and Haversian canal dimensions as behavioral indicators. American Journal of Physical Anthropology, 131, 460–468. [DOI] [PubMed] [Google Scholar]
- Ries, W.L. (2003) Techniques for sectioning undecalcified bone tissue using microtomes. In: An, Y.H. & Martin, K.L. (Eds.) Handbook of histology methods for bone and cartilage. New York: Springer. [Google Scholar]
- Riggs, B.L. (2000) The mechanisms of estrogen regulation of bone resorption. The Journal of Clinical Investigation, 106, 1203–1204. [DOI] [PMC free article] [PubMed] [Google Scholar]
- Robling, A.G. & Stout, S.D. (2003) Histomorphology, geometry, and mechanical loading in past populations. In: Agarwal, S.C. & Stout, S.D. (Eds.) Bone loss and osteoporosis: an anthropological perspective. Boston, MA: Springer. [Google Scholar]
- Ruff, C.B. , Scott, W.W. & Liu, A.Y.C. (1991) Articular and diaphyseal remodeling of the proximal femur with changes in body mass in adults. American Journal of Physical Anthropology, 86, 397–413. [DOI] [PubMed] [Google Scholar]
- Ruff, C.B. , Trinkaus, E. , Walker, A. & Larsen, C.S. (1993) Postcranial robusticity in Homo. I: temporal trends and mechanical interpretation. American Journal of Physical Anthropology, 91, 21–53. [DOI] [PubMed] [Google Scholar]
- Santos, B. , Quental, C. , Folgado, J. , Sarmento, M. & Monteiro, J. (2018) Bone remodelling of the humerus after a resurfacing and a stemless shoulder arthroplasty. Clinical Biomechanics, 59, 78–84. [DOI] [PubMed] [Google Scholar]
- Schindelin, J. , Rueden, C.T. , Hiner, M.C. & Eliceiri, K.W. (2015) The ImageJ ecosystem: an open platform for biomedical image analysis. Molecular Reproduction and Development, 82, 518–529. [DOI] [PMC free article] [PubMed] [Google Scholar]
- Seeman, E. (2013) Age‐and menopause‐related bone loss compromise cortical and trabecular microstructure. The Journals of Gerontology Series A: Biological Sciences and Medical Sciences, 68, 1218–1225. [DOI] [PubMed] [Google Scholar]
- Skedros, J.G. , Knight, A.N. , Clark, G.C. , Crowder, C.M. , Dominguez, V.M. , Qiu, S. et al. (2013) Scaling of Haversian canal surface area to secondary osteon bone volume in ribs and limb bones. American Journal of Physical Anthropology, 151, 230–244. [DOI] [PubMed] [Google Scholar]
- Skjødt, M.K. , Frost, M. & Abrahamsen, B. (2019) Side effects of drugs for osteoporosis and metastatic bone disease. British Journal of Clinical Pharmacology, 85, 1063–1071. [DOI] [PMC free article] [PubMed] [Google Scholar]
- Stein, M. , Feik, S. , Thomas, C. , Clement, J. & Wark, J. (1999) An automated analysis of intracortical porosity in human femoral bone across age. Journal of Bone and Mineral Research, 14, 624–632. [DOI] [PubMed] [Google Scholar]
- Stewart, T.J. , Louys, J. & Miszkiewicz, J.J. (2021) Intra‐skeletal vascular density in a bipedal hopping macropod with implications for analyses of rib histology. Anatomical Science International, 96, 386–399. [DOI] [PubMed] [Google Scholar]
- Stout, S.D. , Cole, M.E. & Agnew, A.M. (2019) Histomorphology: deciphering the metabolic record. In: Buikstra, J.E. (Ed.) Ortner's identification of pathological conditions in human skeletal remains, 3rd edition. London: Elsevier. [Google Scholar]
- Stout, S.D. & Crowder, C. (2012) Bone remodeling, histomorphology, and histomorphometry. In: Crowder, C. & Stout, S. (Eds.) Bone histology: an anthropological perspective. Boca Raton, FL: CRC Press. [Google Scholar]
- Stout, S.D. & Paine, R.R. (1992) Histological age estimation using rib and clavicle. American Journal of Physical Anthropology, 87, 111–115. [DOI] [PubMed] [Google Scholar]
- Stout, S.D. & Paine, R.R. (1994) Bone remodeling rates: a test of an algorithm for estimating missing osteons. American Journal of Physical Anthropology, 93, 123–129. [DOI] [PubMed] [Google Scholar]
- Sumner, D. & Andriacchi, T. (1996) Adaptation to differential loading: comparison of growth‐related changes in cross‐sectional properties of the human femur and humerus. Bone, 19, 121–126. [DOI] [PubMed] [Google Scholar]
- Takahashi, H. , Epker, B. & Frost, H. (1965) Relation between age and size of osteons in man. Henry Ford Hospital Medical Journal, 13, 25–31. [Google Scholar]
- Taylor, R. (1990) Interpretation of the correlation coefficient: a basic review. Journal of Diagnostic Medial Sonography, 6, 35–39. [Google Scholar]
- Thomas, C.D.L. & Clement, J.G. (2011) The Melbourne femur collection: how a forensic and anthropological collection came to have broader applications. In: Stout, S. & Crowder, C. (Eds.) Bone histology. Boca Raton: CRC Press. [Google Scholar]
- Tobias, J. & Compston, J. (1999) Does estrogen stimulate osteoblast function in postmenopausal women? Bone, 24, 121–124. [DOI] [PubMed] [Google Scholar]
- Trinkaus, E. , Churchill, S.E. & Ruff, C.B. (1994) Postcranial robusticity in Homo. II: humeral bilateral asymmetry and bone plasticity. American Journal of Physical Anthropology, 93, 1–34. [DOI] [PubMed] [Google Scholar]
- Uhre, M.‐L. , Eriksen, A.M. , Simonsen, K.P. , Rasmussen, A.R. , Hjort, B.B. & Lynnerup, N. (2015) Enzymatic maceration of bone: a gentler technique than boiling. Medicine, Science and the Law, 55, 90–96. [DOI] [PubMed] [Google Scholar]
- Villa, C. & Lynnerup, N. (2010) Technical note: a stereological analysis of the cross‐sectional variability of the femoral osteon population. American Journal of Physical Anthropology, 142, 491–496. [DOI] [PubMed] [Google Scholar]
- Wasserman, N. , Brydges, B. , Searles, S. & Akkus, O. (2008) In vivo linear microcracks of human femoral cortical bone remain parallel to osteons during aging. Bone, 43, 856–861. [DOI] [PubMed] [Google Scholar]
- Yoshino, M. , Imaizumi, K. , Miyasaka, S. & Seta, S. (1994) Histological estimation of age at death using microradiographs of humeral compact bone. Forensic Science International, 64, 191–198. [DOI] [PubMed] [Google Scholar]
Associated Data
This section collects any data citations, data availability statements, or supplementary materials included in this article.
Supplementary Materials
Figure S1.
Figure S2.
Figure S3.
Figure S4.
Table S1.
Data Availability Statement
The data that supports the findings of this study are available in the supplementary material of this article.