Abstract
Background
A controlled human infection model for assessing tuberculosis (TB) immunity can accelerate new vaccine development.
Methods
In this phase 1 dose escalation trial, 92 healthy adults received a single intradermal injection of 2 × 10⁶ to 16 × 106 colony-forming units of Bacillus Calmette-Guérin (BCG). The primary endpoints were safety and BCG shedding as measured by quantitative polymerase chain reaction, colony-forming unit plating, and MGIT BACTEC culture.
Results
Doses up to 8 × 10⁶ were safe, and there was evidence for increased BCG shedding with dose escalation. The MGIT time-to-positivity assay was the most consistent and precise measure of shedding. Power analyses indicated that 10% differences in MGIT time to positivity (area under the curve) could be detected in small cohorts (n = 30). Potential biomarkers of mycobacterial immunity were identified that correlated with shedding. Transcriptomic analysis uncovered dose- and time-dependent effects of BCG challenge and identified a putative transcriptional TB protective signature. Furthermore, we identified immunologic and transcriptomal differences that could represent an immune component underlying the observed higher rate of TB disease incidence in males.
Conclusions
The safety, reactogenicity, and immunogenicity profiles indicate that this BCG human challenge model is feasible for assessing in vivo TB immunity and could facilitate the vaccine development process.
Clinical Trials Registration
Keywords: BCG, controlled human infection model (CMIM), immunity, tuberculosis, vaccine
Presented are results from an open-label dose escalation human Bacillus Calmette-Guérin challenge study. The combined results indicate that this human challenge model is a feasible approach for assessing in vivo tuberculosis immunity and could facilitate the vaccine development process.
Despite intensive efforts in prevention and control, tuberculosis (TB) remains a formidable public health challenge [1, 2]. The current TB vaccine—live attenuated Mycobacterium bovis strain Bacillus Calmette-Guérin (BCG)—is the most widely used vaccine in history, with >4 billion doses administered since 1921 [2]. BCG is routinely administered to neonates to reduce the risk of TB meningitis, disseminated disease, and death [3, 4]. However, BCG vaccine efficacy against pulmonary TB is highly variable and often wanes over time, affording little to no protection in adults [5].
Several vaccine candidates have shown promise, and many more are in the pipeline [6, 7]. However, the barriers for vaccine development are significant [8]. Controlled human infection models (CHIMs) have the potential to revolutionize vaccine development by enabling researchers to quickly evaluate new candidates in a relatively small number of participants. By incorporating CHIMs early on, critical data are obtained to inform development that ultimately accelerates and derisks the process. In short, human participants are intentionally challenged with an infectious organism in a controlled setting and monitored over time for a variety of clinical outcomes and immunologic endpoints. CHIMs have been instrumental in bringing several vaccines to licensure [9–11].
CHIM studies may be particularly advantageous for TB vaccine development since animal models fail to accurately recapitulate disease and the human immunologic correlates of protection have not been defined. However, deliberately infecting healthy participants with virulent Mycobacterium tuberculosis (Mtb) is unethical; thus, alternative approaches must be employed [12, 13]. Two TB human challenge models have been studied by using BCG as a surrogate for Mtb infection. Yet, these models use invasive pulmonary procedures or cutaneous punch biopsies [13, 14], are not amenable to serially sampling participants, and provide only a snapshot of the immunologic underpinnings of vaccinations. To address these limitations, we describe a TB CHIM using BCG shedding at the vaccination site as an inverse surrogate for levels of Mtb immunity present during infection, with the potential for estimating early efficacy of novel TB vaccines.
METHODS
Study NCT01868464 was approved by the institutional review boards of Saint Louis University and Emory University and carried out according to the principles of the Declaration of Helsinki. Participants were fully informed of study procedures, and they provided written consent. BCG-naive, healthy, male and nonpregnant females aged 18 to 45 years were enrolled in an open-label study (Supplementary Figure 1A). Those with latent Mtb infections (ie, positive interferon γ [IFN-γ] release assays) were excluded. Participants received a single intradermal injection of BCG TICE containing ∼2 × 10⁶ colony-forming units (CFUs; a standard intradermal BCG maximal dose used with many strains worldwide), 4 × 10⁶, 8 × 10⁶, or 16 × 106 (Supplementary Figure 1B). All participants returned to the research clinics after BCG administration for assessment between days 4 and 181. Swabs from the BCG challenge site and peripheral blood samples were collected to determine mycobacterial loads as well as immune and transcriptomic responses. Full methods are detailed in Supplementary Methods.
RESULTS
Safety and Reactogenicity of the CHIM for TB
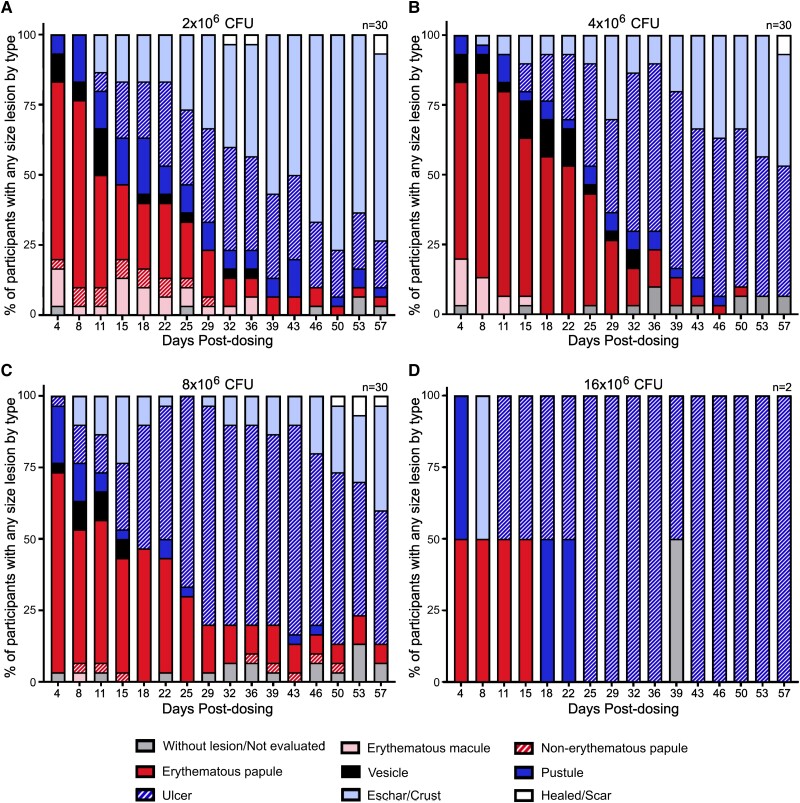
To assess the feasibility of our human challenge model, 92 healthy adults were challenged with BCG TICE intradermally (Supplementary Figure 1A). Participants in the first dose group were administered a single dose of 2 × 10⁶ CFUs of BCG; then, the doses were doubled sequentially to a maximum of 16 × 106 CFUs following assessment of safety and reactogenicity data from previous dose groups and sentinels (Supplementary Figure 1B). No treatment-related serious adverse events occurred. In general, challenge with up to 8 × 10⁶ CFUs of BCG was well tolerated. Furthermore, severe lymphadenopathy, osteomyelitis, and disseminated infection were not observed. All mycobacterial blood cultures collected on days 3 and 7 were negative, except for a single transiently positive result on day 3. As shown in Figure 1, all participants developed injection site erythema, induration, and pain or tenderness, and most developed the expected local site ulcerations similar to those observed in previous trials [15, 16]. Systemic reactions were mostly mild to moderate. Only 9 of 92 participants (<10%) reported grade 3 injection site solicited adverse events, which increased in frequency with dose escalation. One volunteer in the 4 × 10⁶ CFU group experienced at least 1 severe systemic solicited adverse events (fever >39 °C; Supplementary Figure 2). The 16 × 106 CFU group was terminated after 2 sentinel participants exhibited levels of reactogenicity considered unacceptable by the study team and Data Safety Monitoring Committee (and independent safety monitor), which included severe injection site pain and the formation of deep ulcers (Figure 1D). Together, these data indicate that up to 8 × 10⁶ CFUs can be safely administered.
Figure 1.
Central lesion type by day postdosing (days 4–57). Lesions were assessed in participants who received (A) 2 × 10⁶, (B) 4 × 10⁶, (C) 8 × 10⁶, or (D) 16 × 106 CFUs of Bacillus Calmette-Guérin at each study visit postdosing. CFU, colony-forming unit.
BCG Shedding Is Positively Correlated With BCG Challenge Dose
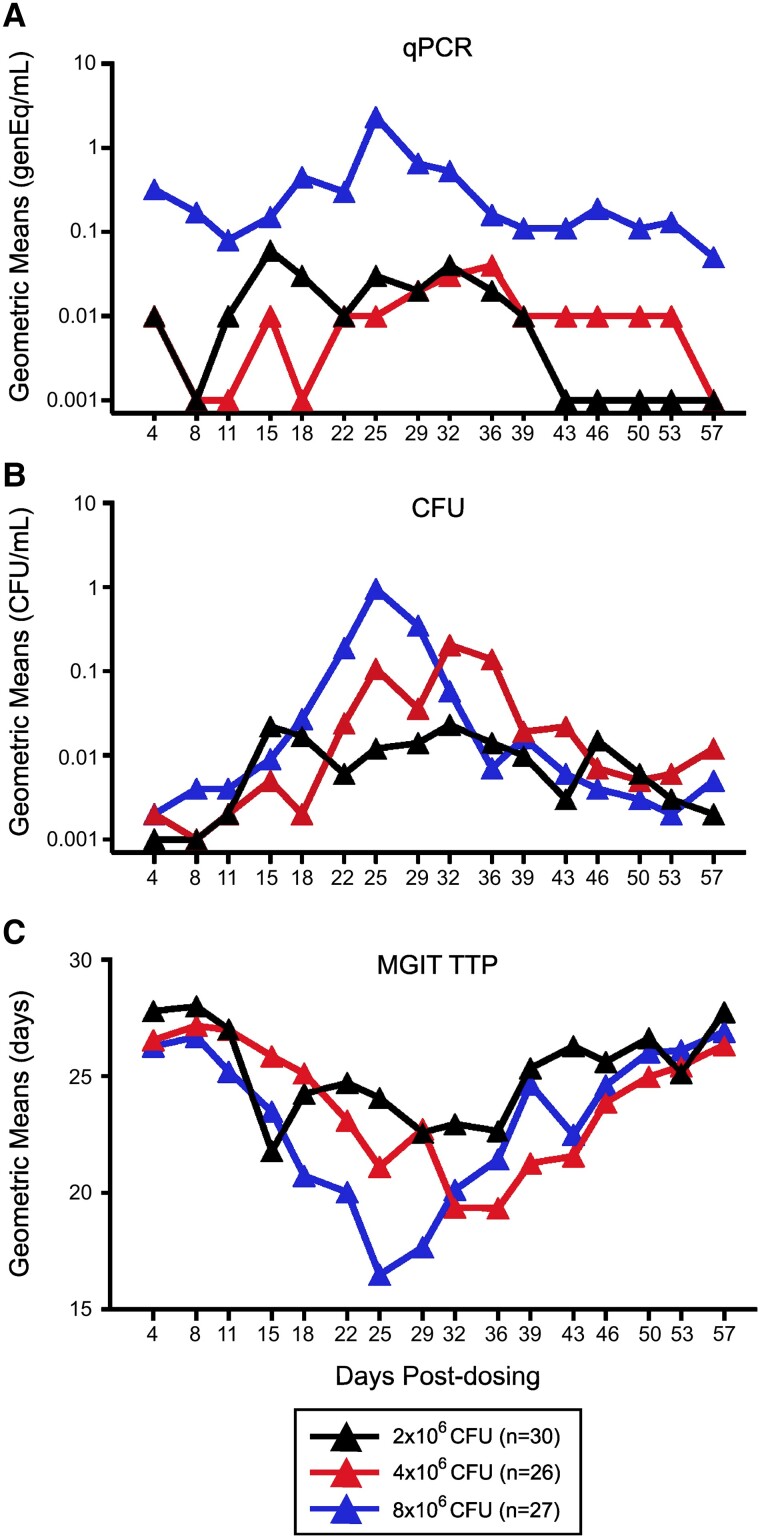
We previously demonstrated that the size of ulcers or erythema did not correlate with immunogenicity but that duration of ulcers was inversely correlated with immunogenicity [15]. Here, we quantified BCG shedding with 3 assays: quantitative polymerase chain reaction (PCR), CFU plating, and MGIT time to positivity (TTP). As expected, BCG shedding increased over time and then decreased to baseline as lesions resolved (Figures 1 and 2). In addition, there was evidence for increased mean shedding with dose escalation in all 3 assays. While all shedding endpoint analyses gave similar results, the MGIT TTP was the most consistent and precise (coefficient of variation <8%; Supplementary Table 1). Pairwise assay correlations showed positive correlations between CFUs and PCR and negative correlations between CFUs or PCR and MGIT, as expected. The strongest correlations were observed between MGIT and CFUs: r = –0.6894 for 2 × 10⁶ CFUs of BCG, r = –0.7107 for 4 × 10⁶, and r = –0.7647 for 8 × 10⁶. In general, the highest correlations (≥80%) were observed between days 11 and 22 across all dose groups.
Figure 2.
BCG shedding at the challenge site is positively correlated with dose escalation. Participants (n = 83) were enrolled and received 2 × 10⁶ (black), 4 × 10⁶ (red), or 8 × 10⁶ (blue) CFUs of BCG intradermally on day 1. BCG shedding at the challenge site was assessed by (A) qPCR, (B) CFUs, or (C) MGIT TTP, and results from all swab specimen cultures are presented as geometric means over time. BCG, Bacillus Calmette-Guérin; CFU, colony-forming unit; qPCR, quantitative polymerase chain reaction; TTP, time to positivity.
Several analytic methods were employed to compare shedding among dose groups, including analyses of peak shedding, proportion shedding, and area under the curve (AUC) over the total shedding between 4 and 57 days postchallenge (Figure 2 and data not shown). Of the 3 methods, AUC analyses were the most consistent in demonstrating a dose escalation effect, likely due to its ability to capture the total pattern of BCG shedding. This contrasts with measures at a single time point or dichotomous data, which do not reflect either the total shedding or the overall magnitude of the response.
BCG Challenge Uncovers Serum Biomarkers for Mycobacterial Immunity
To determine whether BCG challenge induced inflammatory responses that are associated with BCG shedding, we quantified 23 inflammatory markers in the serum. Multiple significant geometric mean fold rises (GMFRs) were detected in erythrocyte sedimentation rate (ESR) and C-reactive protein (CRP) as compared with baseline, with day 4 postchallenge having the most consistent increases (Supplementary Table 2). ESR and CRP were reproducibly increased, suggesting that these inflammatory markers detectable in whole blood may be useful as more simplified endpoints in assessing in vivo immunity. For the 21 inflammatory cytokines analyzed in the serum, the only significant GMFR increases detected were IFN-inducible T-cell α chemoattractant and monocyte chemoattractant protein 1α. However, the magnitude of these increases was small (GMFR ≤1.222) and not observed in all volunteer groups, suggesting that these inflammatory cytokines are unlikely to be useful for detection of BCG challenge–induced inflammation (Supplementary Table 2).
To test whether serum inflammatory responses could be used as biomarkers of mycobacterial immunity, we analyzed the correlations between serum inflammatory markers and BCG shedding AUC. Despite the significant increases in the GMFR for ESR and CRP (Supplementary Table 2), these increases did not correlate with BCG shedding endpoints (Supplementary Table 3). Therefore, ESR and CRP may lack the fidelity to identify significant differences in BCG shedding in CHIM studies. There were correlations among interleukins 2, 6, and 8. For example, at the 4 × 10⁶ dose, levels of interleukin 8 in the serum were positively correlated (r = 0.439, P = .025) with the PCR AUC, indicating that the cytokine may be a useful marker for in vivo pathogen load (Supplementary Table 3). In contrast, at the 8 × 10⁶ dose, levels of interleukins 2 and 6 in the serum were negatively correlated with the CFU AUC (interleukin 6: r = –0.383, P = .049). These results suggest that these latter cytokines may be markers of protective immunity.
IFN-γ Levels Are Positively Correlated With BCG Shedding
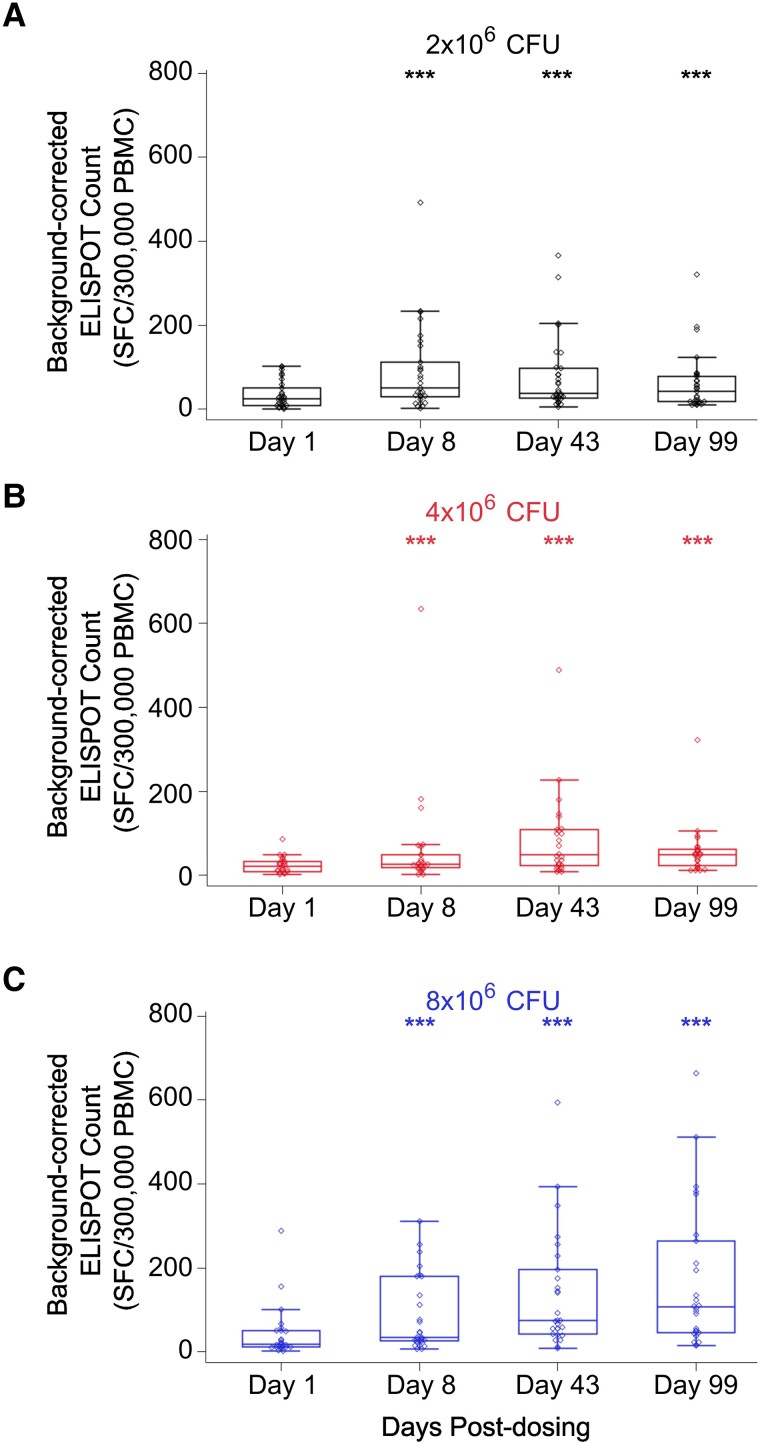
IFN-γ is known to protect against Mtb and has been used as a readout to evaluate the immunogenicity of new vaccine candidates [16]. However, there is increasing evidence that discrete levels of IFN-γ are not tightly correlated with protective TB immunity [16]. We stimulated peripheral blood mononuclear cells with Mtb lysate, Mtb culture filtrate, and live BCG in IFN-γ ELISPOT assays. IFN-γ responses were significantly increased postchallenge in a dose-dependent fashion (Figure 3 and Supplementary Table 4). The PCR AUC showed stronger correlations with IFN-γ response than either the MGIT TTP AUC or the CFU AUC, suggesting that nonviable organisms detectable only by PCR may contribute significantly to the magnitude of induction of IFN-γ–producing T cells. Yet, our data indicate that the levels of IFN-γ and BCG shedding, as measured by the MGIT TTP AUC, were negatively correlated. These results indicate that in our model, IFN-γ levels alone do not predict protective immunity capable of suppressing in vivo replication during a primary BCG response.
Figure 3.
IFN-γ levels are positively correlated with increased doses of BCG intradermal challenge. PBMCs were harvested from patients challenged with (A) 2 × 10⁶ (black), (B) 4 × 10⁶ (red), or (C) 8 × 10⁶ (blue) CFUs of BCG, and the level of IFN-γ was quantified via ELISPOT assay following stimulation with Mycobacterium tuberculosis lysate. Open circles represent outliers. Boxes indicate the 25th and 75th percentiles, with the center line indicating the median. Whiskers extend to the 2.5th and 97.5th percentiles. ***P < .001: statistically significant change from baseline (Wilcoxon signed rank test). BCG, Bacillus Calmette-Guérin; CFU, colony-forming unit; IFN-γ, interferon γ; PBMC, peripheral blood mononuclear cell; SFC, spot-forming cell.
BCG Challenge Model Is a Feasible Approach to Assess TB Immunity
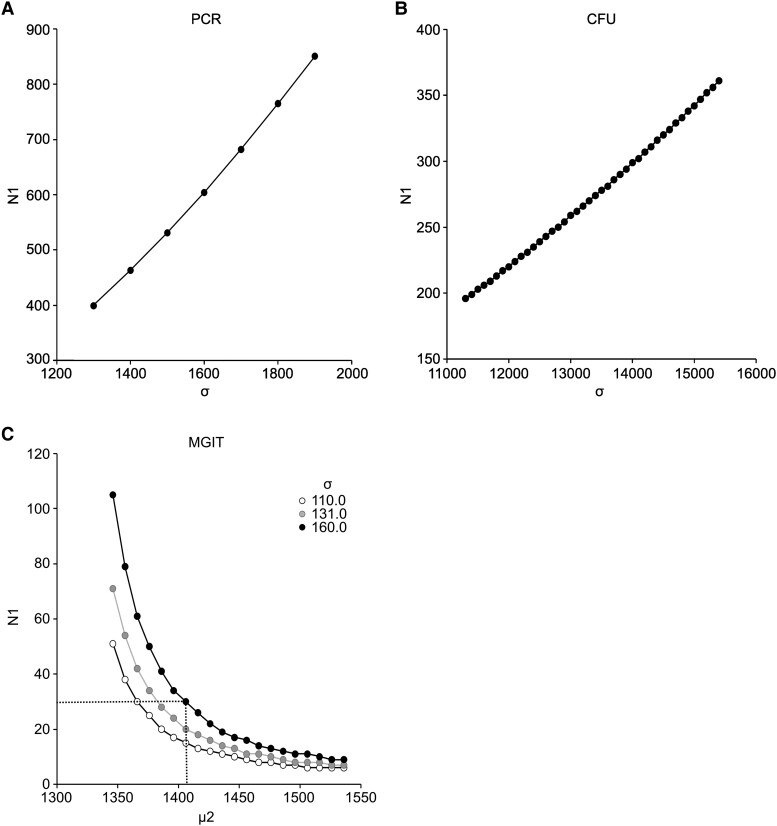
To evaluate the feasibility of this CHIM for studies of in vivo immunity induced by experimental TB vaccines, we performed power calculations to determine whether a 50% reduction in the AUC of BCG shedding could be identified between the vaccine and placebo groups. Based on the assumption that future studies should be able to detect a 50% reduction in PCR AUC by day 57 postchallenge (80% power and α = .05), with equal variances in the placebo and vaccination groups and a 1:1 allocation ratio, ≥400 participants per group would be required (Figure 4A). Similarly, ≥200 participants per group would be required for the CFU AUC endpoint (Figure 4B). However, MGIT TTP AUC days 4 to 57 had less variance than either the PCR or CFU assay (Supplementary Table 1), and power curves were generated by nonparametric Wilcoxon–Mann-Whitney tests, assuming an equal SD between groups for a range of treatment effects (Figure 4C). Based on the assumption of a large SD (σ = 160), only 30 participants per group would be required to detect a MGIT AUC 10% treatment effect (Figure 4C, dotted line). Together, these data indicate that the MGIT TTP AUC at the day 57 endpoint could be used to detect significant reductions in BCG shedding by comparing different groups of 30 participants receiving different vaccines.
Figure 4.
Sample sizes required for implementation of BCG challenge model. Power analyses were performed to determine a reduction in the AUC of BCG shedding at day 57 postchallenge in participants who received an experimental tuberculosis vaccine vs placebo with a 1:1 allocation ratio, 80% power, and 2-sided α = .05. For (A) PCR and (B) CFU assays, the means were calculated for a 50% reduction in BCG shedding, with the number of participants per group calculated as >500 and >250, respectively. For the (C) MGIT assay, a 5%–20% increase in mean AUC was assumed (range, 1346–1538). Based on the AUC, the minimum number of participants per group needed to detect a 10% change in TTP was 30. Notations: σ = SD, N1 = sample size, µ1 = mean AUC for placebo group, µ2 = mean AUC for vaccinated group. AUC, area under the curve; BCG, Bacillus Calmette-Guérin; CFU, colony-forming unit; PCR, polymerase chain reaction; TTP, time to positivity.
BCG Challenge Model Identifies Genes Correlated With BCG Shedding
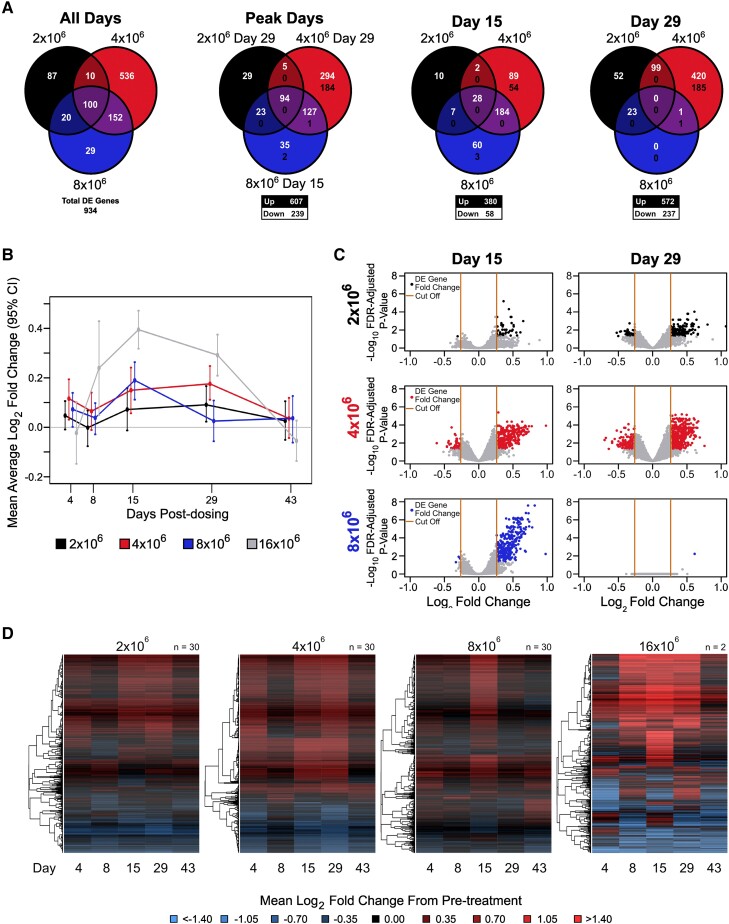
To identify potential gene expression biomarkers of TB immunity, we analyzed whole blood transcriptomic responses on days 1 (prevaccination), 4, 8, 15, 29, and 43. We found 934 genes differentially expressed (DE; at least 1.2-fold change and false discovery rate–adjusted P < .05) at ≥1 time point for ≥1 challenge group (Figure 5A, Supplementary Tables 5–8). Inspection of overall mean fold changes per group for these 934 genes showed that higher-challenge doses resulted in earlier peak mean log2 fold change responses (day 15 peak for 16 × 106 and 8 × 10⁶ CFU groups; day 29 peak for 4 × 10⁶ and 2 × 10⁶ CFU groups; Figure 5A–C). All groups returned to prechallenge levels by day 43 (Figure 5B and 5D and Supplementary Figure 3).
Figure 5.
Transcriptomic analysis uncovers dose- and time-dependent effects of Bacillus Calmette-Guérin challenge. A, Overlap in DE genes between challenge groups. The first panel shows overlap among a union of DE genes across all challenge groups and posttreatment days. The second panel shows overlap in the DE genes at peak response days for each challenge group. The final 2 panels show the overlap in DE genes on days 15 and 29 among the challenge groups. The numbers in white (top) and black (bottom) indicate the number of up- and downregulated genes, respectively. B, Time trend summarizing the mean log2 fold change by challenge group relative to prechallenge for DE genes identified at any time point. Error bars indicate 95% CIs of the mean based on 1000 bootstrap replicates. C, Fold change by statistical significance when days 15 and 29 are compared with prechallenge. The y-axis represents the log10-adjusted P value and the x-axis the log2 fold change for the challenge effect. The black (2 × 10⁶), red (4 × 10⁶), and blue (8 × 10⁶) dots represent DE genes. Orange lines indicate the fold change cutoff of 1.5-fold up/down. D, Log2 fold change from pretreatment among DE genes identified across posttreatment days for each dosage group. Rows represent DE genes. Columns represent mean log2 fold change at a posttreatment day. Red, upregulated vs pretreatment; blue, downregulated vs pretreatment. Dendrograms were obtained with complete linkage clustering of uncentered pairwise Pearson correlation distances between log2 fold changes. DE, differentially expressed; FDR, false discovery rate.
On day 4, DE genes from the 4 × 10⁶ and 8 × 10⁶ CFU BCG challenge groups were enriched in innate immune response pathways, including defense responses to virus, type I interferon (Gene Ontology), and IFN-α/β signaling pathways (Reactome; Supplementary Tables 9–11). The strongest pathway-wide signals were the hydrogen peroxide catabolic and metabolic pathways, leukocyte migration, phagocytosis, and mitophagy, which are all important pathogen elimination processes (Supplementary Figure 2). Many of the hydrogen peroxide–related pathways showed a dose response with earlier peak activation in the higher challenge doses (Supplementary Figure 4). Activation of neutrophils, coagulation/complement cascades, and platelets were also strongly induced across BCG challenge doses.
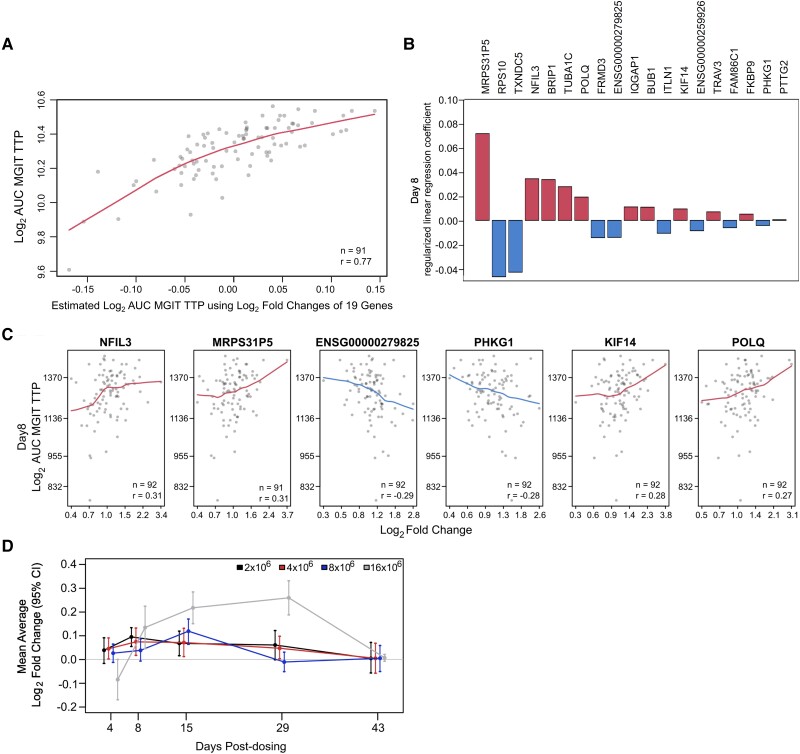
Our studies of correlations between DE genes and BCG shedding responses identified some potential biomarkers of human responses capable of controlling in vivo mycobacterial replication. Using elastic net–regularized linear regression, we identified a subset of gene expression responses among the 934 DE genes that best predicted mycobacterial shedding. The best-fitting model based on the explained proportion of variance was identified for MGIT TTP AUC results when changes of 19 genes at day 8 were compared with prechallenge (Figure 6, Supplementary Figure 5, and Supplementary Table 12). Correlates with reduced AUC included changes in NFIL3 (activator of T-cell interleukin 3 production), TRAV3 (increased with T-cell activation), and FKBP9 (important for protein folding responses and T-cell proliferation), as well as cell cycle genes BUB1, KIF14, and TUBA1C and a mitochondrial RNA gene (MRPS31P5; Figure 6B and 6C). These findings indicated that early T-cell activation is important for control of in vivo mycobacterial replication after BCG challenge. Time trend analysis of these 19 genes indicated that timing to peak gene expression response was inversely related to challenge dose (Figure 6D). This gene expression signature of protection will need to be validated with future cohorts.
Figure 6.
Combination of gene responses that best predicted peak log2 AUC MGIT TTP at day 8. A, Correlations between actual and estimated log2 AUC MGIT TTP according to log2 fold changes of the 19 genes identified by regularized linear regression. B, Regularized linear regression coefficients of the best model for each of the 19 genes. C, Individual gene associations between peak log2 AUC MGIT TTP and gene log2 fold change, including locally weighted smoothing trend lines and Pearson correlation coefficients for the top 6 correlating genes. D, Time trend summarizing the mean log2 fold change by challenge group relative to prechallenge for the 19 DE genes that best predicted peak log2 AUC MGIT TTP at day 8. Error bars indicate 95% CIs of the mean based on 1000 bootstrap replicates. AUC, area under the curve; DE, differentially expressed; TTP, time to positivity.
BCG Challenge Model Identifies Immunogenicity and Transcriptomal Differences Between Sexes
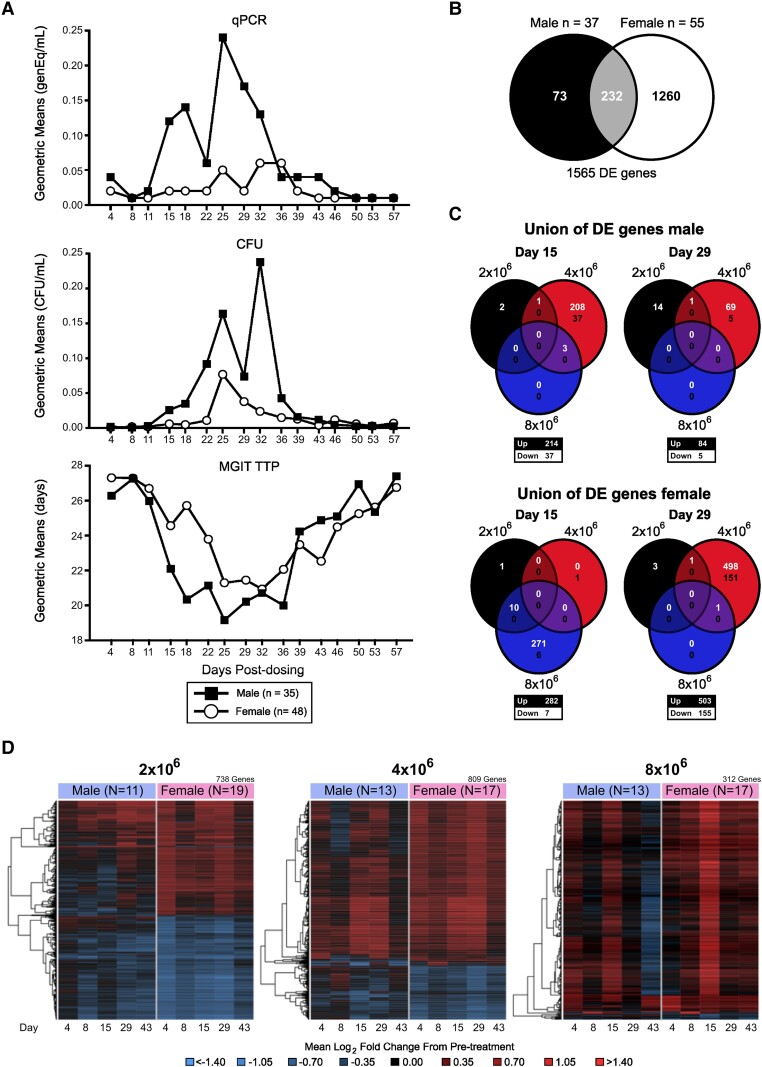
Sexual dimorphism has been identified as an important variable in immunologic responses. Women develop stronger immune responses to a range of antigens, and epidemiologic data indicate that men have a 2- to 10-fold increased risk for active TB disease [17, 18]. Therefore, we investigated whether sex affected BCG shedding results. While both sexes showed an increase in BCG shedding with dose escalation (Supplementary Figure 6), males displayed significantly enhanced BCG shedding in all 3 endpoint assays (MGIT and PCR, p<0.001 and CFU, p<0.05, by MTP mixed model analysis), according to pooled data across dose groups (Figure 7A, Supplementary Figure 7). These results could represent an immune component underlying the observed higher rate of TB disease incidence in males and indicate that our new BCG challenge model may be useful for identifying the specific biological differences that explain differential TB risks in men vs women.
Figure 7.
BCG challenge model identifies sex differences. Participants (n = 83) were enrolled and received 2 × 10⁶, 4 × 10⁶, or 8 × 10⁶ CFUs of BCG intradermally on day 1. A, BCG shedding at the challenge site was assessed by qPCR, CFU, or MGIT TTP. Composite results for all 3 dose groups are presented as geometric means over time, separated by males (black squares) and females (open circles). B, Overlap of DE genes between males and females. C, Overlap in DE genes across dose groups at days 15 and 29 posttreatment for males and females. The numbers in white (top) and black (bottom) indicate the number of up- and downregulated genes, respectively. D, Log2 fold change from pretreatment among a union of unique DE genes identified across sex and posttreatment days for each dose group. Rows represent DE genes. Columns represent mean log2 fold change at a posttreatment day. Red, upregulated vs pretreatment; blue, downregulated vs pretreatment. Dendrograms were obtained via complete linkage clustering of uncentered pairwise Pearson correlation distances between log2 fold changes. AUC, area under the curve; BCG, Bacillus Calmette-Guérin; CFU, colony-forming unit; DE, differentially expressed; qPCR, quantitative polymerase chain reaction; TTP, time to positivity.
To uncover the mechanisms driving the differences in the magnitude of BCG shedding between males and females, we identified DE genes on days 4, 8, 15, 29, and 43 by sex and group, excluding the highest-dose group (Supplementary Table 13). While transcriptomal analysis indicated that 1492 unique genes were differentially regulated following BCG challenge in whether by sex or group, only 232 of these were shared between sexes (Figure 7B, Supplementary Table 14). Overall, females had nearly 4.8 times more DE genes than males, indicating broader activation (1492 vs 305 DE genes, respectively; Supplementary Figure 8). Both sexes exhibited dose-dependent trends with similar overall kinetics for the 2 highest-dose groups (Supplementary Figure 9). However, pathway-wide median log2 fold changes for activated innate immune response pathways showed differential profiles between sexes (Supplementary Figure 10). While both sexes generally had a peak increase from baseline at day 29 for the 4 × 10⁶ CFU group, the earlier peak increase observed at day 15 for the 8 × 10⁶ CFU group was unique to females. This was observed for of IFN-γ signaling, phagosomes, the hydrogen peroxide catabolic process, mitophagy, and platelets activation.
DISCUSSION
Extensive data published over the past century support the safety of BCG vaccines, including the TICE strain [19]. Although BCG vaccination is considered safe, except for use in immunosuppressed persons, local reactogenicity frequently occurs, and more serious rare events can also occur. While the usual dose of BCG delivered intradermally ranges from 1 × 10⁵ to 2–3 × 10⁶ CFUs, we performed a dose escalation above these levels. To mitigate the risk of adverse events, we dose escalated with only 2-fold increases and included sentinels in doses >2 × 10⁶ CFUs. Overall, no major safety signals were identified except for progressive local reactogenicity at the BCG challenge sites with dose escalation. Local reactogenicity with doses ≤8 × 10⁶ CFUs was considered tolerable and justifiable for use in a challenge model to assess in vivo TB immunity in small groups.
Despite only 2-fold increases in the BCG challenge doses, all 3 endpoint assays showed significant dose escalation effects (Figure 2, Supplementary Figure 7). BCG shedding was significantly increased in the 8 × 10⁶ CFU group when compared with the 2 × 10⁶ CFU group in the overall analysis and when males and females were analyzed separately. Higher levels of IFN-γ were induced by higher BCG challenge doses, but earlier IFN-γ responses were not associated with protection from BCG shedding (Figure 3 and Supplementary Table 4). Finally, a dose effect was evident in the timing of peak DE genes between days 8 and 29 before returning to prechallenge levels at day 43 (Figure 5B). These data suggest that our BCG human challenge model has the capacity to detect subtle differences in vaccine dosing in a variety of assays.
Clinical responses to BCG vaccination are highly variable across participants [15, 19]. While most develop a transient ulcerative lesion after receiving BCG, onset and timing of ulcer drainage fluctuate greatly [15, 19]. This variability was also observed in our study (Figure 1). AUC analyses better captured a more accurate estimate of the entire spectrum of clinical responses, with 90% to 100% of the total BCG shedding detected between days 4 and 57. This contrasts with single measurements (peak shedding) and dichotomous data that did not account for either the total amount of shedding over time or the magnitude of the response. AUC analyses were the most consistent for evaluating dose escalation effects and differences in shedding between males and females. Accordingly, future BCG challenge studies should utilize the BCG shedding AUC for endpoint analyses.
Transcriptomics analysis showed dose-dependent timing to peak gene expression activation, with the 2 higher doses achieving earlier peak responses as compared with the 2 lower doses (day 15 vs 29). We also observed activation of pathways involved in IFN-α/β signaling, hydrogen peroxide catabolism and metabolism, leukocyte migration, phagocytosis, and mitophagy—all important processes for pathogen elimination.
A similar dose-dependent effect was seen overall for post-BCG DE genes shared by males and females. However, for activation of several pathways, such as IFN-γ signaling, phagosomes, the hydrogen peroxide catabolic process, mitophagy, and platelets, women achieved earlier activation after the 8 × 10⁶ CFU dose. We hypothesize that women more rapidly develop innate immune responses to mycobacterial challenge involving phagocytes and secondary amplifiers. We identified 19 gene expression biomarkers whose changes at day 8 correlated with MGIT TTP AUC, including several genes involved in T-cell activation as well as cell cycle/cell proliferation. These findings indicated that T-cell activation and proliferation have important effects reducing overall BCG replication and shedding. Interestingly, time trend analysis showed that peak average gene expression response for all 19 genes was inversely related to challenge dose, which may indicate that higher-challenge doses induced stronger protective responses.
BCG vaccination in humans is known to provide at least 50% protection against TB infection and pulmonary TB disease, as well as 70% to 80% against TB meningitis and mortality [20]. However, it is currently not possible to provide early estimates of efficacy for novel TB vaccines. This report represents the first step in developing a BCG CHIM for this purpose. Our research will focus on confirming that our model can detect BCG vaccine–induced immunity. We also need to determine the effects of previous BCG in our model to identify its usefulness in assessing enhanced immunity induced by novel vaccines in populations already given standard infant BCG.
Remarkably, power analysis of the MGIT TTP AUC of BCG shedding indicates that our BCG CHIM model can detect a 10% treatment effect in cohorts with as few as 30 participants per group (Figure 4). Since treatments that are <10% effective are unlikely to be of interest for further clinical development, we propose that this BCG challenge model is a powerful tool for rapidly evaluating new methods for the prevention and treatment of TB.
CHIMs have been used since 1796 when Edward Jenner reported inoculation of a young boy with cowpox to prevent smallpox disease [21], and they have been applied to >25 human pathogens, including malaria, influenza, cholera, and, most recently, COVID-19 [21, 22]. While large clinical trials are needed for licensure of new drugs or vaccines prior to receiving Food and Drug Administration approval, CHIMs can provide an important intermediate step in the developmental process by allowing candidates to be quickly triaged and by preventing expenditures on projects that are unlikely to succeed [23]. Besides efficacy studies, CHIMs can be used to carefully study attack rates, pathogenesis, incubation time, disease progression, and correlates of protection since at baseline the host factors, the timing of inoculation, and the precise dosing are known [24, 25].
A robust, accessible TB CHIM can be an indispensable tool to combat this deadly disease. As described, implementing CHIMs early in TB vaccine and drug pipelines will ensure that the most promising candidates are selected for future development. Additional applications of our TB CHIM include assessing the ability of novel vaccinations to induce systemic immunity, studying the mechanisms for protective immunity, and understanding the mechanisms by which women develop better immunity than their male counterparts. While additional CHIMs will be needed to assess mucosal immunity, our proof-of-concept study demonstrates the potential feasibility and utility of this approach in the TB field.
Supplementary Data
Supplementary materials are available at The Journal of Infectious Diseases online (http://jid.oxfordjournals.org/). Supplementary materials consist of data provided by the author that are published to benefit the reader. The posted materials are not copyedited. The contents of all supplementary data are the sole responsibility of the authors. Questions or messages regarding errors should be addressed to the author.
Supplementary Material
Contributor Information
Azra Blazevic, Department of Internal Medicine, School of Medicine, Saint Louis University, Missouri.
Rachel L Edwards, Department of Internal Medicine, School of Medicine, Saint Louis University, Missouri.
Mei Xia, Department of Internal Medicine, School of Medicine, Saint Louis University, Missouri.
Christopher S Eickhoff, Department of Internal Medicine, School of Medicine, Saint Louis University, Missouri.
Fahreta Hamzabegovic, Department of Internal Medicine, School of Medicine, Saint Louis University, Missouri.
Krystal A Meza, Department of Internal Medicine, School of Medicine, Saint Louis University, Missouri.
Huan Ning, Department of Internal Medicine, School of Medicine, Saint Louis University, Missouri.
Janice Tennant, Department of Internal Medicine, School of Medicine, Saint Louis University, Missouri.
Karla J Mosby, Department of Internal Medicine, School of Medicine, Saint Louis University, Missouri.
James C Ritchie, Hope Clinic, Division of Infectious Diseases, Department of Medicine, School of Medicine, Emory University, Atlanta, Georgia.
Tigisty Girmay, Hope Clinic, Division of Infectious Diseases, Department of Medicine, School of Medicine, Emory University, Atlanta, Georgia.
Lilin Lai, Hope Clinic, Division of Infectious Diseases, Department of Medicine, School of Medicine, Emory University, Atlanta, Georgia.
Michele McCullough, Hope Clinic, Division of Infectious Diseases, Department of Medicine, School of Medicine, Emory University, Atlanta, Georgia.
Allison Beck, Hope Clinic, Division of Infectious Diseases, Department of Medicine, School of Medicine, Emory University, Atlanta, Georgia.
Colleen Kelley, Hope Clinic, Division of Infectious Diseases, Department of Medicine, School of Medicine, Emory University, Atlanta, Georgia.
Srilatha Edupuganti, Hope Clinic, Division of Infectious Diseases, Department of Medicine, School of Medicine, Emory University, Atlanta, Georgia.
Sarah Kabbani, Hope Clinic, Division of Infectious Diseases, Department of Medicine, School of Medicine, Emory University, Atlanta, Georgia.
Wendy Buchanan, Division of Microbiology, Immunology and Infectious Diseases, National Institute of Allergy and Infectious Diseases, National Institutes of Health, Bethesda, Maryland.
Mamodikoe K Makhene, Division of Microbiology, Immunology and Infectious Diseases, National Institute of Allergy and Infectious Diseases, National Institutes of Health, Bethesda, Maryland.
Delia Voronca, The Emmes Company, LLC, Global Head Biomedical Data Science and Bioinformatics, Rockville, Maryland.
Sami Cherikh, The Emmes Company, LLC, Global Head Biomedical Data Science and Bioinformatics, Rockville, Maryland.
Johannes B Goll, The Emmes Company, LLC, Global Head Biomedical Data Science and Bioinformatics, Rockville, Maryland.
Nadine G Rouphael, Hope Clinic, Division of Infectious Diseases, Department of Medicine, School of Medicine, Emory University, Atlanta, Georgia.
Mark J Mulligan, Grossman School of Medicine, NewYork University.
Daniel F Hoft, Department of Internal Medicine, School of Medicine, Saint Louis University, Missouri.
Notes
Acknowledgments. The following reagents were obtained through BEI Resources, National Institute of Allergy and Infectious Diseases, National Institutes of Health: Mtb culture filtrate proteins (NR-14825) and Mtb whole cell lysate (NR-14822).
Financial support. This work was supported by the U.S. Department of Health and Human Services (HHSN272200800003C and HHSN272201300021I to Saint Louis University, HHSN272200800005C and HHSN272201300018I to Emory University, HHSN272200800013C and 75N93021C00012 to The Emmes Company).
References
- 1. World Health Organization. Global tuberculosis report. World Health Organization; 2019.
- 2. Schrager LK, Vekemens J, Drager N, Lewinsohn DM, Olesen OF. The status of tuberculosis vaccine development. Lancet Infect Dis 2020; 20:e28–37. [DOI] [PubMed] [Google Scholar]
- 3. Dockrell HM, Smith SG. What have we learnt about BCG vaccination in the last 20 years? Front Immunol 2017; 8:1134. [DOI] [PMC free article] [PubMed] [Google Scholar]
- 4. SAGE Working Group on BCG vaccines. Report on BCG vaccine use for protection against mycobacterial infections including tuberculosis, leprosy, and other nontuberculous mycobacteria (NTM) infections. World Health Organization, 2017.
- 5. Kroesen V, Madacki J, Frigui W, Sayes F, Brosch R. Mycobacterial virulence: impact on immunogenicity and vaccine research. F1000Res 2019;8:8. [DOI] [PMC free article] [PubMed] [Google Scholar]
- 6. Voss G, Casimiro D, Neyrolles O, et al. Progress and challenges in TB vaccine development. F1000Res 2018; 7:199. [DOI] [PMC free article] [PubMed] [Google Scholar]
- 7. Ginsberg AM. Designing tuberculosis vaccine efficacy trials—lessons from recent studies. Expert Rev Vaccines 2019; 18:423–32. [DOI] [PMC free article] [PubMed] [Google Scholar]
- 8. Oyston P, Robinson K. The current challenges for vaccine development. J Med Microbiol 2012; 61:889–94. [DOI] [PubMed] [Google Scholar]
- 9. Cohen MB. Human challenge studies for cholera. In: Current Topics in Microbiology and Immunology. Berlin: Springer, 2022:1–12. [DOI] [PubMed] [Google Scholar]
- 10. Sekhar A, Kang G. Human challenge trials in vaccine development. Semin Immunol 2020; 50:101429. [DOI] [PMC free article] [PubMed] [Google Scholar]
- 11. Feasey NA, Levine MM. Typhoid vaccine development with a human challenge model. Lancet 2017; 390:2419–21. [DOI] [PubMed] [Google Scholar]
- 12. McShane H. Controlled human infection models: is it really feasible to give people tuberculosis? Am J Respir Crit Care Med 2020; 201:1180–1. [DOI] [PMC free article] [PubMed] [Google Scholar]
- 13. Minassian AM, Satti I, Poulton ID, Meyer J, Hill AV, McShane H. A human challenge model for Mycobacterium tuberculosis using Mycobacterium bovis Bacille Calmette-Guerin. J Infect Dis 2012; 205:1035–42. [DOI] [PMC free article] [PubMed] [Google Scholar]
- 14. Davids M, Pooran A, Hermann C, et al. A human lung challenge model to evaluate the safety and immunogenicity of PPD and live Bacillus Calmette-Guérin. Am J Respir Crit Care Med 2020; 201:1277–91. [DOI] [PubMed] [Google Scholar]
- 15. Hoft DF, Leonardi C, Milligan T, et al. Clinical reactogenicity of intradermal Bacille Calmette-Guerin vaccination. Clin Infect Dis 1999; 28:785–90. [DOI] [PubMed] [Google Scholar]
- 16. Blazevic A, Xia M, Turan A, Tennant J, Hoft DF. Pilot studies of a human BCG challenge model. Tuberculosis (Edinb) 2017; 105:108–12. [DOI] [PubMed] [Google Scholar]
- 17. Hoft DF, Blazevic A, Selimovic A, et al. Safety and immunogenicity of the recombinant BCG vaccine AERAS-422 in healthy BCG-naive adults: a randomized, active-controlled, first-in-human phase 1 trial. EBioMedicine 2016; 7:278–86. [DOI] [PMC free article] [PubMed] [Google Scholar]
- 18. Horton KC, MacPherson P, Houben RM, White RG, Corbett EL. Sex differences in tuberculosis burden and notifications in low- and middle-income countries: a systematic review and meta-analysis. PLoS Med 2016; 13:e1002119. [DOI] [PMC free article] [PubMed] [Google Scholar]
- 19. Luca S, Mihaescu T. History of BCG vaccine. Maedica (Bucur) 2013; 8:53–8. [PMC free article] [PubMed] [Google Scholar]
- 20. Colditz GA, Brewer TF, Berkey CS, et al. Efficacy of BCG vaccine in the prevention of tuberculosis: meta-analysis of the published literature. JAMA 1994; 271:698–702. [PubMed] [Google Scholar]
- 21. Roestenberg M, Hoogerwerf MA, Ferreira DM, Mordmüller B, Yazdanbakhsh M. Experimental infection of human volunteers. Lancet Infect Dis 2018; 18:e312–e322. [DOI] [PubMed] [Google Scholar]
- 22. Liang TJ, Feld JJ, Cox AL, Rice CM. Controlled human infection model—fast track to HCV vaccine? N Engl J Med 2021; 385:1235–40. [DOI] [PMC free article] [PubMed] [Google Scholar]
- 23. Roestenberg M, Kamerling IMC, de Visser SJ. Controlled human infections as a tool to reduce uncertainty in clinical vaccine development. Front Med (Lausanne) 2018; 5:297. [DOI] [PMC free article] [PubMed] [Google Scholar]
- 24. Koopman JPR, Driciru E, Roestenberg M. Controlled human infection models to evaluate schistosomiasis and hookworm vaccines: where are we now? Expert Rev Vaccines 2021; 20:1369–71. [DOI] [PubMed] [Google Scholar]
- 25. Balasingam S, Wilder-Smith A. Randomized controlled trials for influenza drugs and vaccines: a review of controlled human infection studies. Int J Infect Dis 2016; 49:18–29. [DOI] [PubMed] [Google Scholar]
Associated Data
This section collects any data citations, data availability statements, or supplementary materials included in this article.


