

Abstract
PURPOSE
Black women have higher rates of death from triple-negative breast cancer (TNBC) than White women. We hypothesized that pathologic complete response (pCR) to neoadjuvant chemotherapy (NAC) and overall survival (OS) may vary by race/ethnicity in patients with TNBC.
METHODS
We identified women 18 years and older with stage I-III TNBC who received NAC followed by surgery from the National Cancer Database (2010-2019). We excluded patients without race/ethnicity or pathology data. Primary outcomes were pCR rates and OS on the basis of race/ethnicity.
RESULTS
Forty thousand eight hundred ninety women with TNBC met inclusion criteria (median age [IQR], 53 [44-61] years): 26,150 Non-Hispanic White (64%, NHW), 9,672 Non-Hispanic Black (23.7%, NHB), 3,267 Hispanic (8%), 1,368 Non-Hispanic Asian (3.3%, NHA), and 433 Non-Hispanic Other (1.1%, NHO) patients. Overall, 29.8% demonstrated pCR (NHW: 30.5%, NHB: 27%, Hispanic: 32.6%, NHA: 28.8%, NHO: 29.8%). Unadjusted OS was significantly higher for those with pCR compared with those with residual disease (5-year OS, 0.917 [95% CI, 0.911 to 0.923] v 0.667 [95% CI, 0.661 to 0.673], log-rank P < .001), and this association persisted after adjustment for demographic and tumor factors. The effect of achieving pCR on OS did not differ by race/ethnicity (interaction P = .10). However, NHB patients were less likely (odds ratio [OR], 0.89 [95% CI, 0.83 to 0.95], P = .001) and Hispanic patients were more likely (OR, 1.19 [95% CI, 1.08 to 1.31], P = .001) to achieve pCR than NHW patients. After adjustment for patient and disease factors, including achievement of pCR, Hispanic (hazard ratio [HR], 0.76 [95% CI, 0.69 to 0.85], P < .001) and NHA (HR, 0.64 [95% CI, 0.55 to 0.75], P < .001) race/ethnicity remained associated with OS.
CONCLUSION
Odds of achieving pCR and OS in patients with TNBC appear to be associated with race/ethnicity. Additional research is necessary to understand how race/ethnicity is associated with rates of pCR and OS, whether related to socioeconomic factors or biologic variables, or both.
INTRODUCTION
Despite the overall improvement in survival for patients with breast cancer, racial/ethnic disparities in outcomes persist. Between 2015 and 2019, breast cancer death rates among Non-Hispanic Black (NHB) women remained 41% higher across all stages compared with Non-Hispanic White (NHW).1 While socioeconomic factors and access to treatment play a role,2-9 emerging data suggest that differences in tumor biology may also contribute.10-13 NHB women appear to develop triple-negative breast cancer (TNBC), the most aggressive subtype of breast cancer, at twice the rate of NHW,14,15 and they have a third higher risk of dying from this disease.4,16,17
CONTEXT
Key Objective
Do response rates to neoadjuvant chemotherapy (NAC) and overall survival (OS) differ in patients with triple-negative breast cancer (TNBC) on the basis of race/ethnicity?
Knowledge Generated
Socioeconomic and tumor variables were similar for Non-Hispanic Black (NHB) and Hispanic women with TNBC, but NHB women demonstrated a lower response and Hispanic women demonstrated a higher response to neoadjuvant chemotherapy than Non-Hispanic White (NHW) women. After adjustment for covariates, including rates of pathologic complete response, OS did not differ for NHB women, but Hispanic and Non-Hispanic Asian women with TNBC had higher rates of OS than NHW.
Relevance (K.D. Miller)
-
Differences in response to chemotherapy are complex, and not fully explained by variables we currently measure. Further research to understand the causes of these differences and interventions to improve the outcome of breast cancer in minority populations are long overdue.*
*Relevance section written by JCO Senior Deputy Editor Kathy D. Miller, MD.
TNBC is defined by the absence of estrogen receptor expression, progesterone receptor expression, and human epidermal growth factor receptor 2 (HER2) overexpression. Given the absence of these biomarkers, effective targeted therapies are lacking, rendering chemotherapy and more recently immunotherapy the mainstay of treatment. The basis for these treatment recommendations originated from clinical trials evaluating the efficacy of chemotherapy on outcomes for patients with TNBC. However, racial/ethnic minorities were historically under-represented in these clinical trials,18,19 and so differences in response to treatment by race/ethnicity may have been obscured by the lack of diversity in the study participants.
Neoadjuvant chemotherapy (NAC) has allowed for assessment of individual patient response. Studies demonstrate that patients with TNBC who achieve pathologic complete response (pCR) have improved overall survival (OS) compared with those with residual disease (RD).20-22 However, recent studies suggest that response to chemotherapy in patients with TNBC may vary by race/ethnicity.14,23,24 Balmanoukian et al23 demonstrated in a single-institutional study (n = 38) that NHB women with TNBC treated with anthracycline and taxane-based NAC had lower rates of pCR than NHW (13% v 52%, P = .034). In addition, Killelea et al24 reported that despite being treated with NAC more frequently, NHB women appeared to have lower rates of pCR than NHW (37% v 43%, P < .001).
Available data evaluating response to NAC by race/ethnicity for patients with TNBC are limited. In our study, we examined whether race/ethnicity is associated with differences in pCR and OS in patients with TNBC.
METHODS
Study Design and Population
Adult (18 years and older) females diagnosed with TNBC who underwent chemotherapy followed by surgery between 2010 and 2019 were selected from the 2004 to 2019 National Cancer Database (NCDB). The study cohort was limited to those diagnosed in and after 2010 to ensure accurate capturing of patients with TNBC since HER2 status became a required data element in 2010. Patients with clinical T0/isN0 or M1 disease were excluded. Patients with missing race/ethnicity or pathologic data were also excluded. pCR was defined as no invasive cancer in both the breast and axilla after NAC (ypT0/isypN0). All others were categorized as having RD.
Race/ethnicity was defined as NHW, NHB, Hispanic, non-Hispanic Asian (NHA), and non-Hispanic Other (NHO), which includes patients recorded as American Indian/Alaska Native, Native Hawaiian/Pacific Islander, and Other. Race/ethnicity was entered by the participating cancer centers according to Standards for Oncology Registry Entry (STORE) guidelines on the basis of patient self-reported data.
Statistical Analysis
Patient, disease, and treatment characteristics were summarized by No. (%) for categorical variables and median (IQR) for continuous variables. Differences across groups were tested using chi-square tests for categorical variables and analysis of variance for continuous variables. OS was defined as time from surgery to death or last follow-up. The Kaplan-Meier method was used to estimate OS; log-rank tests were used to test for differences between groups. The reverse Kaplan-Meier method was used to estimate follow-up.
Logistic regression was used to estimate the association of select covariates with achievement of pCR. Factors were selected on the basis of clinical expertise and included race/ethnicity, age, comorbidity score, education and income level, facility type/location, insurance type, community type, clinical tumor (T)-stage, clinical node (N)-stage, grade, tumor size, surgery type, time from chemotherapy to surgery, and time from diagnosis to chemotherapy. To determine if the effect of race/ethnicity on achievement of pCR varied by select covariates, additional logistic regression models were conducted that included interaction terms for race/ethnicity by grade, comorbidity score, tumor size, clinical N-stage, and time from diagnosis to chemotherapy. For significant interactions, predicted probabilities (on the basis of the marginal population means) of achieving pCR were estimated for categorical covariates and odds ratios (ORs) for achieving pCR at specific covariate values were estimated for continuous covariates from the fully adjusted model.
A Cox Proportional Hazards model was used to estimate the association of response with OS after adjustment for race/ethnicity, age, comorbidity score, education and income level, facility type/location, insurance type, community type, grade, clinical T-stage, clinical N-stage, tumor size, surgery type, treatment with radiation, and time from diagnosis to surgery. This model included a sandwich covariance estimator to account for the correlation of patients treated at the same facility. Because of NCDB administrative censoring, patients diagnosed in 2019 were excluded from survival analyses. Sensitivity analyses were conducted by applying a backward selection technique to the adjusted OS and logistic regression models.
No adjustments were made for multiple comparisons. Only patients with complete data were included in each analysis, and effective sample sizes were included for each table and figure. All statistical analyses were conducted using SAS version 9.4 (SAS Institute, Cary NC).
RESULTS
Patient and Tumor Characteristics
In total, 40,890 patients with TNBC (median age [IQR], 53 [44-61] years) met study criteria (26,150 NHW; 9,672 NHB; 3,267 Hispanic; 1,368 NHA; 433 NHO, Data Supplement, Fig S1, online only). The median follow-up time was 55.4 months. The majority of women were ≥50 years and older (59.9%) and had ductal carcinoma (89.2%). Slightly more than half presented with clinical T2 disease (53.1%) and/or N0 disease (50.9%), and most had high-grade disease (80.4%). More NHB women compared with NHW had tumors that were larger, high-grade, and lymph node–positive (P < .001). Hispanic women had similar rates of T3 tumors, high-grade disease, and lymph node positivity as NHB (Table 1).
TABLE 1.
Patient and Tumor Characteristics
| Variable | All Patients (N = 40,890) | Hispanic (n = 3,267) | NHA (n = 1,368) | NHB (n = 9,672) | NHW (n = 26,150) | NHO (n = 433) | P a | P b |
|---|---|---|---|---|---|---|---|---|
| Age, years | <.001 | <.001 | ||||||
| <50, No. (%) | 16,416 (40.1) | 1,857 (56.8) | 634 (46.3) | 3,882 (40.1) | 9,817 (37.5) | 226 (52.2) | ||
| ≥50, No. (%) | 24,474 (59.9) | 1,410 (43.2) | 734 (53.7) | 5,790 (59.9) | 16,333 (62.5) | 207 (47.8) | ||
| Median (IQR) | 53 (44-61) | 47 (39-56) | 51 (41-60) | 52 (44-60) | 54 (45-63) | 49 (40-57) | <.001 | <.001 |
| Charlson/Deyo comorbidity score, No. (%) | <.001 | <.001 | ||||||
| 0 | 35,181 (86) | 2,858 (87.5) | 1,221 (89.3) | 7,895 (81.6) | 22,838 (87.3) | 369 (85.2) | ||
| 1 | 4,528 (11.1) | 332 (10.2) | 135 (9.9) | 1,391 (14.4) | 2,621 (10) | 49 (11.3) | ||
| ≥2 | 1,181 (2.9) | 77 (2.4) | 12 (0.9) | 386 (4) | 691 (2.6) | 15 (3.5) | ||
| Histology, No. (%) | <.001 | <.001 | ||||||
| Ductal | 36,481 (89.2) | 2,914 (89.2) | 1,231 (90) | 8,730 (90.3) | 23,205 (88.7) | 401 (92.6) | ||
| Lobular | 1,609 (3.9) | 121 (3.7) | 62 (4.5) | 309 (3.2) | 1,104 (4.2) | 13 (3) | ||
| Other | 2,800 (6.8) | 232 (7.1) | 75 (5.5) | 633 (6.5) | 1,841 (7) | 19 (4.4) | ||
| Grade, No. (%) | <.001 | <.001 | ||||||
| 1 | 313 (0.8) | 21 (0.6) | 15 (1.1) | 51 (0.5) | 225 (0.9) | 1 (0.2) | ||
| 2 | 5,407 (13.2) | 359 (11) | 188 (13.7) | 1,039 (10.7) | 3,759 (14.4) | 62 (14.3) | ||
| 3 | 32,888 (80.4) | 2,706 (82.8) | 1,097 (80.2) | 8,053 (83.3) | 20,687 (79.1) | 345 (79.7) | ||
| Clinical T-stage, No. (%) | <.001 | <.001 | ||||||
| cT0/is | 139 (0.3) | 12 (0.4) | 2 (0.1) | 33 (0.3) | 91 (0.3) | 1 (0.2) | ||
| cT1 | 8,483 (20.7) | 571 (17.5) | 222 (16.2) | 1,828 (18.9) | 5,782 (22.1) | 80 (18.5) | ||
| cT2 | 21,718 (53.1) | 1,730 (53) | 811 (59.3) | 4,963 (51.3) | 13,973 (53.4) | 241 (55.7) | ||
| cT3 | 6,626 (16.2) | 669 (20.5) | 218 (15.9) | 1,842 (19) | 3,826 (14.6) | 71 (16.4) | ||
| cT4 | 3,924 (9.6) | 285 (8.7) | 115 (8.4) | 1,006 (10.4) | 2,478 (9.5) | 40 (9.2) | ||
| Clinical N-stage, No. (%) | <.001 | <.001 | ||||||
| cN0 | 20,809 (50.9) | 1,523 (46.6) | 719 (52.6) | 4,269 (44.1) | 14,077 (53.8) | 221 (51) | ||
| cN1 | 15,058 (36.8) | 1,273 (39) | 499 (36.5) | 3,986 (41.2) | 9,143 (35) | 157 (36.3) | ||
| cN2 | 2,838 (6.9) | 263 (8.1) | 85 (6.2) | 795 (8.2) | 1,664 (6.4) | 31 (7.2) | ||
| cN3 | 2,185 (5.3) | 208 (6.4) | 65 (4.8) | 622 (6.4) | 1,266 (4.8) | 24 (5.5) | ||
| Income level, No. (%) | <.001 | <.001 | ||||||
| <$48,000 USD | 13,952 (34.1) | 1,425 (43.6) | 230 (16.8) | 4,994 (51.6) | 7,177 (27.4) | 126 (29.1) | ||
| ≥$48,000 USD | 21,331 (52.2) | 1,436 (44) | 952 (69.6) | 3,398 (35.1) | 15,300 (58.5) | 245 (56.6) | ||
| Education level, No. (%) | <.001 | <.001 | ||||||
| HS graduation rate ≤87% | 15,555 (38) | 2,032 (62.2) | 443 (32.4) | 5,339 (55.2) | 7,588 (29) | 153 (35.3) | ||
| HS graduation rate >87% | 19,736 (48.3) | 829 (25.4) | 739 (54) | 3,054 (31.6) | 14,895 (57) | 219 (50.6) | ||
| Community type, No. (%) | <.001 | <.001 | ||||||
| Metro | 35,137 (85.9) | 3,090 (94.6) | 1,311 (95.8) | 8,820 (91.2) | 21,556 (82.4) | 360 (83.1) | ||
| Urban | 4,142 (10.1) | 134 (4.1) | 27 (2) | 559 (5.8) | 3,377 (12.9) | 45 (10.4) | ||
| Rural | 511 (1.2) | 11 (0.3) | 5 (0.4) | 81 (0.8) | 401 (1.5) | 13 (3) | ||
| Insurance status, No. (%) | <.001 | <.001 | ||||||
| Private | 25,617 (62.6) | 1,570 (48.1) | 895 (65.4) | 5,404 (55.9) | 17,499 (66.9) | 249 (57.5) | ||
| Government | 13,370 (32.7) | 1,207 (36.9) | 410 (30) | 3,717 (38.4) | 7,872 (30.1) | 164 (37.9) | ||
| None | 1,429 (3.5) | 440 (13.5) | 50 (3.7) | 431 (4.5) | 490 (1.9) | 18 (4.2) | ||
| Facility type, No. (%) | <.001 | <.001 | ||||||
| Academic/research | 14,930 (36.5) | 1,536 (47) | 619 (45.2) | 4,078 (42.2) | 8,526 (32.6) | 171 (39.5) | ||
| Integrated network | 9,286 (22.7) | 612 (18.7) | 288 (21.1) | 2,157 (22.3) | 6,137 (23.5) | 92 (21.2) | ||
| Comprehensive community | 14,462 (35.4) | 952 (29.1) | 414 (30.3) | 3,031 (31.3) | 9,907 (37.9) | 158 (36.5) | ||
| Community | 2,202 (5.4) | 166 (5.1) | 47 (3.4) | 405 (4.2) | 1,572 (6) | 12 (2.8) | ||
| Facility location, No. (%) | <.001 | <.001 | ||||||
| Midwest | 10,565 (25.8) | 320 (9.8) | 199 (14.5) | 1,950 (20.2) | 8,024 (30.7) | 72 (16.6) | ||
| Northeast | 7,005 (17.1) | 585 (17.9) | 295 (21.6) | 1,397 (14.4) | 4,662 (17.8) | 66 (15.2) | ||
| South | 17,363 (42.5) | 1,354 (41.4) | 369 (27) | 5,904 (61) | 9,570 (36.6) | 166 (38.3) | ||
| West | 5,947 (14.5) | 1,007 (30.8) | 505 (36.9) | 420 (4.3) | 3,886 (14.9) | 129 (29.8) |
NOTE. Percentages may not add up to 100 because of rounding or missing values.
Abbreviations: HS, high school; N, node; NHA, Non-Hispanic Asian; NHB, Non-Hispanic Black; NHO, Non-Hispanic Other; NHW, Non-Hispanic White; T, tumor; USD, US dollars.
P value for comparison of all race/ethnicity groups.
P value for NHW versus NHB.
More than half of NHB women were from lower-income areas (51.6%) and from areas with low high school graduation rates (55.2%), whereas 62.2% of Hispanic patients were from areas with low high school graduation rates. Hispanic patients had the highest rates of no insurance of all races/ethnicities (13.5%). Community type, facility type/location, and insurance status also differed by race/ethnicity with NHB more often than NHW from Metropolitan regions, treated at academic/research centers, facilities in the South and/or with government insurance (Table 1).
Comparing those excluded because of missing race/ethnicity or pathology data to those included, demographic and tumor variables were similar (Data Supplement, Table S1). Among the study cohort, rates of “missingness” of select covariates were compared and were similar across race/ethnicity groups. In addition, the differences in characteristics and results for those with any missing data versus those with complete data were similar (Data Supplement, Table S2).
Variables Associated With pCR
Overall, 29.8% of patients demonstrated a pCR with Hispanic patients demonstrating the highest (32.6%) and NHB the lowest (27.0%) rates of pCR (Fig 1). Hispanic patients were more likely (OR, 1.19 [95% CI, 1.08 to 1.31], P = .001) and NHB less likely (OR, 0.89 [95% CI, 0.83 to 0.95], P = .001) to achieve pCR than NHW. After adjustment for demographic, tumor, and treatment variables, race/ethnicity remained associated with pCR (Table 2). The effect of race/ethnicity on odds of achieving pCR did not differ by comorbidity score (P = .18), tumor size (P = .17), or clinical N-stage (P = .59), but it did differ by tumor grade (P = .04). Patients with grade 3 tumors had greater odds of achieving pCR than grade 1 (OR, 2.7 [95% CI, 1.88 to 3.87], P < .001). However, among those with grade 3 tumors, NHB appeared to have a lower probability of response than Hispanic women (predicted probability, 0.222 [95% CI, 0.190 to 0.258] v 0.267 [95% CI, 0.228 to 0.309]). In addition, unlike the other racial/ethnic groups, Hispanic patients had similar predicted probabilities of response across all grades (Table 3).
FIG 1.

Rates of pathologic complete response by race/ethnicity in patients with triple-negative breast cancer treated with neoadjuvant chemotherapy. NHA, Non-Hispanic Asian; NHB, Non-Hispanic Black; NHO, Non-Hispanic Other; NHW, Non-Hispanic White.
TABLE 2.
Adjusted Logistic Regression for pCR (n = 31,138)
| Variable | pCR v RD (pCR Rate = 8,993/31,138, 28.9%) | ||
|---|---|---|---|
| OR (95% CI) | P | Overall P | |
| Race/ethnicity | <.001 | ||
| NHW | Ref | ||
| Hispanic | 1.19 (1.08 to 1.31) | .001 | |
| NHA | 0.92 (0.8 to 1.06) | .25 | |
| NHB | 0.89 (0.83 to 0.95) | .001 | |
| Other | 0.98 (0.76 to 1.25) | .86 | |
| Age, years | <.001 | ||
| ≥50 | Ref | ||
| <50 | 1.27 (1.2 to 1.34) | <.001 | |
| Charlson/Deyo comorbidity score | .001 | ||
| 0 | Ref | ||
| 1 | 0.89 (0.81 to 0.96) | .005 | |
| ≥2 | 0.8 (0.68 to 0.95) | .009 | |
| Facility type | <.001 | ||
| Academic/research | Ref | ||
| Integrated network | 0.95 (0.88 to 1.01) | .11 | |
| Comprehensive community | 0.86 (0.81 to 0.91) | <.001 | |
| Community | 0.77 (0.68 to 0.87) | <.001 | |
| Facility location | .003 | ||
| South | Ref | ||
| Midwest | 1.03 (0.96 to 1.1) | .43 | |
| Northeast | 0.89 (0.82 to 0.96) | .002 | |
| West | 1 (0.93 to 1.09) | .90 | |
| Insurance type | <.001 | ||
| Private | Ref | ||
| Government | 0.79 (0.75 to 0.84) | <.001 | |
| None | 0.83 (0.72 to 0.96) | .01 | |
| Clinical T-stage | <.001 | ||
| T1 | Ref | ||
| T0/IS | 0.81 (0.38 to 1.73) | .59 | |
| T2 | 1.02 (0.96 to 1.09) | .56 | |
| T3 | 0.73 (0.66 to 0.8) | <.001 | |
| T4 | 0.58 (0.51 to 0.66) | <.001 | |
| Clinical N-stage | <.001 | ||
| N0 | Ref | ||
| N1 | 0.9 (0.86 to 0.96) | <.001 | |
| N2 | 0.72 (0.64 to 0.81) | <.001 | |
| N3 | 0.85 (0.75 to 0.96) | .008 | |
| Grade | <.001 | ||
| 1 | Ref | ||
| 2 | 1.48 (1.02 to 2.14) | .04 | |
| 3 | 2.7 (1.88 to 3.87) | <.001 | |
| Longer interval from diagnosis to chemotherapy | 0.95 (0.94 to 0.96) | <.001 | <.001 |
| Longer interval from chemotherapy to surgery | 1.02 (1.02 to 1.03) | <.001 | <.001 |
NOTE. Model also adjusted for tumor size, surgery type, education level, income level, and community type. Estimates for intervals from diagnosis to chemotherapy and chemotherapy to surgery are for the 1-week increase.
Abbreviations: IS, in situ; N, node; NHA, Non-Hispanic Asian; NHB, Non-Hispanic Black; NHW, Non-Hispanic White; OR, odds ratio; pCR, pathologic complete response; RD, residual disease; Ref, reference; T, tumor.
TABLE 3.
Adjusted Logistic Regression for pCR – Race/Ethnicity × Grade Predicted Probabilities of pCR
| Race/Ethnicity | Grade | Predicted Probability of pCR (95% CI) | Interaction P |
|---|---|---|---|
| Hispanic | 1 | 0.256 (0.106 to 0.501) | .04 |
| 2 | 0.221 (0.171 to 0.281) | ||
| 3 | 0.267 (0.228 to 0.309) | ||
| NHA | 1 | 0.124 (0.029 to 0.402) | |
| 2 | 0.104 (0.066 to 0.160) | ||
| 3 | 0.234 (0.194 to 0.279) | ||
| NHB | 1 | 0.157 (0.079 to 0.288) | |
| 2 | 0.127 (0.101 to 0.160) | ||
| 3 | 0.222 (0.190 to 0.258) | ||
| NHW | 1 | 0.079 (0.049 to 0.126) | |
| 2 | 0.148 (0.124 to 0.176) | ||
| 3 | 0.243 (0.210 to 0.280) |
NOTE. All predicted probabilities in this table also adjusted for all covariates included in Table 2.
Abbreviations: NHA, Non-Hispanic Asian; NHB, Non-Hispanic Black; NHW, Non-Hispanic White; pCR, pathologic complete response.
A longer time interval between diagnosis and the start of NAC was associated with a lower likelihood of pCR (Table 2). However, the effect of weeks from diagnosis to NAC on odds of achieving pCR differed by race/ethnicity; NHW patients demonstrated the greatest reduction in likelihood of achieving pCR with each additional week from diagnosis to NAC (NHW: OR, 0.931 [95% CI, 0.919 to 0.943]; NHB: OR, 0.975 [95% CI, 0.961 to 0.990]; Hispanic: OR, 0.957 [95% CI, 0.935 to 0.980]; NHA: OR, 0.947 [95% CI, 0.903 to 0.994]; NHO: OR, 0.959 [95% CI, 0.886 to 1.037], interaction P < .001). Odds of achieving pCR decreased less for NHB who overall had lower rates of pCR. Hispanic patients, who had higher odds of achieving pCR, also had less reduction in odds of pCR. The median interval to start of NAC was longer for NHB (median 5 weeks) and Hispanic patients (5.29 weeks) compared with NHW (4.14 weeks, P < .001), but this increased interval did not translate into decreased odds of pCR for Hispanic patients. At both 4- and 5-week intervals, NHB had lower and Hispanic patients had higher odds of achieving pCR than NHW (Data Supplement, Table S3). Patients who achieved pCR also demonstrated a longer duration from chemotherapy start to surgery compared with those with RD (Table 2). However, the association of time from NAC to surgery with likelihood of achieving pCR did not differ by race/ethnicity (interaction P = .14).
Age was also associated with pCR with those younger than 50 years having higher odds of pCR than those 50 years and older (OR, 1.27 [95% CI, 1.2 to 1.34], P < .001). Comorbidity scores >0, treatment at community centers, or treatment at facilities in the northeast were associated with lower odds of achieving pCR. In addition, larger tumor size compared with T1 and any lymph node positivity were associated with lower odds of achieving pCR (Table 2).
Association of pCR and OS
For all patients who achieved pCR, unadjusted OS was higher compared with patients with RD (5-year OS, 0.917 [95% CI, 0.911 to 0.923] v 0.667 [95% CI, 0.661 to 0.673], log-rank P < .001, Fig 2A). Among pathologic complete responders, NHB had high 5-year OS similar to NHW patients (0.91 [95% CI, 0.897 to 0.922] v 0.916 [95% CI, 0.909 to 0.922]). Hispanic and NHA patients on the other hand appeared to have higher rates of 5-year OS (0.937 [95% CI, 0.917 to 0.953] and 0.94 [95% CI, 0.905 to 0.962], log-rank P = .03, Fig 2B).
FIG 2.
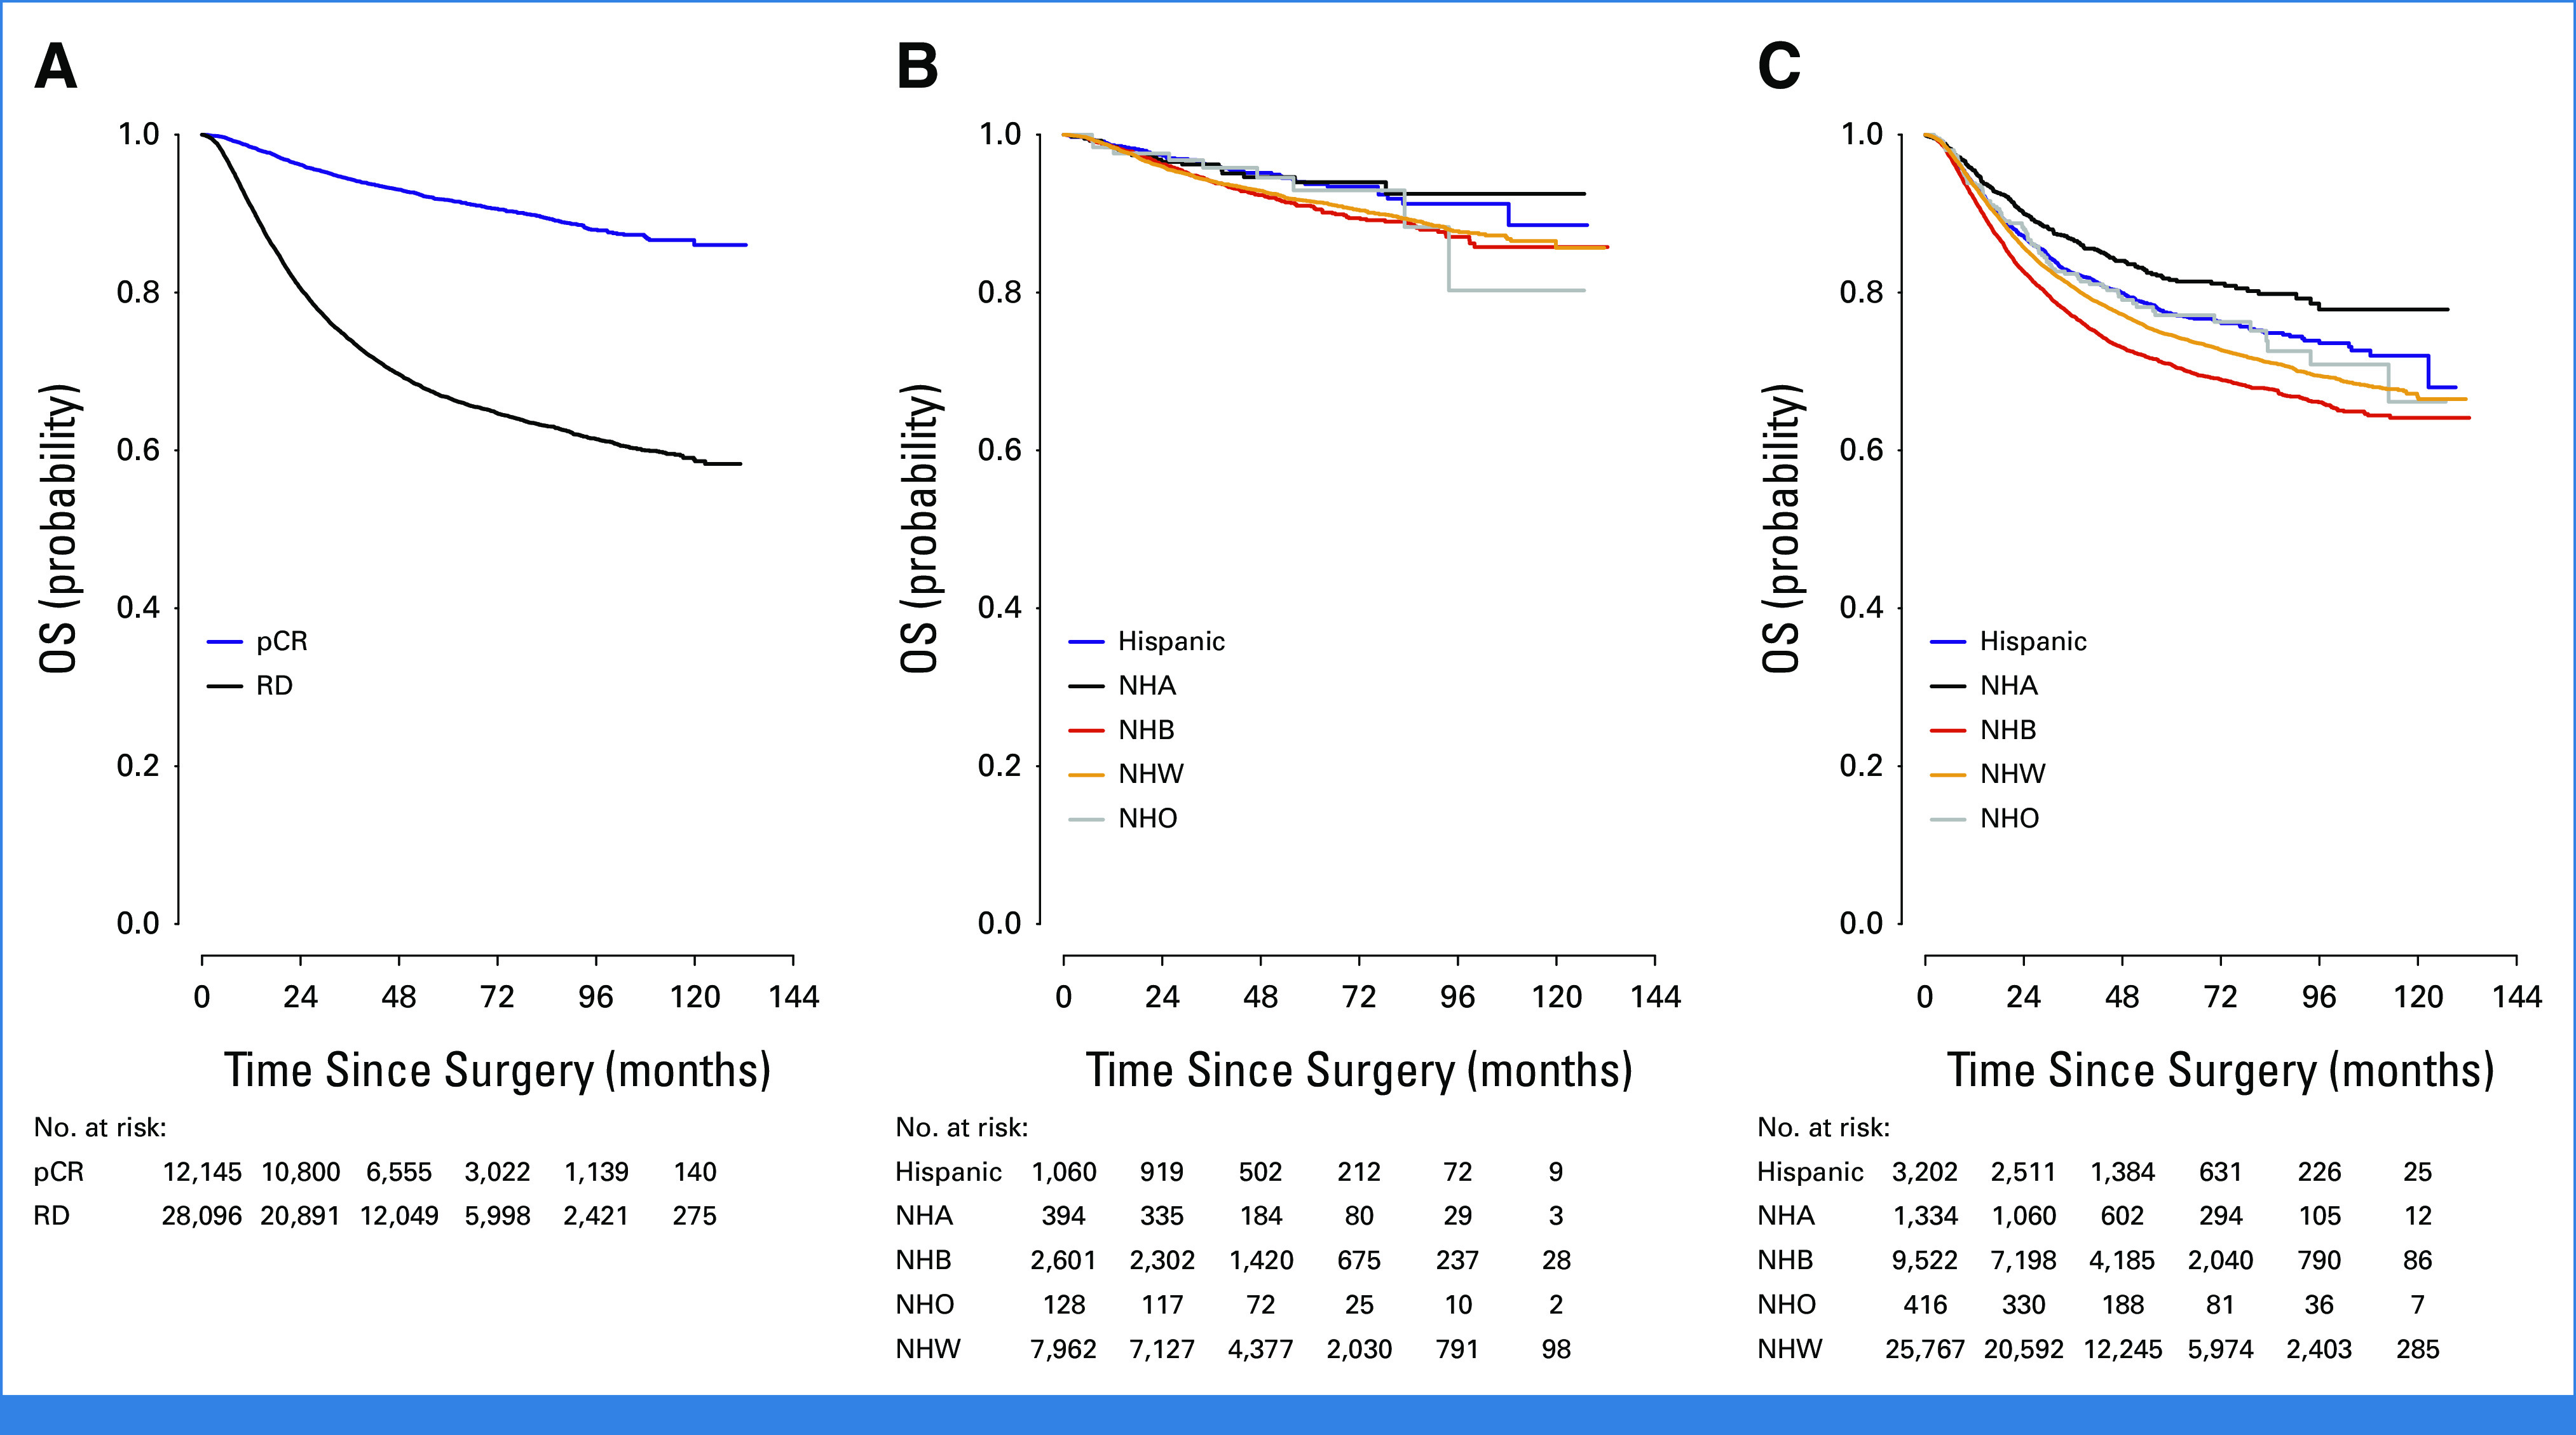
Overall survival of patients with triple-negative breast cancer treated with neoadjuvant chemotherapy on the basis of (A) response to treatment, (B) race/ethnicity in those with pCR, and (C) race/ethnicity. NHA, Non-Hispanic Asian; NHB, Non-Hispanic Black; NHO, Non-Hispanic Other; NHW, Non-Hispanic White; pCR, pathologic complete response; RD, residual disease.
Variables Associated With OS
Overall, unadjusted OS differed by race/ethnicity, with NHB patients having the lowest 5-year OS compared with other groups (NHW 0.746, NHB 0.709, Hispanic 0.772, NHA 0.816, NHO 0.771, log-rank P < .001, Fig 2C). This disparity in OS persisted in both younger (age <50 years) and older (age ≥50 years) women but was more pronounced in younger patients (NHW, 0.779 [95% CI, 0.77 to 0.788]; NHB, 0.73 [95% CI, 0.714 to 0.745]; Hispanic, 0.78 [95% CI, 0.757 to 0.8]; NHA, 0.858 [95% CI, 0.824 to 0.886]; NHO, 0.791 [95% CI, 0.724 to 0.843], log-rank P < .001). However, after adjustment for demographic, socioeconomic, tumor, and treatment variables, including treatment response, NHB race/ethnicity was no longer associated with worsened OS compared with NHW (Table 4). Hispanic and NHA race/ethnicity, however, was associated with improved OS, even after adjustment. Achieving a pCR also remained highly associated with improved OS after adjustment; the effect of achieving pCR on OS did not differ by race/ethnicity (interaction P = .10).
TABLE 4.
Adjusted Overall Survival (n = 29,088)
| Variable | Death Rate = 6,901/29,088 (23.7%) | ||
|---|---|---|---|
| HR (95% CI) | P | Overall P | |
| Overall response | <.001 | ||
| RD | Ref | ||
| pCR | 0.25 (0.23 to 0.28) | <.001 | |
| Race/ethnicity | <.001 | ||
| NHW | Ref | ||
| Hispanic | 0.76 (0.69 to 0.85) | <.001 | |
| NHA | 0.64 (0.55 to 0.75) | <.001 | |
| NHB | 1.04 (0.98 to 1.1) | .23 | |
| Other | 0.93 (0.73 to 1.18) | .55 | |
| Age, years | <.001 | ||
| >50 | Ref | ||
| <50 | 0.89 (0.84 to 0.94) | <.001 | |
| Charlson/Deyo comorbidity score | <.001 | ||
| 0 | Ref | ||
| 1 | 1.17 (1.09 to 1.26) | <.001 | |
| ≥2 | 1.46 (1.28 to 1.66) | <.001 | |
| Income level | .04 | ||
| <$48,000 USD | Ref | ||
| ≥$48,000 USD | 0.94 (0.88 to 1) | .04 | |
| Insurance type | <.001 | ||
| Private | Ref | ||
| Government | 1.28 (1.21 to 1.35) | <.001 | |
| None | 1.14 (0.98 to 1.32) | .09 | |
| Grade | .01 | ||
| 1 | Ref | ||
| 2 | 1.31 (0.95 to 1.79) | .10 | |
| 3 | 1.41 (1.03 to 1.92) | .03 | |
| Clinical T-stage | <.001 | ||
| T1 | Ref | ||
| T0/IS | 1.51 (0.89 to 2.56) | .13 | |
| T2 | 1.28 (1.19 to 1.37) | <.001 | |
| T3 | 1.62 (1.49 to 1.77) | <.001 | |
| T4 | 2.09 (1.89 to 2.3) | <.001 | |
| Clinical N-stage | <.001 | ||
| N0 | Ref | ||
| N1 | 1.74 (1.64 to 1.85) | <.001 | |
| N2 | 2.16 (1.96 to 2.38) | <.001 | |
| N3 | 2.71 (2.46 to 3) | <.001 | |
NOTE. Model also adjusted for education level, facility type and location, community type, treatment with radiation, tumor size, surgery type, and weeks from diagnosis to surgery.
Abbreviations: HR, hazard ratio; IS, in situ; N, node; NHA, Non-Hispanic Asian; NHB, Non-Hispanic Black; NHW, Non-Hispanic White; pCR, pathologic complete response; RD, residual disease; ref, reference; T, tumor; USD, US dollars.
Age <50 years and income ≥$48,000 in US dollars were associated with improved OS, whereas government insurance, grade 3 tumors, larger tumor size, and lymph node positivity were associated with worse OS (Table 4). Results from the sensitivity analyses did not differ from results presented as primary analyses (Data Supplement, Tables S4 and S5).
DISCUSSION
In this large cohort study of patients with TNBC, we found that achieving a pCR differed significantly by race/ethnicity, with NHB having the lowest and Hispanic patients having the highest rates of pCR of all race/ethnicity groups. The available data to date examining the association of race/ethnicity and pCR have been conflicting, but most studies have been smaller, single-institutional studies that included patients with TNBC as a subgroup.23-28 In our study of over 40,000 patients with TNBC, we found differences in rates of pCR associated with race/ethnicity. Importantly, we demonstrated that the association of pCR with improved OS did not differ by race/ethnicity; NHB women who achieved pCR had equally high 5-year OS rates as NHW. These data suggest that the disparities in survival outcomes noted for NHB women may in part reflect the lower rates of pCR associated with this race/ethnic group.
Similar findings were recently reported by Roy et al29 who assessed racial differences in chemosensitivity (very sensitive = pCR, sensitive = partial response, refractory = no response) among all breast cancer subtypes; they demonstrated that among patients with TNBC, Black women had the lowest rates of very sensitive (25.7%) and the highest rates of refractory disease (38% v 30%-35%; P < .001). However, when Black women achieved pCR, OS did not differ from White (hazard ratio, 0.99 [95% CI, 0.82 to 1.18], P = .23). Our studies complement each other nicely because whether pCR excludes in situ disease (ypT0N0) as in their study or includes it as in ours (ypT0/isN0), the association between race/ethnicity and pCR persists.
This association persisted after adjustment for demographic, socioeconomic, tumor, and treatment variables. However, we were not able to analyze the more granular details of the chemotherapy regimen, dosing, or completion of NAC, factors that may affect the observed association of race/ethnicity with pCR. We were able to evaluate time to treatment start however, and interestingly, although both NHB and Hispanic patients had longer delays to treatment start compared with NHW, only NHB patients had lower rates of pCR, whereas Hispanic patients had higher rates of pCR. This finding suggests that although there is variability in time to treatment start by race/ethnicity, time to treatment is associated with rates of pCR differently across race/ethnicity groups. Since the tumors of NHB and Hispanic patients in our study were similarly large, high-grade, and lymph node–positive, the differential response to treatment on the basis of treatment start times may reflect inherent differences in tumor chemosensitivity. The TNBC of NHB patients may be less chemosensitive in general, so these individuals will have lower rates of pCR to start that does not change significantly with longer time to treatment. On the other hand, Hispanic patients might have more chemosensitive tumors, so despite the longer interval to treatment, their tumors will respond more favorably once treatment does start.
Interestingly, we noted that the association between race/ethnicity and odds of achieving pCR appeared to differ by tumor grade, a feature that reflects the biologic aggressiveness of a tumor. Similar to other studies,30,31 we demonstrated that patients with grade 3 tumors had higher odds of achieving pCR; however, in our study, among those with grade 3 tumors, which comprised 80% of the study population, NHB patients demonstrated the lowest probability of response. In addition, while the response rates for lower-grade tumors were half that of high-grade tumors for other races/ethnicities, Hispanic patients had equally high probabilities of response to treatment across all grades. These findings support that biologic differences on the basis of race/ethnicity may exist in TNBC, which are associated with treatment response.
Along these lines, studies have suggested that the TNBC biologic subtype may vary by race/ethnicity and that the biologic subtype may be associated with response to NAC and survival.32-37 The aggressive, basal-like subtype found more frequently in NHB patients has been uniformly associated with worsened OS.16,38,39 Rather little is known about the molecular differences of TNBC of other races/ethnicities, but early data suggest that NHA women might also have a different molecular subtype of TNBC than non-NHA.40,41 In our study, NHA patients, who had similar rates of pCR as NHW patients, demonstrated significantly higher rates of OS among both those who achieved pCR and those with RD. This survival benefit may reflect differences in adjuvant therapies received or factors such as body mass index (BMI), which has been shown to be a mediator of improved OS in Asian individuals,42 but it may also suggest a more favorable phenotype of TNBC. In Hispanic patients from Mexico, Ortiz Valdez et al43 demonstrated that the most common subtype of TNBC identified was the immunomodulatory type; this subtype was associated with the highest rates of pCR in their study, with over 75% of patients who achieved pCR having the immunomodulatory subtype. Patients with this subtype were also noted to have improved OS although this did not reach statistical significance (P = .064).
These data suggest that the association of race/ethnicity with rates of pCR and OS may reflect biologic differences in TNBC associated with race/ethnicity. Because race is a social construct and a poor surrogate for genetic ancestry, it is essential to examine whether social, cultural, and environmental factors associated with self-identified race influence the biologic make-up of TNBC. The field of epigenetics, which studies the impact of external factors on gene expression programs, may provide insight into these health disparities associated with socially constructed race groups. Indeed, we and others have demonstrated that TNBC tumors do appear to differ epigenetically by race/ethnicity.44-46
As studies continue to address the socioeconomic and access issues that influence cancer outcomes, it is essential to identify if biologic differences exist on the basis of race/ethnicity that also affect treatment response and survival. Specifically, identifying if molecular mechanisms drive the lower rates of pCR in NHB women with TNBC will be a crucial first step toward improving the effectiveness of therapies and advancing precision-based medical care for this vulnerable patient group. In addition, identifying why Hispanic patients who have low socioeconomic status and present with higher-stage tumors at rates similar to NHB patients have higher rates of pCR and OS would increase our understanding of the factors that positively influence response to treatment and survival outcomes. The “Hispanic paradox,” an epidemiologic observation that Hispanic Americans appear to have better health outcomes than NHW individuals despite lower socioeconomic status and higher comorbidities, has been reported in patients with non–small-cell lung cancer and has been attributed to both social and biologic factors47-50 and may be at play in patients with breast cancer as well.
Our study has several limitations. First, income and graduation data in the NCDB are ecologic not individual. Structural and social determinants of health, including behavior and lifestyle factors, may directly affect health care outcomes but are not captured in the NCDB. In addition, we could not adjust for variables such as menopausal status, genetic mutations, or BMI. Because race/ethnicity is assigned in the NCDB by primary race, the impact of mixed-race individuals on our study results cannot be ascertained. Finally, because the NCDB is a hospital-based tumor registry, our findings may not be generalizable to the US population. Despite these limitations, our exploratory study is hypothesis-generating and provides outcomes data by race/ethnicity, to our knowledge, on the largest cohort of patients to date with TNBC treated with NAC.
In conclusion, we found that racial/ethnic disparities exist in rates of pCR and OS in patients with TNBC. Understanding the influences, including biologic factors that may contribute to these observed differences in outcomes, is paramount to improving treatment strategies and survival for patients with this otherwise aggressive breast cancer subtype.
E. Shelley Hwang
Stock and Other Ownership Interests: Clinetic
Other Relationship: Exai Bio
No other potential conflicts of interest were reported.
PRIOR PRESENTATION
Presented at the San Antonio Breast Cancer Symposium, San Antonio, TX, December 6-10, 2022.
SUPPORT
Supported by NIH Cancer Center Support grant P30CA014236 (S.M.T.; PI: Kastan) for the Biostatistics support.
AUTHORS' DISCLOSURES OF POTENTIAL CONFLICTS OF INTEREST
Racial/Ethnic Disparities in Pathologic Complete Response and Overall Survival in Patients With Triple-Negative Breast Cancer Treated With Neoadjuvant Chemotherapy
The following represents disclosure information provided by authors of this manuscript. All relationships are considered compensated unless otherwise noted. Relationships are self-held unless noted. I = Immediate Family Member, Inst = My Institution. Relationships may not relate to the subject matter of this manuscript. For more information about ASCO's conflict of interest policy, please refer to www.asco.org/rwc or ascopubs.org/jco/authors/author-center.
Open Payments is a public database containing information reported by companies about payments made to US-licensed physicians (Open Payments).
E. Shelley Hwang
Stock and Other Ownership Interests: Clinetic
Other Relationship: Exai Bio
No other potential conflicts of interest were reported.
AUTHOR CONTRIBUTIONS
Conception and design: Maggie L. DiNome
Financial support: E. Shelley Hwang
Collection and assembly of data: Samantha M. Thomas, Maggie L. DiNome
Data analysis and interpretation: All authors
Manuscript writing: All authors
Final approval of manuscript: All authors
Accountable for all aspects of the work: All authors
REFERENCES
- 1. Giaquinto AN, Miller KD, Tossas KY, et al. Cancer statistics for African American/Black people 2022. CA Cancer. J Clin. 2022;72:202–229. doi: 10.3322/caac.21718. [DOI] [PubMed] [Google Scholar]
- 2. Bradley CJ, Given CW, Roberts C. Race, socioeconomic status, and breast cancer treatment and survival. J Natl Cancer Inst. 2002;94:490–496. doi: 10.1093/jnci/94.7.490. [DOI] [PubMed] [Google Scholar]
- 3. Ward E, Jemal A, Cokkinides V, et al. Cancer disparities by race/ethnicity and socioeconomic status. CA Cancer J Clin. 2004;54:78–93. doi: 10.3322/canjclin.54.2.78. [DOI] [PubMed] [Google Scholar]
- 4. Du X. Racial disparities in health insurance, triple-negative breast cancer diagnosis, tumor stage, treatment and survival in a large nationwide SEER cohort in the United States. Mol Clin Oncol. 2022;16:95. doi: 10.3892/mco.2022.2528. [DOI] [PMC free article] [PubMed] [Google Scholar]
- 5. Daly B, Olopade OI. A perfect storm: How tumor biology, genomics, and health care delivery patterns collide to create a racial survival disparity in breast cancer and proposed interventions for change. CA Cancer J Clin. 2015;65:221–238. doi: 10.3322/caac.21271. [DOI] [PubMed] [Google Scholar]
- 6. Danforth DN., Jr Disparities in breast cancer outcomes between Caucasian and African American women: A model for describing the relationship of biological and non-biological factors. Breast Cancer Res. 2013;15:208. doi: 10.1186/bcr3429. [DOI] [PMC free article] [PubMed] [Google Scholar]
- 7. Parise CA, Caggiano V. Disparities in race/ethnicity and socioeconomic status: Risk of mortality of breast cancer patients in the California cancer registry, 2000-2010. BMC Cancer. 2013;13:449. doi: 10.1186/1471-2407-13-449. [DOI] [PMC free article] [PubMed] [Google Scholar]
- 8. Cho B, Han Y, Lian M, et al. Evaluation of racial/ethnic differences in treatment and mortality among women with triple-negative breast cancer. JAMA Oncol. 2021;7:1016–1023. doi: 10.1001/jamaoncol.2021.1254. [DOI] [PMC free article] [PubMed] [Google Scholar]
- 9. Newman LA, Kaljee LM. Health disparities and triple-negative breast cancer in African American women: A review. JAMA Surg. 2017;152:485–493. doi: 10.1001/jamasurg.2017.0005. [DOI] [PubMed] [Google Scholar]
- 10. Siddharth S, Sharma D. Racial disparity and triple‐negative breast cancer in African‐American women: A multifaceted affair between obesity, biology, and socioeconomic determinants. Cancers (Basel) 2018;10:514. doi: 10.3390/cancers10120514. [DOI] [PMC free article] [PubMed] [Google Scholar]
- 11. Dietze EC, Sistrunk C, Miranda-Carboni G, et al. Triple-negative breast cancer in African-American women: Disparities versus biology. Nat Rev Cancer. 2015;15:248–254. doi: 10.1038/nrc3896. [DOI] [PMC free article] [PubMed] [Google Scholar]
- 12. Prakash O, Hossain F, Danos D, et al. Racial disparities in triple negative breast cancer: A review of the role of biologic and non-biologic factors. Front Public Health. 2020;8:576964. doi: 10.3389/fpubh.2020.576964. [DOI] [PMC free article] [PubMed] [Google Scholar]
- 13. Zhao F, Miyashita M, Hattori M, et al. Racial disparities in pathological complete response among patients receiving neoadjuvant chemotherapy for early-stage breast cancer. JAMA Netw Open. 2023;6:e233329. doi: 10.1001/jamanetworkopen.2023.3329. [DOI] [PMC free article] [PubMed] [Google Scholar]
- 14. Amirikia KC, Mills P, Bush J, et al. Higher population-based incidence rates of triple-negative breast cancer among young African-American women: Implications for breast cancer screening recommendations. Cancer. 2011;117:2747–2753. doi: 10.1002/cncr.25862. [DOI] [PMC free article] [PubMed] [Google Scholar]
- 15. Zhang W, Bai Y, Sun C, et al. Racial and regional disparities of triple negative breast cancer incidence rates in the United States: An analysis of 2011-2019 NPCR and SEER incidence data. Front Public Health. 2022;10:1058722. doi: 10.3389/fpubh.2022.1058722. [DOI] [PMC free article] [PubMed] [Google Scholar]
- 16. Carey LA, Perou CM, Livasy CA, et al. Race, breast cancer subtypes, and survival in the Carolina Breast Cancer Study. JAMA. 2006;295:2492–2502. doi: 10.1001/jama.295.21.2492. [DOI] [PubMed] [Google Scholar]
- 17. Sturtz LA, Melley J, Mamula K, et al. Outcome disparities in African American women with triple negative breast cancer: A comparison of epidemiological and molecular factors between African American and Caucasian women with triple negative breast cancer. BMC Cancer. 2014;14:62. doi: 10.1186/1471-2407-14-62. [DOI] [PMC free article] [PubMed] [Google Scholar]
- 18. Freedman RA, Ruddy KJ. Who are the patients in our clinical trials for cancer? J Clin Oncol. 2019;37:1519–1523. doi: 10.1200/JCO.19.00382. [DOI] [PubMed] [Google Scholar]
- 19. Blum JL, Flynn PJ, Yothers G, et al. Anthracyclines in early breast cancer: The ABC trials—USOR 06-090, NSABP B-46-I/USOR 07132, and NSABP B-49 (NRG Oncology) J Clin Oncol. 2017;35:2647–2655. doi: 10.1200/JCO.2016.71.4147. [DOI] [PMC free article] [PubMed] [Google Scholar]
- 20. Cortazar P, Zhang L, Untch M, et al. Pathological complete response and long-term clinical benefit in breast cancer: The CTNeoBC pooled analysis. Lancet. 2014;384:164–172. doi: 10.1016/S0140-6736(13)62422-8. [DOI] [PubMed] [Google Scholar]
- 21. Hennessy BT, Hortobagyi GN, Rouzier R, et al. Outcome after pathologic complete eradication of cytologically proven breast cancer axillary node metastases following primary chemotherapy. J Clin Oncol. 2005;23:9304–9311. doi: 10.1200/JCO.2005.02.5023. [DOI] [PubMed] [Google Scholar]
- 22. Boughey JC, McCall LM, Ballman KV, et al. Tumor biology correlates with rates of breast-conserving surgery and pathologic complete response after neoadjuvant chemotherapy for breast cancer: Findings from the ACOSOG Z1071 (Alliance) prospective multicenter clinical trial. Ann Surg. 2014;260:608–614. doi: 10.1097/SLA.0000000000000924. discussion 614-616. [DOI] [PMC free article] [PubMed] [Google Scholar]
- 23. Balmanoukian A, Zhang Z, Jeter S, et al. African American women who receive primary anthracycline- and taxane-based chemotherapy for triple-negative breast cancer suffer worse outcomes compared with white women. J Clin Oncol. 2009;27:e35–e37. doi: 10.1200/JCO.2008.21.5509. author reply e38-e39. [DOI] [PMC free article] [PubMed] [Google Scholar]
- 24. Killelea BK, Yang VQ, Wang SY, et al. Racial differences in the use and outcome of neoadjuvant chemotherapy for breast cancer: Results from the National Cancer Data Base. J Clin Oncol. 2015;33:4267–4276. doi: 10.1200/JCO.2015.63.7801. [DOI] [PubMed] [Google Scholar]
- 25. Chavez-MacGregor M, Litton J, Chen H, et al. Pathologic complete response in breast cancer patients receiving anthracycline- and taxane-based neoadjuvant chemotherapy: Evaluating the effect of race/ethnicity. Cancer. 2010;116:4168–4177. doi: 10.1002/cncr.25296. [DOI] [PMC free article] [PubMed] [Google Scholar]
- 26. Dawood S, Broglio K, Kau SW, et al. Triple receptor-negative breast cancer: The effect of race on response to primary systemic treatment and survival outcomes. J Clin Oncol. 2009;27:220–226. doi: 10.1200/JCO.2008.17.9952. [DOI] [PMC free article] [PubMed] [Google Scholar]
- 27. Sarma M, Perimbeti S, Nasir S, et al. Lack of racial differences in clinical outcomes of breast cancer patients receiving neoadjuvant chemotherapy: A single academic center study. Breast Cancer Res Treat. 2022;192:411–421. doi: 10.1007/s10549-021-06506-y. [DOI] [PMC free article] [PubMed] [Google Scholar]
- 28. Warner ET, Ballman KV, Strand C, et al. Impact of race, ethnicity, and BMI on achievement of pathologic complete response following neoadjuvant chemotherapy for breast cancer: A pooled analysis of four prospective Alliance clinical trials (A151426) Breast Cancer Res Treat. 2016;159:109–118. doi: 10.1007/s10549-016-3918-5. [DOI] [PMC free article] [PubMed] [Google Scholar]
- 29. Roy AM, Patel A, Catalfamo K, et al. Racial and ethnic disparity in preoperative chemosensitivity and survival in patients with early-stage breast cancer. JAMA Netw Open. 2023;6:e2344517. doi: 10.1001/jamanetworkopen.2023.44517. [DOI] [PMC free article] [PubMed] [Google Scholar]
- 30. Li XB, Krishnamurti U, Bhattarai S, et al. Biomarkers predicting pathologic complete response to neoadjuvant chemotherapy in breast cancer. Am J Clin Pathol. 2016;145:871–878. doi: 10.1093/ajcp/aqw045. [DOI] [PubMed] [Google Scholar]
- 31. Gass P, Lux MP, Rauh C, et al. Prediction of pathological complete response and prognosis in patients with neoadjuvant treatment for triple-negative breast cancer. BMC Cancer. 2018;18:1051. doi: 10.1186/s12885-018-4925-1. [DOI] [PMC free article] [PubMed] [Google Scholar]
- 32. Lehmann BD, Bauer JA, Chen X, et al. Identification of human triple-negative breast cancer subtypes and preclinical models for selection of targeted therapies. J Clin Invest. 2011;121:2750–2767. doi: 10.1172/JCI45014. [DOI] [PMC free article] [PubMed] [Google Scholar]
- 33. Burstein MD, Tsimelzon A, Poage GM, et al. Comprehensive genomic analysis identifies novel subtypes and targets of triple-negative breast cancer. Clin Cancer Res. 2015;21:1688–1698. doi: 10.1158/1078-0432.CCR-14-0432. [DOI] [PMC free article] [PubMed] [Google Scholar]
- 34. Lehmann BD, Jovanović B, Chen X, et al. Refinement of triple-negative breast cancer molecular subtypes: Implications for neoadjuvant chemotherapy selection. PLoS One. 2016;11:e0157368. doi: 10.1371/journal.pone.0157368. [DOI] [PMC free article] [PubMed] [Google Scholar]
- 35. Masuda H, Baggerly KA, Wang Y, et al. Differential response to neoadjuvant chemotherapy among 7 triple-negative breast cancer molecular subtypes. Clin Cancer Res. 2013;19:5533–5540. doi: 10.1158/1078-0432.CCR-13-0799. [DOI] [PMC free article] [PubMed] [Google Scholar]
- 36. Santonja A, Sánchez-Muñoz A, Lluch A, et al. Triple negative breast cancer subtypes and pathologic complete response rate to neoadjuvant chemotherapy. Oncotarget. 2018;9:26406–26416. doi: 10.18632/oncotarget.25413. [DOI] [PMC free article] [PubMed] [Google Scholar]
- 37. Echavarria I, López-Tarruella S, Picornell A, et al. Pathological response in a triple-negative breast cancer cohort treated with neoadjuvant carboplatin and docetaxel according to Lehmann's refined classification. Clin Cancer Res. 2018;24:1845–1852. doi: 10.1158/1078-0432.CCR-17-1912. [DOI] [PMC free article] [PubMed] [Google Scholar]
- 38. Davis M, Tripathi S, Hughley R, et al. AR negative triple negative or “quadruple negative” breast cancers in African American women have an enriched basal and immune signature. PLoS One. 2018;13:e0196909. doi: 10.1371/journal.pone.0196909. [DOI] [PMC free article] [PubMed] [Google Scholar]
- 39. Lindner R, Sullivan C, Offor O, et al. Molecular phenotypes in triple negative breast cancer from African American patients suggest targets for therapy. PLoS One. 2013;8:e71915. doi: 10.1371/journal.pone.0071915. [DOI] [PMC free article] [PubMed] [Google Scholar]
- 40. Tseng LM, Chiu JH, Liu CY, et al. A comparison of the molecular subtypes of triple-negative breast cancer among non-Asian and Taiwanese women. Breast Cancer Res Treat. 2017;163:241–254. doi: 10.1007/s10549-017-4195-7. [DOI] [PMC free article] [PubMed] [Google Scholar]
- 41. Ding YC, Steele L, Warden C, et al. Molecular subtypes of triple-negative breast cancer in women of different race and ethnicity. Oncotarget. 2019;10:198–208. doi: 10.18632/oncotarget.26559. [DOI] [PMC free article] [PubMed] [Google Scholar]
- 42. Warner ET, Tamimi RM, Hughes ME, et al. Racial and ethnic differences in breast cancer survival: Mediating effect of tumor characteristics and sociodemographic and treatment factors. J Clin Oncol. 2015;33:2254–2261. doi: 10.1200/JCO.2014.57.1349. [DOI] [PMC free article] [PubMed] [Google Scholar]
- 43. Ortiz Valdez E, Rangel-Escareño C, Matus Santos JA, et al. Characterization of triple negative breast cancer gene expression profiles in Mexican patients. Mol Clin Oncol. 2023;18:5. doi: 10.3892/mco.2022.2601. [DOI] [PMC free article] [PubMed] [Google Scholar]
- 44. Ambrosone CB, Young AC, Sucheston LE, et al. Genome-wide methylation patterns provide insight into differences in breast tumor biology between American women of African and European ancestry. Oncotarget. 2014;5:237–248. doi: 10.18632/oncotarget.1599. [DOI] [PMC free article] [PubMed] [Google Scholar]
- 45. Mehrotra J, Ganpat MM, Kanaan Y, et al. Estrogen receptor/progesterone receptor-negative breast cancers of young African-American women have a higher frequency of methylation of multiple genes than those of Caucasian women. Clin Cancer Res. 2004;10:2052–2057. doi: 10.1158/1078-0432.ccr-03-0514. [DOI] [PubMed] [Google Scholar]
- 46. Ensenyat-Mendez M, Solivellas-Pieras M, Llinàs-Arias P, et al. Epigenetic profiles of triple-negative breast cancers of African American and White females. JAMA Netw Open. 2023;6:e2335821. doi: 10.1001/jamanetworkopen.2023.35821. [DOI] [PMC free article] [PubMed] [Google Scholar]
- 47. Price SN, Flores M, Hamann HA, et al. Ethnic differences in survival among lung cancer patients: A systematic review. JNCI Cancer Spectr. 2021;5:pkab062. doi: 10.1093/jncics/pkab062. [DOI] [PMC free article] [PubMed] [Google Scholar]
- 48. Kumar R, Castillero F, Bhandari S, et al. The Hispanic paradox in non-small cell lung cancer. Hematol Oncol Stem Cell Ther. 2022;15:21–29. doi: 10.1016/j.hemonc.2021.02.004. [DOI] [PubMed] [Google Scholar]
- 49. Patel MI, Schupp CW, Gomez SL, et al. How do social factors explain outcomes in non-small-cell lung cancer among Hispanic patients in California? Explaining the Hispanic paradox. J Clin Oncol. 2013;31:3572–3578. doi: 10.1200/JCO.2012.48.6217. [DOI] [PMC free article] [PubMed] [Google Scholar]
- 50. Arrieta O, Ramírez-Tirado LA, Báez-Saldaña R, et al. Different mutation profiles and clinical characteristics among Hispanic patients with non-small cell lung cancer could explain the "Hispanic paradox". Lung Cancer. 2015;90:161–166. doi: 10.1016/j.lungcan.2015.08.010. [DOI] [PubMed] [Google Scholar]