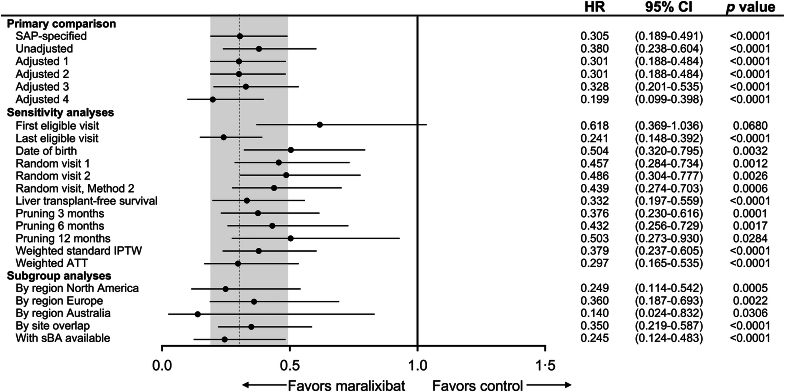
FIGURE 3.
Primary, sensitivity, and subgroup analyses of EFS. Sensitivity and subgroup analyses for the primary comparison included SAP-specified analyses (Cox regression model adjusted for age, sex, total bilirubin, and ALT); Unadjusted [univariate Cox proportional hazards model that only contains treatment as a covariate (EFS)]; Adjusted 1 (Cox regression model adjusted for age, total bilirubin, and GGT); Adjusted 2 (Cox regression model adjusted for age, total bilirubin, GGT, ALT, and region); Adjusted 3 (Cox regression model adjusted for age, total bilirubin, GGT, ALT, sex, and year of birth); and Adjusted 4 (Cox regression model adjusted for age, total bilirubin, GGT, and sBA). Random visit 1 and random visit 2 represent a visit randomly selected uniformly among all eligible visits. Random visit, Method 2 first selected a year at random among all eligible visits and then randomly selected a visit within that year. This was done to account for participants who would have “clusters” of visits due to hospitalization that could skew the selection of a random visit toward that cluster. Landmark time points [x] removed events occurring within either group within the first [x] months of the selected index time. Abbreviations: ALT, alanine aminotransferase; ATT, average treatment effect in the treated; EFS, event-free survival; GGT, gamma-glutamyl transferase; IPTW, inverse probability of treatment weights; SAP, statistical analysis plan; sBA, serum bile acid.

