

Summary
The development and function of the immune system are controlled by temporospatial gene expression programs, which are regulated by cis-regulatory elements, chromatin structure, and trans-acting factors. In this study, we catalogued the dynamic histone modifications and chromatin interactions at regulatory regions during T helper (Th) cell differentiation. Our data revealed that the H3K4me1 landscape established by MLL4 in naive CD4+ T cells is critical for restructuring the regulatory interaction network and orchestrating gene expression during early phase of Th differentiation. GATA3 plays a crucial role in further configuring H3K4me1 modification and chromatin interaction network during Th2 differentiation. Furthermore, we demonstrated HSS3 anchored chromatin loops function to restrict the activity of Th2 locus control region (LCR), thus coordinating the expression of Th2 cytokines. Our results provide insights into the mechanisms of how the interplay between histone modifications, chromatin looping, and trans-acting factors contributes to the differentiation of Th cells.
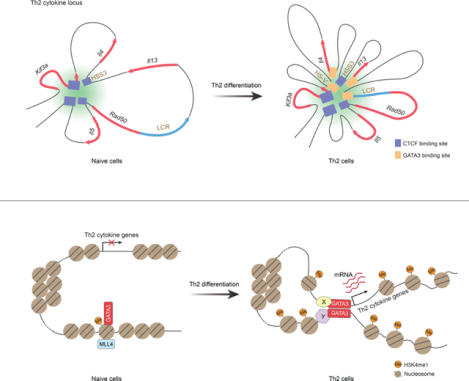
Graphical Abstract
In brief
Cis-regulatory elements and trans-acting factors coordinate to regulate T helper cell differentiation. Liu et al. characterize the histone modification and chromatin interaction dynamics in this process. The H3K4me1 landscape established by MLL4 in naïve CD4+ T cells is critical for rewiring chromatin interaction network orchestrated by GATA3 during Th differentiation.
Introduction
CD4+ Th cells are critical players in adaptive immunity and in the homeostasis of the immune system.1–3 Upon encountering antigens and cytokines stimulation, naive CD4+ T cells can differentiate into Th lineages with distinct functions, including Th1, Th2, Th17, T follicular helper (Tfh), and induced T-regulatory (iTreg) cells.1–4 Th1 and Th2 are the first two Th lineages identified,5 while this dichotomy paradigm has been updated with the discovery of other subsets.6–10 With interferon-γ (IFN-γ) as the signature cytokine, Th1 cells are involved in combating intracellular viral and bacterial pathogens, and are also associated with autoimmune diseases; on the other hand, Th2 cells, with the expression of cytokines, including interleukin (IL)-4, IL-5, IL-9, and IL-13, are responsible for defending against extracellular parasites and venoms, and are also involved in the development of allergic diseases such as asthma.11–13
The polarization of naive CD4+ T cells toward Th1 or Th2 lineages is intricately coordinated by various factors, including antigen stimulation, cytokine milieu, T cell receptor (TCR) activation, signaling pathways, transcription factors, and chromatin configurations.2–4,14–25 External antigen and cytokine cues are transduced into the nuclei through signaling pathways, such as STAT (Signal transducers and activators of transcription), NFAT (Nuclear factor of activated T-cells), mTOR, NF-κB, MAPK (Mitogen-activated protein kinase), and Notch, triggering chromatin remodeling, establishing proper configurations at regulatory elements and recruiting transcription factors, ultimately resulting in generating lineage-specific gene expression profiles with the expression of respective master regulators (T-bet for Th1, GATA3 for Th2) and cytokines.2–4,14–16,18–21,23,24,26–29
Chromatin cis-regulatory elements, such as promoters, enhancers, and silencers, play critical roles in the polarization of Th cells. In Th1, the Ifng gene locus contains multiple proximal and distal enhancers, including CNS-6, CNS-22, CNS-34, and CNS+18–20, which serve as loading sites for key transcription factors such as T-bet, STAT4 and RUNX3, promoting IFN-γ expression.30–41 Similarly, the transcription of Th2 cytokine genes is also regulated by multiple regulatory elements, including enhancers like CGRE (conserved GATA3 response element),42 CNS1,43,44 HS-II,45 HS-V, and HS-VA,46–48 as well as the silencer HS-IV,49 and the locus control region (LCR),50–54 many of which act as binding sites for the Th2 master regulator GATA3.42,55–57
Globally, the genome contains thousands of enhancers and other cis-regulatory elements, whose activity is closely modulated by chromatin modifications such as DNA CpG methylation, histone methylation and acetylation.16,20,58 Despite being scattered in the genome, enhancers are expected to be in spatial proximity to their target promoters to exert effects. Indeed, the spatial interactions of regulatory elements play critical roles in coordinating Th1 and Th2 cytokine expression.54,59–62 Early T cell fate commitment and Th lineage differentiation involve significant changes in three-dimensional (3D) chromatin organization.62–64 Due to technical limitations, genome-wide mapping of the spatial interaction network of regulatory elements to precisely link them with target genes has been difficult, which hampers a comprehensive understanding of the molecular mechanisms by which chromatin modifications, spatial interactions of regulatory elements, and transcription factors collaborate in coordinating Th differentiation.
In this study, we examined the histone modification profiles at different stages of Th1 and Th2 differentiation, and identified loci with shared and cell-specific histone H3K4me1 modification signatures, which represent potentially active or poised regulatory elements for the transcription programs of Th differentiation. We identified chromatin loops among these elements, establishing connections between them and their target genes. By deleting histone methyltransferase Mll4 gene, we demonstrated that the H3K4me1 configuration established by MLL4 in naive cells is critical for structuring the regulatory interaction network, facilitating gene expression during early stage of Th differentiation, and maintaining Th lineage fidelity. Using IL-4/GFP reporter mice, we revealed that chromatin looping between Il4 promoter and its enhancers is associated with the expression of IL-4 in Th2 cells. Deleting CTCF binding site HSS3 further demonstrated that chromatin loops are involved in coordinating Th2 cytokine expression. Using GATA3 deletion mice, we showed that it plays a critical role in establishing H3K4me1 configuration and chromatin interaction network at later stage of Th2 differentiation. Our results provide insights into the cooperation between histone modification, chromatin looping, and trans-acting factors in orchestrating Th differentiation.
Results
H3K4me1 configuration correlates with differentiation status of T helper cells
Chromatin regions harboring transcriptional regulatory elements are associated with histone post-translational modifications. For instance, H3K4me3 marks active promoters, while H3K27ac marks active enhancers, and H3K4me1 is considered a signature of active and primed enhancers.21,65–70 To systematically catalogue the dynamics of chromatin configuration at regulatory elements during Th cell differentiation, we profiled these histone modifications by ChIP-seq and examined gene expression by RNA-seq in naive and polarized CD4+ T cells for 24 hours (early stage) and 72 hours (late stage) under Th1 and Th2 conditions (Figure S1A–S1C; Table S1 and S2). Histone modification and mRNA signals were used for cluster analysis, showing that the samples were clustered by duplicates, polarizing conditions, and time of differentiation (Figure S1B–S1C). Principal Component Analysis (PCA) demonstrated the evolving patterns of these histone modifications and gene expression profiles during Th1 and Th2 differentiation (Figure S1D). Th cells at 24 h exhibited distinct gene expression profiles compared to naive cells, and dramatic differences in gene expression between Th1 and Th2 cells were observed at 72 h (Figure S1C–S1D), indicating the establishment of Th-specific gene expression profile starts at early polarization stage and the separation of Th1 and Th2 is completed after 72 h. The clustering pattern for H3K4me3 was similar to gene expression (Figure S1B–S1D), which was consistent with the notion that H3K4me3 is the signature of active promoters. The development of H3K4me1 and H3K27ac were not synchronous with gene expression changes, as the differentiation-stage specificity became apparent as late as 72 h (Figure S1B–S1D). Especially for H3K4me1, the signal divergence continuously increased (Figure 1A), with naive and Th 24 h cells showing very close profiles, while 72 h Th cells were distinct from early stages (Figure S1B and S1D). Compared to other histone modifications, H3K4me1 marks a broader range of regulatory elements, which is probably the reason why H3K4me1 configuration is more correlated with cell identity.21,71–74 As H3K4me1 may provide more information about the fine-tuning of chromatin landscape for establishing cell-specific gene expression profiles and cell identity, we focused our attention on it. We identified cell-specific H3K4me1 peaks in naive, Th1, and Th2 cells, and examined their dynamics (Figure 1B–1C; Table S2). Naive-specific H3K4me1 peaks decreased at a faster rate in the first 24 hours (Figure 1C, red line), while peaks shared by Th1 and Th2 cells increased steadily during differentiation (Figure 1C, blue line). Conversely, Th1- and Th2-specific peaks exhibited a larger increase slope at later stage (Figure 1C, green and purple lines). These results are exemplified by cell-specific H3K4me1 peaks in Jun, Il2, Stat1 and Il4 gene loci (Figure S1E). The initial fast decrease of naive-specific and slow increase of Th-specific H3K4me1 may be related to TCR signaling-induced cell activation and proliferation, while the fast increase of Th-specific H3K4me1 at later stage may be related to the establishment of Th1 and Th2 polarization.
Figure 1. Th differentiation involves dynamic interplays between H3K4me1 configuration and transcription factor binding.

(A) Information flow analysis for H3K4me1, H3K4me3, and H3K27ac modifications during Th differentiation. Jessen-Shannon divergence was calculated between the 24 h time point and naive, as well as between 72 h and 24 h, based on ChIP-seq signals quantified in unified peaks.
(B) Cell-specific H3K4me1 peaks identified in naive, 72 h Th1, and 72 h Th2 cells. H3K4me1 peaks shared by Th1 and Th2 cells but absent in naive cells were also identified.
(C) The evolvement of different groups of H3K4me1 peaks during Th differentiation. The average profiles (density, Y-axis) for each group at different time point (X-axis) are displayed. The number of peaks for each group is indicated in the brackets.
(D-G) Top enriched consensus motifs of transcription factors in each group of H3K4me1 peaks.
(H-Q) Heatmaps and average profiles of each group of H3K4me1 signals around binding sites of key transcription factors. (H and I) Naive-specific H3K4me1 peaks around ETS1 binding sites in naive cells, (J and K) Th1 and Th2 shared H3K4me1 peaks around IRF4 binding sites in Th1 and Th2 cells, (L and M) Th1-specific H3K4me1 peaks around T-bet binding sites in Th1 cells, (N and O) Th2-specific H3K4me1 peaks around GATA3 binding sites in Th2 cells, (P and Q) Naive-specific H3K4me1 peaks around GATA3 binding sites in naive cell. In these panels, the average signals from H3K4me1 ChIP-seq replicates are displayed. See also Figure S1 and Table S1–S2.
To identify potential transcription factors associated with H3K4me1 modification, we examined the distribution of transcription factor binding motifs in cell-specific H3K4me1 peaks. ETS, RUNX, GATA, and TCF motifs were enriched at naive-specific H3K4me1 peaks (Figure 1D). While AP-1 and IRF motifs were enriched at H3K4me1 peaks shared by Th1 and Th2 (Figure 1E), T-bet and STAT motifs were enriched at Th1-specific H3K4me1 peaks (Figure 1F), and GATA motif was enriched at Th2-specific peaks (Figure 1G). These results are consistent with the known roles of corresponding transcription factors in Th cell differentiation, where ETS1 is important for CD4+ T cell development, AP-1 and IRF4 are involved in T cell activation, and T-bet and GATA3 act as master regulators for Th1 and Th2 cells,2–4,75–80 respectively, suggesting key transcription factors are associated with cell-specific H3K4me1 modification at regulatory elements.
We further examined cell-specific H3K4me1 profiles around the binding sites of representative transcription factors in cells at each stage of differentiation, including ETS1 as naive-specific, T-bet and STAT4 as Th1-specific, GATA3 and STAT6 as Th2-specific, and IRF4 as Th1 and Th2 shared signature transcription factors. H3K4me1 signals are stronger at regions surrounding the binding sites of key transcription factors in corresponding cell-type (Figure 1H–1O, and S1F–S1I). Meanwhile, we observed a depletion of H3K4me1 at the center of transcription factors’ binding sites (Figure 1I, 1K, 1M, 1O, S1G, and S1I). Enriched H3K4me1 was detected around Th1 and Th2-shared, Th1-specific, and Th2-specific IRF4 binding sites (Figure 1J–1K, and S1J–S1M), with the depletion of H3K4me1 emerging as early as 24 hours (Figure 1K). This aligns with the regulatory role of IRF4 in both Th activation and polarization.78,79,81,82 No H3K4me1 depletion was observed at the center of GATA3 binding sites in naive cells (Figure 1P–1Q), suggesting that GATA3 acts as a pioneer transcription factor that can bind nucleosome occupied chromatin in naive cells, and H3K4me1 remodeling at its binding sites takes place during Th2 differentiation.
Taken together, we show that the H3K4me1 profile correlates with the differentiation status of Th cells. Furthermore, cell-specific H3K4me1 peaks are enriched with recognition motifs for signature transcription factors.
Th polarization involves restructuring of the chromatin interaction network
Through analyzing histone modifications, we compiled a comprehensive catalogue of thousands of potential regulatory elements (Table S2), which may regulate the gene expression programs for cellular differentiation or maintenance. To investigate the interplay among them and to systematically identify their potential target genes, we examined the 3D chromatin interaction network by Hi-TrAC assay in cells at each Th differentiation stage (Figure S2A). Hi-TrAC libraries generated a total of 43 to 62 million PETs (paired-end tags) (Table S1), enabling the creation of genome structure maps with 1 kb resolution (Figure S2B). The regulatory interaction network displayed dramatic transformation during Th differentiation. For instance, concurrent with the increased expression of master regulators T-bet and GATA3 in Th1 and Th2 cells, respectively, chromatin interactions between putative enhancers and promoters substantially increased at Tbx21 and Gata3 loci in corresponding cells (Figure S2C–S2D). Some interactions did not show a positive correlation with gene expression. For example, as ETS1 expression decreased in Th cells, certain putative “enhancers” exhibited increased interactions with the Ets1 locus (Figure S2E).
Globally, chromatin interactions between regions spanning approximately 50 kb to 1 Mb increased during Th cell differentiation, while shorter-range interactions (1 Kb to 10 Kb) decreased (Figure 2A). Correspondingly, we identified more chromatin loops with longer genomic distance following differentiation of naive cells (Figure 2B; Table S3). Newly formed loops were predominantly between putative enhancers and promoters (Figure 2C), suggesting that Th cell differentiation induced more enhancer-promoter and enhancer-enhancer chromatin loops, potentially regulating Th-specific gene expression programs. Furthermore, we identified differentiation-stage-specific loops by comparing naive with 24 h and 24 h with 72 h Th cells (Figure 2D; Table S4). With the progression of differentiation, the genomic distance of differentiation-stage-specific loops increased (Figure 2E), and the newly established loops were primarily between putative enhancers and promoters (Figure 2F), indicating that distal regulatory elements are increasingly connected with target genes during differentiation. The expression level of target genes for naive- and 72 h Th-specific loops were higher, while 24 h Th-specific loops’ target genes showed little expression correlation (Figure 2G), suggesting that loops emerging at the early stage of polarization may not directly associate with gene expression, whereas loops established at relatively mature or stable stages of differentiation may directly contribute to target gene expression. This is exemplified with the expression and chromatin interaction profiles of Il12rb2 gene during Th1 differentiation (Figure 2H). Longer distance chromatin loops were gradually established between regulatory elements during Th1 differentiation, which was associated with Il12rb2 expression at 72 h (Figure 2H). Globally, by analyzing RNA-seq and Hi-TrAC data from naive, 72 h Th1 and Th2 cells, we cataloged Th lineage-specific genes and chromatin loops (Figure S2F–S2G; Table S5). A group of lineage-specific genes overlapped with the genes targeted by lineage-specific loops (Figure S2H–S2I; Table S5), suggesting the corresponding loops might be directly involved in regulating these transcription programs, which included signature genes of different Th lineages (Figure S2J; Table S5).
Figure 2. Chromatin interaction network restructures during Th differentiation.

(A) Distribution of relative chromatin interaction PETs density against genomic distance at each differentiation stage. Grey arrow indicates the genomic distance range for increased PETs in Th differentiation.
(B) The numbers (X-axis) and genomic distance distribution (Y-axis) of chromatin loops identified at each differentiation stage.
(C) Chromatin loops catalogued according to the types of cis-regulatory elements at loop anchors at each differentiation stage. Putative enhancers and promoters were defined by histone modification profiles. Genomic regions not annotated as enhancers or promoters are referred to as “others”.
(D) Aggregation analysis of specific loops identified at each differentiation stage. Numbers and enrichment scores (ESs) of specific loops are annotated. ES indicates the aggregated looping signals’ enrichment comparing to nearby regions. The analysis was performed with the cLoops2 callDiffLoops module.
(E) Linear genomic distance distributions of differentiation-stage-specific loops.
(F) Differentiation-stage-specific loops catalogued according to the types of cis-regulatory elements at anchors.
(G) Expression level of target genes of differentiation-stage-specific loops. Target genes were identified by overlapping loop anchors with gene promoters using the anaLoops module in cLoops2 with default parameters. P-values from the Wilcoxon Rank Sum Test are shown.
(H) ChIP-seq, RNA-seq, and Hi-TrAC interaction heatmaps showing histone modification, gene expression, and chromatin interaction profiles at Il12rb2 gene locus during Th1 differentiation. Hi-TrAC data 1D profiles are shown with pileup interaction signals. See also Figure S2 and Table S1–S5.
In summary, we elucidated high-resolution genome-wide interaction networks among putative regulatory elements and examined their dynamics during Th differentiation, providing a valuable resource for understanding the mechanisms of transcription regulation. Our data revealed extensive restructuring of the interaction network during Th differentiation, and demonstrated diverse contributions of chromatin loops to gene expression.
Dynamics of histone modification and chromatin interaction associate with Th2 cytokine expression
To further investigate the correlation between Th-specific gene expression and chromatin landscape, including histone modifications and chromatin interactions, we focused on the Th2 cytokine locus, which is a ~200 kb genomic region harboring three Th2 cytokine genes: Il4, Il13, and Il5. During Th2 differentiation, the expression of Il4 and Il13 was detectable as early as 24 h, whereas Il5 expression was detected at 72 h, meanwhile Gata3 expression remained unchanged at 24 h and increased at 72 h (Figure S3A). The expression of Th2 cytokines are regulated by a dozen of DNase I hypersensitive sites (DHSs) (Figure 3A, top panel), many of which have been characterized.14,42–44,46–58,83,84 Although the Il4 and Il13 expression was detected at 24 h of polarization, no dramatic change of histone modifications was observed at the same time point (Figure 3A and S3B). Nevertheless, in conjunction with the elevation in Th2 cytokine gene expression at 72 h, the H3K4me1, H3K27ac, and H3K4me3 modifications around DHSs substantially transformed (Figure 3A and S3B), indicating the establishment of a novel chromatin configuration.
Figure 3. Th2 cytokine expression correlates with chromatin landscape configuration.

(A) DNase I hypersensitive sites (DHSs) and histone H3K4me1 modification profiles at Th2 cytokine locus in Th2 differentiation. DHSs coordinates are annotated as black blocks in the top track. The average signals from two biological replicates are shown as one track.
(B) A Th2 specific sub-TAD detected by Hi-TrAC at Th2 cytokine locus. Hi-TrAC PETs from replicates were pooled and down-sampled to 35 million for visualization.
(C) Interaction network among DHSs around Il4 and Il13 genes in 72 h Th2 cells. The upper arc plots illustrate significant chromatin interactions with a genomic distance of over 10 kb and more than 15 PETs for 1 kb DHS window. The 1 kb DHS windows are shown as black blocks in the middle panel. The number of PETs for each interaction is annotated above the arcs. Blue arcs represent interactions from LCR; orange arcs represent interactions from HS-V; others are colored in grey. Interaction PETs are also shown as dots in the lower heatmap scatter plot.
(D) The changes of chromatin interactions between GFP negative and positive cells at Th2 cytokine locus are displayed: red color represents increased interactions and blue represents decreased interactions. The changes were measured by subtracting interaction PETs in GFP-negative cells from PETs detected in GFP-positive cells.
(E) Arc plots showing chromatin loops around Il4 and Il13 genes in GFP negative and positive cells. Several significantly changed interactions are highlighted in red, orange, and grey. See also Figure S3 and Table S6.
To study the potential cooperation of chromatin interactions and histone modifications in regulating cytokine gene expression, we examined the 3D chromatin structure at Th2 cytokine locus. Both Hi-TrAC and Hi-C data revealed that a Th2-specific sub-TAD (topologically associating domain) emerged during the differentiation from naive to Th2 cells (Figure 3B and S3C). The Hi-TrAC assay provided a clear and comprehensive view of the organization of regulatory elements at Th2 cytokine locus, which underwent a profound reconfiguration during Th2 differentiation (Figure S3D). While only a handful of loops existed in naive cells, many loops were established among DHSs at 24 h (Figure S3D), which were correlated with the emergence of Il4 and Il13 expression. In concurrence with elevated histone modifications and Th2 cytokine gene expression, chromatin loops increased both in quantity and intensity in 72 h Th2 cells (Figure S3D).
The high resolution Hi-TrAC data allowed us to inspect specific interactions between each pair of regulatory elements across the locus (Figure 3C). Consistent with its known roles in activating Il4 and Il13 expression,50–54 the LCR displayed strong interactions with DHSs of Il13 promoter (HS-1 and HS-2) and Il4 promoter (HS-I and HS-II) (Figure 3C). HS-V also exhibited strong interactions with Il4 and Il13 (Figure 3C), consistent with its enhancer activity for Th2 cytokine gene expression.46–48 These two regulatory regions also interacted with each other and with majority of other DHSs across the locus.
Since only a fraction of in vitro differentiated Th2 cells produce Th2 cytokines, it’s important to determine whether the cytokine producing cells are associated with increased chromatin loops among regulatory regions of the Th2 cytokine locus. For this purpose, we performed Th2 differentiation for 72 hours with naive CD4+ T cells purified from an IL-4/GFP reporter mouse strain, in which the first exon and part of first intron of Il4 was replaced with coding sequence of GFP.85 Hi-TrAC libraries were constructed from GFP-positive and negative cells (Figure S3E), which represented IL-4 expressing and non-expressing Th2 cells, respectively. From Hi-TrAC data, GFP-positive cells displayed stronger chromatin interactions at the Th2 specific sub-TAD, while no substantial difference was observed at the neighboring sub-TAD containing the Irf1 gene (Figure 3D). Specifically, interactions between HS-II, HS-III in Il4 gene and KHS2, KHS3, HS-VA, and LCR were stronger in GFP positive cells (Figure 3E and S3F), indicating that they may contribute to the expression of IL-4. We identified a total of 1,971 differential loops in GFP-negative and positive cells (Figure S3G; Table S6), and found that the target genes of the 826 specific loops in GFP-negative cells were related with transcription and chromatin organization, while the target genes of the 1,145 specific loops in GFP-positive cells were related with the activities of immune cells (Figure S3H; Table S6). These data indicate that the expression of lineage-specific genes in Th2 cells is associated with the establishment of specific chromatin interactions.
In summary, our data revealed that, despite the lack of expression, Th2 cytokine genes and their potential regulatory elements are associated with histone modifications in naive cells. While histone modifications did not change much in general at early stage of differentiation, chromatin looping among regulatory elements became markedly increased, which correlated with the initial expression of Il13 and Il4. High expression of Th2 cytokines at late stage of differentiation was associated with increased histone modifications and the formation of specific chromatin interactions among key regulatory elements.
HSS3 restricts LCR’s activity on Il4 expression
Even though Th2 cytokine genes Il4, Il5, and Il13 are clustered at the Th2 cytokine locus, they exhibit differential expression patterns during Th2 differentiation. IL-4 has a basal expression in naive cells.86,87 It stimulates Th2 differentiation through an IL-4-STAT6-GATA3 positive feedback pathway, leading to increased expression of itself and GATA3, followed by bursts in Il13 and Il5 transcription.88–90 In our in vitro Th2 differentiation system, we also observed an asynchronous expression pattern, with IL-4 and IL-13 expression beginning at early stage (24 h) and IL-5 expression emerging at late stage (72 h) (Figure S3A). To understand the mechanism of differential gene expression at this locus, we examined the existence of CTCF binding sites, which could function to mediate enhancer-promoter interaction or establish chromatin domains to restrict spreading of enhancer activities.91–94 We noticed several sites bound by CTCF in both naive and Th2 cells, one (HSS3) of which located between Il4 and Il13 genes (Figure S4A). In naive cells, HSS3 formed loops with another CTCF-bound site KHS3, located within the Kif3a gene (Figure S3D), suggesting that HSS3 may act as a domain boundary to separate Il4 from Il13 gene or facilitating the interaction of these genes with their enhancers.
To test these hypotheses, we generated a mouse strain HSS3Δ with the deletion of HSS3 using CRISPR-Cas9 (Figure S4B). Compared with wild-type (WT) cells, no dramatic change in H3K4me1, H3K27ac, or H3K4me3 modifications was detected across Th2 cytokine locus in HSS3Δ Th2 cells (Figure S4C), suggesting that establishing histone modifications is independent of HSS3. As expected, the interactions between HSS3 and other elements were abrogated by HSS3 deletion both in naive and 72 h Th2 cells (Figure S4D–S4E). Deleting HSS3 led to increased interactions between LCR and Il4, as well as between the Il4 and Il13 promoter regions (Figure 4A). This was accompanied by elevated Il4 expression and a slight increase in Il13 expression, whereas the expression of Il5 or Gata3 was not affected (Figure 4B and S4F). These results indicate that the CTCF-bound HSS3 functions as a chromatin boundary to restrict the interaction between LCR and Il4 promoter, demonstrating that chromatin loops are directly involved in coordinating the cytokine gene expression during Th2 differentiation.
Figure 4. HSS3 restricts interaction of LCR with Il4.

(A) Chromatin looping profiles in WT and HSS3Δ Th2 cells at the Il4 and Il13 gene locus. Hi-TrAC PETs from replicates were pooled and down-sampled to 60 million for comparison. HSS3 locus is highlighted in grey and marked with a scissor symbol. Red arcs highlight the changes of interactions with Il4 promoter, and black arcs highlight the changes of interactions with HSS3. Some changed interactions are marked with black circles.
(B) RNA-seq results showing the expression of Th2 cytokines and GATA3 in WT and HSS3Δ Th2 cells. Data from two biological replicates are shown. Gene expression fold change (fc) numbers and p-values are annotated. See also Figure S4.
H3K4me1 modification primes regulatory elements in naive cells for establishing chromatin interaction network during Th differentiation
In naive cells, despite the lack of cytokine expression, regulatory elements at Th2 cytokine locus have already acquired histone modification signatures similar to early Th cells (Figure 3A and S3A–S3B), suggesting that these elements may be primed by histone modifications for gene expression in response to cell activation and differentiation signals. To test this hypothesis, we deleted the histone H3 lysine 4 (H3K4) methyltransferase Mll4 (Kmt2d) gene in CD4+ cells. The expression of MLL4, which mainly mediates mono-methylation of H3K4, is high in naive CD4+ T cells and shuts off in differentiated Th cells.64 Naive CD4+ T cells isolated from WT and Mll4fl/flCD4Cre mice were subjected to Th1 and Th2 differentiation, followed by genome-wide analysis of gene expression, histone modifications, and chromatin interactions at different stages.
Globally, the most substantial difference in histone modifications caused by deleting Mll4 was the decrease of H3K4me1 around poised promoters and enhancers at each differentiation stage (Figure S5A). Decreased lineage-specific H3K4me1 peaks were enriched with binding motifs of lineage-related transcription factors, such as ETS, RUNX, and TCF motifs in naive cells (Figure S5B–S5C). Furthermore, we examined the impact of Mll4 deletion on chromatin interactions. Aggregation analyses of all chromatin loops indicated that loop intensity was lower in Mll4 deletion cells than in WT cells at every differentiation stage (Figure S5D). Consistent with this observation, we identified many more decreased than increased chromatin loops in Mll4 deletion cells (Figure 5A; Table S7), suggesting a critical role of the H3K4me1 landscape for establishing chromatin interactions among regulatory elements. We observed that WT specific loops showed longer genomic distance than Mll4 knockout (KO) specific loops (Figure 5B), indicating that deletion of Mll4 disrupted long-range chromatin interactions. The expression of target genes of WT-specific loops exhibited a positive correlation with loops in naive and 72 h Th cells, while showing little correlation in 24 h Th cells (Figure 5C). This is consistent with the notion that loops established at each differentiation stage do not equally contribute to gene expression, with 24 h Th loops not directly promoting gene expression (Figure 2G). However, target genes of Mll4-deletion-specific loops showed positive correlation between expression levels and loops in both early and late Th differentiation stages, but not in naive cells (Figure 5C). These results together demonstrated that deletion of Mll4 disrupted the homeostasis of histone modifications and chromatin interaction network, and impaired gene expression programs in Th differentiation, which is exemplified by the Il3 gene specifically expressed in Th2 cells (Figure S5E).
Figure 5. MLL4-regulated H3K4me1 coordinates the chromatin interaction network and gene expression programs in Th differentiation.

(A) Aggregation analysis of specific loops in WT and Mll4 KO cells at each Th differentiation stage. The numbers and ESs are annotated.
(B) Linear genomic distance of WT and Mll4 KO specific loops at each differentiation stage.
(C) Relative expression level of the target genes of WT and Mll4 KO specific loops at each differentiation stage. P-values from the Wilcoxon Rank Sum Test are shown.
(D-E) H3K4me1, chromatin looping, and expression profiles of Th2 cytokine genes in WT and Mll4 KO 24 h (D) and 72 h (E) Th2 cells. Chromatin looping profiles are shown with interaction matrix heatmaps and arc diagrams. GATA3 ChIP-seq tracks in 72 h Th2 cells are shown in (E).
(F) PCA analysis of H3K4me1 modification and gene expression profiles in WT and Mll4 KO cells at each differentiation stage. See also Figure S5 and Table S7.
At Th2 cytokine locus, Il4 expression decreased in Mll4 deletion cells (Figure 5D and S5F). In naive cells, deletion of Mll4 led to decreased H3K4me1 signals at several DHSs, including LCR, HS-II, HS-IV, HS-V, and KHS-3 (Figure S5G, highlighted in grey). These H3K4me1 changes were maintained in 24 h Th2 cells (Figure S5G and 5D), accompanied by compromised chromatin loops between LCR, HS-II, HS-V and other DHSs (Figure 5D), indicating histone modification and chromatin interaction are important for the function of these DHSs in regulating IL-4 expression.45–54 In Mll4 deletion 72 h Th2 cells, Il5 and Il13 expression increased, accompanied by changes in H3K4me1 profile and chromatin interaction network (Figure 5E, S5F, and S5H). We noticed an H3K4me1 peak emerged at 3’ of Il5 gene, which we named as I5HS-5 (Figure 5E and S5G, highlighted in yellow). I5HS-5 served as a new GATA3 binding site in Mll4 deletion cells (Figure 5E and S5G), and new loops were established from this locus (Figure 5E), which might be related with the increased Il5 expression. These findings indicate that the perturbation of H3K4me1 modification by deleting Mll4 disturbs the wiring of chromatin loops, which impairs the fine tuning of cytokine expression during Th2 differentiation.
Together, we found that potential enhancers for Th2 differentiation are primed by MLL4-regulated H3K4me1 in naive cells, which are important for establishing the chromatin interaction network among regulatory elements and inducing the expression of Th2 cytokine genes in response to differentiation signals. This is consistent with what we observed globally that H3K4me1 exhibited unsynchronized pattern with gene expression in 24 h Th cells, in which a dramatic shift of gene expression was accompanied with a minor change in H3K4me1 (Figure S1B–S1D). The priming effect of MLL4-regulated H3K4me1 was also observed in Th1 differentiation. Take Il12rb1 and Gzmb genes as examples, they were not expressed in naive cells, but were induced during Th1 differentiation, while Mll4 deletion decreased Il12rb1 expression and increased Gzmb expression (Figure S5I). This expression change was accompanied with H3K4me1 profile change, which already existed in naive cells (Figure S5I). Globally, similar to WT cells, Th1 and Th2 polarization caused a dramatic gene expression profile change in Mll4 deletion cells from naive to 24 h (Figure 5F). Deletion of Mll4 changed H3K4me1 configuration in naive cells, and these changes were largely maintained in Th 24 h Mll4 deletion cells (Figure 5F), further demonstrating that MLL4-regulated H3K4me1 configuration may prime naive cells for subsequent gene expression programs during Th polarization. Moreover, we examined the global changes of Th lineage-specific gene expression by Mll4 deletion, and found that the expression of naive-specific genes decreased in naive CD4+ T cells but increased in 24 h Th1 and Th2 cells (Figure S5J, top panel), while the expression of Th1 and Th2-shared genes increased in naive cells but decreased in 24 h Th1 and Th2 cells (Figure S5J, second from top panel). Furthermore, both Th1- and Th2-specific genes showed decreased expression in the corresponding Mll4 deletion Th lineages; meanwhile, their expression increased in the opposite lineages (Figure S5J, bottom two panels). Gene Set Enrichment Analysis (GSEA) on Differentially Expressed Genes (DEGs) between WT and Mll4 deletion cells confirmed the expression changes of Th lineage-specific genes caused by deleting Mll4 (Figure S5K). These results indicate that the H3K4me1 landscape regulated by MLL4 is important for establishing Th lineage identity through orchestrating lineage-specific transcription programs.
GATA3 is essential for establishing Th2-specific H3K4me1 configuration and chromatin structure
Due to the observation that GATA motif was enriched at Th2-specific H3K4me1 peaks (Figure 1G), and alterations in H3K4me1 profile associated with changes in GATA3 binding and the wiring of chromatin interactions at the Th2 cytokine locus (Figure 5E), we examined the potential interplay between GATA3 and chromatin landscape during Th2 differentiation by using Gata3 deletion mouse strains. Even though GATA3 expressed in naive CD4+ T cells (Figure S3A and S6A), no obvious difference in gene expression, histone modification, or chromatin interaction at Th2 cytokine locus was detected in naive cells isolated from WT and Gata3 deletion mice (Figure S6A–S6C). These results suggest that GATA3 is dispensable for the chromatin landscape at this region in naive cells. However, consistent with our previous observation that the absence of GATA3 impaired the H3K4me2 modification in Th2 cells57, Gata3 deletion severely compromised histone modifications H3K4me1, H3K4me3, and H3K27ac (Figure 6A and S6C) and chromatin interaction network (Figure 6B and S6D) at Th2 cytokine locus in 72 h Th2 cells, which abrogated the induction of Th2 cytokine genes (Figure 6C). These results demonstrated an essential role of GATA3 in establishing proper chromatin landscape for Th2 cytokine expression.
Figure 6. GATA3 is essential for establishing the chromatin landscape for Th2 cytokine expression.
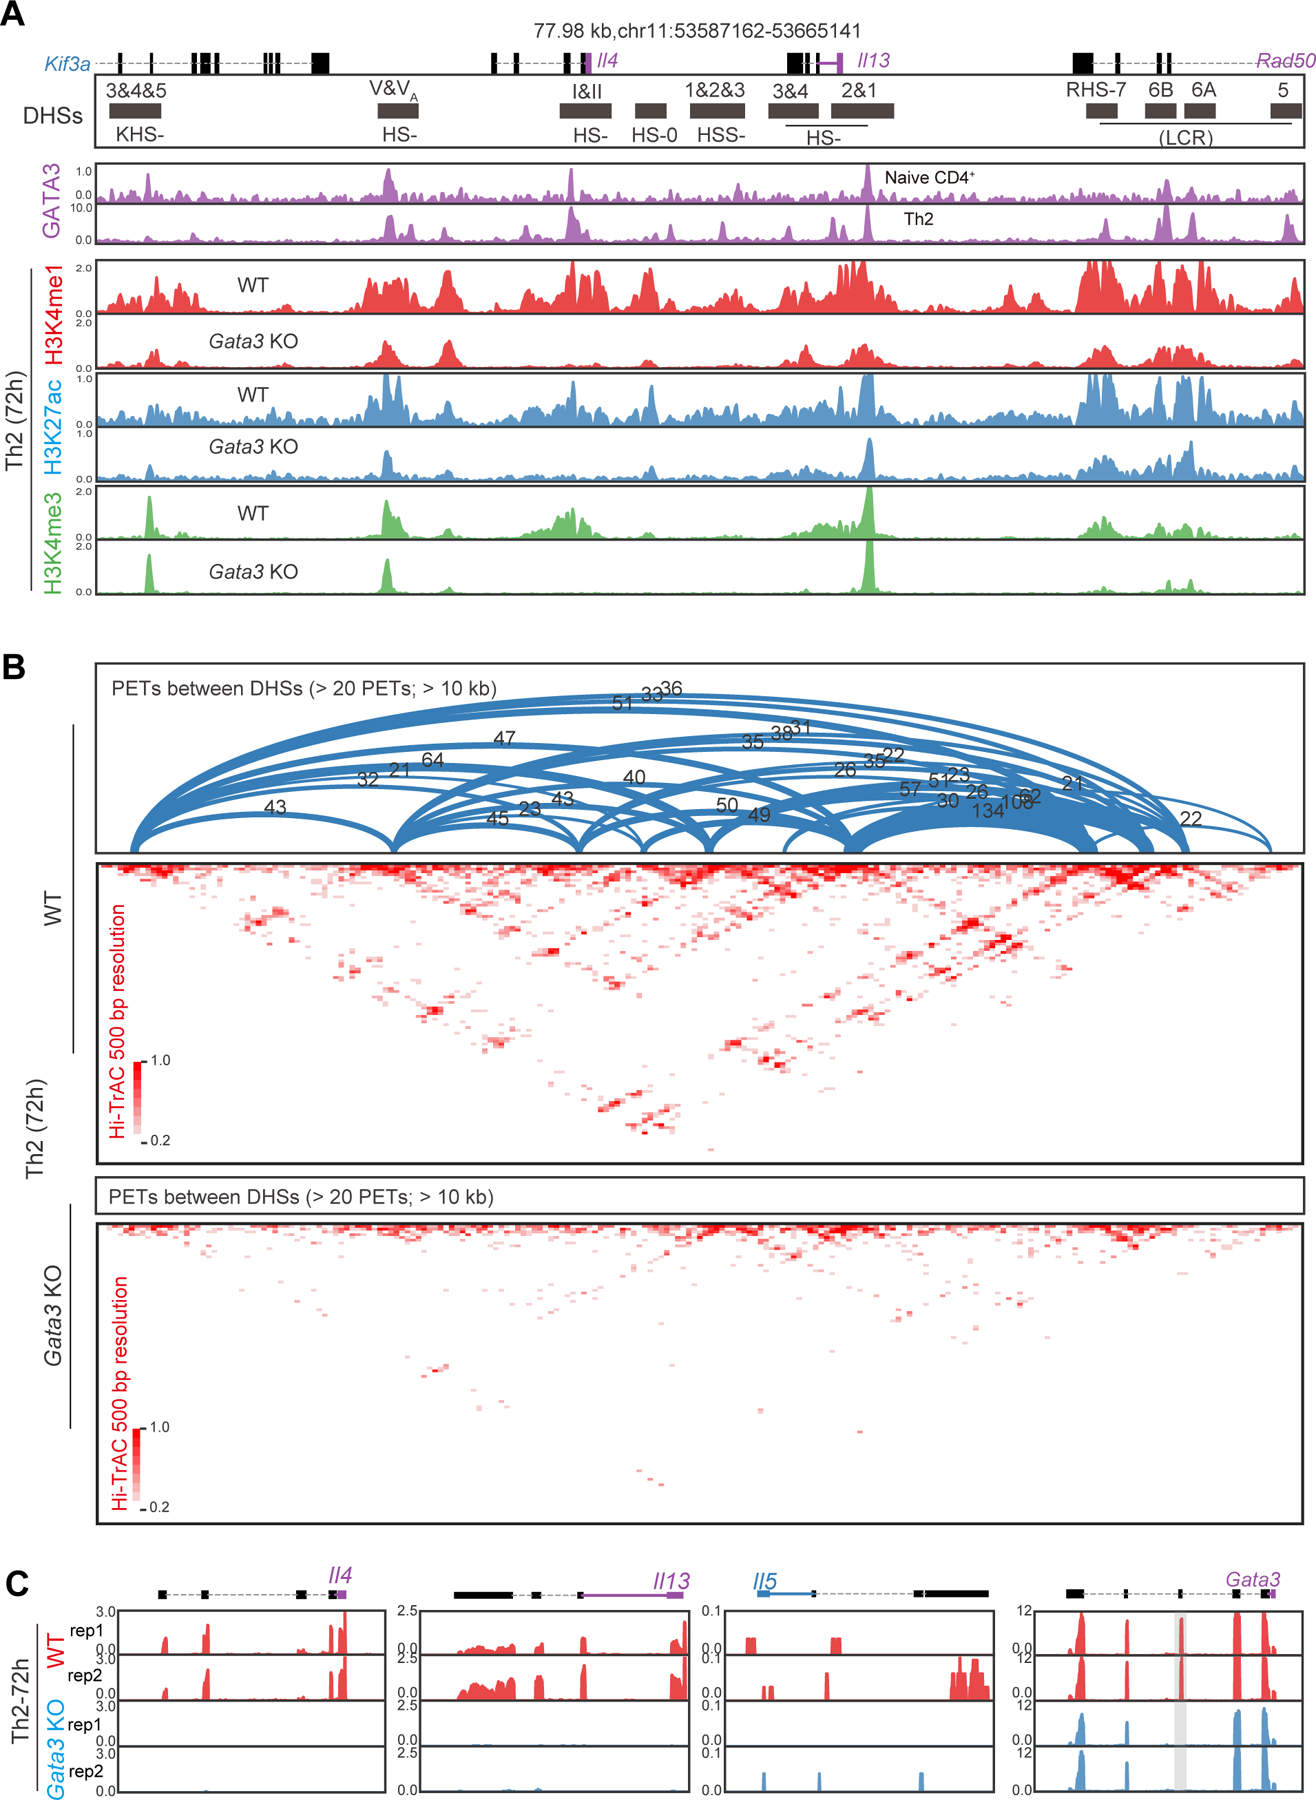
(A) Histone H3K4me1, H3K27ac, and H3K4me3 modification profiles at Il4 and Il13 loci in WT and Gata3 deletion Th2 cells. GATA3 ChIP-seq tracks in WT naive CD4+ and Th2 cells are presented.
(B) Interaction matrix heatmaps and arc diagrams showing chromatin interaction profiles at Il4 and Il13 loci in WT and Gata3 deletion Th2 cells. Hi-TrAC PETs from replicates were pooled and down-sampled to 69 million for comparison.
(C) The expression of Th2 cytokines and GATA3 in WT and Gata3 deletion Th2 cells detected by RNA-seq. Data from two biological replicates are shown. See also Figure S6.
In earlier work, we showed that CNS-28, a silencer bound by GATA3, plays a critical role in the negative regulation of IFN-γ expression in Th1 cells by directly interacting with the enhancer CNS-22, and thus prohibiting its interaction with the Ifng promoter.61 From Hi-TrAC data, we observed reduced interactions between CNS-28 and CNS-22 in Gata3-deleted naive cells (Figure S6E), indicating that GATA3 functions to maintain the interaction between CNS-28 and CNS-22. Thus, the chromatin interaction network mediated by GATA3 is involved in regulating the expression of both Th2 and Th1 cytokine genes.
During Th2 differentiation, deleting Gata3 decreased the expression of Th2-specific genes and increased the expression of Th1-specific genes (Figure S7A). Moreover, the gene expression change was positively correlated with the change in chromatin interactions at transcription start sites (TSSs) (Figure S7B). To further assess if GATA3 plays a broader role in shaping chromatin configuration besides the cytokine genes, we analyzed the changes in H3K4me1 modification and chromatin looping from a genome-wide perspective. We examined the cell-specific H3K4me1 profile around GATA3 binding sites. In naive cells, deleting Gata3 showed little effect on naive-specific H3K4me1 around GATA3 binding sites (Figure 7A, left two panels). In contrast, Gata3 deletion substantially impaired Th2-specific H3K4me1 configuration around GATA3 binding sites, with decreased intensity at flanking regions and a minor depleted signal at the center of GATA3 peaks (Figure 7A, right two panels). These results suggest that GATA3 is involved in shaping the H3K4me1 configuration around its binding sites during Th2 differentiation, but not in naive cells.
Figure 7. GATA3 is involved in establishing the H3K4me1 profile and chromatin loops in Th2 differentiation.

(A) Average profiles of cell-specific H3K4me1 in WT and Gata3 KO naive and Th2 cells around GATA3 binding sites in corresponding cell types.
(B) Correlation analysis between interaction PETs and GATA3 binding intensity at loop anchors in WT naive and Th2 cells. Pearson Correlation Coefficient (PCC) numbers are shown.
(C) Aggregation analysis of chromatin loops in WT and Gata3 KO Th2 cells. Loops are grouped with regard to the occupancy of GATA3 at anchors. The number and ES of each group are shown.
(D) Aggregation analysis of WT and Gata3 KO specific loops in Th2 cells. Loops are grouped with regard to the occupancy of GATA3 at anchors. The number and ES of each group are shown. The percentage of WT and KO specific loops take in corresponding group is presented.
(E) Correlation analysis between the changes in histone modifications and interaction PETs of GATA3 bound loops in Gata3 KO naive and Th2 cells. PCC numbers are shown. See also Figure S7 and Table S7.
To examine whether GATA3 facilitates chromatin loop formation, we compared the intensities of GATA3 binding and chromatin looping. The analysis revealed that while there was almost no correlation between GATA3 binding and chromatin looping intensities in naive cells (Figure 7B, left two panels), the correlation was markedly higher in Th2 cells, especially for loops with both anchors occupied by GATA3 (Figure 7B, right two panels), which are mostly distal loops between enhancers and promoters (Figure S7C–S7D). Furthermore, Gata3 deletion had little effect on chromatin loops in naive cells regardless of if the loop anchors were bound by GATA3 (Figure S7E). However, in Th2 cells, deleting Gata3 reduced the intensities of loops with either one or two anchors bound by GATA3, while it did not cause decrease in the intensities of loops with anchors not bound by GATA3 (Figure 7C). The decreased intensities of GATA3-bound loops were confirmed by Hi-C assay (Figure S7F). These results suggest that GATA3 is involved in establishing interactions among regulatory elements with its occupancy in Th2 cells. To further support this notion, we compared the reduced loops (WT-specific) and enhanced loops (Gata3 deletion-specific) introduced by deleting Gata3 in Th2 cells (Figure S7G, Table S7). Higher fractions of loops were reduced, and lower fractions of loops were enhanced by deleting Gata3 if their anchors were occupied by GATA3 (Figure 7D). Furthermore, Gata3 deletion-induced changes in GATA3 occupied loops showed a positive correlation with the changes of histone modifications at anchors in Th2 but not in naive cells (Figure 7E). The function of GATA3 in lineage-specific gene expression through regulating chromatin interaction network in Th2 cells is exemplified with Th2-specific Il3, Tnp2 loci and Th1-specific Ccr7 locus (Figure S7H–S7I).
Collectively, these results demonstrate that GATA3 plays a crucial role in mediating the remodeling of H3K4me1 landscape at Th2-specific regulatory elements, rewiring the chromatin interaction network, and finally leading to the activation of Th2-specific and repression of Th1-specific gene expression programs.
Discussion
Chromatin modifications, 3D genome structures, and transcription factors are all crucial regulators of gene expression, whereas the coordination of them in the regulation process has not been fully elucidated. In this study, we investigated the cooperative regulation mechanism in Th differentiation by cis- and trans-regulators, involving histone modifications, regulatory chromatin interactions, and transcription factors. Exemplified with the Th2 cytokine locus, we depicted the dynamics and regulatory role of the chromatin landscape in coordinating Th differentiation. Collectively, we propose a model in which MLL4-regulated H3K4me1 configuration in naive cells contributes to the initial restructuring of chromatin interaction network in response to T cell activation and differentiation signals, while key transcription factors such as GATA3 and its potential functional partners are involved in further remodeling H3K4me1 modification at target sites, facilitating spatial contacts between regulatory elements, and ultimately promoting gene expression.
Histone modifications play critical roles in the specificity and plasticity of T cells.25 H3K4me3 is the histone mark for active promoters and critically contributes to transcription elongation,95 whereas H3K27ac is an active enhancer mark, which is important for recruiting transcription factors and establishing enhancer-promoter loops to boost transcription.96,97 By comparison, H3K4me1 is considered to mark both active and poised enhancers, depending on the co-existence of H3K27ac or H3K27me3, respectively,68,69,98 although its function at enhancers is still debatable.99 Several previous studies found H3K4me1 dispensable for enhancer function.100–102 Besides enhancers, H3K4me1 may also mark repressor elements of transcription. Our work identified an H3K4me1-marked CNS-28 element as a silencer for Ifng gene, restraining IFN-γ expression through prohibiting enhancer-promoter loops.61 In this study, we found that cell-type specific H3K4me1 peaks were enriched with binding motifs for key transcription factors of each Th differentiation stage, which exhibited decreased H3K4me1 signals at the center of transcription factor binding sites and increased H3K4me1 signals at flanking regions, suggesting nucleosome remodeling at these regions during Th differentiation. These results are consistent with earlier findings that H3K4me1 may serve as loading sites for transcription factors and ATP-dependent chromatin remodeling SWI/SNF complex.72,103,104 We further observed that deletion of Mll4 led to decreased H3K4me1 in naive cells, consistent with its high expression in these cells. Deletion of Gata3 also compromised the H3K4me1 signals around its binding sites during Th2 differentiation. Since Mll4 is not expressed in differentiated Th2 cells, there may be another histone methyltransferase recruited by GATA3 to mediate the H3K4me1 modification at GATA3-bound regions.
Globally, hundreds of thousands of putative enhancers have been predicted through the analysis of histone modifications and chromatin accessibility profiles. However, it has been difficult to assign the predicted enhancers to their target genes due to the fact that enhancers may act on target promoters over a long distance, sometimes even located within another gene. Functional interaction between a promoter and an enhancer is assumed to require spatial proximity and thus could be revealed by chromatin interaction assays. So far, only a few high-resolution enhancer-promoter interactions have been identified in the differentiation of T helper cells. In this study, we profiled genome-wide interactions among all potential transcriptional regulatory regions in naive CD4+ T, Th1, and Th2 cells using Hi-TrAC, which reached 1 kb resolution and thus was capable of revealing interactions between individual enhancers and promoters. These data allowed us to connect 44K and 31K putative enhancers to their specific target promoters in Th1 and Th2 cells, respectively. Additionally, we identified a total of 30K and 22K enhancer-enhancer interactions in Th1 and Th2 cell, respectively, which may also contribute to the regulation of gene expression. It was reported that inter-chromosomal interactions between Th2 cytokine locus, Ifng locus, and IL-17 locus are involved in regulating the expression of cytokines.105,106 We did not detect significant interactions between these loci, which could be a limitation of Hi-TrAC technique. The existence and function of inter-chromosomal interactions require further investigation. Previous studies demonstrated the critical roles of long-distance interaction between the LCR with target promoters at the Th2 cytokine locus for Il4, Il13 and Il5 expression during Th2 differentiation.54,59 Our work provides a full picture of the dynamic interaction network among all putative and known regulatory elements at the Th2 cytokine locus and new insights into how the interactions are regulated. In particular, we found (1) LCR and HS-V, are the two of the most interactive anchors in the region, interacting with each other and with the majority of DHSs in the region; and (2) the interaction between LCR and Il4 and the LCR activity on Il4 expression are restricted by HSS3, a CTCF-bound DHS.
The precise control of the expression program in Th differentiation is mediated by the interplay between transcription factors and regulatory elements in the genome. GATA3 is recognized as the Th2 master regulator, which promotes Th2-specific and inhibits Th1-specific transcription programs.3,57 Previous studies proposed that GATA3 might function as a pioneer transcription factor mediating chromatin remodeling during cellular reprogramming.107,108 We demonstrated here that GATA3 has a pioneer transcription factor’s ability of binding nucleosome occupied chromatin in naive cells. During Th2 differentiation, it is involved in remodeling H3K4me1 configuration and establishing chromatin loops for Th2-specific gene expression. This provides another perspective for understanding the functions of master regulators. Other transcription factors, such as STAT6, may also be involved in shaping the chromatin landscape in Th2 differentiation.15,109 Further investigation is needed for revealing the cooperation of transcription factors and chromatin remodelers in restructuring the chromatin interaction network required for Th2 specific transcription programs.
All together, we revealed the transformation of chromatin landscape during Th differentiation. The MLL4-regulated H3K4me1 configuration in naive cells contributes to the restructuring of interaction network during early stages of differentiation, and key transcription factors such as GATA3 play critical roles in further transforming the interaction network at later stages of differentiation. Additionally, the high-resolution chromatin architecture maps we elucidated under various conditions could be a useful resource for the field to understand the mechanisms of regulation of gene expression programs by genomic regulatory elements during Th differentiation.
Limitations of the study
In this study, we primarily used in vitro Th differentiation as the model to study the interplays between cis- and trans-regulation. Future work is required to confirm if in vivo Th cells employ the same regulation route during differentiation. MLL4 is highly expressed in naive CD4+ T cells, while its expression substantially decreases during Th differentiation. Which methyltransferase is involved in establishing mature Th-specific H3K4me1 configuration remains to be determined. Lastly, we noticed that GATA3 is involved in chromatin remodeling only at a group of its binding sites. Efforts need to be taken to determine which Th2-specific regulators are associated with this selectivity.
STAR Methods
Resource availability
Lead contact
Further information and requests for resources and reagents should be directed to and will be fulfilled by the lead contact, Keji Zhao (zhaok@nhlbi.nih.gov).
Materials availability
All special reagents generated in this study will be available upon request. A material transfer agreement (MTA) with our institute may be required.
Data and code availability
The sequencing data including ChIP-seq, RNA-seq, Hi-C and Hi-TrAC data have been deposited in the Gene Expression Omnibus database with accession number: GSE237916.
All codes used for data analysis in this work are public and listed in the Key resources table.
Any additional information required to reanalyze the data reported in this paper is available from the lead contact upon request.
Key resources table
| REAGENT or RESOURCE | SOURCE | IDENTIFIER |
|---|---|---|
| Antibodies | ||
| anti-mouse CD3ε | eBioscience | Cat# 16-0031-82, RRID: AB_468847 |
| anti-mouse CD28 | eBioscience | Cat# 14-0281-82, RRID: AB_467190 |
| anti-mouse IFNγ | Bio X Cell | Cat# BE0055, RRID: AB_1107694 |
| Anti-mouse IL-4 | Bio X Cell | Cat# BE0045, RRID: AB_1107707 |
| Anti-mouse IL-12 | eBioscience | Cat# 16-7123-81, RRID: AB_469232 |
| anti-H3K4me1 | Abcam | Cat# ab8895, RRID: AB_306847 |
| anti-H3K4me3 | Millipore | Cat# 17–614, RRID: AB_11212770 |
| anti-H3K27ac | Abcam | Cat# ab4729, RRID: AB_2118291 |
| anti-GATA3 | BD bioscience | Cat# 558686, RRID: AB_2108590 |
| Chemicals, peptides, and recombinant proteins | ||
| Recombinant Mouse IL-12 Protein | R&D SYSTEMS | Cat# 419-ML |
| Recombinant Mouse IL-4 Protein | R&D SYSTEMS | Cat# 404-ML |
| Recombinant Mouse IL-2 Protein | R&D SYSTEMS | Cat# 402-ML |
| Formaldehyde | Thermo Scientific | Cat# 28908 |
| Proteinase K | Roche | Cat# 03115828001 |
| T4 DNA polymerase | New England Biolabs | Cat# M0203L |
| CviQI | New England Biolabs | Cat# R0639L |
| CviAII | New England Biolabs | Cat# R0640L |
| BfaI | New England Biolabs | Cat# R0568L |
| MluCI | New England Biolabs | Cat# R0538L |
| NlaIII | New England Biolabs | Cat# R0125L |
| Klenow fragment (3’->5’ exo-) | New England Biolabs | Cat# M0212L |
| T4 DNA Ligase | New England Biolabs | Cat# M0202L |
| T7 DNA Ligase | New England Biolabs | Cat# M0318L |
| Dynabeads MyOne Streptavidin C1 beads | Invitrogen | Cat# 65001 |
| Dynabeads Protein A for Immunoprecipitation | Invitrogen | Cat# 10002D |
| QIAzol Lysis Reagent | Qiagen | Cat# 79306 |
| Critical commercial assays | ||
| EasySep™ Mouse Naive CD4+ T cell Isolation Kit | STEMCELL | Cat# 17965A |
| RNeasy Mini Kit | Qiagen | Cat# 74104 |
| End-It DNA-Repair kit | Epicentre | Cat# ER0720 |
| Deposited data | ||
| Mice Naive, Th1 (24h, 72h) and Th2 (24h, 72h) WT vs. Mll4 KO RNA-seq, ChIP-seq (H3K4me1, H3K4me3, H3K27ac) | This manuscript | GEO accession#: GSE23 7916 |
| Mice Th1 (24h, 72h) and Th2 (24h, 72h) WT vs. Mll4 KO Hi-TrAC | This manuscript | GEO accession#: GSE23 7916 |
| Mice Th2 (72h) WT vs. HSS3 deletion RNA-seq, ChIP-seq (H3K4me1, H3K4me3, H3K27ac) and Hi-TrAC | This manuscript | GEO accession#: GSE23 7916 |
| Mice Th2 (72h) WT vs. Gata3 KO Hi-C | This manuscript | GEO accession#: GSE23 7916 |
| Mice Naive and Th2 (72h) WT vs. Gata3 KO RNA-seq, ChIP-seq (H3K4me1, H3K4me3, H3K27ac) and Hi-TrAC | This manuscript | GEO accession#: GSE23 7916 |
| Mice IL-4/GFP positive vs. negative Th2 Hi-TrAC | This manuscript | GEO accession#: GSE23 7916 |
| ETS1 ChIP-seq from mice naive CD4+ cells | 110 | GEO accession#: GSM999187 |
| IRF4 ChIP-seq from mice Th1 CD4+ cells | 111 | GEO accession#: GSM5257931 |
| IRF4 ChIP-seq from mice Th2 CD4+ cells | 112 | GEO accession#: GSM2538525 |
| T-bet ChIP-seq from mice Th1 CD4+ cells | 61 | GEO accession#: GSM6202869 |
| GATA3 ChIP-seq from mice Th2 CD4+ cells | 113 | GEO accession#: GSM1829645 |
| GATA3 ChIP-seq from mice naive CD4+ cells | 61 | GEO accession#: GSM6202870 |
| STAT4 ChIP-seq from mice Th1 CD4+ cells | 29 | GEO accession#: GSM550303 |
| STAT6 ChIP-seq from mice Th2 CD4+ cells | 29 | GEO accession#: GSM550311 |
| Hi-TrAC data from mice WT vs. Mll4 KO naive CD4+ cells | 61 | GEO accessions#: GSM6946693 GSM6946694 GSM6946695 GSM6946696 GSM6946697 GSM6946698 GSM6946699 GSM6946700 GSM6946701 GSM6946702 GSM6946703 GSM6946704 |
| Hi-C data from mice naive CD4+ cells | 64 | GEO accession#: GSM1694157 GSM1694159 GSM1694160 |
| DNase-seq data from mice Th2 CD4+ cells | 114 | GEO accession#: GSM5253165 GSM5253166 |
| CTCF ChIP-seq from mice Th2 CD4+ cells | 115 | GEO accession#: GSM1620003 |
| CTCF ChIP-seq from mice naive CD4+ cells | 61 | GEO accessions#: GSM6202871 |
| Experimental models: Organisms/strains | ||
| Mouse: Mll4fl/flCD4Cre | 64 | N/A |
| Mouse: IL-4/GFP (G4) | 85 | N/A |
| Mouse: Gata3fl/fl | 35 | N/A |
| Mouse: hCD2Cre | JAX | Line 027406 |
| Mouse: CreERT2 | Taconic | Line 10471 |
| Mouse: HSS3Δ | This paper | N/A |
| Oligonucleotides | ||
| HSS3Δ sgRNA-1: GACTAGCTGTGGACCCCTAG | IDT | N/A |
| HSS3Δ sgRNA-2: GGCTCCTTTTGGAACTGGAC | IDT | N/A |
| Software and algorithms | ||
| Python (v3) | Python Community | https://www.python.org |
| seaborn (v0.11.0) | 116 | https://seaborn.pydata.org |
| SciPy (v1.2.1) | 117 | https://scipy.org |
| Bowtie2 (v.2.3.5) | 118 | https://bowtie-bio.sourceforge.net/bowtie2/index.shtml |
| STAR (v2.7.3a) | 119 | https://github.com/alexdobin/STAR |
| Cuffdiff (v2.2.1) | 120 | https://github.com/cole-trapnell-lab/cufflinks |
| deepTools2 (v3.3.0) | 121 | https://deeptools.readthedocs.io/en/develop/ |
| HiCUP (v0.7.2) | 122 | https://www.bioinformatics.babraham.ac.uk/proiects/hicup/ |
| cLoops2 (v0.0.5) | 123 | https://github.com/YaqiangCao/cLoops2 |
| HOMER (v4.10.4) | 124 | http://homer.ucsd.edu/homer/ |
| WashU Epigenome Browser | 125 | http://epigenomegateway.wustl.edu |
| GSEApy (v0.9.18) | 126 | https://github.com/zqfang/GSEApy |
| Bedtools (v2.27.1) | 127 | https://github.com/arq5x/bedtools2 |
Experimental Model and Study Participant Details
Mice
Mll4fl/flCD4Cre, IL-4/GFP (G4) reporter, and Gata3fl/fl mice were reported previously.35,64,85 Gata3fl/fl mice were crossed with either CreERT2 (Taconic, line 10471) or hCD2Cre (JAX, line 027406) mice. HSS3Δ mice were generated by CRISPR/Cas9 method with sgRNAs: sgRNA-1, GACTAGCTGTGGACCCCTAG; sgRNA-2, GGCTCCTTTTGGAACTGGAC. Mice were bred and maintained in NHLBI animal facility. Experiments were done with 8 to 12 weeks old mice under protocols approved by the NHLBI Animal Care and Use Committee.
Method details
In vitro Th1 and Th2 cell differentiation
Mouse naive CD4+ T cells were purified from lymph nodes with EasySep™ Mouse Naive CD4+ T cell Isolation Kit (STEMCELL, #17965A). Naive CD4+ T cells were activated with plate-bound anti-CD3ε (1 μg/mL, eBioscience, clone: 145-2C11), anti-CD28 antibodies (1 μg/mL, eBioscience, clone: 37.51), and cultured in complete RPMI1640 media under Th1 condition with anti-IL-4 (10 μg/mL), IL-12 (10 ng/mL), IL-2 (5 ng/mL), or under Th2 condition with anti-IFNγ (10 μg/mL), anti-IL-12 (10 μg/mL), IL-2 (5 ng/mL), IL-4 (10 ng/mL). Cells were collected and examined after 24 (early stage) or 72 (late stage) hours.
Flow cytometry
For intracellular staining, cells were cultured as described above and simulated with PMA (10 ng/mL, Sigma), ionomycin (1 μM, Sigma), and Monensin (1 μg/mL, BD Biosciences) in culture medium for 4 hours at 37°C. Cells were collected and washed with FACS buffer (PBS with 2% FBS), and surface markers were stained in FACS buffer for 30 minutes at 4°C. Cells were then washed with FACS buffer and fixed with 4% PFA at room temperature for 10 minutes. Treat cells with permeabilization buffer (PBS with 0.1% BSA and 0.5% Triton X-100) at room temperature for 10 minutes, then stain with antibodies at 4°C for 30 minutes. Data was collected on Flow cytometers.
RNA-seq
RNA from 5,000 cells were extracted and purified with QIAzol Lysis Reagent (QIAGEN) and RNeasy mini kit (QIAGEN). RNA-seq libraries were constructed with purified RNA following Smart-seq2 method. Libraries were sequenced on Illumina platforms.
ChIP-seq
ChIP-seq was performed as described previously.128 Cells were fixed with 1% Formaldehyde, and chromatin was fragmented by sonication. Chromatin immunoprecipitation was performed with antibodies: anti-H3K4me1 (ab8895, Abcam), anti-H3K4me3 (17–614, Millipore), anti-H3K27ac (ab4729, Abcam), and anti-GATA3 (558686, BD bioscience). Elute DNA from beads and purify. Construct libraries by performing end-repair, A-tailing, adapter ligation, and PCR indexing and amplification. Libraries were sequenced on Illumina platforms.
Hi-C assay
Hi-C was performed as described previously.115 Cells were fixed with 1% formaldehyde for 10 minutes at room temperature. Cells were lysed, and the chromatin was decondensed, and then digested with restriction enzymes CviQI, CviAII, and BfaI. The ends of chromatin DNA were blunted and labeled with biotin by Klenow enzyme in the presence of dGTP, dCTP, dTTP, and biotin-14-dATP. Proximity ligation was performed with T4 DNA ligase. Crosslinking was reversed, and then free DNA ends with biotin labels were removed by T4 DNA polymerase. DNA was fragmented by sonication, then followed by end-repair, and A-addition. Biotinylated DNA fragments were purified with Dynabeads MyOne Streptavidin C1 beads (Invitrogen), and then ligated with Illumina Paired End adapters. Libraries were amplified by PCR, and sequenced on Illumina platforms.
Hi-TrAC
Hi-TrAC was performed as described previously.128 Cells were fixed with 1% Formaldehyde. To bridge interacting chromatin, cells were incubated with transposase complex. Genomic DNA was purified after reverse cross-linking. After repairing the gaps with T4 DNA polymerase, genomic DNA was digested with MluCI and NlaIII restriction enzymes, and biotin labeled DNA fragments was enriched with streptavidin beads. Adapter ligation was performed on beads, and libraries were then indexed and amplified by PCR. Sequencing was performed on Illumina platforms.
Sequencing data bioinformatics analysis
For all analyses, we utilized the mouse reference genome mm10 and annotations from GENCODE (M21).129 The RNA-seq, ChIP-seq, Hi-C, and Hi-TrAC data generated in this study were pre-processed from raw reads to expression level, differentially expressed genes (DEGs) analysis, mapped reads or tracks (bigWig files) following the procedures outlined in our previous studies.61,130 This manuscript showcases average signals from at least two biological replicates of RNA-seq or ChIP-seq as one track, represented as genome browser-like plots. Furthermore, the manuscript includes heatmaps of pooled and down-sampled equal reads from Hi-TrAC or Hi-C data.
In the comparison of wild-type (WT) vs. Mll4 KO H3K4me1, H3K4me3, and H3K27ac data, reads from replicates of the same cell type were combined and down-sampled to 30 million, 23 million, and 36 million, respectively, for all subsequent downstream quantitative analyses. The identification of H3K4me1, H3K4me3, and H3K27ac peaks from WT cells were performed using the cLoops2 callPeaks module (v0.0.5)123 with the settings of -eps 75 -minPts 10,20 -sen. Overlapped peak regions present in at least two cell types were compiled together to create union sets for further analysis. To obtain module specific H3K4me1 peaks, we performed comparisons of signal densities within peaks for the following conditions: Naive vs. mean of Th1 (72h) & Th2 (72h), Th1 (72h) vs. mean of Naive & Th2 (72h), and Th2 (72h) vs. mean of Naive & Th1 (72h). The Poisson test was employed, and differential peaks were selected using cutoffs of p-value < 1e-5 and fold change > 2. In the comparison of A vs. the mean of B & C, highly enriched peaks in condition A are defined as the module-specific peaks (Naive module, Th1 module, and Th2 module). Meanwhile, the Th1&Th2 module is defined from the highly enriched peaks obtained by comparing mean of Th1 (72h) & Th2 (72h) vs. Naive conditions, with no overlapping from the Th1 module and Th2 module. We also employed the same strategy as described previously130 to use the overlapped regions from peaks of H3K4me1, H3K4me3, and H3K27ac as putative genomic segments for enhancers and promoters in each cell type. Employing the findMotifsGenome.pl script (-mset vertebrates) from the HOMER package (v4.10.4)124, we performed the motif analysis on the identified cell-specific H3K4me1 peaks. We focused on known motifs with the highest enrichment, applying a stringent p-value cutoff of 1e-10 to ensure statistical significance.
ChIP-seq data for key transcription factors ETS1, IRF4, T-bet, GATA3, STAT4, and STAT6 were meticulously gathered from diverse published studies.29,61,110–113 All datasets were mapped as single-end data to ensure consistency. Utilizing the cLoops2 callPeaks module with parameters (-eps 150 -minPts 10,20 -p 20), we identified binding sites for these transcription factors. To delve deeper into the interplay between transcription factors and chromatin landscape, we pinpointed overlaps between these binding sites and cell-specific H3K4me1 peaks. ChIP-seq heatmaps for these binding sites were generated by deepTools2 (v3.3.0).121
To identify Hi-TrAC loops from WT Naive,61 Th1 (24h and 72h) and Th2 (24h and 72h) cells, paired-end tags (PETs) processed by the script tracPre2.py in the cLoops2 package from biological replicates were combined and down-sampled to 35 million. Then loops were called by the cLoops2 callLoops module with settings of -eps 250,500,1000 -minPts 10,20 -cut 1000 -mcut 5000000, requiring at least 10 PETs supporting a confident loop. We employed putative genomic segments defined from histone markers to annotate the loop type in each cell type. Differentiation-stage specific loops were obtained by the compassion between Naive vs. 24h (Th1 or Th2) and 24h vs. 72h (Th1 or Th2) with the cLoops2 callDiffLoops module and key settings of -customize -cacut 2 -cmcut 1 -noPCorr -pcut 0.001. The settings for calling differential loops were consistently used throughout this study when comparing lineage-specific loops, IL-4/GFP positive vs. negative, WT vs. Mll4 KO, and comparing WT vs. Gata3 KO. The target genes of these specific loops were identified using the anaLoops module in cLoops2. Visualizations of Hi-TrAC data 1D signal, ChIP-seq or RNA-seq tracks, arches showing the number of PETs for loops or combinations of DNA hypersensitive sites (DHSs), and heatmaps or scatter plots were generated using the cLoops2 plot module. Only PETs with a distance greater than 1 kb were used to plot the decay of interaction densities with genomic distance to show the genome-wide effect of during differentiation or effect of Mll4 KO. During the comparison of WT vs. Mll4 KO Hi-TrAC data, PETs in Naive cells were down-sampled to 35.5 million, PETs in Th1 (24h) were down-sampled to 30 million, PETs in Th1 (72h) were down-sampled to 21.5 million, PETs in Th2 (24h) were down-sampled to 30 million, and PETs in Th2 (72h) were down-sampled to 33 million for quantitative analysis. During the comparison of WT vs. HSS3 deletion Hi-TrAC data, PETs in Naive cells were down-sampled to 39 million and PETs in Th2 (72h) cells were down-sampled to 60 million. During the comparison of WT vs. Gata3 KO Hi-TrAC data, PETs in Naive cells were down-sampled to 18 million and PETs in Th2 (72h) cells were down-sampled to 69 million. To calculate the Pearson correlation coefficient between ChIP-seq and Hi-TrAC at loop anchors, for one loop two anchors marked as x and y, integrated ChIP-seq count at anchors is measured as , where rx or ry is the reads counts from ChIP-seq signal for anchor x or y.
Using Cuffdiff (v2.2.1),120 we identified lineage-specific genes by comparing RNA-seq data: Th1 vs. Naive/Th2 (A), Th2 vs. Naive/Th1 (B), and Th1 vs. Th2 (C). P-value < 0.05 and fold change >2 thresholds were applied. Overlapping genes from A (up) & C (up) defined Th1-specific; B (up) & C (down) defined Th2-specific; A (down) & B (down) defined Naive-specific; remaining upregulated in A (up) & B (up) were Th1&Th2 shared. To evaluate Mll4 KO’s impact on lineage-specific gene expression, we conducted Gene Set Enrichment Analysis (GSEA) using GSEApy.126 We inputted lineage-specific gene sets in GMT format and ranked WT vs. Mll4 KO DEGs by fold change.
Tpinpoint lineage-specific Hi-TrAC loops, we compared loop interaction densities across three conditions: Naive vs. mean of Th1 and Th2 (72h), Th1 (72h) vs. mean of Naive and Th2 (72h), and Th2 (72h) vs. mean of Naive and Th1 (72h). Employing a Poisson test and stringent cutoffs (p-value < 1e-5 and fold change > 2), we selected differential loops, defining those highly enriched in a condition as lineage-specific. We also quantified loops shared between Th1 (72h) and Th2 (72h), applying the same criteria to compare their mean interaction density to Naive and identify Th1&Th2 shared specific loops.
The Hi-C data generated for WT vs. Gata3 KO were processed into PETs using HiCUP (v0.7.2). Specifically, restriction fragments were generated by hiccup_digester –genome mm10 –re1 G^TAC, CviQI: C^ATG, CviAII: C^TAG, BfaI and all other parameters were kept default. Filtered PETs by HiCUP with suffix of wrong_size.filter were rescued for the following analysis. Hi-C replicates were pooled together and down-sampled to equal 640 million unique intra-chromosomal interacting PETs both for WT and KO sample for all following analyses.
Quantification and statistical analysis
FlowJo software was used for analyzing flow cytometry data, and statistical analysis was performed using Prism software. Statistical test used in this study for sequencing data, such as Poisson test, Wilcoxon Rank Sum Test and Wilcoxon signed-rank test, were performed with SciPy (v1.2.1).117
Supplementary Material
Table S2. Histone modification peaks and genomic segments for each cell type, Related to Figure 1 and Figure 2
Table S3. Hi-TrAC detected loops in Naive, Th1, and Th2 cells, Related to Figure 2
Table S4. Th differentiation stage-specific loops, Related to Figure 2
Table S5. Th lineage-Specific genes and loops, Related to Figure 2
Table S6. IL-4_GFP positive- and negative-specific loops and target genes, Related to Figure 3
Table S7. Specific Hi-TrAC loops for WT, Mll4 KO, and Gata3 KO cells, Related to Figure 5 and Figure 7
Highlights.
Chromatin interaction network reconfigures during Th differentiation.
H3K4me1 profile set up by MLL4 in naive T cells primes chromatin for reorganization.
CTCF binding site HSS3 restrains LCR-Il4 promoter interaction and IL-4 expression.
GATA3 coordinates the chromatin interaction network for Th2-specific gene expression.
Acknowledgements
We thank the NHLBI DNA Sequencing Core facility for sequencing NGS libraries; the NHLBI Flow Cytometry Core facility and NCI CCR Flow Cytometry Core facility for sorting the cells; and NHLBI Transgenic Core facility for generating the HSS3 knockout mouse strain. The authors utilized the computational resources of the NIH HPC Biowulf cluster (http://hpc.nih.gov). This research was supported by the Intramural Research Programs of National Heart, Lung, and Blood Institute, National Cancer Institute, and National Institute of Allergy and Infectious Diseases of National Institutes of Health.
Footnotes
Publisher's Disclaimer: This is a PDF file of an unedited manuscript that has been accepted for publication. As a service to our customers we are providing this early version of the manuscript. The manuscript will undergo copyediting, typesetting, and review of the resulting proof before it is published in its final form. Please note that during the production process errors may be discovered which could affect the content, and all legal disclaimers that apply to the journal pertain.
Declaration of interests
The authors declare no competing interests.
References
- 1.Murphy KM, and Reiner SL (2002). The lineage decisions of helper T cells. Nat Rev Immunol 2, 933–944. 10.1038/nri954. [DOI] [PubMed] [Google Scholar]
- 2.Zhu J, Yamane H, and Paul WE (2010). Differentiation of effector CD4 T cell populations (*). Annu Rev Immunol 28, 445–489. 10.1146/annurev-immunol-030409-101212. [DOI] [PMC free article] [PubMed] [Google Scholar]
- 3.Zhu J (2018). T Helper Cell Differentiation, Heterogeneity, and Plasticity. Cold Spring Harb Perspect Biol 10. 10.1101/cshperspect.a030338. [DOI] [PMC free article] [PubMed] [Google Scholar]
- 4.Saravia J, Chapman NM, and Chi H (2019). Helper T cell differentiation. Cell Mol Immunol 16, 634–643. 10.1038/s41423-019-0220-6. [DOI] [PMC free article] [PubMed] [Google Scholar]
- 5.Mosmann TR, Cherwinski H, Bond MW, Giedlin MA, and Coffman RL (1986). Two types of murine helper T cell clone. I. Definition according to profiles of lymphokine activities and secreted proteins. J Immunol 136, 2348–2357. [PubMed] [Google Scholar]
- 6.Sakaguchi S, Sakaguchi N, Asano M, Itoh M, and Toda M (1995). Immunologic self-tolerance maintained by activated T cells expressing IL-2 receptor alpha-chains (CD25). Breakdown of a single mechanism of self-tolerance causes various autoimmune diseases. J Immunol 155, 1151–1164. [PubMed] [Google Scholar]
- 7.Harrington LE, Hatton RD, Mangan PR, Turner H, Murphy TL, Murphy KM, and Weaver CT (2005). Interleukin 17-producing CD4+ effector T cells develop via a lineage distinct from the T helper type 1 and 2 lineages. Nat Immunol 6, 1123–1132. 10.1038/ni1254. [DOI] [PubMed] [Google Scholar]
- 8.Park H, Li Z, Yang XO, Chang SH, Nurieva R, Wang YH, Wang Y, Hood L, Zhu Z, Tian Q, and Dong C (2005). A distinct lineage of CD4 T cells regulates tissue inflammation by producing interleukin 17. Nat Immunol 6, 1133–1141. 10.1038/ni1261. [DOI] [PMC free article] [PubMed] [Google Scholar]
- 9.Acosta-Rodriguez EV, Rivino L, Geginat J, Jarrossay D, Gattorno M, Lanzavecchia A, Sallusto F, and Napolitani G (2007). Surface phenotype and antigenic specificity of human interleukin 17-producing T helper memory cells. Nat Immunol 8, 639–646. 10.1038/ni1467. [DOI] [PubMed] [Google Scholar]
- 10.Chtanova T, Tangye SG, Newton R, Frank N, Hodge MR, Rolph MS, and Mackay CR (2004). T follicular helper cells express a distinctive transcriptional profile, reflecting their role as non-Th1/Th2 effector cells that provide help for B cells. J Immunol 173, 68–78. 10.4049/jimmunol.173.1.68. [DOI] [PubMed] [Google Scholar]
- 11.Sallusto F (2016). Heterogeneity of Human CD4(+) T Cells Against Microbes. Annu Rev Immunol 34, 317–334. 10.1146/annurev-immunol-032414-112056. [DOI] [PubMed] [Google Scholar]
- 12.Ruterbusch M, Pruner KB, Shehata L, and Pepper M (2020). In Vivo CD4(+) T Cell Differentiation and Function: Revisiting the Th1/Th2 Paradigm. Annu Rev Immunol 38, 705–725. 10.1146/annurev-immunol-103019-085803. [DOI] [PubMed] [Google Scholar]
- 13.Dong C (2021). Cytokine Regulation and Function in T Cells. Annu Rev Immunol 39, 51–76. 10.1146/annurev-immunol-061020-053702. [DOI] [PubMed] [Google Scholar]
- 14.Lee GR, Kim ST, Spilianakis CG, Fields PE, and Flavell RA (2006). T helper cell differentiation: regulation by cis elements and epigenetics. Immunity 24, 369–379. 10.1016/j.immuni.2006.03.007. [DOI] [PubMed] [Google Scholar]
- 15.Vahedi G, Takahashi H, Nakayamada S, Sun HW, Sartorelli V, Kanno Y, and O’Shea JJ (2012). STATs shape the active enhancer landscape of T cell populations. Cell 151, 981–993. 10.1016/j.cell.2012.09.044. [DOI] [PMC free article] [PubMed] [Google Scholar]
- 16.Kanno Y, Vahedi G, Hirahara K, Singleton K, and O’Shea JJ (2012). Transcriptional and epigenetic control of T helper cell specification: molecular mechanisms underlying commitment and plasticity. Annu Rev Immunol 30, 707–731. 10.1146/annurev-immunol-020711-075058. [DOI] [PMC free article] [PubMed] [Google Scholar]
- 17.O’Shea JJ, and Paul WE (2010). Mechanisms underlying lineage commitment and plasticity of helper CD4+ T cells. Science 327, 1098–1102. 10.1126/science.1178334. [DOI] [PMC free article] [PubMed] [Google Scholar]
- 18.Tripathi SK, and Lahesmaa R (2014). Transcriptional and epigenetic regulation of T-helper lineage specification. Immunol Rev 261, 62–83. 10.1111/imr.12204. [DOI] [PMC free article] [PubMed] [Google Scholar]
- 19.Ansel KM, Lee DU, and Rao A (2003). An epigenetic view of helper T cell differentiation. Nat Immunol 4, 616–623. 10.1038/ni0703-616. [DOI] [PubMed] [Google Scholar]
- 20.Wilson CB, Rowell E, and Sekimata M (2009). Epigenetic control of T-helper-cell differentiation. Nat Rev Immunol 9, 91–105. 10.1038/nri2487. [DOI] [PubMed] [Google Scholar]
- 21.Hawkins RD, Larjo A, Tripathi SK, Wagner U, Luu Y, Lonnberg T, Raghav SK, Lee LK, Lund R, Ren B, et al. (2013). Global chromatin state analysis reveals lineage-specific enhancers during the initiation of human T helper 1 and T helper 2 cell polarization. Immunity 38, 1271–1284. 10.1016/j.immuni.2013.05.011. [DOI] [PMC free article] [PubMed] [Google Scholar]
- 22.DiToro D, Winstead CJ, Pham D, Witte S, Andargachew R, Singer JR, Wilson CG, Zindl CL, Luther RJ, Silberger DJ, et al. (2018). Differential IL-2 expression defines developmental fates of follicular versus nonfollicular helper T cells. Science 361. 10.1126/science.aao2933. [DOI] [PMC free article] [PubMed] [Google Scholar]
- 23.Li P, Spolski R, Liao W, and Leonard WJ (2014). Complex interactions of transcription factors in mediating cytokine biology in T cells. Immunol Rev 261, 141–156. 10.1111/imr.12199. [DOI] [PMC free article] [PubMed] [Google Scholar]
- 24.Bevington SL, Cauchy P, Withers DR, Lane PJ, and Cockerill PN (2017). T Cell Receptor and Cytokine Signaling Can Function at Different Stages to Establish and Maintain Transcriptional Memory and Enable T Helper Cell Differentiation. Front Immunol 8, 204. 10.3389/fimmu.2017.00204. [DOI] [PMC free article] [PubMed] [Google Scholar]
- 25.Wei G, Wei L, Zhu J, Zang C, Hu-Li J, Yao Z, Cui K, Kanno Y, Roh TY, Watford WT, et al. (2009). Global mapping of H3K4me3 and H3K27me3 reveals specificity and plasticity in lineage fate determination of differentiating CD4+ T cells. Immunity 30, 155–167. 10.1016/j.immuni.2008.12.009. [DOI] [PMC free article] [PubMed] [Google Scholar]
- 26.O’Shea JJ, Lahesmaa R, Vahedi G, Laurence A, and Kanno Y (2011). Genomic views of STAT function in CD4+ T helper cell differentiation. Nat Rev Immunol 11, 239–250. 10.1038/nri2958. [DOI] [PMC free article] [PubMed] [Google Scholar]
- 27.Bailis W, Yashiro-Ohtani Y, Fang TC, Hatton RD, Weaver CT, Artis D, and Pear WS (2013). Notch simultaneously orchestrates multiple helper T cell programs independently of cytokine signals. Immunity 39, 148–159. 10.1016/j.immuni.2013.07.006. [DOI] [PMC free article] [PubMed] [Google Scholar]
- 28.Kopp EB, Agaronyan K, Licona-Limon I, Nish SA, and Medzhitov R (2023). Modes of type 2 immune response initiation. Immunity 56, 687–694. 10.1016/j.immuni.2023.03.015. [DOI] [PubMed] [Google Scholar]
- 29.Wei L, Vahedi G, Sun HW, Watford WT, Takatori H, Ramos HL, Takahashi H, Liang J, Gutierrez-Cruz G, Zang C, et al. (2010). Discrete roles of STAT4 and STAT6 transcription factors in tuning epigenetic modifications and transcription during T helper cell differentiation. Immunity 32, 840–851. 10.1016/j.immuni.2010.06.003. [DOI] [PMC free article] [PubMed] [Google Scholar]
- 30.Szabo SJ, Kim ST, Costa GL, Zhang X, Fathman CG, and Glimcher LH (2000). A novel transcription factor, T-bet, directs Th1 lineage commitment. Cell 100, 655–669. 10.1016/s0092-8674(00)80702-3. [DOI] [PubMed] [Google Scholar]
- 31.Lee DU, Avni O, Chen L, and Rao A (2004). A distal enhancer in the interferon-gamma (IFN-gamma) locus revealed by genome sequence comparison. J Biol Chem 279, 4802–4810. 10.1074/jbc.M307904200. [DOI] [PubMed] [Google Scholar]
- 32.Shnyreva M, Weaver WM, Blanchette M, Taylor SL, Tompa M, Fitzpatrick DR, and Wilson CB (2004). Evolutionarily conserved sequence elements that positively regulate IFN-gamma expression in T cells. Proc Natl Acad Sci U S A 101, 12622–12627. 10.1073/pnas.0400849101. [DOI] [PMC free article] [PubMed] [Google Scholar]
- 33.Hatton RD, Harrington LE, Luther RJ, Wakefield T, Janowski KM, Oliver JR, Lallone RL, Murphy KM, and Weaver CT (2006). A distal conserved sequence element controls Ifng gene expression by T cells and NK cells. Immunity 25, 717–729. 10.1016/j.immuni.2006.09.007. [DOI] [PubMed] [Google Scholar]
- 34.Schoenborn JR, Dorschner MO, Sekimata M, Santer DM, Shnyreva M, Fitzpatrick DR, Stamatoyannopoulos JA, and Wilson CB (2007). Comprehensive epigenetic profiling identifies multiple distal regulatory elements directing transcription of the gene encoding interferon-gamma. Nat Immunol 8, 732–742. 10.1038/ni1474. [DOI] [PMC free article] [PubMed] [Google Scholar]
- 35.Yagi R, Junttila IS, Wei G, Urban JF Jr., Zhao K, Paul WE, and Zhu J (2010). The transcription factor GATA3 actively represses RUNX3 protein-regulated production of interferon-gamma. Immunity 32, 507–517. 10.1016/j.immuni.2010.04.004. [DOI] [PMC free article] [PubMed] [Google Scholar]
- 36.Balasubramani A, Shibata Y, Crawford GE, Baldwin AS, Hatton RD, and Weaver CT (2010). Modular utilization of distal cis-regulatory elements controls Ifng gene expression in T cells activated by distinct stimuli. Immunity 33, 35–47. 10.1016/j.immuni.2010.07.004. [DOI] [PMC free article] [PubMed] [Google Scholar]
- 37.Balasubramani A, Winstead CJ, Turner H, Janowski KM, Harbour SN, Shibata Y, Crawford GE, Hatton RD, and Weaver CT (2014). Deletion of a conserved cis-element in the Ifng locus highlights the role of acute histone acetylation in modulating inducible gene transcription. PLoS Genet 10, e1003969. 10.1371/journal.pgen.1003969. [DOI] [PMC free article] [PubMed] [Google Scholar]
- 38.Djuretic IM, Levanon D, Negreanu V, Groner Y, Rao A, and Ansel KM (2007). Transcription factors T-bet and Runx3 cooperate to activate Ifng and silence Il4 in T helper type 1 cells. Nat Immunol 8, 145–153. 10.1038/ni1424. [DOI] [PubMed] [Google Scholar]
- 39.Thieu VT, Yu Q, Chang HC, Yeh N, Nguyen ET, Sehra S, and Kaplan MH (2008). Signal transducer and activator of transcription 4 is required for the transcription factor T-bet to promote T helper 1 cell-fate determination. Immunity 29, 679–690. 10.1016/j.immuni.2008.08.017. [DOI] [PMC free article] [PubMed] [Google Scholar]
- 40.Aune TM, Collins PL, and Chang S (2009). Epigenetics and T helper 1 differentiation. Immunology 126, 299–305. 10.1111/j.1365-2567.2008.03026.x. [DOI] [PMC free article] [PubMed] [Google Scholar]
- 41.Shi M, Lin TH, Appell KC, and Berg LJ (2008). Janus-kinase-3-dependent signals induce chromatin remodeling at the Ifng locus during T helper 1 cell differentiation. Immunity 28, 763–773. 10.1016/j.immuni.2008.04.016. [DOI] [PMC free article] [PubMed] [Google Scholar]
- 42.Yamashita M, Ukai-Tadenuma M, Kimura M, Omori M, Inami M, Taniguchi M, and Nakayama T (2002). Identification of a conserved GATA3 response element upstream proximal from the interleukin-13 gene locus. J Biol Chem 277, 42399–42408. 10.1074/jbc.M205876200. [DOI] [PubMed] [Google Scholar]
- 43.Loots GG, Locksley RM, Blankespoor CM, Wang ZE, Miller W, Rubin EM, and Frazer KA (2000). Identification of a coordinate regulator of interleukins 4, 13, and 5 by cross-species sequence comparisons. Science 288, 136–140. 10.1126/science.288.5463.136. [DOI] [PubMed] [Google Scholar]
- 44.Mohrs M, Blankespoor CM, Wang ZE, Loots GG, Afzal V, Hadeiba H, Shinkai K, Rubin EM, and Locksley RM (2001). Deletion of a coordinate regulator of type 2 cytokine expression in mice. Nat Immunol 2, 842–847. 10.1038/ni0901-842. [DOI] [PubMed] [Google Scholar]
- 45.Tanaka S, Motomura Y, Suzuki Y, Yagi R, Inoue H, Miyatake S, and Kubo M (2011). The enhancer HS2 critically regulates GATA-3-mediated Il4 transcription in T(H)2 cells. Nat Immunol 12, 77–85. 10.1038/ni.1966. [DOI] [PubMed] [Google Scholar]
- 46.Vijayanand P, Seumois G, Simpson LJ, Abdul-Wajid S, Baumjohann D, Panduro M, Huang X, Interlandi J, Djuretic IM, Brown DR, et al. (2012). Interleukin-4 production by follicular helper T cells requires the conserved Il4 enhancer hypersensitivity site V. Immunity 36, 175–187. 10.1016/j.immuni.2011.12.014. [DOI] [PMC free article] [PubMed] [Google Scholar]
- 47.Solymar DC, Agarwal S, Bassing CH, Alt FW, and Rao A (2002). A 3’ enhancer in the IL-4 gene regulates cytokine production by Th2 cells and mast cells. Immunity 17, 41–50. 10.1016/s1074-7613(02)00334-5. [DOI] [PubMed] [Google Scholar]
- 48.Tanaka S, Tsukada J, Suzuki W, Hayashi K, Tanigaki K, Tsuji M, Inoue H, Honjo T, and Kubo M (2006). The interleukin-4 enhancer CNS-2 is regulated by Notch signals and controls initial expression in NKT cells and memory-type CD4 T cells. Immunity 24, 689–701. 10.1016/j.immuni.2006.04.009. [DOI] [PubMed] [Google Scholar]
- 49.Ansel KM, Greenwald RJ, Agarwal S, Bassing CH, Monticelli S, Interlandi J, Djuretic IM, Lee DU, Sharpe AH, Alt FW, and Rao A (2004). Deletion of a conserved Il4 silencer impairs T helper type 1-mediated immunity. Nat Immunol 5, 1251–1259. 10.1038/ni1135. [DOI] [PubMed] [Google Scholar]
- 50.Lee GR, Fields PE, Griffin TJ, and Flavell RA (2003). Regulation of the Th2 cytokine locus by a locus control region. Immunity 19, 145–153. 10.1016/s1074-7613(03)00179-1. [DOI] [PubMed] [Google Scholar]
- 51.Fields PE, Lee GR, Kim ST, Bartsevich VV, and Flavell RA (2004). Th2-specific chromatin remodeling and enhancer activity in the Th2 cytokine locus control region. Immunity 21, 865–876. 10.1016/j.immuni.2004.10.015. [DOI] [PubMed] [Google Scholar]
- 52.Kim ST, Fields PE, and Flavell RA (2007). Demethylation of a specific hypersensitive site in the Th2 locus control region. Proc Natl Acad Sci U S A 104, 17052–17057. 10.1073/pnas.0708293104. [DOI] [PMC free article] [PubMed] [Google Scholar]
- 53.Williams A, Lee GR, Spilianakis CG, Hwang SS, Eisenbarth SC, and Flavell RA (2013). Hypersensitive site 6 of the Th2 locus control region is essential for Th2 cytokine expression. Proc Natl Acad Sci U S A 110, 6955–6960. 10.1073/pnas.1304720110. [DOI] [PMC free article] [PubMed] [Google Scholar]
- 54.Lee GR, Spilianakis CG, and Flavell RA (2005). Hypersensitive site 7 of the TH2 locus control region is essential for expressing TH2 cytokine genes and for long-range intrachromosomal interactions. Nat Immunol 6, 42–48. 10.1038/ni1148. [DOI] [PubMed] [Google Scholar]
- 55.Takemoto N, Kamogawa Y, Jun Lee H, Kurata H, Arai KI, O’Garra A, Arai N, and Miyatake S (2000). Cutting edge: chromatin remodeling at the IL-4/IL-13 intergenic regulatory region for Th2-specific cytokine gene cluster. J Immunol 165, 6687–6691. 10.4049/jimmunol.165.12.6687. [DOI] [PubMed] [Google Scholar]
- 56.Lee GR, Fields PE, and Flavell RA (2001). Regulation of IL-4 gene expression by distal regulatory elements and GATA-3 at the chromatin level. Immunity 14, 447–459. 10.1016/s1074-7613(01)00125-x. [DOI] [PubMed] [Google Scholar]
- 57.Wei G, Abraham BJ, Yagi R, Jothi R, Cui K, Sharma S, Narlikar L, Northrup DL, Tang Q, Paul WE, et al. (2011). Genome-wide analyses of transcription factor GATA3-mediated gene regulation in distinct T cell types. Immunity 35, 299–311. 10.1016/j.immuni.2011.08.007. [DOI] [PMC free article] [PubMed] [Google Scholar]
- 58.Zhu J (2015). T helper 2 (Th2) cell differentiation, type 2 innate lymphoid cell (ILC2) development and regulation of interleukin-4 (IL-4) and IL-13 production. Cytokine 75, 14–24. 10.1016/j.cyto.2015.05.010. [DOI] [PMC free article] [PubMed] [Google Scholar]
- 59.Spilianakis CG, and Flavell RA (2004). Long-range intrachromosomal interactions in the T helper type 2 cytokine locus. Nat Immunol 5, 1017–1027. 10.1038/ni1115. [DOI] [PubMed] [Google Scholar]
- 60.Hadjur S, Williams LM, Ryan NK, Cobb BS, Sexton T, Fraser P, Fisher AG, and Merkenschlager M (2009). Cohesins form chromosomal cis-interactions at the developmentally regulated IFNG locus. Nature 460, 410–413. 10.1038/nature08079. [DOI] [PMC free article] [PubMed] [Google Scholar]
- 61.Cui K, Chen Z, Cao Y, Liu S, Ren G, Hu G, Fang D, Wei D, Liu C, Zhu J, et al. (2023). Restraint of IFN-gamma expression through a distal silencer CNS-28 for tissue homeostasis. Immunity 56, 944–958 e946. 10.1016/j.immuni.2023.03.006. [DOI] [PMC free article] [PubMed] [Google Scholar]
- 62.Chandra A, Yoon S, Michieletto MF, Goldman N, Ferrari EK, Abedi M, Johnson I, Fasolino M, Pham K, Joannas L, et al. (2023). Quantitative control of Ets1 dosage by a multi-enhancer hub promotes Th1 cell differentiation and protects from allergic inflammation. Immunity. 10.1016/j.immuni.2023.05.004. [DOI] [PMC free article] [PubMed] [Google Scholar]
- 63.Hu G, Cui K, Fang D, Hirose S, Wang X, Wangsa D, Jin W, Ried T, Liu P, Zhu J, et al. (2018). Transformation of Accessible Chromatin and 3D Nucleome Underlies Lineage Commitment of Early T Cells. Immunity 48, 227–242 e228. 10.1016/j.immuni.2018.01.013. [DOI] [PMC free article] [PubMed] [Google Scholar]
- 64.Placek K, Hu G, Cui K, Zhang D, Ding Y, Lee JE, Jang Y, Wang C, Konkel JE, Song J, et al. (2017). MLL4 prepares the enhancer landscape for Foxp3 induction via chromatin looping. Nat Immunol 18, 1035–1045. 10.1038/ni.3812. [DOI] [PMC free article] [PubMed] [Google Scholar]
- 65.Heintzman ND, Stuart RK, Hon G, Fu Y, Ching CW, Hawkins RD, Barrera LO, Van Calcar S, Qu C, Ching KA, et al. (2007). Distinct and predictive chromatin signatures of transcriptional promoters and enhancers in the human genome. Nat Genet 39, 311–318. 10.1038/ng1966. [DOI] [PubMed] [Google Scholar]
- 66.Koch CM, Andrews RM, Flicek P, Dillon SC, Karaoz U, Clelland GK, Wilcox S, Beare DM, Fowler JC, Couttet P, et al. (2007). The landscape of histone modifications across 1% of the human genome in five human cell lines. Genome Res 17, 691–707. 10.1101/gr.5704207. [DOI] [PMC free article] [PubMed] [Google Scholar]
- 67.Barski A, Cuddapah S, Cui K, Roh TY, Schones DE, Wang Z, Wei G, Chepelev I, and Zhao K (2007). High-resolution profiling of histone methylations in the human genome. Cell 129, 823–837. 10.1016/j.cell.2007.05.009. [DOI] [PubMed] [Google Scholar]
- 68.Creyghton MP, Cheng AW, Welstead GG, Kooistra T, Carey BW, Steine EJ, Hanna J, Lodato MA, Frampton GM, Sharp PA, et al. (2010). Histone H3K27ac separates active from poised enhancers and predicts developmental state. Proc Natl Acad Sci U S A 107, 21931–21936. 10.1073/pnas.1016071107. [DOI] [PMC free article] [PubMed] [Google Scholar]
- 69.Rada-Iglesias A, Bajpai R, Swigut T, Brugmann SA, Flynn RA, and Wysocka J (2011). A unique chromatin signature uncovers early developmental enhancers in humans. Nature 470, 279–283. 10.1038/nature09692. [DOI] [PMC free article] [PubMed] [Google Scholar]
- 70.He B, Xing S, Chen C, Gao P, Teng L, Shan Q, Gullicksrud JA, Martin MD, Yu S, Harty JT, et al. (2016). CD8(+) T Cells Utilize Highly Dynamic Enhancer Repertoires and Regulatory Circuitry in Response to Infections. Immunity 45, 1341–1354. 10.1016/j.immuni.2016.11.009. [DOI] [PMC free article] [PubMed] [Google Scholar]
- 71.Heintzman ND, Hon GC, Hawkins RD, Kheradpour P, Stark A, Harp LF, Ye Z, Lee LK, Stuart RK, Ching CW, et al. (2009). Histone modifications at human enhancers reflect global cell-type-specific gene expression. Nature 459, 108–112. 10.1038/nature07829. [DOI] [PMC free article] [PubMed] [Google Scholar]
- 72.Local A, Huang H, Albuquerque CP, Singh N, Lee AY, Wang W, Wang C, Hsia JE, Shiau AK, Ge K, et al. (2018). Identification of H3K4me1-associated proteins at mammalian enhancers. Nat Genet 50, 73–82. 10.1038/s41588-017-0015-6. [DOI] [PMC free article] [PubMed] [Google Scholar]
- 73.Visel A, Blow MJ, Li Z, Zhang T, Akiyama JA, Holt A, Plajzer-Frick I, Shoukry M, Wright C, Chen F, et al. (2009). ChIP-seq accurately predicts tissue-specific activity of enhancers. Nature 457, 854–858. 10.1038/nature07730. [DOI] [PMC free article] [PubMed] [Google Scholar]
- 74.Ghisletti S, Barozzi I, Mietton F, Polletti S, De Santa F, Venturini E, Gregory L, Lonie L, Chew A, Wei CL, et al. (2010). Identification and characterization of enhancers controlling the inflammatory gene expression program in macrophages. Immunity 32, 317–328. 10.1016/j.immuni.2010.02.008. [DOI] [PubMed] [Google Scholar]
- 75.Taniuchi I (2018). CD4 Helper and CD8 Cytotoxic T Cell Differentiation. Annu Rev Immunol 36, 579–601. 10.1146/annurev-immunol-042617-053411. [DOI] [PubMed] [Google Scholar]
- 76.Korinfskaya S, Parameswaran S, Weirauch MT, and Barski A (2021). Runx Transcription Factors in T Cells-What Is Beyond Thymic Development? Front Immunol 12, 701924. 10.3389/fimmu.2021.701924. [DOI] [PMC free article] [PubMed] [Google Scholar]
- 77.Christie D, and Zhu J (2014). Transcriptional regulatory networks for CD4 T cell differentiation. Curr Top Microbiol Immunol 381, 125–172. 10.1007/82_2014_372. [DOI] [PMC free article] [PubMed] [Google Scholar]
- 78.Ciofani M, Madar A, Galan C, Sellars M, Mace K, Pauli F, Agarwal A, Huang W, Parkhurst CN, Muratet M, et al. (2012). A validated regulatory network for Th17 cell specification. Cell 151, 289–303. 10.1016/j.cell.2012.09.016. [DOI] [PMC free article] [PubMed] [Google Scholar]
- 79.Li P, Spolski R, Liao W, Wang L, Murphy TL, Murphy KM, and Leonard WJ (2012). BATF-JUN is critical for IRF4-mediated transcription in T cells. Nature 490, 543–546. 10.1038/nature11530. [DOI] [PMC free article] [PubMed] [Google Scholar]
- 80.Garrett-Sinha LA (2013). Review of Ets1 structure, function, and roles in immunity. Cell Mol Life Sci 70, 3375–3390. 10.1007/s00018-012-1243-7. [DOI] [PMC free article] [PubMed] [Google Scholar]
- 81.Murphy TL, Tussiwand R, and Murphy KM (2013). Specificity through cooperation: BATF-IRF interactions control immune-regulatory networks. Nat Rev Immunol 13, 499–509. 10.1038/nri3470. [DOI] [PubMed] [Google Scholar]
- 82.Glasmacher E, Agrawal S, Chang AB, Murphy TL, Zeng W, Vander Lugt B, Khan AA, Ciofani M, Spooner CJ, Rutz S, et al. (2012). A genomic regulatory element that directs assembly and function of immune-specific AP-1-IRF complexes. Science 338, 975–980. 10.1126/science.1228309. [DOI] [PMC free article] [PubMed] [Google Scholar]
- 83.Agarwal S, and Rao A (1998). Modulation of chromatin structure regulates cytokine gene expression during T cell differentiation. Immunity 9, 765–775. 10.1016/s1074-7613(00)80642-1. [DOI] [PubMed] [Google Scholar]
- 84.Ansel KM, Djuretic I, Tanasa B, and Rao A (2006). Regulation of Th2 differentiation and Il4 locus accessibility. Annu Rev Immunol 24, 607–656. 10.1146/annurev.immunol.23.021704.115821. [DOI] [PubMed] [Google Scholar]
- 85.Hu-Li J, Pannetier C, Guo L, Lohning M, Gu H, Watson C, Assenmacher M, Radbruch A, and Paul WE (2001). Regulation of expression of IL-4 alleles: analysis using a chimeric GFP/IL-4 gene. Immunity 14, 1–11. 10.1016/s1074-7613(01)00084-x. [DOI] [PubMed] [Google Scholar]
- 86.Noben-Trauth N, Hu-Li J, and Paul WE (2002). IL-4 secreted from individual naive CD4+ T cells acts in an autocrine manner to induce Th2 differentiation. Eur J Immunol 32, 1428–1433. . [DOI] [PubMed] [Google Scholar]
- 87.Yamane H, Zhu J, and Paul WE (2005). Independent roles for IL-2 and GATA-3 in stimulating naive CD4+ T cells to generate a Th2-inducing cytokine environment. J Exp Med 202, 793–804. 10.1084/jem.20051304. [DOI] [PMC free article] [PubMed] [Google Scholar]
- 88.Kaplan MH, Schindler U, Smiley ST, and Grusby MJ (1996). Stat6 is required for mediating responses to IL-4 and for development of Th2 cells. Immunity 4, 313–319. 10.1016/s1074-7613(00)80439-2. [DOI] [PubMed] [Google Scholar]
- 89.Shimoda K, van Deursen J, Sangster MY, Sarawar SR, Carson RT, Tripp RA, Chu C, Quelle FW, Nosaka T, Vignali DA, et al. (1996). Lack of IL-4-induced Th2 response and IgE class switching in mice with disrupted Stat6 gene. Nature 380, 630–633. 10.1038/380630a0. [DOI] [PubMed] [Google Scholar]
- 90.Takeda K, Tanaka T, Shi W, Matsumoto M, Minami M, Kashiwamura S, Nakanishi K, Yoshida N, Kishimoto T, and Akira S (1996). Essential role of Stat6 in IL-4 signalling. Nature 380, 627–630. 10.1038/380627a0. [DOI] [PubMed] [Google Scholar]
- 91.Dehingia B, Milewska M, Janowski M, and Pekowska A (2022). CTCF shapes chromatin structure and gene expression in health and disease. EMBO Rep 23, e55146. 10.15252/embr.202255146. [DOI] [PMC free article] [PubMed] [Google Scholar]
- 92.da Costa-Nunes JA, and Noordermeer D (2023). TADs: Dynamic structures to create stable regulatory functions. Curr Opin Struct Biol 81, 102622. 10.1016/j.sbi.2023.102622. [DOI] [PubMed] [Google Scholar]
- 93.Popay TM, and Dixon JR (2022). Coming full circle: On the origin and evolution of the looping model for enhancer-promoter communication. J Biol Chem 298, 102117. 10.1016/j.jbc.2022.102117. [DOI] [PMC free article] [PubMed] [Google Scholar]
- 94.Chakraborty S, Kopitchinski N, Zuo Z, Eraso A, Awasthi P, Chari R, Mitra A, Tobias IC, Moorthy SD, Dale RK, et al. (2023). Enhancer-promoter interactions can bypass CTCF-mediated boundaries and contribute to phenotypic robustness. Nat Genet 55, 280–290. 10.1038/s41588-022-01295-6. [DOI] [PMC free article] [PubMed] [Google Scholar]
- 95.Wang H, Fan Z, Shliaha PV, Miele M, Hendrickson RC, Jiang X, and Helin K (2023). H3K4me3 regulates RNA polymerase II promoter-proximal pause-release. Nature 615, 339–348. 10.1038/s41586-023-05780-8. [DOI] [PMC free article] [PubMed] [Google Scholar]
- 96.Spitz F, and Furlong EE (2012). Transcription factors: from enhancer binding to developmental control. Nat Rev Genet 13, 613–626. 10.1038/nrg3207. [DOI] [PubMed] [Google Scholar]
- 97.Schoenfelder S, and Fraser P (2019). Long-range enhancer-promoter contacts in gene expression control. Nat Rev Genet 20, 437–455. 10.1038/s41576-019-0128-0. [DOI] [PubMed] [Google Scholar]
- 98.Zentner GE, Tesar PJ, and Scacheri PC (2011). Epigenetic signatures distinguish multiple classes of enhancers with distinct cellular functions. Genome Res 21, 1273–1283. 10.1101/gr.122382.111. [DOI] [PMC free article] [PubMed] [Google Scholar]
- 99.Rada-Iglesias A (2018). Is H3K4me1 at enhancers correlative or causative? Nat Genet 50, 4–5. 10.1038/s41588-017-0018-3. [DOI] [PubMed] [Google Scholar]
- 100.Dorighi KM, Swigut T, Henriques T, Bhanu NV, Scruggs BS, Nady N, Still CD 2nd, Garcia BA, Adelman K, and Wysocka J (2017). Mll3 and Mll4 Facilitate Enhancer RNA Synthesis and Transcription from Promoters Independently of H3K4 Monomethylation. Mol Cell 66, 568–576 e564. 10.1016/j.molcel.2017.04.018. [DOI] [PMC free article] [PubMed] [Google Scholar]
- 101.Rickels R, Herz HM, Sze CC, Cao K, Morgan MA, Collings CK, Gause M, Takahashi YH, Wang L, Rendleman EJ, et al. (2017). Histone H3K4 monomethylation catalyzed by Trr and mammalian COMPASS-like proteins at enhancers is dispensable for development and viability. Nat Genet 49, 1647–1653. 10.1038/ng.3965. [DOI] [PMC free article] [PubMed] [Google Scholar]
- 102.Xie G, Lee JE, Senft AD, Park YK, Jang Y, Chakraborty S, Thompson JJ, McKernan K, Liu C, Macfarlan TS, et al. (2023). MLL3/MLL4 methyltransferase activities control early embryonic development and embryonic stem cell differentiation in a lineage-selective manner. Nat Genet 55, 693–705. 10.1038/s41588-023-01356-4. [DOI] [PMC free article] [PubMed] [Google Scholar]
- 103.Taberlay PC, Kelly TK, Liu CC, You JS, De Carvalho DD, Miranda TB, Zhou XJ, Liang G, and Jones PA (2011). Polycomb-repressed genes have permissive enhancers that initiate reprogramming. Cell 147, 1283–1294. 10.1016/j.cell.2011.10.040. [DOI] [PMC free article] [PubMed] [Google Scholar]
- 104.Cauchy P, Maqbool MA, Zacarias-Cabeza J, Vanhille L, Koch F, Fenouil R, Gut M, Gut I, Santana MA, Griffon A, et al. (2016). Dynamic recruitment of Ets1 to both nucleosome-occupied and -depleted enhancer regions mediates a transcriptional program switch during early T-cell differentiation. Nucleic Acids Res 44, 3567–3585. 10.1093/nar/gkv1475. [DOI] [PMC free article] [PubMed] [Google Scholar]
- 105.Spilianakis CG, Lalioti MD, Town T, Lee GR, and Flavell RA (2005). Interchromosomal associations between alternatively expressed loci. Nature 435, 637–645. 10.1038/nature03574. [DOI] [PubMed] [Google Scholar]
- 106.Kim LK, Esplugues E, Zorca CE, Parisi F, Kluger Y, Kim TH, Galjart NJ, and Flavell RA (2014). Oct-1 regulates IL-17 expression by directing interchromosomal associations in conjunction with CTCF in T cells. Mol Cell 54, 56–66. 10.1016/j.molcel.2014.02.004. [DOI] [PMC free article] [PubMed] [Google Scholar]
- 107.Takaku M, Grimm SA, Shimbo T, Perera L, Menafra R, Stunnenberg HG, Archer TK, Machida S, Kurumizaka H, and Wade PA (2016). GATA3-dependent cellular reprogramming requires activation-domain dependent recruitment of a chromatin remodeler. Genome Biol 17, 36. 10.1186/s13059-016-0897-0. [DOI] [PMC free article] [PubMed] [Google Scholar]
- 108.Tanaka H, Takizawa Y, Takaku M, Kato D, Kumagawa Y, Grimm SA, Wade PA, and Kurumizaka H (2020). Interaction of the pioneer transcription factor GATA3 with nucleosomes. Nat Commun 11, 4136. 10.1038/s41467-020-17959-y. [DOI] [PMC free article] [PubMed] [Google Scholar]
- 109.Lee DU, and Rao A (2004). Molecular analysis of a locus control region in the T helper 2 cytokine gene cluster: a target for STAT6 but not GATA3. Proc Natl Acad Sci U S A 101, 16010–16015. 10.1073/pnas.0407031101. [DOI] [PMC free article] [PubMed] [Google Scholar]
- 110.Samstein RM, Arvey A, Josefowicz SZ, Peng X, Reynolds A, Sandstrom R, Neph S, Sabo P, Kim JM, Liao W, et al. (2012). Foxp3 exploits a pre-existent enhancer landscape for regulatory T cell lineage specification. Cell 151, 153–166. 10.1016/j.cell.2012.06.053. [DOI] [PMC free article] [PubMed] [Google Scholar]
- 111.Hsieh T, Sasaki D, Taira N, Chien H, Sarkar S, Seto Y, Miyagi M, and Ishikawa H (2022). JunB Is Critical for Survival of T Helper Cells. Front Immunol 13, 901030. 10.3389/fimmu.2022.901030. [DOI] [PMC free article] [PubMed] [Google Scholar]
- 112.Iwata A, Durai V, Tussiwand R, Briseno CG, Wu X, Grajales-Reyes GE, Egawa T, Murphy TL, and Murphy KM (2017). Quality of TCR signaling determined by differential affinities of enhancers for the composite BATF-IRF4 transcription factor complex. Nat Immunol 18, 563–572. 10.1038/ni.3714. [DOI] [PMC free article] [PubMed] [Google Scholar]
- 113.Zhong C, Cui K, Wilhelm C, Hu G, Mao K, Belkaid Y, Zhao K, and Zhu J (2016). Group 3 innate lymphoid cells continuously require the transcription factor GATA-3 after commitment. Nat Immunol 17, 169–178. 10.1038/ni.3318. [DOI] [PMC free article] [PubMed] [Google Scholar]
- 114.Fang D, Cui K, Cao Y, Zheng M, Kawabe T, Hu G, Khillan JS, Li D, Zhong C, Jankovic D, et al. (2022). Differential regulation of transcription factor T-bet induction during NK cell development and T helper-1 cell differentiation. Immunity 55, 639–655 e637. 10.1016/j.immuni.2022.03.005. [DOI] [PMC free article] [PubMed] [Google Scholar]
- 115.Ren G, Jin W, Cui K, Rodrigez J, Hu G, Zhang Z, Larson DR, and Zhao K (2017). CTCF-Mediated Enhancer-Promoter Interaction Is a Critical Regulator of Cell-to-Cell Variation of Gene Expression. Mol Cell 67, 1049–1058 e1046. 10.1016/j.molcel.2017.08.026. [DOI] [PMC free article] [PubMed] [Google Scholar]
- 116.Waskom ML (2021). Seaborn: statistical data visualization. Journal of Open Source Software 6, 3021. [Google Scholar]
- 117.Virtanen P, Gommers R, Oliphant TE, Haberland M, Reddy T, Cournapeau D, Burovski E, Peterson P, Weckesser W, Bright J, et al. (2020). SciPy 1.0: fundamental algorithms for scientific computing in Python. Nat Methods 17, 261–272. 10.1038/s41592-019-0686-2. [DOI] [PMC free article] [PubMed] [Google Scholar]
- 118.Langmead B, and Salzberg SL (2012). Fast gapped-read alignment with Bowtie 2. Nat Methods 9, 357–359. 10.1038/nmeth.1923. [DOI] [PMC free article] [PubMed] [Google Scholar]
- 119.Dobin A, Davis CA, Schlesinger F, Drenkow J, Zaleski C, Jha S, Batut P, Chaisson M, and Gingeras TR (2013). STAR: ultrafast universal RNA-seq aligner. Bioinformatics 29, 15–21. 10.1093/bioinformatics/bts635. [DOI] [PMC free article] [PubMed] [Google Scholar]
- 120.Trapnell C, Hendrickson DG, Sauvageau M, Goff L, Rinn JL, and Pachter L (2013). Differential analysis of gene regulation at transcript resolution with RNA-seq. Nat Biotechnol 31, 46–+. 10.1038/nbt.2450. [DOI] [PMC free article] [PubMed] [Google Scholar]
- 121.Ramirez F, Ryan DP, Gruning B, Bhardwaj V, Kilpert F, Richter AS, Heyne S, Dundar F, and Manke T (2016). deepTools2: a next generation web server for deep-sequencing data analysis. Nucleic Acids Res 44, W160–165. 10.1093/nar/gkw257. [DOI] [PMC free article] [PubMed] [Google Scholar]
- 122.Wingett S, Ewels P, Furlan-Magaril M, Nagano T, Schoenfelder S, Fraser P, and Andrews S (2015). HiCUP: pipeline for mapping and processing Hi-C data. F1000Res 4, 1310. 10.12688/f1000research.7334.1. [DOI] [PMC free article] [PubMed] [Google Scholar]
- 123.Cao Y, Liu S, Ren G, Tang Q, and Zhao K (2022). cLoops2: a full-stack comprehensive analytical tool for chromatin interactions. Nucleic Acids Res 50, 57–71. 10.1093/nar/gkab1233. [DOI] [PMC free article] [PubMed] [Google Scholar]
- 124.Heinz S, Benner C, Spann N, Bertolino E, Lin YC, Laslo P, Cheng JX, Murre C, Singh H, and Glass CK (2010). Simple combinations of lineage-determining transcription factors prime cis-regulatory elements required for macrophage and B cell identities. Mol Cell 38, 576–589. 10.1016/j.molcel.2010.05.004. [DOI] [PMC free article] [PubMed] [Google Scholar]
- 125.Li D, Hsu S, Purushotham D, Sears RL, and Wang T (2019). WashU Epigenome Browser update 2019. Nucleic Acids Res 47, W158–W165. 10.1093/nar/gkz348. [DOI] [PMC free article] [PubMed] [Google Scholar]
- 126.Fang Z, Liu X, and Peltz G (2023). GSEApy: a comprehensive package for performing gene set enrichment analysis in Python. Bioinformatics 39. 10.1093/bioinformatics/btac757. [DOI] [PMC free article] [PubMed] [Google Scholar]
- 127.Quinlan AR, and Hall IM (2010). BEDTools: a flexible suite of utilities for comparing genomic features. Bioinformatics 26, 841–842. 10.1093/bioinformatics/btq033. [DOI] [PMC free article] [PubMed] [Google Scholar]
- 128.Liu S, Cao Y, Cui K, Tang Q, and Zhao K (2022). Hi-TrAC reveals division of labor of transcription factors in organizing chromatin loops. Nat Commun 13, 6679. 10.1038/s41467-022-34276-8. [DOI] [PMC free article] [PubMed] [Google Scholar]
- 129.Frankish A, Diekhans M, Ferreira AM, Johnson R, Jungreis I, Loveland J, Mudge JM, Sisu C, Wright J, Armstrong J, et al. (2019). GENCODE reference annotation for the human and mouse genomes. Nucleic Acids Res 47, D766–D773. 10.1093/nar/gky955. [DOI] [PMC free article] [PubMed] [Google Scholar]
- 130.Cao Y, Liu S, Cui K, Tang Q, and Zhao K (2023). Hi-TrAC detects active sub-TADs and reveals internal organizations of super-enhancers. Nucleic Acids Res. 10.1093/nar/gkad378. [DOI] [PMC free article] [PubMed] [Google Scholar]
Associated Data
This section collects any data citations, data availability statements, or supplementary materials included in this article.
Supplementary Materials
Table S2. Histone modification peaks and genomic segments for each cell type, Related to Figure 1 and Figure 2
Table S3. Hi-TrAC detected loops in Naive, Th1, and Th2 cells, Related to Figure 2
Table S4. Th differentiation stage-specific loops, Related to Figure 2
Table S5. Th lineage-Specific genes and loops, Related to Figure 2
Table S6. IL-4_GFP positive- and negative-specific loops and target genes, Related to Figure 3
Table S7. Specific Hi-TrAC loops for WT, Mll4 KO, and Gata3 KO cells, Related to Figure 5 and Figure 7
Data Availability Statement
The sequencing data including ChIP-seq, RNA-seq, Hi-C and Hi-TrAC data have been deposited in the Gene Expression Omnibus database with accession number: GSE237916.
All codes used for data analysis in this work are public and listed in the Key resources table.
Any additional information required to reanalyze the data reported in this paper is available from the lead contact upon request.
Key resources table
| REAGENT or RESOURCE | SOURCE | IDENTIFIER |
|---|---|---|
| Antibodies | ||
| anti-mouse CD3ε | eBioscience | Cat# 16-0031-82, RRID: AB_468847 |
| anti-mouse CD28 | eBioscience | Cat# 14-0281-82, RRID: AB_467190 |
| anti-mouse IFNγ | Bio X Cell | Cat# BE0055, RRID: AB_1107694 |
| Anti-mouse IL-4 | Bio X Cell | Cat# BE0045, RRID: AB_1107707 |
| Anti-mouse IL-12 | eBioscience | Cat# 16-7123-81, RRID: AB_469232 |
| anti-H3K4me1 | Abcam | Cat# ab8895, RRID: AB_306847 |
| anti-H3K4me3 | Millipore | Cat# 17–614, RRID: AB_11212770 |
| anti-H3K27ac | Abcam | Cat# ab4729, RRID: AB_2118291 |
| anti-GATA3 | BD bioscience | Cat# 558686, RRID: AB_2108590 |
| Chemicals, peptides, and recombinant proteins | ||
| Recombinant Mouse IL-12 Protein | R&D SYSTEMS | Cat# 419-ML |
| Recombinant Mouse IL-4 Protein | R&D SYSTEMS | Cat# 404-ML |
| Recombinant Mouse IL-2 Protein | R&D SYSTEMS | Cat# 402-ML |
| Formaldehyde | Thermo Scientific | Cat# 28908 |
| Proteinase K | Roche | Cat# 03115828001 |
| T4 DNA polymerase | New England Biolabs | Cat# M0203L |
| CviQI | New England Biolabs | Cat# R0639L |
| CviAII | New England Biolabs | Cat# R0640L |
| BfaI | New England Biolabs | Cat# R0568L |
| MluCI | New England Biolabs | Cat# R0538L |
| NlaIII | New England Biolabs | Cat# R0125L |
| Klenow fragment (3’->5’ exo-) | New England Biolabs | Cat# M0212L |
| T4 DNA Ligase | New England Biolabs | Cat# M0202L |
| T7 DNA Ligase | New England Biolabs | Cat# M0318L |
| Dynabeads MyOne Streptavidin C1 beads | Invitrogen | Cat# 65001 |
| Dynabeads Protein A for Immunoprecipitation | Invitrogen | Cat# 10002D |
| QIAzol Lysis Reagent | Qiagen | Cat# 79306 |
| Critical commercial assays | ||
| EasySep™ Mouse Naive CD4+ T cell Isolation Kit | STEMCELL | Cat# 17965A |
| RNeasy Mini Kit | Qiagen | Cat# 74104 |
| End-It DNA-Repair kit | Epicentre | Cat# ER0720 |
| Deposited data | ||
| Mice Naive, Th1 (24h, 72h) and Th2 (24h, 72h) WT vs. Mll4 KO RNA-seq, ChIP-seq (H3K4me1, H3K4me3, H3K27ac) | This manuscript | GEO accession#: GSE23 7916 |
| Mice Th1 (24h, 72h) and Th2 (24h, 72h) WT vs. Mll4 KO Hi-TrAC | This manuscript | GEO accession#: GSE23 7916 |
| Mice Th2 (72h) WT vs. HSS3 deletion RNA-seq, ChIP-seq (H3K4me1, H3K4me3, H3K27ac) and Hi-TrAC | This manuscript | GEO accession#: GSE23 7916 |
| Mice Th2 (72h) WT vs. Gata3 KO Hi-C | This manuscript | GEO accession#: GSE23 7916 |
| Mice Naive and Th2 (72h) WT vs. Gata3 KO RNA-seq, ChIP-seq (H3K4me1, H3K4me3, H3K27ac) and Hi-TrAC | This manuscript | GEO accession#: GSE23 7916 |
| Mice IL-4/GFP positive vs. negative Th2 Hi-TrAC | This manuscript | GEO accession#: GSE23 7916 |
| ETS1 ChIP-seq from mice naive CD4+ cells | 110 | GEO accession#: GSM999187 |
| IRF4 ChIP-seq from mice Th1 CD4+ cells | 111 | GEO accession#: GSM5257931 |
| IRF4 ChIP-seq from mice Th2 CD4+ cells | 112 | GEO accession#: GSM2538525 |
| T-bet ChIP-seq from mice Th1 CD4+ cells | 61 | GEO accession#: GSM6202869 |
| GATA3 ChIP-seq from mice Th2 CD4+ cells | 113 | GEO accession#: GSM1829645 |
| GATA3 ChIP-seq from mice naive CD4+ cells | 61 | GEO accession#: GSM6202870 |
| STAT4 ChIP-seq from mice Th1 CD4+ cells | 29 | GEO accession#: GSM550303 |
| STAT6 ChIP-seq from mice Th2 CD4+ cells | 29 | GEO accession#: GSM550311 |
| Hi-TrAC data from mice WT vs. Mll4 KO naive CD4+ cells | 61 | GEO accessions#: GSM6946693 GSM6946694 GSM6946695 GSM6946696 GSM6946697 GSM6946698 GSM6946699 GSM6946700 GSM6946701 GSM6946702 GSM6946703 GSM6946704 |
| Hi-C data from mice naive CD4+ cells | 64 | GEO accession#: GSM1694157 GSM1694159 GSM1694160 |
| DNase-seq data from mice Th2 CD4+ cells | 114 | GEO accession#: GSM5253165 GSM5253166 |
| CTCF ChIP-seq from mice Th2 CD4+ cells | 115 | GEO accession#: GSM1620003 |
| CTCF ChIP-seq from mice naive CD4+ cells | 61 | GEO accessions#: GSM6202871 |
| Experimental models: Organisms/strains | ||
| Mouse: Mll4fl/flCD4Cre | 64 | N/A |
| Mouse: IL-4/GFP (G4) | 85 | N/A |
| Mouse: Gata3fl/fl | 35 | N/A |
| Mouse: hCD2Cre | JAX | Line 027406 |
| Mouse: CreERT2 | Taconic | Line 10471 |
| Mouse: HSS3Δ | This paper | N/A |
| Oligonucleotides | ||
| HSS3Δ sgRNA-1: GACTAGCTGTGGACCCCTAG | IDT | N/A |
| HSS3Δ sgRNA-2: GGCTCCTTTTGGAACTGGAC | IDT | N/A |
| Software and algorithms | ||
| Python (v3) | Python Community | https://www.python.org |
| seaborn (v0.11.0) | 116 | https://seaborn.pydata.org |
| SciPy (v1.2.1) | 117 | https://scipy.org |
| Bowtie2 (v.2.3.5) | 118 | https://bowtie-bio.sourceforge.net/bowtie2/index.shtml |
| STAR (v2.7.3a) | 119 | https://github.com/alexdobin/STAR |
| Cuffdiff (v2.2.1) | 120 | https://github.com/cole-trapnell-lab/cufflinks |
| deepTools2 (v3.3.0) | 121 | https://deeptools.readthedocs.io/en/develop/ |
| HiCUP (v0.7.2) | 122 | https://www.bioinformatics.babraham.ac.uk/proiects/hicup/ |
| cLoops2 (v0.0.5) | 123 | https://github.com/YaqiangCao/cLoops2 |
| HOMER (v4.10.4) | 124 | http://homer.ucsd.edu/homer/ |
| WashU Epigenome Browser | 125 | http://epigenomegateway.wustl.edu |
| GSEApy (v0.9.18) | 126 | https://github.com/zqfang/GSEApy |
| Bedtools (v2.27.1) | 127 | https://github.com/arq5x/bedtools2 |