

Abstract
Background:
TGF-β signaling is implicated in the progression of most cancers including esophageal adenocarcinoma (EAC). Emerging evidence indicates that TGF-β signaling is a key factor in the development of resistance towards cancer therapy.
Methods:
In this study, we developed patient-derived organoids and patient-derived xenograft models of EAC and performed bioinformatics analysis combined with functional genetics to investigate the role of SMAD3 in EAC resistance to oxaliplatin.
Results:
Chemotherapy non-responding patients showed enrichment of SMAD3 gene expression when compared to responders. In a randomized patient-derived xenografts experiment, SMAD3 inhibition in combination with oxaliplatin effectively diminished tumor burden by impeding DNA repair. SMAD3 interacted directly with protein phosphatase 2A (PP2A), a key regulator of the DNA damage repair protein ataxia telangiectasia mutated (ATM). SMAD3 inhibition diminished ATM phosphorylation by enhancing the binding of PP2A to ATM, causing excessive levels of DNA damage.
Conclusion:
Our results identify SMAD3 as a promising therapeutic target for future combination strategies for the treatment of EAC patients.
Keywords: esophageal cancer, acquired resistance, combination therapy, molecular mechanisms, oxaliplatin
INTRODUCTION
Over the past few decades, esophageal adenocarcinoma (EAC) has become an entity of increasing clinical importance. It is considered one of the fastest growing and deadliest cancers in the United States and the western world (1).The main risk factor for EAC is chronic gastroesophageal reflux disease (GERD), a life-long disease where the lower esophagus is exposed to genotoxic effects of acidic bile salts in the reflux. Malignant transformation during EAC carcinogenesis is associated with chronic damaging effects of reflux, which lead to a sequence of histopathological changes: from normal specialized intestinal metaplasia to low- and high-grade intraepithelial neoplasia toward invasive adenocarcinoma (2). The 5-year overall survival rate of EAC patients is approximately 20% (3). However, many patients present with advanced disease at diagnosis (stage III or IV), with a 5-year overall survival rate hovering approximately 5% (3). Discovering new therapeutic targets could thus enable the development of effective targeted therapies, which can be utilized alone or in combination with conventional therapies to improve the prognosis of patients with EAC.
SMAD family member 3 (SMAD3) is an attractive candidate prognostic and therapeutic marker in cancer (4, 5). It is a major transcription factor in the transforming growth factor-β (TGF-β) downstream signaling pathway, which plays a key role during carcinogenesis (6, 7). The TGF-β signaling pathway is well defined and involves the activation of the membrane-bound TGF-β receptor by the cytokine TGF-β, which phosphorylates intracellular SMAD proteins. Subsequently, these activated SMAD proteins are translocated into the nucleus, where they regulate the expression of target genes (8). TGF-β signaling appears to have a dual role in regulating tumorigenesis. In early tumor stages, TGF-β has tumor-suppressing activity; however, in later stages of tumor progression, TGF-β promotes tumor invasion and metastasis (9). Loss of the growth inhibitory response to TGF-β is a common feature of epithelial cancers. TGF-β has been shown to be overexpressed in various cancers, including breast (10), colon, lung, prostate (11) and esophageal squamous cell cancer (12). In contrast, the role of TGF-β in human esophageal adenocarcinomas is not yet well defined, as only some results from cell culture experiments are available. Overexpression of TGF-β in esophageal adenocarcinoma is associated with advanced stage of the disease and poor prognosis (13). TGF-β is an endogenous radioresistance factor in the esophageal adenocarcinoma cell line OE33 (14). In a recent study, Blum et al. (15) showed that the TGF-β and JNK signaling pathways are hyperactivated in EAC, where inhibition of either of these pathways can suppress the tumorigenic properties of these cells.
Increased DNA damage repair is one of the mechanisms involved in cancer drug resistance. Several endogenous or exogenous agents induce DNA lesions that trigger the cellular DNA damage response (DDR) to recognize and repair the damages (16). DNA double-strand breaks (DSBs) are among the most frequent DNA lesions. DSBs are recognized by the Mre11 complex, which then leads to the phosphorylation and activation of the ataxia-telangiectasia mutated (ATM) kinase that in turn activates several downstream targets involved in cell cycle progression and DNA repair. In case the damage is irreparable or there are defects in the DNA repair system, the cellular response switches towards induction of apoptosis (17). DSBs generation is a major strategy in cancer treatment. Understanding the mechanisms of repair and acquired resistance to these agents is important to improve the efficacy of current treatment regimens (18).
In this study, we investigated the expression of SMAD3, a key player in the TGF-β signaling pathway, in EAC. We also determined the functional and mechanistic roles of aberrant overexpression of SMAD3 in chemoresistance. Our results demonstrate that SMAD3 promotes DNA damage repair by promoting ATM phosphorylation via interaction with protein phosphatase 2A (PP2A) and inhibiting PP2A binding to ATM. Targeting SMAD3 sensitized EAC cells to oxaliplatin treatment by impeding DNA repair in vitro and in vivo.
MATERIALS AND METHODS
The key resources for reagents, kits and primer sequences are provided in Supplementary Tables 1, 2, and 3.
Cell Culture
The OE33 cell line was a kind gift from Dr. David Beer (University of Michigan, Ann Arbor, MI). The OE19 cell line was obtained from Millipore Sigma (Burlington, MA; catalog#96071721–1VL, RRID:CVCL_1622). OE33 and OE19 cells were maintained in RPMI 1640 media (Gibco; Thermo Fisher Scientific, RRID:SCR_008452, Waltham, MA, USA, cat. no. #11875093) supplemented with 10% fetal bovine serum (FBS) (Gibco; Thermo Fisher Scientific, RRID:SCR_008452, cat. no. # A3160402) and 1% penicillin/streptomycin (Gibco; Thermo Fisher Scientific, RRID:SCR_008452, cat. no. # 15070063). OE33 oxaliplatin-resistant cells were generated by treating the cells with increasing doses of oxaliplatin (starting at 0.1 μM up to 5 μM) for 6 months. All cells were grown at 37°C in a humidified incubator with 5% carbon dioxide and tested for mycoplasma contamination every month using a mycoplasma detection kit (PCR) (SouthernBiotech, RRID:SCR_019250, Birmingham, AL, USA). Cell line authentication is conducted routinely every six months (Last authenticated on 02/01/2024) through Labcorp’s Cell Line Authentication Services (Burlington, NC, USA).
Transfection and lentivirus infection
Scrambled siRNA was purchased from Santa Cruz Biotechnology (RRID:SCR_008987, CA, USA; sc-29470). SMAD3 siRNAs were obtained from Dharmacon (L-020067–00-0005; Lafayette, CO, USA) and Thermo Fisher Scientific, RRID:SCR_008452 (Catalog# 1299001). The mammalian expression flag-tagged SMAD3 plasmid was purchased from Addegene (Addgene plasmid # 11742; http://n2t.net/addgene:11742; RRID: Addgene_11742) (19). For transient overexpression of SMAD3, a mammalian expression plasmid or empty vector was transfected into cells using PolyJet reagent (SignaGen Laboratories, Rockville, MD, USA). For transient knockdown of SMAD3, si-SMAD3 or scrambled siRNA was transfected into cells using LipoJet reagent (SignaGen Laboratories, Rockville, MD, USA). Cells were harvested within 72 h of transient transfection. siRNA-based knockdown studies were conducted with a pool of 4 nonoverlapping siRNAs per gene (#1), and findings were further confirmed with a second pool of siRNAs per gene (#2), which showed better knockdown efficiency and was used in all the following experiments in this study (Supplementary Figure 1).
Western blot analysis
Following standard protocols, as previously described (20), cells and tissues were lysed in RIPA lysis buffer (Santa Cruz Biotechnology, RRID:SCR_008987; sc-24948) and quantified using the DC Bio-Rad Protein Assay (Bio-Rad Laboratories, RRID:SCR_008426, CA, USA) following the manufacturer’s protocol. An equal amount of protein lysates, prepared by adding 4X Laemmli sample buffer and heating at 85°C for 10 min, were separated by 10% SDS–PAGE for 90 min at 100 V and then transferred onto a nitrocellulose membrane (Bio-Rad Laboratories, RRID:SCR_008426, CA, USA). Membranes were blocked with 5% BSA for 1 h and then incubated overnight at 4°C with the primary antibody. After washing three times with 1X TBST, the membranes were incubated with the corresponding secondary antibody for 1 h at room temperature. Target proteins were detected using commercial Immobilon Western Chemiluminescent HRP Substrate detection reagents (Thermo Fisher Scientific, RRID:SCR_008452). Images were generated and quantified using ChemiDoc™ Imaging Systems (Bio-Rad Laboratories, RRID:SCR_008426, CA, USA).
Immunoprecipitation
The immunoprecipitation was performed following standard protocols, as previously described (20). Cells were lysed in Pierce™ IP Lysis Buffer (Thermo Fisher Scientific, RRID:SCR_008452) supplemented with 1 × Halt protease inhibitor cocktail and 1 × Halt phosphatase inhibitor cocktail (Thermo Fisher Scientific, RRID:SCR_008452). Cell lysates were incubated with Protein G Magnetic beads and 2 μg of antibody or control IgG overnight at 4°C with constant rotation. Following eight washes with PBST buffer (PBS containing 0.1% Tween® 20), the immunocomplexes were eluted with 4X Laemmli sample buffer diluted in RIPA lysis buffer (Santa Cruz Biotechnology, RRID:SCR_008987; sc-24948) to 1X, heated at 85°C for 10 min and used for western blot analysis, as described previously.
Quantitative real-time RT‒PCR
Total RNA was extracted using a RNeasy Mini Kit according to the manufacturer’s protocol. Total 1 μg/sample RNA was subjected to cDNA synthesis using the iScript™ cDNA Synthesis Kit (Bio-Rad Laboratories, RRID:SCR_008426). The primers used were designed using Primer 3 online tools (http://bioinfo.ut.ee/primer3-0.4.0/primer3/) and were obtained from Integrated DNA Technologies (Coralville, Iowa). Quantitative real-time polymerase chain reaction (qRT‒PCR) was carried out using an iCycler (Bio-Rad Laboratories, RRID:SCR_008426). All reactions were performed in triplicate. The fold expression was calculated and normalized to the average CT value of the HPRT housekeeping gene. The primer sequences are given in Supplementary Table 3.
Immunocytochemistry/ Immunofluorescence staining
Slides were cut from paraffin-embedded tissue blocks, followed by deparaffinization and rehydration according to standard protocols, as previously described (20). Antigen retrieval was performed by boiling the slides in 1 mmol/L Tris EDTA, pH 8.0 for 20 min. Slides were left to cool to room temperature then blocked with 10% normal goat serum (Thermo Fisher Scientific, RRID:SCR_008452; #50062Z) for 1 h. For immunofluorescence staining, cells were seeded in 8-well chambered slides. Cells were fixed with 4% paraformaldehyde for 45 min, permeabilized with 0.5% Triton X-100 for 10 min, then washed and blocked with 10% normal goat serum (Thermo Fisher Scientific, RRID:SCR_008452; #50062Z) for 1 h at room temperature. Slides were incubated with primary antibodies overnight at 4°C, then washed with PBS and incubated with secondary antibodies for 1 h at room temperature in a humidified chamber. Slides were washed and mounted with DAPI mounting medium (ab104139; Abcam, RRID:SCR_012931, Cambridge, UK). Images were acquired using a BZ-X710 KEYENCE All-in-One Fluorescence Microscope (Illinois, USA).
Image acquisition and analysis of γ-H2AX foci
Visualization and image acquisition was done on an automated KEYENCE All-in-One Fluorescence Microscope (BZ-X710, Illinois, USA) with a 63X oil immersion objective. Z-stack images covering the whole cells were collected at either 0.3 or 0.7 μm steps. A total of 50 cells per condition were collected for foci counting. Foci counting was performed by manual scoring. Discrete foci were counted as individual entities. Foci that appeared to overlap or merge into a prominent plague were counted as one entity unless the overlapping could be visibly distinguished between the consecutive Z-stacks. Scores were the total foci divided by the number of cells.
Animal experiments
All animal studies followed our approved protocol (UM-20–110) by the Institutional Animal Care and Use Committee of the University of Miami. Deidentified patient-derived xenografts (PDXs) from human gastroesophageal junctions were generated according to a previously described platform (21). PDX GTR0165 was used in the experiment. As previously described (20), uniformly cut sample pieces were implanted subcutaneously into bilateral flanks and tumor growth was monitored. Once the tumor volume reached approximately 150 mm3, mice were randomized into 4 groups: untreated, oxaliplatin, SiS3 and combination, each containing 6 mice. Oxaliplatin was dissolved in PBS and injected intravenously (IV) at a dose of 2 mg/kg twice a week for 4 weeks. SiS3 was dissolved in 2% DMSO, 2% Tween-80 and 96% water and was injected intravenously (IV) at a dose of 2.5 mg/kg every day for 4 weeks. Tumor width and length was measured with an electronic caliper every 3 days to monitor tumor growth. Body weight was measured once a week to monitor drug toxicity. Tumor volume was calculated using the following formula: tumor volume (mm3) = 1/2 (W)2 × (L). Mice were followed up for survival after the experimental treatment endpoint of 4 weeks and were sacrificed once the tumors reached 1000 mm3. A Kaplan–Meier survival estimate with a log-rank calculation was used to determine statistical significance.
Establishment of patient-derived esophageal organoids
All deidentified normal and esophageal adenocarcinoma tissues were obtained from the Biospecimen Shared Resource (BSSR) at the University of Miami. The Institutional Research Ethics Committee approved the study design of deidentified human tissues or data. The BSSR obtained informed consents from all patients prior to participation. The study complied with the principles outlined in the Declaration of Helsinki. Fresh tissue specimens were placed in human organoid growth medium (IntestiCult™ Organoid Growth Medium Stemcell Technologies, RRID:SCR_013642; #06010) and maintained at 4°C until processing, which was within an hour of surgical resection to enhance organoid generation. Esophageal tissue samples were 3–5 mm in size and were processed as previously described (22). Briefly, esophageal tumor tissue fragments were cut into 0.1–0.5 mm diameter pieces using sterile scalpel blades then washed with medium to remove cellular debris. Minced fragments were mostly used for organoid culturing; remaining fragments were either snap frozen in liquid nitrogen for RNA/protein extraction or transferred directly to 10% formalin for histological examination.
Processing of the esophageal tissue specimens for organoid culturing was performed as described by Mahe et al. (23). Briefly, minced tissue fragments were digested in 2 ml of 5 mg/ml collagenase type II (Gibco; Thermo Fisher Scientific, RRID:SCR_008452, cat. no. #17101–015) in Advanced DMEM-F12 (adDMEM/F12; Gibco; Thermo Fisher Scientific, RRID:SCR_008452, cat. no. #12634–010) for 45 min at 37°C. The pellet was further digested with TrypLE™ (Thermo Fisher Scientific, RRID:SCR_008452, cat. no. #12604021) followed by resuspension in adDMEM/F12. To remove tissue debris and obtain single-cell suspensions, the resuspended pellet was passed through a 40-μm cell strainer. Around 5,000 passage zero cells were frozen in fetal bovine serum (FBS; Thermo Fisher Scientific, RRID:SCR_008452, cat. no. # A3160402) + 10% dimethyl sulfoxide (DMSO; Sigma Aldrich, RRID:SCR_008988; cat. no. # D5879) and maintained in liquid nitrogen as a stock of patient-derived cells for later use. Cells were counted using trypan blue and were resuspended in growth factor-reduced Matrigel (Corning Life Sciences; cat. no. #354230) in a master mix at a ratio of 20,000 cells/50 μl 90% Matrigel. From this master mix, 50 μl droplets per well were plated in the center of a 24-well culture plate and allowed to solidify in a 37°C incubator for 30 min. Prewarmed (37°C) human organoid growth medium (IntestiCult™ Organoid Growth Medium Stemcell Technologies RRID:SCR_013642; #06010) was then added to each well.
Harvesting and passaging of organoids was performed after 10–14 days depending on the sample. As previously described (22), organoids were collected with a pipette tip by adding ice-cold adDMEM/F12 without factors. Organoids were then dissociated enzymatically using TrypLE and cells were split at a ratio of 1:2 or 1:3 depending on the pellet. Cells were finally resuspended in 90% Matrigel and seeded as aforementioned.
Treatments of patient-derived esophageal organoids
As previously described (22), human organoid growth medium (IntestiCult™ Organoid Growth Medium Stemcell Technologies RRID:SCR_013642; #06010) was added to the cell suspensions derived from the digested tissues in the presence or absence of the tested drugs (triplicates each). The organoid culture was maintained at 37°C in a humidified incubator with 5% CO2 and the culture medium was changed every 2–3 days. All drugs were dissolved in DMSO to a final concentration of 0.1% (v/v). The drugs tested were oxaliplatin (Millipore Sigma, RRID:SCR_008988; cat. no. # O9512–5MG) and SiS3 (Selleck Chemicals, RRID:SCR_003823; cat. no. S7959). To assess the effect of drugs on proliferation and survival, the diameter and number of organoids were analyzed after 10–14 days. A total of ≥50 organoids were used to calculate the mean diameter using the Perfect Screen Ruler program. The total number of organoids was counted manually under bright-field light microscopy (20X objective).
TUNEL assay
Apoptosis was determined using the In-Situ Cell Death Fluorescein Detection Kit (11684795910, Sigma‒Aldrich, RRID:SCR_008988, Germany) following the manufacturer’s instructions. For visualization of nuclei and mounting, Fluoroshield Mounting Medium with DAPI (ab104139; Abcam, RRID:SCR_012931) was used, and samples were analyzed using a BZ-X710 KEYENCE All-in-One Fluorescence Microscope.
Cell Viability ATP-Glo
Cells were seeded at 1000 cells per well in 96-well plates and treated with oxaliplatin (range: 0.10–30 μM) or PBS (control) for 5 days. Cell viability was measured using the CellTiter-Glo Cell Viability Assay (Promega, RRID:SCR_006724, Madison, WI, USA). Changes in absorbance were recorded in a FluolarStar luminescence microplate reader (BMG Labtech, RRID:SCR_025024, Ortenberg, Germany).
Protein phosphatase assay
Cells were washed twice in Tris buffer (pH 7.5), and total cellular proteins were extracted in lysis buffer containing 20 mmol/L imidazole HCl, 2 mmol/L EDTA, 2 mmol/L EGTA, pH 7.0 with 10 μg/mL protease inhibitor cocktail but without phosphatase inhibitors. PP2A activity was measured using a nonradioactive immunoprecipitation Malachite Green Phosphate Assay Kit (Millipore Sigma, RRID:SCR_008988; cat. no. MAK307). Okadaic acid (Abcam, RRID:SCR_012931; cat. no. ab120375) treatment was performed at 50 nmol/L overnight (16 hours). All procedures were performed according to the manufacturer’s protocol, and changes in absorbance were recorded at 650 nm in a FluolarStar luminescence microplate reader (BMG Labtech, RRID:SCR_025024, Ortenberg, Germany).
Annexin V staining
Apoptosis analysis was performed using an Annexin V Apoptosis Detection Kit I (BD Pharmingen™, San Jose, CA, USA) following the manufacturer’s protocol. A total of 1.5 × 10⁵ cells were seeded in duplicate in 6-well plates, and the next day, the cells were transfected with control and SMAD3 siRNA (50 nM OE33 cells and 100 nM OE19 cells). Twenty-four hours after transfection, the cells were treated with oxaliplatin. Cells were harvested after 48 h of oxaliplatin treatment and washed in PBS. The pellet was resuspended in binding buffer and stained with Annexin-V and Sytox Red in the dark for 30 min at room temperature. Apoptotic cells were analyzed with fluorescence-activated cell sorting (FACS) using a flow cytometer (Becton Dickinson).
Bioinformatics analysis of public databases
The mRNA expression data of the esophageal adenocarcinoma (EAC) cohort were obtained from The Cancer Genome Atlas (TCGA) (https://portal.gdc.cancer.gov/, Genomic Data Commons Data Portal (GDC Data Portal, RRID:SCR_014514) and Gene Expression Omnibus (GEO), RRID:SCR_005012 (https://www.ncbi.nlm.nih.gov/gds) databases. Samples diagnosed with EAC were enrolled for further analysis. The number of EAC samples included in each cohort was as follows: TCGA (n = 79), GSE13898 (n = 64), and GSE165252 (n = 77). The expression data were analyzed in the R environment (version 4.1.3). Boxplots were drawn using R software. Differential expression gene analysis was performed with the Limma package (LIMMA, RRID:SCR_010943) with the threshold of p value <0.05 and cut off of log2FC >mean(|log2FC|)+2*sd(|log2FC|). All hallmark gene sets were obtained from MSigDB (https://www.gsea-msigdb.org/). Kaplan–Meier Plotter (http://kmplot.com) was used to analyze EAC cancer patients’ overall survival using the TCGA database.
Statistical analysis
All data were statistically analyzed by GraphPad Prism 8.0 (GraphPad Prism, RRID:SCR_002798, San Diego, CA, USA). The results were quantified and expressed as the mean ± SD or SEM. Differences between two independent variables were determined by Student’s t test, while comparisons among multiple groups (≥3 groups) were estimated by one-way ANOVA, followed by the Bonferroni post hoc correction. Survival analysis was performed using Kaplan‒Meier plots and log-rank tests. p<0.05 was considered to be statistically significant. Each biochemical experiment was performed in triplicate unless otherwise specified.
Data Availability Statement
All data are available in the main text or the supplementary materials. The datasets analyzed in this study are TCGA, GSE13898, and GSE165252.
RESULTS
Subhead 1: SMAD3 is enriched in EAC and associated with poor patient survival
Analysis of the TCGA-EAC dataset showed significant upregulation of mRNA levels of SMAD3 but not SMAD2 or SMAD4 (Figure 1A). Gene set enrichment analysis (GSEA) on TCGA and GEO datasets for EAC versus normal esophagus (NE) patient samples demonstrated significant enrichment of the SMAD3 gene signature in EAC patients in comparison with NE patient samples (Figure 1B). Survival analysis of the TCGA-EAC dataset revealed poor survival in patients with high SMAD3 expression (Figure 1C).
Fig. 1. SMAD3 is upregulated in EAC and associated with poor survival.
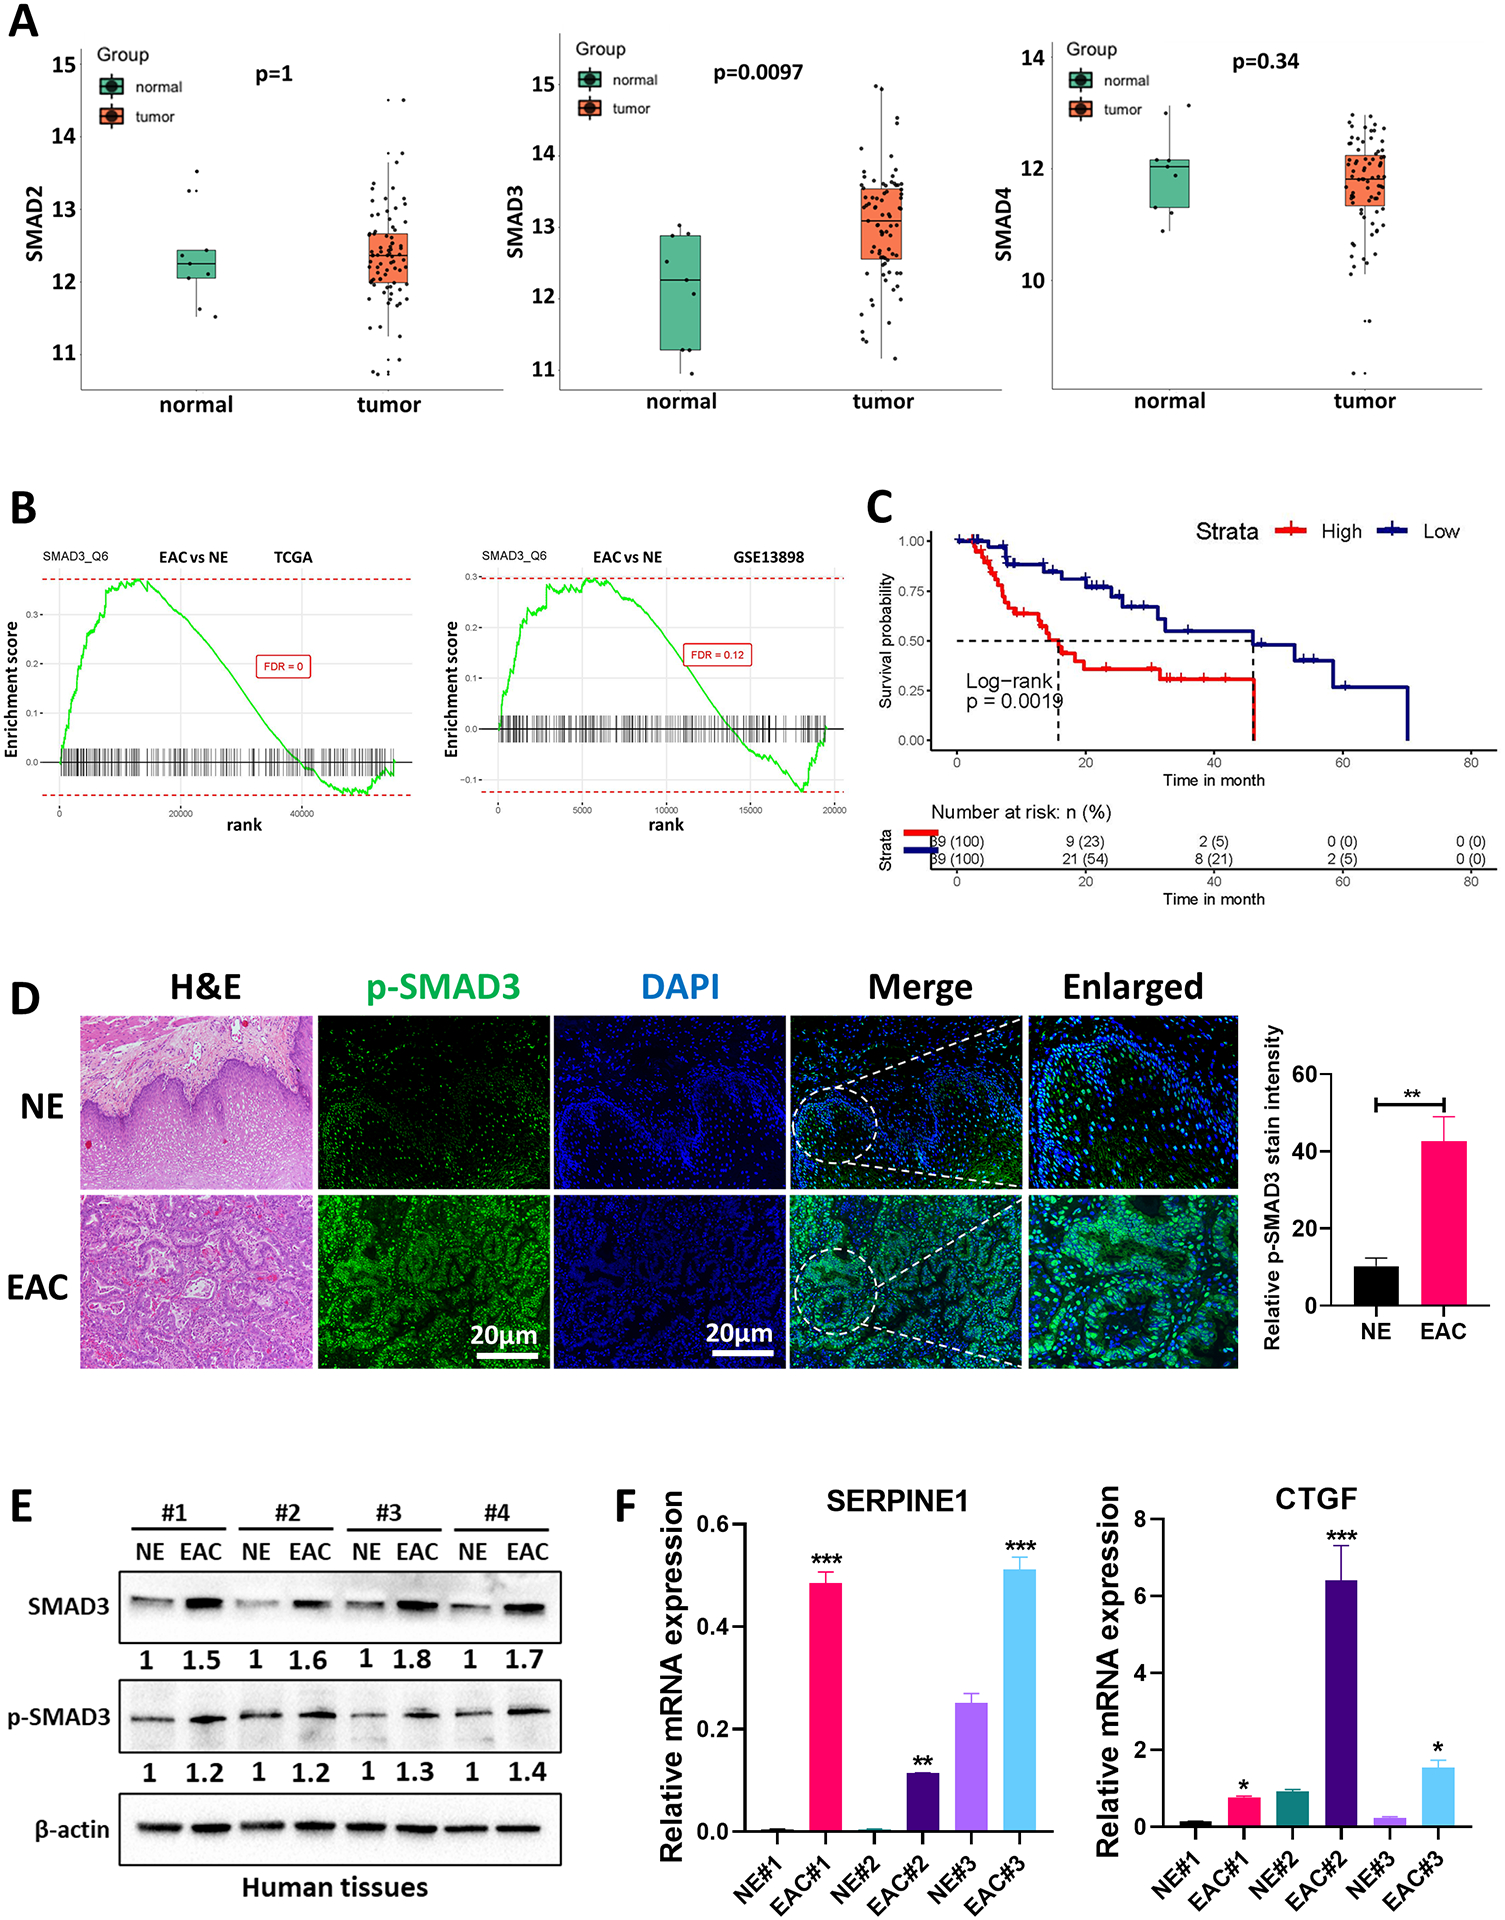
(A) Boxplot showing the gene expression of SMAD2, SMAD3 and SMAD4 between esophageal adenocarcinoma (EAC) (n=79) and normal esophagus (NE) (n=9) in the TCGA dataset. The expression levels are presented as Log2 of the read counts in the TCGA dataset. (B) GSEA of SMAD3 comparing EAC with NE in the TCGA dataset and GEO GSE13898 dataset. (C) Kaplan‒Meier plot analyzing the association between SMAD3 gene expression levels and EAC patients’ overall survival in the TCGA database. (D) Immunofluorescence staining and quantification of phosphorylated SMAD3 (p-SMAD3) (green) in a representative NE and EAC human tissue. DAPI was used for nuclear staining. (E) Western blot analysis of total and phosphorylated SMAD3 protein expression in NE and EAC human tissues. β-actin was used for normalization and a representative β-actin was shown. Quantitative analysis of protein expression is included under the corresponding blot. (F) Quantitative RT‒PCR of representative SMAD target gene (SERPINE1 and CTGF) expression in primary tissue samples from NE and EAC. The gene expression levels are presented as relative gene expression levels normalized to the HPRT of the same samples. All quantification data represent n = 3 biologically independent samples; data are presented as mean ± SEM; *P<0.05; **P<0.01; ***P<0.001.
To validate these results, we tested deidentified primary human EAC tissues for the levels of protein phosphorylation and target gene expression associated with active TGFβ-SMAD signaling. Immunofluorescence (IF) analysis of phosphorylated SMAD3 protein (Ser423/425), a key functional readout of TGFβ-SMAD pathway activation, showed higher levels of p-SMAD3 in primary EAC tumors compared with NE (Figure 1D). Western blot analysis also showed upregulation of total and phosphorylated SMAD3 in EAC vs NE (Figure 1E). The mRNA expression of representative SMAD target genes (SERPINE1 and CTGF) (Figure 1F) demonstrated overexpression of these genes in primary EACs compared to NEs.
Taken together, our findings of upregulated SMAD3 expression in EAC suggest that it could play a role in tumor progression and poor clinical outcome.
Subhead 2: Elevated SMAD3 is associated with a reduced response to oxaliplatin in EAC
The observed upregulation of SMAD3 expression in EAC (as depicted in Figure 1) prompted us to investigate its potential association with decreased response to chemotherapy. To address this, we analyzed the GSE165252 dataset, which includes RNA sequencing data from resectable EAC patients treated with neoadjuvant chemoradiotherapy combined with the PD-L1 inhibitor atezolizumab. GSEA of the GSE165252 dataset revealed a marked enrichment of SMAD3 in non-responding patients compared to those who responded favorably (Figure 2A).
Fig. 2. SMAD3 is associated with a poor response to chemotherapy and mediates resistance to oxaliplatin by regulating DNA damage/repair in EAC.
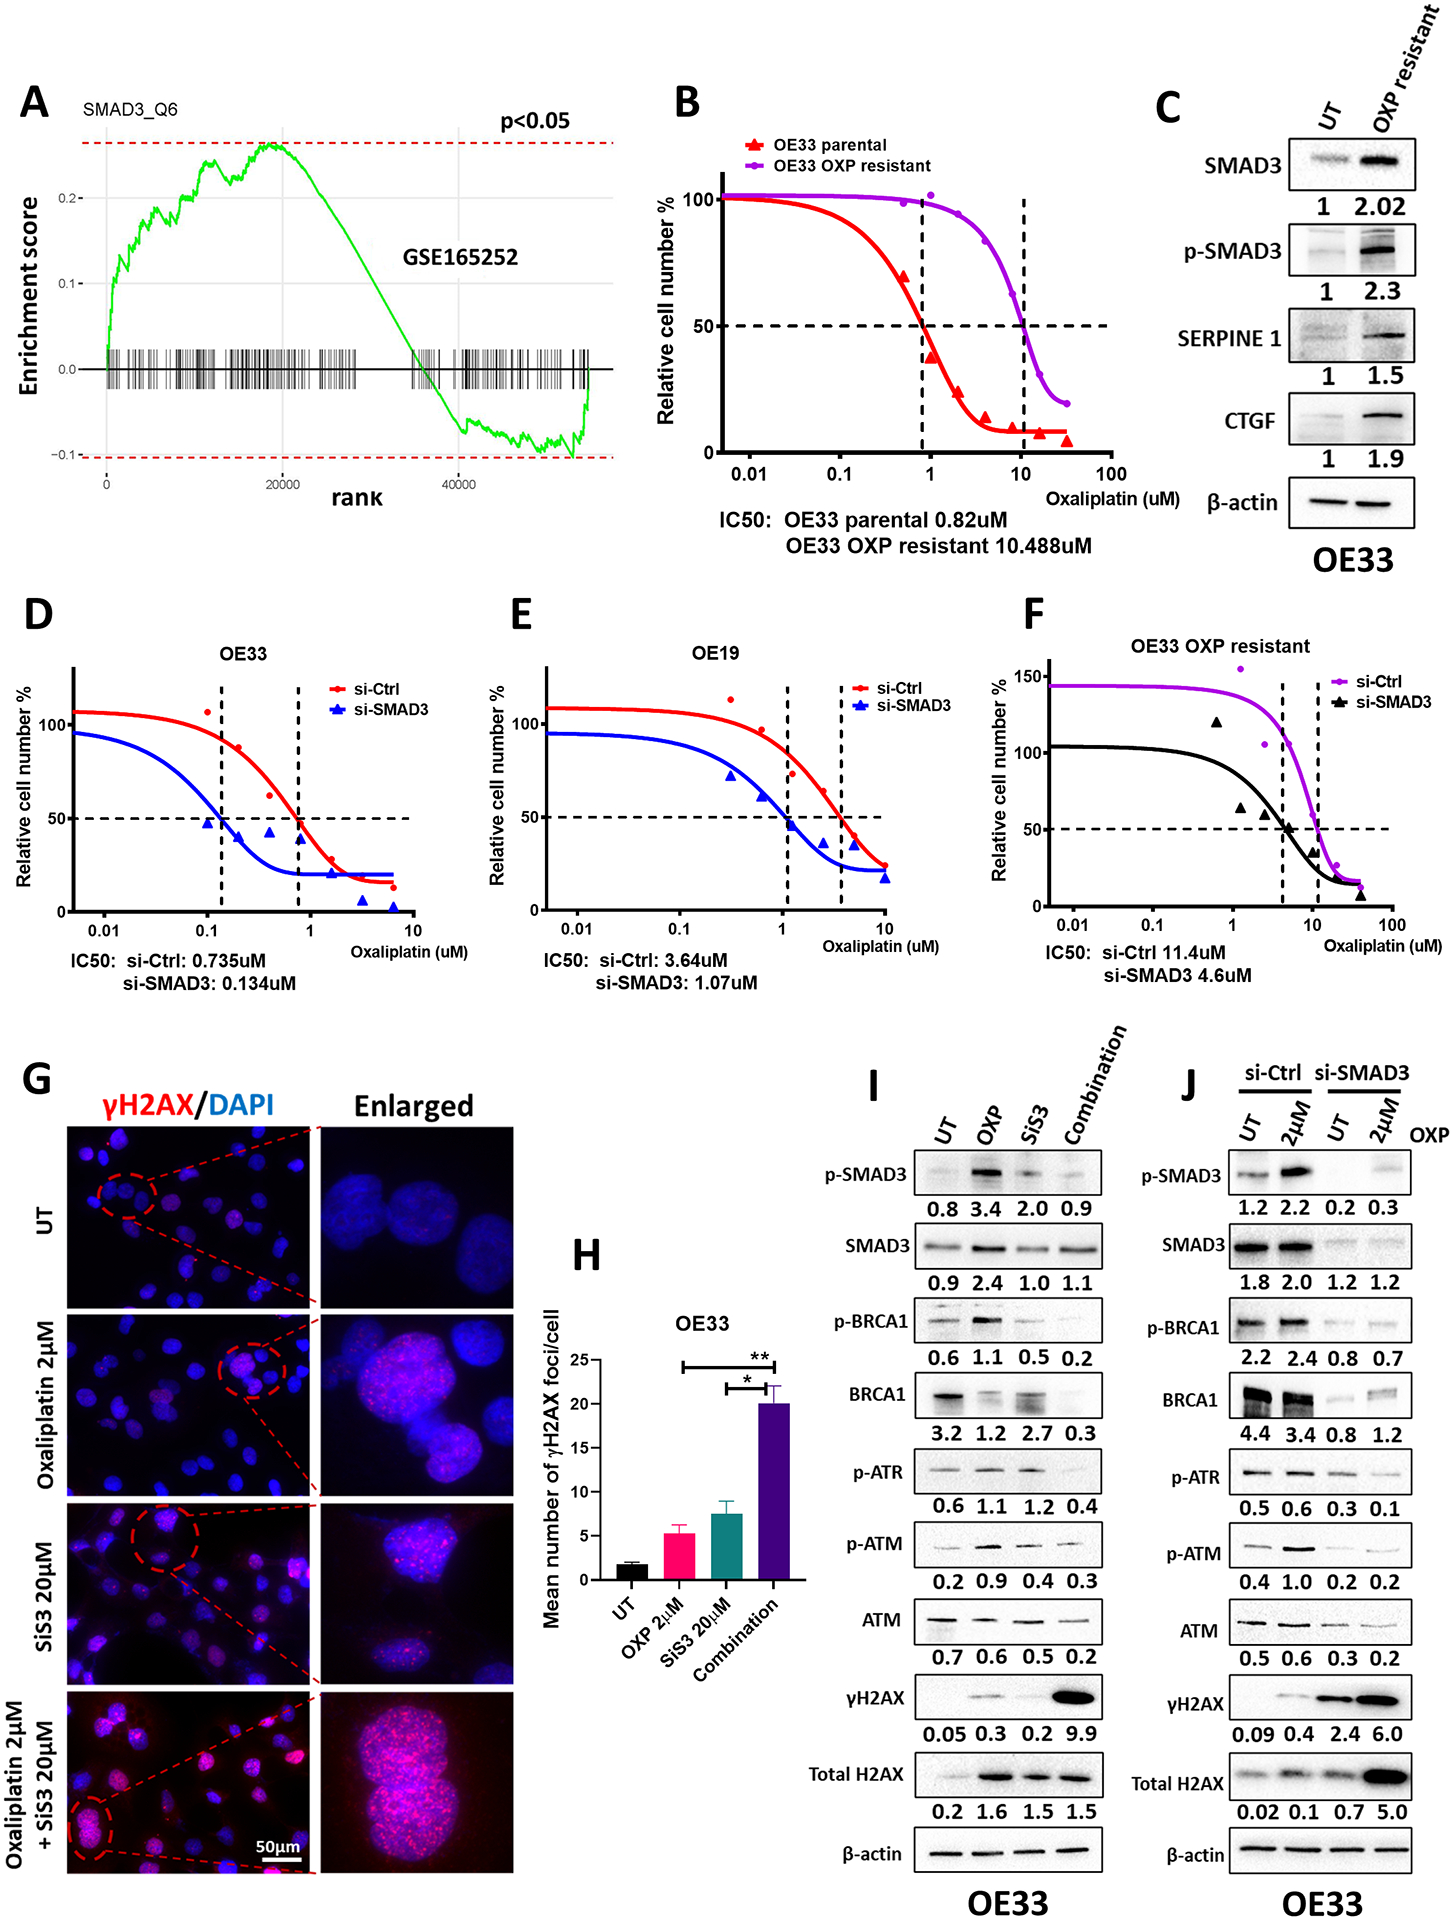
(A) GSEA of SMAD3 comparing therapy responders with non-responders in the GEO GSE165252 dataset. (B) CellTiter Glo cell viability assay showing the IC50 of oxaliplatin treatment in OE33 parental cells (0.82 μM) and OE33 oxaliplatin-resistant cells (10.48 μM). (C) Western blot analysis of total SMAD3, phosphorylated SMAD3, and representative SMAD target (SERPINE1 and CTGF) protein expression in OE33 parental cells and OE33 oxaliplatin-resistant cells. β-actin was used for normalization and a representative β-actin was shown. Quantitative analysis of protein expression is included under the corresponding blot. (D–F) CellTiter Glo cell viability assay showing the IC50 of oxaliplatin treatment in OE33 (D), OE19 (E), and OE33 oxaliplatin-resistant cells (F) with and without SMAD3 knockdown. The black dotted lines in (B) and (D–F) indicate the cross-points between the 50% survival line and the dose‒response curve. (G) Immunofluorescence staining of phosphorylated H2AX (γH2AX) (red) in OE33 cells treated with oxaliplatin, SiS3 or their combination. DAPI was used for nuclear staining. (H) Quantification of γH2AX immunofluorescence results from (G) (n = 3 biologically independent samples; data are presented as mean ± SD; *P<0.05; **P<0.01; ***P<0.001). (I–J) Western blot analysis of total and phosphorylated SMAD3, total and phosphorylated BRCA1, p-ATR, total and phosphorylated ATM, and total and phosphorylated H2AX protein expression in OE33 cells treated with oxaliplatin (2 μM), SiS3 (20 μM) or a combination (2 μM oxaliplatin and 20 μM SiS3) (I) and OE33 cells with or without SMAD3 knockdown and oxaliplatin treatment (J). β-actin was used for normalization and a representative β-actin was shown. Quantitative analysis of protein expression is included under the corresponding blot (n = 3 biologically independent samples). Similar results were obtained with OE19 cells (Supplementary Figure 2).
To further elucidate the role of SMAD3 in oxaliplatin resistance, we generated an oxaliplatin-resistant EAC cell line (refer to the Methods section for details) (Figure 2B). Oxaliplatin is one of the common chemotherapeutic drugs used in standard treatments of esophageal cancer; however, dose-limiting side effects and primary or secondary drug resistance diminish its effectiveness (16). Intriguingly, oxaliplatin-resistant OE33 cells showed elevated levels of SMAD3, phosphorylated SMAD3 and representative SMAD target proteins, SERPINE1 and CTGF, when compared to their parental cells (Figure 2C). Notably, small interfering RNA (siRNA)-based transient knockdown of SMAD3 enhanced the sensitivity of EAC cell lines, OE33 and OE19, as well as oxaliplatin-resistant OE33 cells to oxaliplatin treatment (Figure 2D–F). These findings provocatively suggest that SMAD3 may mediate oxaliplatin resistance in EAC.
Subhead 3: SMAD3 knockdown/inhibition sensitizes EAC cells to oxaliplatin by increasing DNA damage levels
Because of the known cytotoxic DNA damage mode of action of oxaliplatin, we tested whether the enhanced sensitivity of EAC cells to oxaliplatin upon SMAD3 inhibition is a result of an augmented DNA damage effect. An early cellular response to double-strand DNA breaks is phosphorylation at Ser139 of a subclass of eukaryotic histone H2AX to form phosphorylated H2AX (γH2AX). Treatment of OE33 EAC cells with a combination of oxaliplatin and SiS3, a potent and selective inhibitor of SMAD3 phosphorylation (17), caused significant induction of γ-H2AX (Figure 2G & H) with a concomitant reduction in the levels of the DNA repair signaling proteins BRCA1, ATM and ATR when compared to single treatments (Figure 2I). Similarly, knockdown of SMAD3 in combination with oxaliplatin treatment enhanced DNA damage and decreased the cellular response to repair (Figure 2J).
To further confirm these findings, we reprised the described studies in a second EAC cell line model, OE19. Similar to OE33 cells, inhibition or knockdown of SMAD3 in combination with oxaliplatin enhanced DNA damage, as evidenced by the increased level of γH2AX (Suppl. Figure 2A & B) and reduced level of the repair proteins ATM, ATR, and BRCA1 (Suppl. Figure 2C and D).
Subhead 4: SMAD3 inhibition induces apoptosis in oxaliplatin-sensitized EAC cells
Following the induction of DNA damage, a prominent route of cell inactivation is apoptosis. To test the effect of treatment on apoptosis induction in EAC cells, we performed FITC/Annexin V staining and flow cytometry analysis (Figure 3A and Supp. Figure 3A). Treatment with oxaliplatin in combination with SMAD3 knockdown/inhibition markedly induced apoptosis in OE33 EAC cells, with 46.4% (p value<0.001) of apoptotic cells compared to 4.3% in untreated cells, 12.3% in oxaliplatin-treated cells and 11.6% in SMAD3 knockdown cells (Figure 3A and Supp. Figure 3A). Additionally, TUNEL staining showed a significant increase in the number of TUNEL-positive cells in the combination group compared to the single treatments, further confirming apoptosis induction (Figure 3B & C). In line with these results, our qRT‒PCR analysis showed a reduction in the expression of the antiapoptotic genes BCL-2 and BCL-XL and upregulation in the expression of the proapoptotic gene PUMA in the combination group compared to single treatments (Figure 3D and Supp. Figure 3B). This was also associated with enhanced PARP cleavage and a reduction in BCL-2 and BCL-XL protein levels (Figure 3E & F). Similar results were recapitulated in a second EAC cell line model, OE19 (Supp. Figure 3A–F and Supp. Figure 4A–B). These results indicate that targeting SMAD3 induces irreparable DNA damage in oxaliplatin-treated EAC cells that ultimately leads to apoptosis.
Fig. 3. SMAD3 inhibition sensitizes oxaliplatin-treated EAC cells to apoptosis.
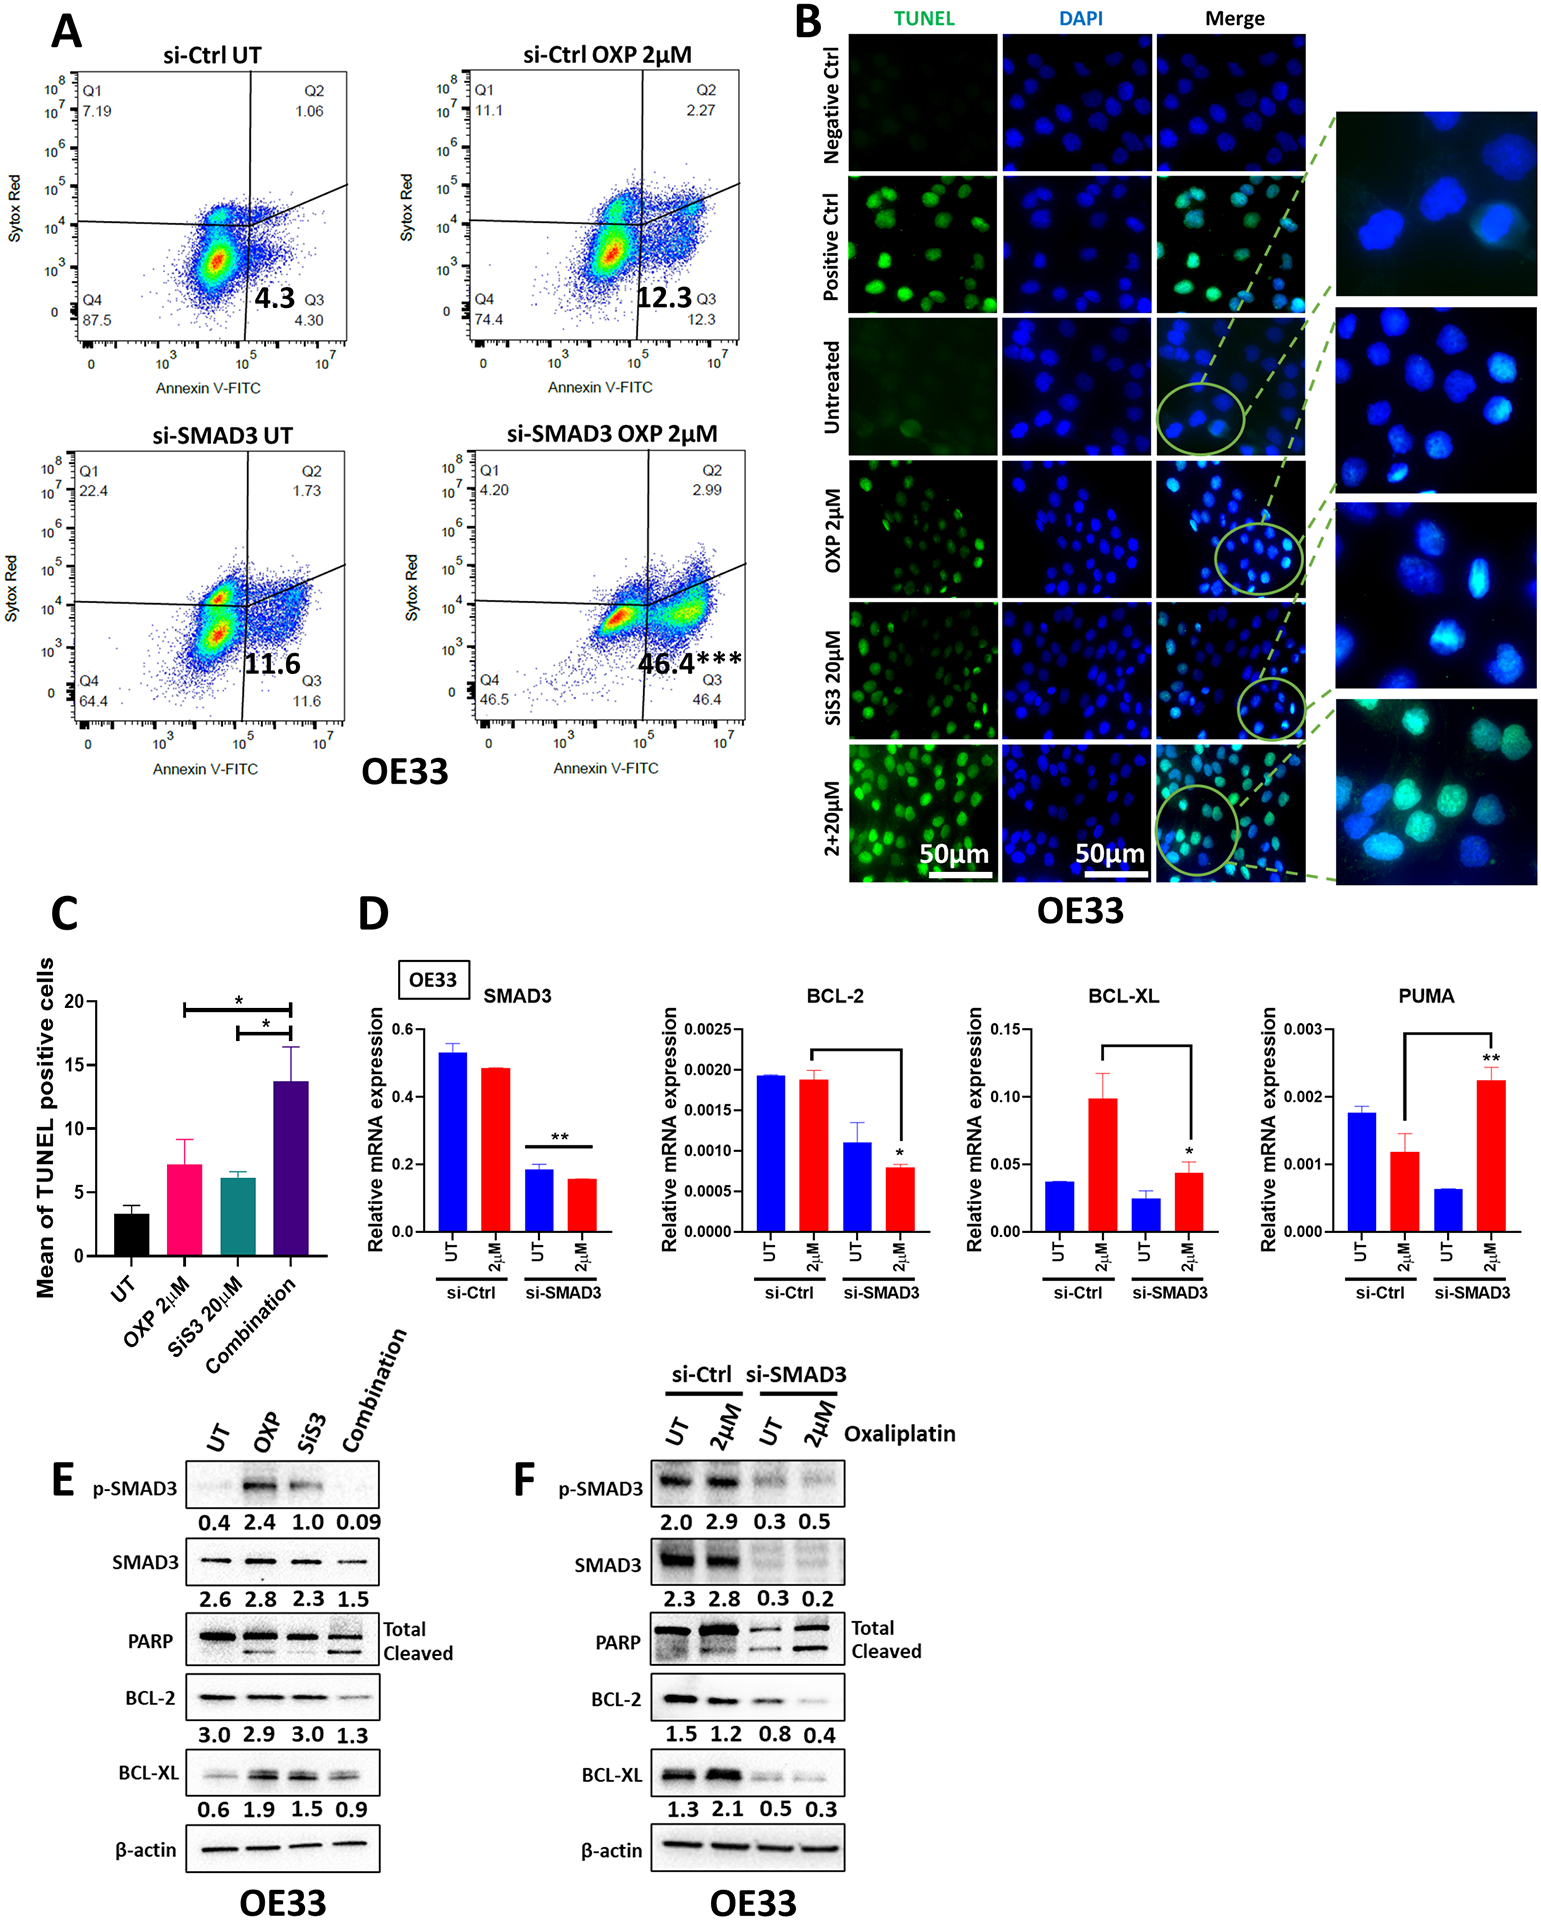
(A) Annexin V and Sytox Red flow cytometric analysis of OE33 cells transfected with si-Ctrl or si-SMAD3 with or without oxaliplatin treatment. (B) Representative TUNEL staining images of OE33 cells untreated or treated with oxaliplatin, SiS3 or the combination. (C) TUNEL-positive cells were counted and are represented as the mean ± SEM (n = 3 biologically independent samples; *P<0.05; **P<0.01; ***P<0.001). (D) Quantitative RT‒PCR of SMAD3, BCL-2, BCL-XL, and PUMA in OE33 cells transfected with si-Ctrl or si-SMAD3 with or without oxaliplatin treatment. The gene expression levels are presented as relative gene expression normalized to the HPRT of the same samples (n = 3 biologically independent samples; data are presented as mean ± SEM; *P<0.05; **P<0.01; ***P<0.001). (E–F) Western blot analysis of total and phosphorylated SMAD3, PARP, BCL-2, and BCL-XL protein expression in OE33 cells treated with oxaliplatin (2 μM), SiS3 (20 μM) or a combination (2 μM oxaliplatin and 20 μM SiS3) (E) and OE33 cells with or without SMAD3 knockdown and oxaliplatin treatment (F). β-actin was used for normalization and a representative β-actin is shown. Quantitative analysis of protein expression is included under the corresponding blot (n = 3 biologically independent samples). Similar results were obtained with OE19 cells (Supplementary Figure 3 and 4).
Subhead 5: SMAD3 regulates the DNA damage pathway by interacting with protein phosphatase 2A (PP2A)
To characterize the mechanism by which SMAD3 regulates the DNA damage pathway, we focused on ATM because our data indicated that SMAD3 inhibition abrogated ATM activation (Figure 2I & J). ATM is the primary transducer of double-strand break (DSB)-induced signaling (24). We observed no significant change in the mRNA expression level of ATM upon SMAD3 knockdown across EAC cell lines (Suppl. Figure 5A); therefore, we hypothesized that the regulation is at the protein level. Several phosphatases interact with and regulate ATM, including protein phosphatase 2A (PP2A), protein phosphatase 5 (PP5), and wild-type p53-induced phosphatase 1 (WIP1) (24). We analyzed the protein levels of these phosphatases in EAC cells with and without SMAD3 knockdown by western blot. Changes in PP2A levels were observed, while PP5 and WIP1 remained unaffected upon SMAD3 knockdown (Suppl. Figure 5B). Therefore, we focused on PP2A in our further analysis. To determine whether SMAD3 regulates ATM through PP2A, SMAD3 was knocked down either in the presence or absence of okadaic acid, a PP2A inhibitor, in OE33 and OE19 cells. In the absence of okadaic acid, SMAD3 knockdown resulted in decreased PP2Ac phosphorylation at the Y307 residue, which is indicative of enhanced catalytic subunit activity, and decreased p-ATM protein levels in OE33 and OE19 cells (Figure 4A). However, knocking down SMAD3 in combination with okadaic acid treatment increased PP2Ac phosphorylation at the Y307 residue and restored ATM phosphorylation in OE33 and OE19 cells (Figure 4A). In line with this, the phosphatase activity assay data confirmed that SMAD3 negatively regulates PP2A activity, where knockdown or inhibition of SMAD3 increased PP2A activity, whereas overexpression of SMAD3 significantly reduced it (Figure 4B and Suppl. Figure 5D).
Fig. 4. SMAD3 regulates ATM-mediated DNA repair by interacting with PP2A.
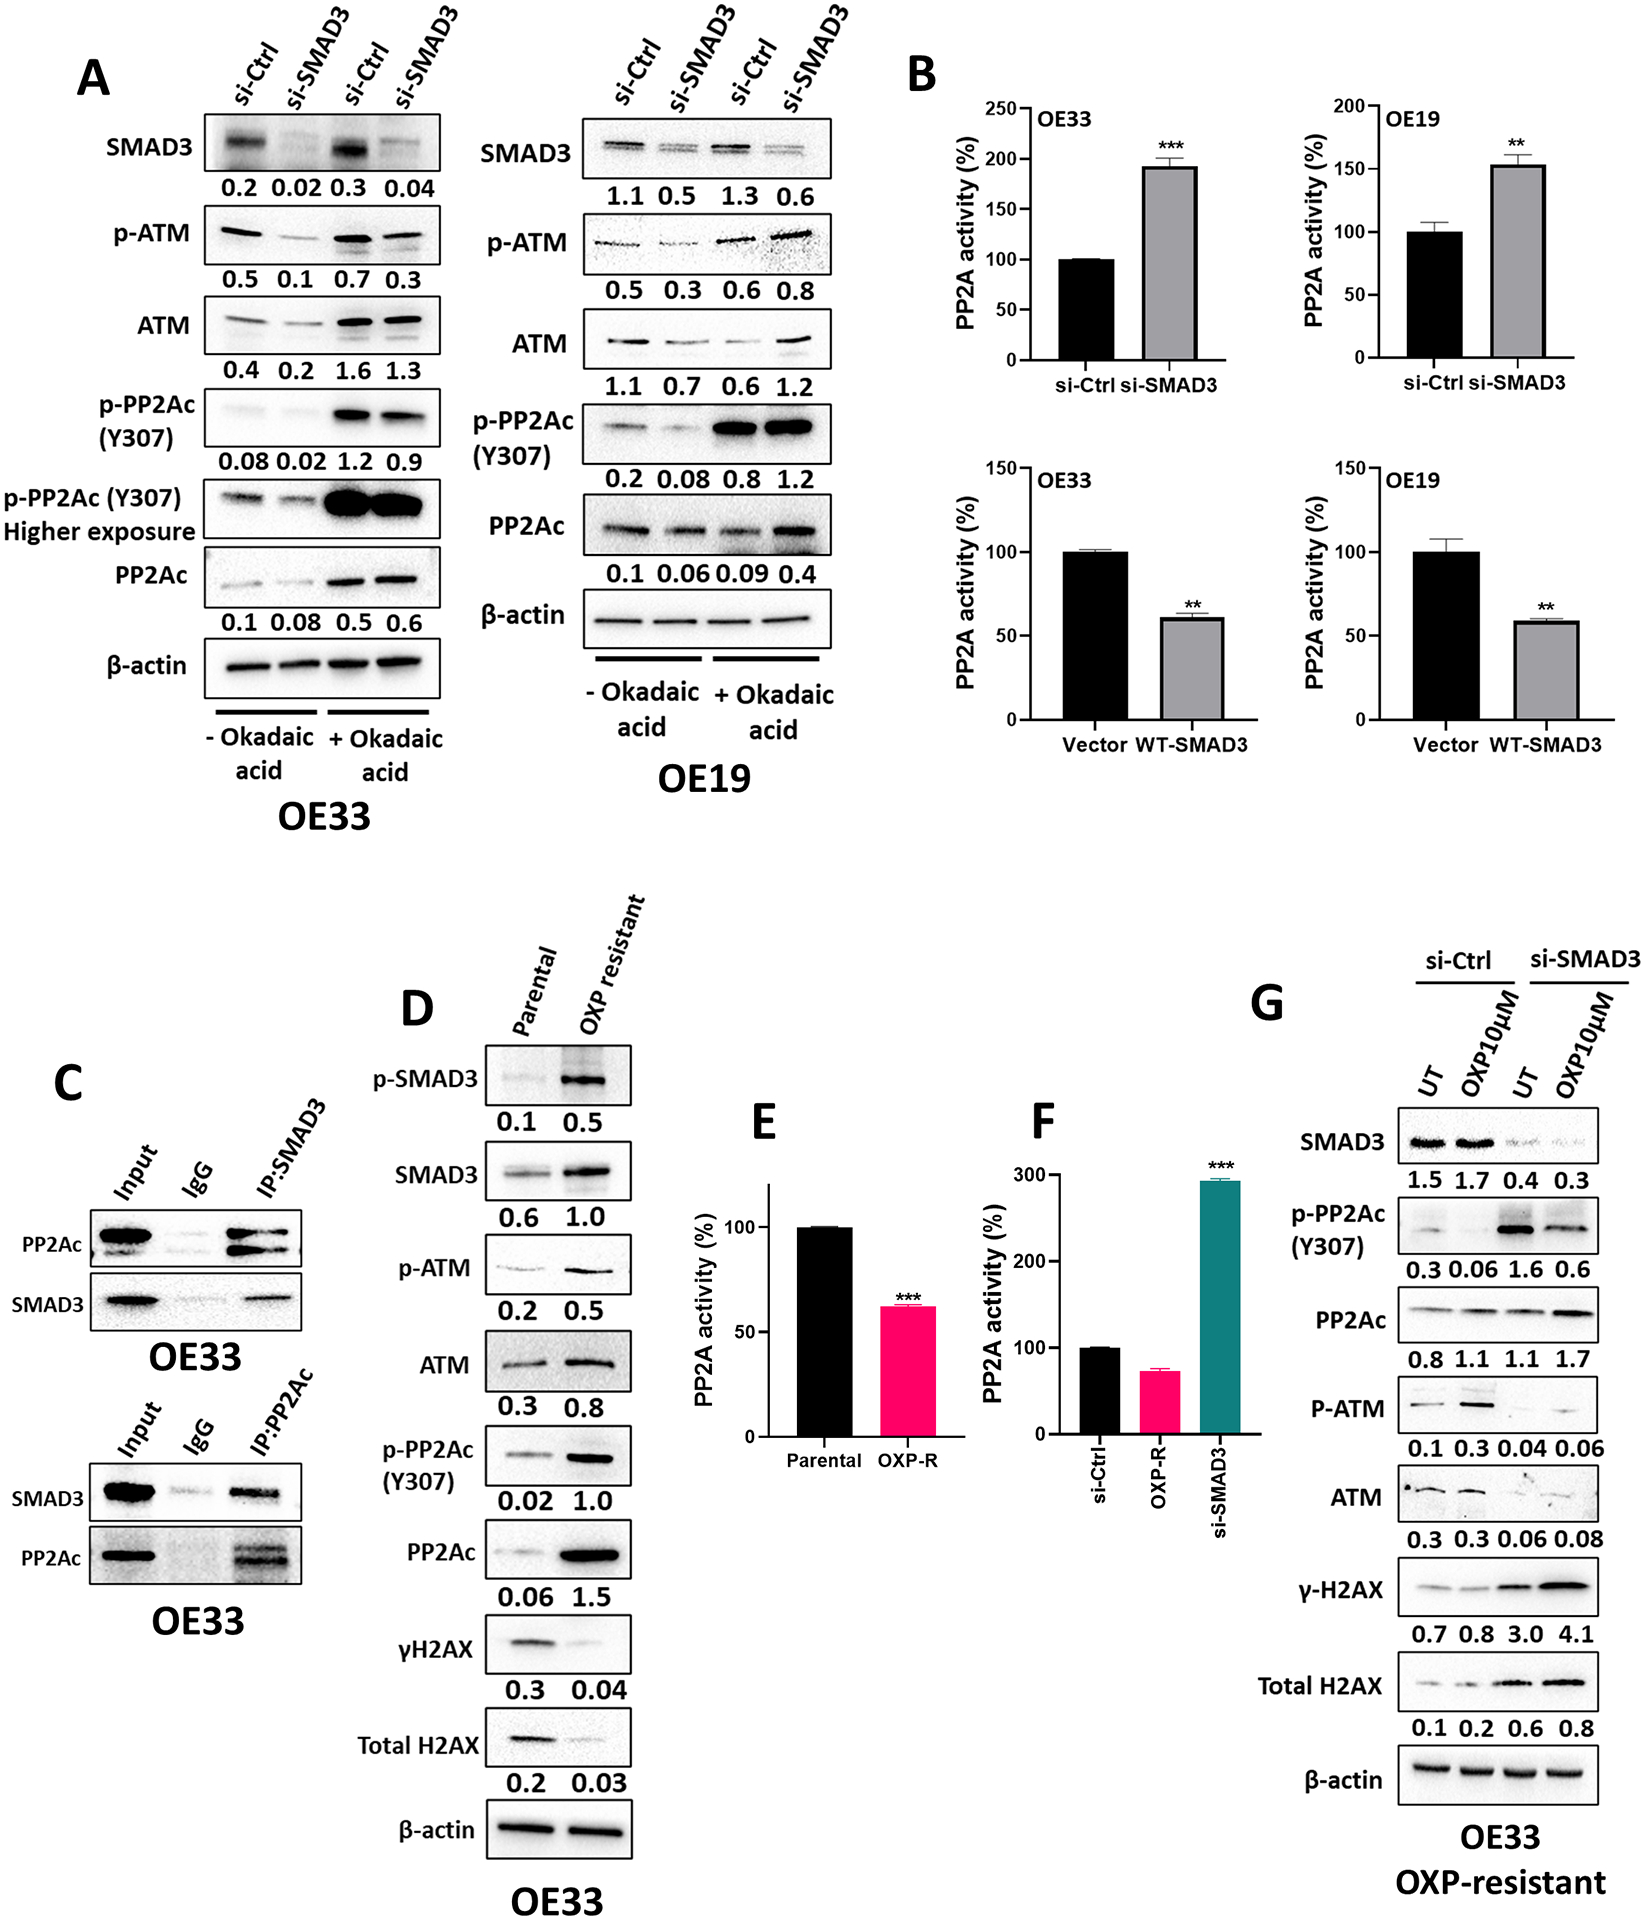
(A) Western blot analysis of SMAD3, total and phosphorylated ATM and total and phosphorylated PP2Ac protein expression in OE33 and OE19 cells transfected with si-Ctrl or si-SMAD3 with or without okadaic acid treatment. β-actin was used for normalization and a representative β-actin is shown. Quantitative analysis of protein expression is included under the corresponding blot (n = 3 biologically independent samples). (B) PP2A activity assay in OE33 and OE19 cells transfected with si-Ctrl or si-SMAD3 and vector or wild-type (WT) SMAD3 plasmid (n = 3 biologically independent samples; data are presented as % change relative corresponding control group ± SD; *P<0.05; **P<0.01; ***P<0.001). (C) Western blot analysis of SMAD3- or PP2A-immunoprecipitated proteins in OE33 cells showing the interaction between SMAD3 and PP2Ac. (D) Western blot analysis of total and phosphorylated SMAD3, total and phosphorylated ATM, total and phosphorylated H2AX, and total and phosphorylated PP2Ac protein expression in OE33 parental and oxaliplatin-resistant cells. β-actin was used for normalization and a representative β-actin was shown. Quantitative analysis of protein expression is included under the corresponding blot (n = 3 biologically independent samples). (E–F) PP2A activity assay in OE33 parental and oxaliplatin-resistant cells (E) and in OE33 oxaliplatin-resistant cells with and without SMAD3 knockdown (F) (n = 3 biologically independent samples; data are presented as % change relative corresponding control group ± SD; *P<0.05; **P<0.01; ***P<0.001). (G) Western blot analysis of SMAD3, total and phosphorylated ATM, total and phosphorylated H2AX, and total and phosphorylated PP2Ac protein expression in OE33 oxaliplatin-resistant cells with and without SMAD3 knockdown. β-actin was used for normalization and a representative β-actin was shown. Quantitative analysis of protein expression is included under the corresponding blot (n = 3 biologically independent samples).
To identify the mechanism by which SMAD3 regulates PP2A, we examined the potential protein binding between PP2Ac and SMAD3. Western blot analysis of immunoprecipitated proteins indicated a direct interaction between SMAD3 and PP2Ac in OE33 cells (Figure 4C). It is worth mentioning that no interaction was detected between SMAD3 and PP5 or WIP1 (Suppl. Figure 5C). Importantly, the expression level of the PP2A catalytic unit p-PP2Ac (Y307) was markedly higher in oxaliplatin-resistant OE33 cells than in parental cells (Figure 4D). This was associated with an increase in p-ATM levels and a concurrent decrease in γH2AX protein levels in the resistant cells (Figure 4D). Consistent with the increased phosphorylation of p-PP2Ac (Y307), we detected a significant reduction in PP2A activity (Figure 4E). Notably, SMAD3 knockdown significantly restored PP2A activity in the resistant cells (Figure 4F) and enhanced their response to treatment, as evidenced by the increased γH2AX and decreased p-ATM levels (Figure 4G).
Together, these data compellingly suggest that SMAD3 plays a pivotal role in fostering resistance to oxaliplatin, in part by facilitating ATM activation via its interaction with and consequent inhibition of PP2A activity.
Subhead 6: SMAD3 inhibition enhances the response to oxaliplatin in human organoids and PDX models
We established patient-derived organoids (PDOs) from EAC tissues and PDXs to model the disease in 3D culture. Tumor organoids were treated with oxaliplatin, SiS3, or their combination. After 10–12 days, the number and size of organoids were evaluated. The combination of oxaliplatin and SiS3 significantly reduced organoid count and size compared to single-drug treatments (Figure 5A & B). Interestingly, combining oxaliplatin and SiS3 led to a remarkable increase in γH2AX (Figure 5C & D) and a decrease in p-ATM levels (Figure 5D), which was more pronounced than either treatment alone.
Fig. 5. SMAD3 inhibition and oxaliplatin treatment reduce the count and size of patient-derived organoids/tumoroids.
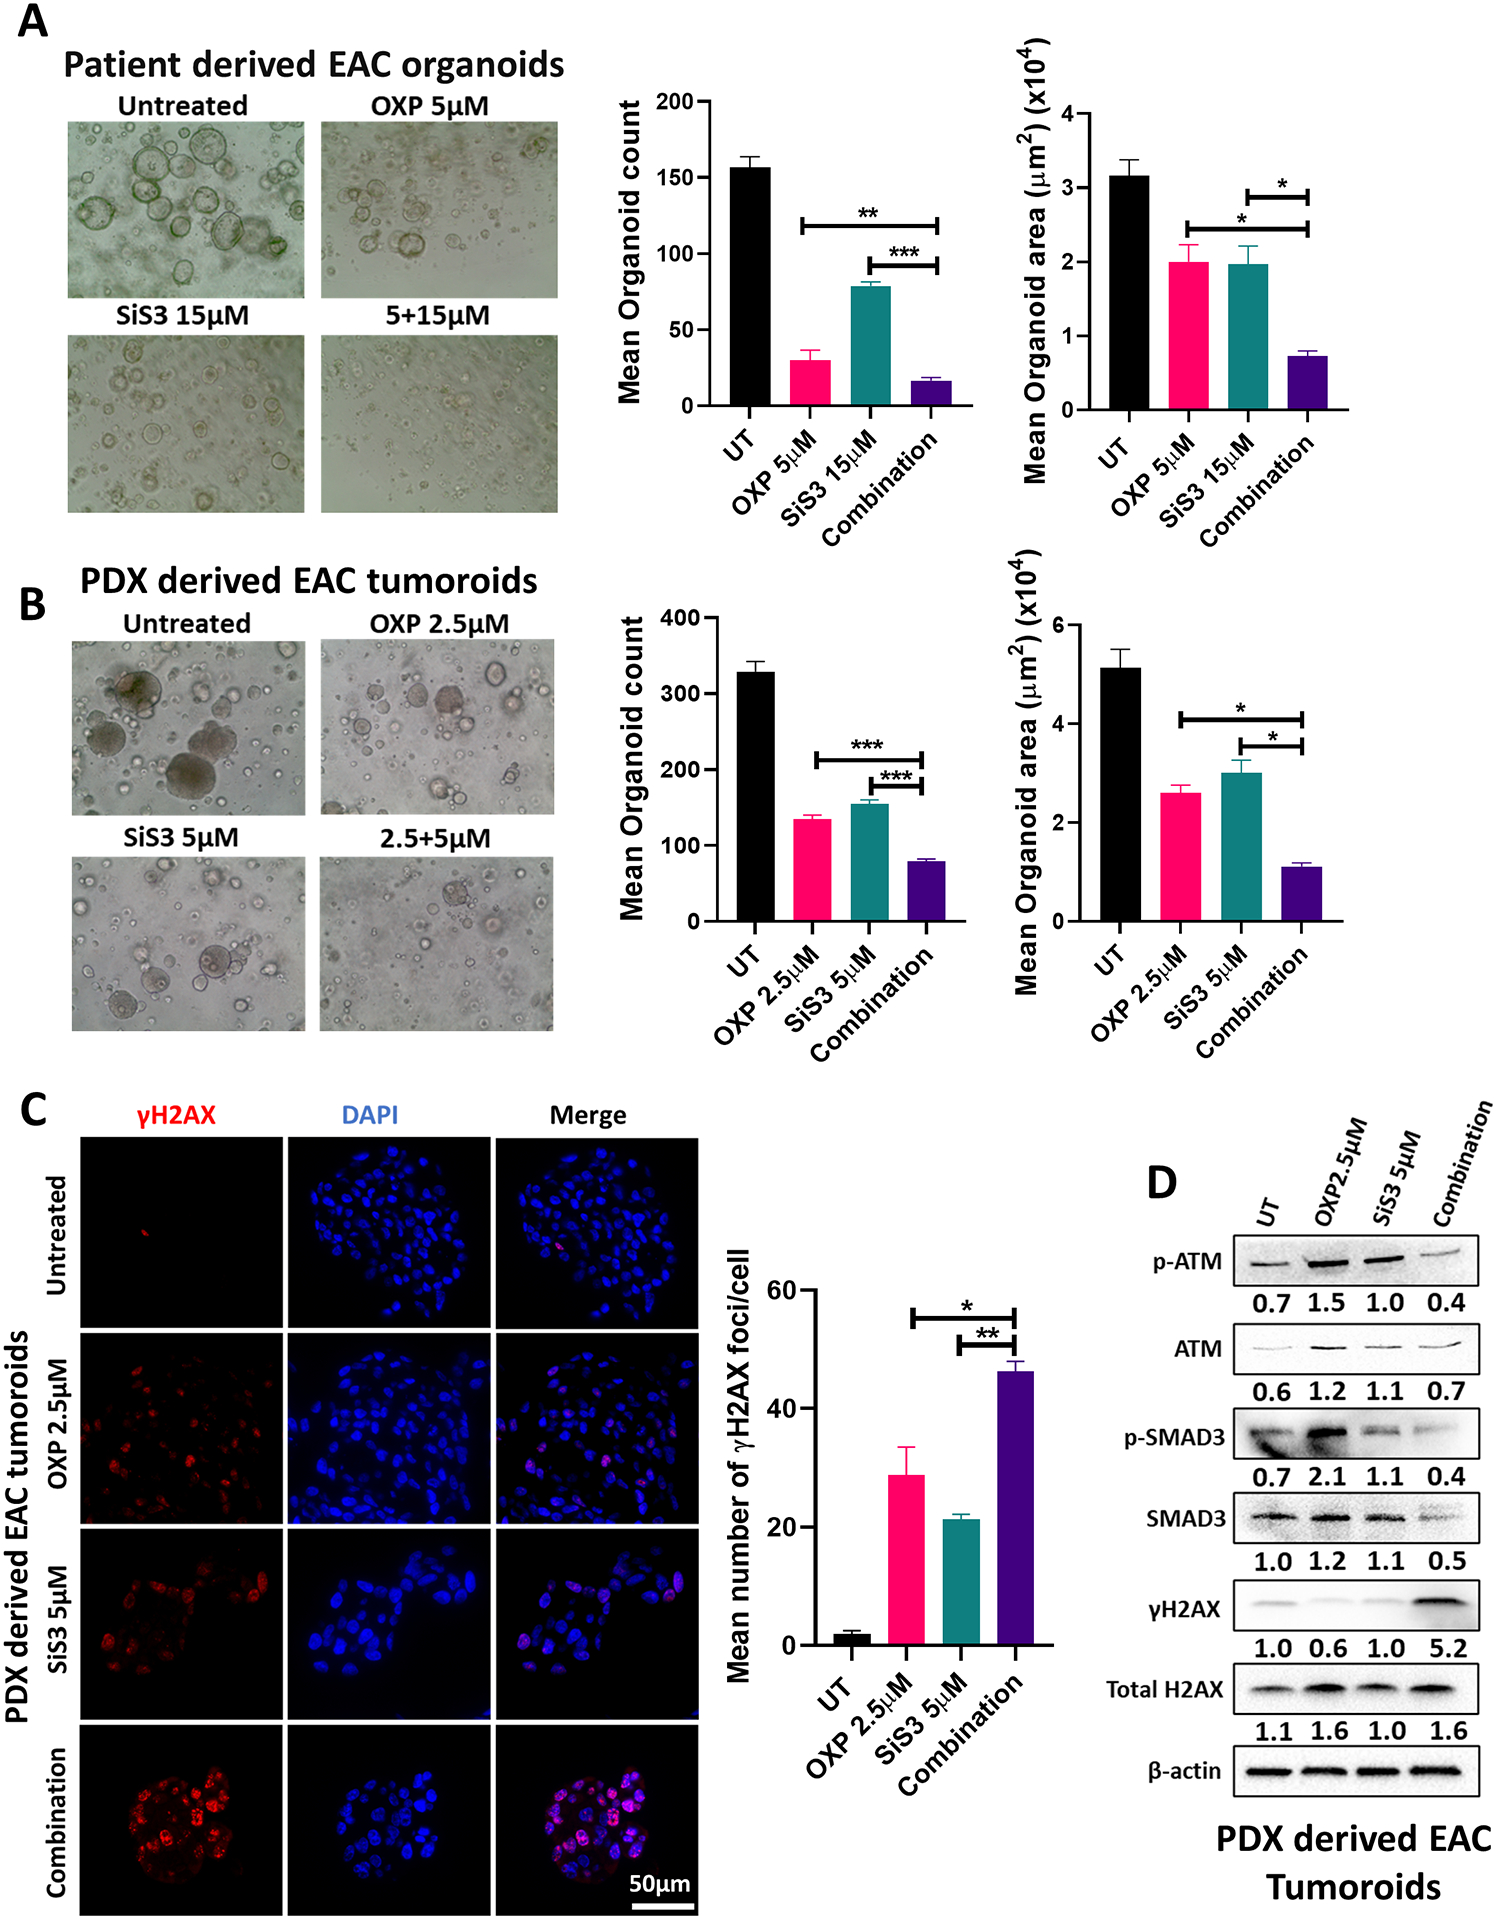
(A–B) Representative images, counts and sizes of EAC patient-derived organoids (A)/tumoroids (B) treated with oxaliplatin, SiS3 or their combination (data are presented as mean ± SD; *P<0.05; **P<0.01; ***P<0.001). (C) Immunofluorescence staining and quantification of phosphorylated H2AX (γH2AX) (red) in EAC patient-derived tumoroids treated with oxaliplatin, SiS3 or their combination (data are presented as mean ± SD; *P<0.05; **P<0.01; ***P<0.001). DAPI was used for nuclear staining. (D) Western blot analysis of total and phosphorylated SMAD3, total and phosphorylated ATM, and total and phosphorylated H2AX protein expression in EAC patient-derived tumoroids treated with oxaliplatin, SiS3 or their combination. β-actin was used for normalization and a representative β-actin was shown. Quantitative analysis of protein expression is included under the corresponding blot (n = 3 biologically independent samples).
To validate our findings in vivo and test the potential use of SMAD3 inhibitors in EAC treatment, we used a PDX mouse model from the human gastroesophageal junction. Tumors were allowed to grow until they reached a size of approximately 150 mm3. Mice were then randomly assigned to four treatment groups: oxaliplatin (2 mg/kg; intraperitoneally), SiS3 (2.5 mg/kg; intraperitoneally), a combination of both drugs, or vehicle only. Mice treated with the oxaliplatin-SiS3 combination showed a significant reduction in tumor volume (Figure 6A) and demonstrated prolonged survival (Figure 6B). Notably, none of the treatments at the indicated doses led to detectable adverse effects on mice or on their body weights throughout the study duration, suggesting limited toxicity (Figure 6C). In scrutinizing the tumor volume reduction more closely, associated molecular markers were analyzed. A marked reduction in the proliferation marker Ki67 and an increase in the apoptosis marker cleaved caspase 3 were observed in mice treated with the oxaliplatin-SiS3 combination (Figure 6D & E). Further molecular signs of tumor regression were evidenced by upregulated γH2AX expression (Figure 6F & G), augmented PARP cleavage, diminished expression of the antiapoptotic proteins BCL-2 and BCL-XL, and a notable decrease in the DNA repair proteins ATM and BRCA1 (Figure 6H).
Fig. 6. SMAD3 inhibition enhances the response to oxaliplatin in a PDX model.
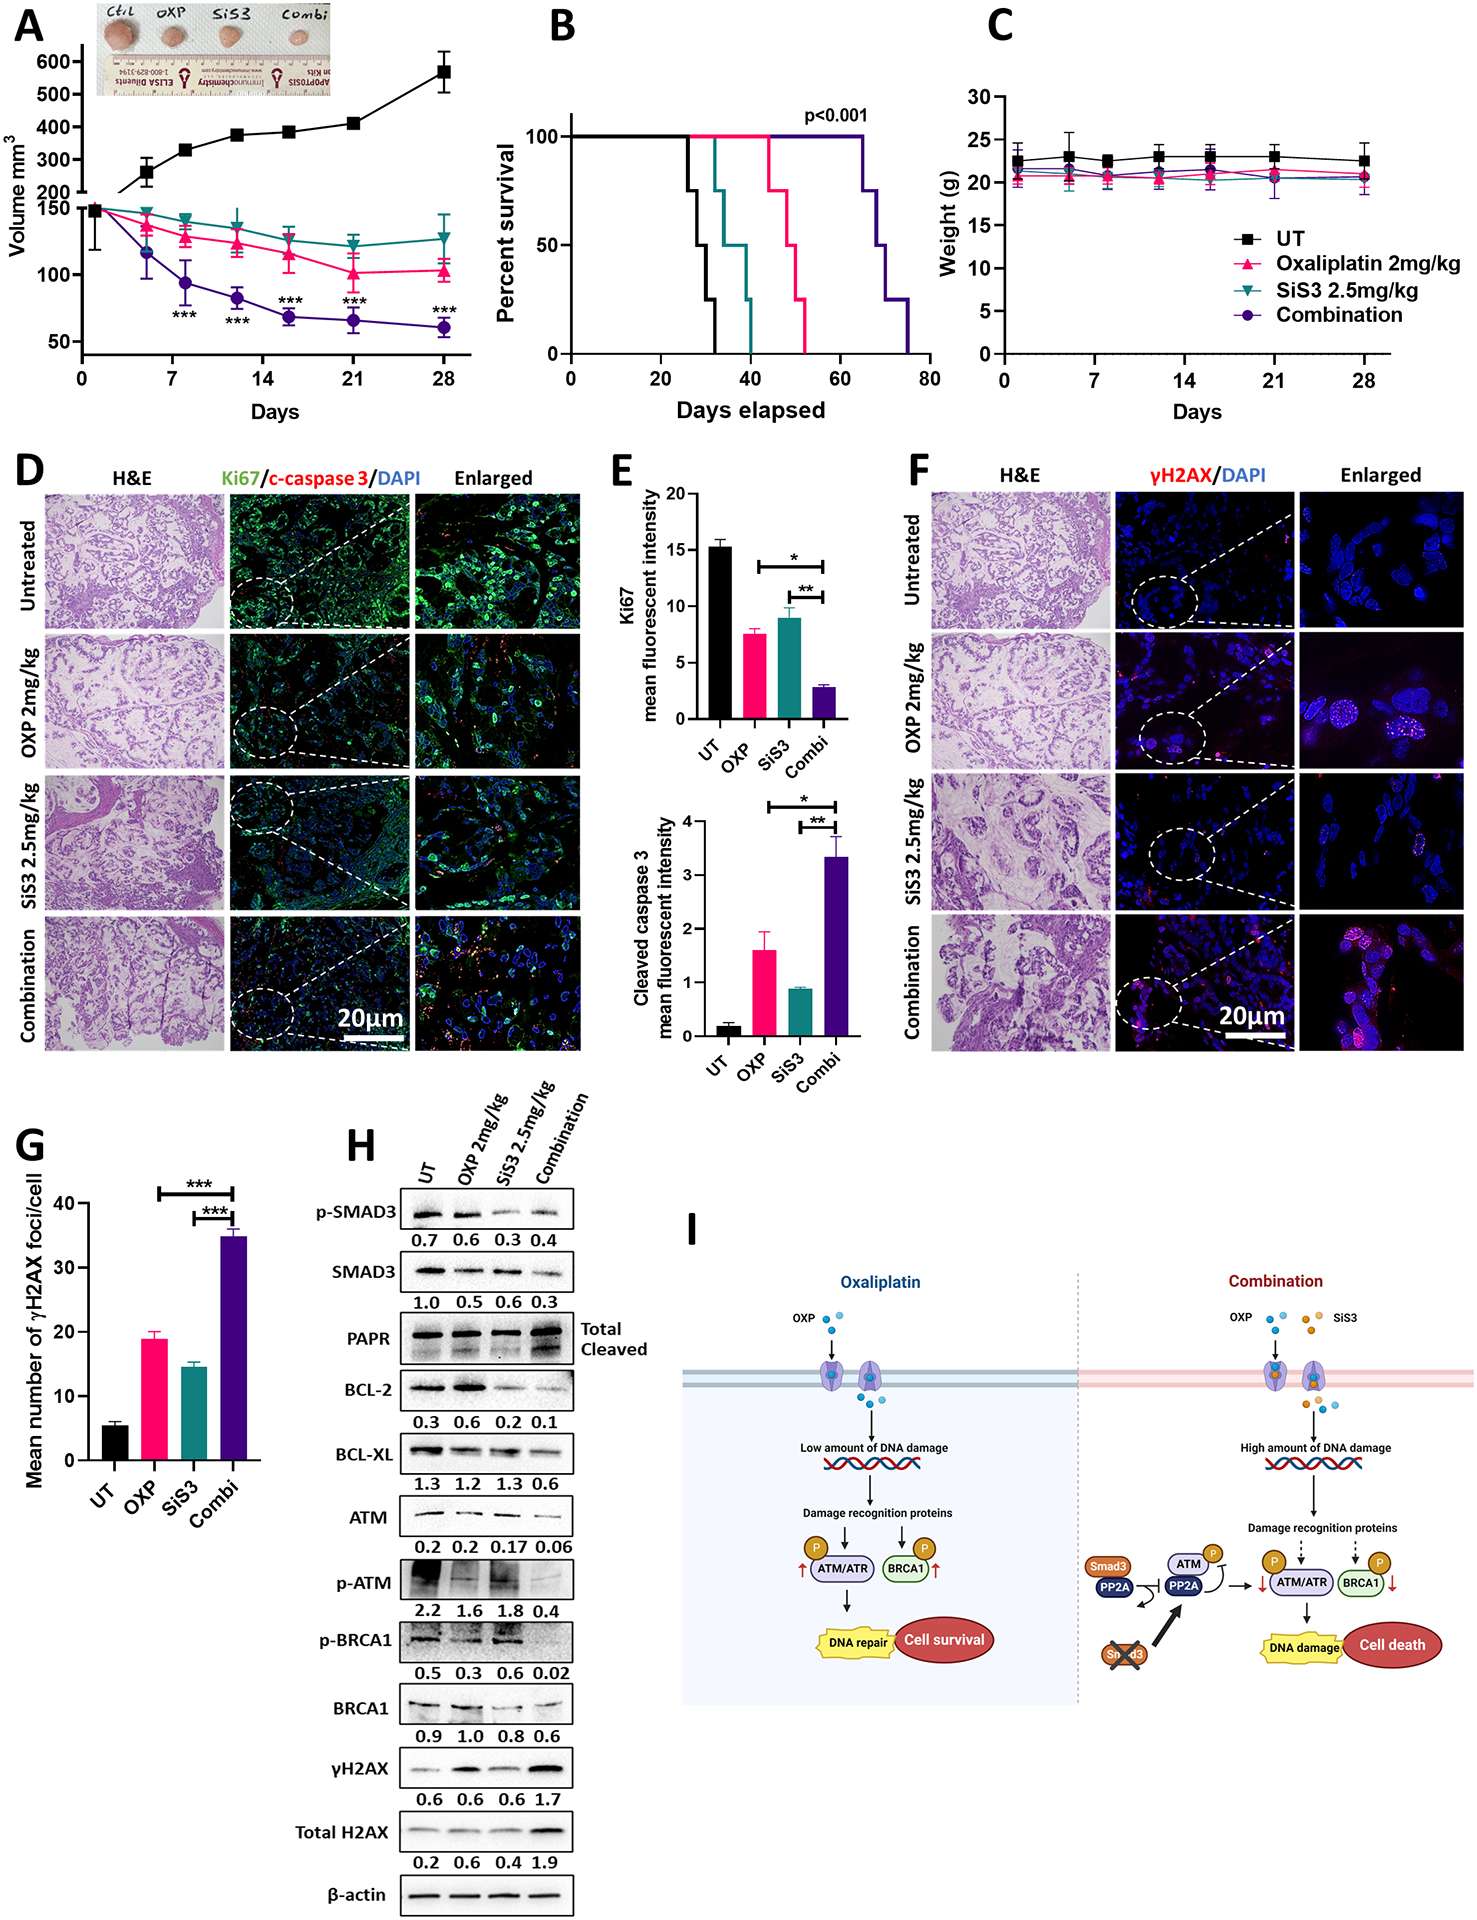
(A) Average tumor volume of PDX with or without oxaliplatin 2 mg/kg, SiS3 2.5 mg/kg or combination treatment for 28 days (n = 6 mice/group; data are presented as mean ± SD; *P<0.05; **P<0.01; ***P<0.001). Representative image of tumors is shown above the graph. (B) Kaplan–Meier survival curve for PDXs following the treatment endpoint. (C) Average weight of untreated and treated (oxaliplatin, SiS3 or combination) PDXs over 28 days of treatment (n = 6 mice/group; data are presented as mean ± SD; *P<0.05; **P<0.01; ***P<0.001). (D) Representative dual immunofluorescence staining images of the cell proliferation marker (Ki67, green) and apoptosis marker (cleaved caspase 3, red) in the PDX tumor tissues. DAPI was used for nuclear staining. (E) Quantification of the data from (D) (data are presented as mean ± SD; *P<0.05; **P<0.01; ***P<0.001). (F) Representative immunofluorescence staining images of phosphorylated H2AX (γH2AX) staining (red) in the PDX tumor tissues. DAPI was used for nuclear staining. Images in (D) and (F) represent sequential slides from the same paraffin embedded tissue block and have the same reference H&E slide. (G) Quantification of the data from (F) (data are presented as mean ± SD; *P<0.05; **P<0.01; ***P<0.001). (H) Western blot analysis of total and phosphorylated SMAD3, total and phosphorylated ATM, total and phosphorylated BRCA1, total and phosphorylated H2AX, PARP, BCL-2, and BCL-XL protein expression in PDX tumor tissues untreated or treated with oxaliplatin, SiS3 or their combination. β-actin was used for normalization and a representative β-actin is shown. Quantitative analysis of protein expression is included under the corresponding blot. (I) Schematic illustration showing the proposed mechanism of SMAD3 mediated oxaliplatin resistance in EAC. Exposure to oxaliplatin induces a low amount of DNA damage in EAC cells that can be overcome by upregulating DNA repair mechanisms, leading to oxaliplatin resistance and cell survival. Inhibition of SMAD3 in combination with oxaliplatin augments DNA damage in EAC cells and decreases DNA repair by inhibiting major repair proteins, including ATM and ATR. Mechanistically, SMAD3 directly interacts with PP2A, reducing its ability to bind to and inhibit ATM phosphorylation. Inhibiting SMAD3 reverses this effect (Created with BioRender.com).
Our findings demonstrate the contribution of SMAD3 to drug resistance in EAC (Figure 6I) and provocatively suggest targeting SMAD3 in combination with conventional therapies to enhance the chemotherapeutic response in EAC.
DISCUSSION
EAC is an aggressive malignancy with a five-year survival rate of 20%. The majority of EAC patients in the United States are diagnosed at advanced disease stages (III or IV) with resistance to the current chemotherapeutic strategies and poor clinical outcome, manifested with a five-year survival around 5% (3). Using a number of in vitro and in vivo models, we demonstrate overexpression of SMAD3 in EACs and provide multiple lines of evidence supporting its role in chemotherapeutic resistance through impairing the DNA damage response.
Transforming growth factor β (TGF-β) signaling is known to have a dual functional role in which it acts as a tumor suppressor at early stages and a tumor promoter at later stages of carcinogenesis. One study reported that early stages of esophageal carcinogenesis show decreased TGF-β responsiveness by downregulating SMAD4 (25). Consistent with this, Onwuegbusi et al. (26) and Gotovac et al. (27) showed that loss of SMAD4 promotes tumorigenesis from dysplastic Barrett’s esophagus toward EAC with recovery of the antiproliferative response upon SMAD4 restoration. Contrary to these findings, a recent study showed that TGF-β has tumor-promoting effects in EAC as early as the dysplastic stages of the disease, which appears to be SMAD4-independent but SMAD2/SMAD3 dependent (15). In fact, increased TGF-β signaling in EAC was associated with advanced tumor stage, invasion, metastasis, and treatment resistance (13, 14). In this study, we showed the upregulation of SMAD3 in EAC, which was associated with poor patient survival and inadequate response to chemotherapy, supporting a pro-tumorigenic role of TGFβ-SMAD signaling in EAC progression.
A number of recent studies have shown that activation of TGF-β signaling is associated with drug resistance in several malignancies, including non-small cell lung cancer (NSCLC) (28), breast cancer (29, 30), hepatocellular carcinoma (HCC) (31), colorectal cancer (CRC) (32), and prostate cancer (33). As a result, extensive research has been ongoing to target TGF-β signaling as a means to overcome therapeutic resistance (34). Several accumulating lines of evidence suggest that activation of TGF-β signaling is associated with acquired resistance against various chemotherapeutic drugs, including DNA damaging agents such as cisplatin, temozolomide, oxaliplatin, and doxorubicin (34). The molecular mechanisms underlying drug resistance are not yet fully elucidated; however, some studies have shown that miRNAs can regulate TGF-β signaling and mediate resistance. For example, Cai et al. reported that miR-128–3p activates the TGF-β pathway by inhibiting SMAD-specific E3 ubiquitin protein ligase 2 (SMURF2) and protein phosphatase 1c (PP1c), eventually leading to epithelial-mesenchymal transition (EMT) and the development of cisplatin resistance in NSCLC (35). In another study, Vu et al. showed that miR-216b overexpression increased resistance to platinum-based therapy by downregulating SMAD3 (36). Recent studies also demonstrated that TGF-β upregulated EMT in chemotherapy-resistant cells (37). Lambies et al. showed that in breast and pancreatic cancer cell lines, TGF-β signaling during EMT contributes to cisplatin resistance by upregulating the expression of USP27X, which increases Snail1 protein stability (38). In this study, we showed that SMAD3 mediates oxaliplatin resistance in EAC by activating ATM-mediated DNA repair through binding to and inhibiting PP2A activity. Because TGF-β signaling plays a crucial role in acquired resistance against DNA damaging agents, understanding the mechanisms underlying these processes is an essential step for guiding novel therapeutic strategies.
Despite recent advances in cancer therapy, the development of drug resistance has been proven inevitable. SMAD3 was shown to be critical for the chemo- and radio-resistant phenotype associated with TGF-β. Moon et al. (3) identified SMAD3/4 as a drug sensitivity regulator in TGFβ-mediated chemotherapy-resistant colorectal cancer cells by regulating p-STAT3 signaling. Huang et al. showed that overexpression of SMAD3 in preoperative tumor samples was associated with a higher risk for poor response to fluoropyrimidine-based chemoradiotherapy in locally advanced rectal cancer patients (16). Therefore, combining TGF-β or SMAD3 inhibitors with other cancer therapies is an attractive venue to be explored for the treatment of therapy-resistant cancer. Combining sorafenib with a TGF-β inhibitor enhanced its efficacy by increasing hepatocellular carcinoma cell death (39). Bhola et al. (40) showed that triple-negative breast cancer cells that survived paclitaxel treatment had activated TGF-β signaling and that combining TGF-β pathway inhibitors with paclitaxel potently prevented tumor recurrence. Activation of the TGF-β pathway was also shown in 5-fluorouracil-resistant colorectal carcinoma cells, where the specific inhibition of TGF-βRI restored the sensitivity of chemoresistant cells to 5-fluorouracil (41). In another study, Chihara et al. (29) showed that the TGFβ-SMAD3 pathway played an important role in the induction and maintenance of resistance to anti-HER2 drugs in HER2-positive breast cancer and that treatment with the small-molecule inhibitor of SMAD3 (SiS3) restored trastuzumab sensitivity in trastuzumab-resistant cells. In line with these findings, our data indicated that SMAD3 is upregulated in oxaliplatin-resistant esophageal adenocarcinoma cells. Inhibition of SMAD3 using its specific inhibitor, SiS3, was highly efficacious in targeting these cells and sensitizing them to oxaliplatin treatment. Mechanistically, inhibition of SMAD3 reduced DNA repair in oxaliplatin-treated cells by downregulating ATM activation, consequently resulting in augmented DNA damage and apoptotic cell death. Our findings demonstrate a benefit of SiS3-oxaliplatin combination treatment in EAC and call for testing this combination therapeutic regimen in clinical trials.
Overall, our investigations underscore the significant role of SMAD3 signaling in EAC resistance to oxaliplatin treatment. Further studies will be required to fully decipher the mechanisms underlying SMAD3-mediated growth-promoting effects and chemotherapy resistance in EAC. Nonetheless, these preclinical findings may have translational significance and suggest SMAD3 inhibitors as promising compounds, especially in combination with chemotherapies, in treating EAC.
Supplementary Material
Acknowledgments
The research reported in this publication was partially supported by grants from the U.S. National Institutes of Health (NIH) (El-Rifai, W: P01CA268991 and R01CA224366).
The use of flow cytometry (SCR_022501) and biostatistics (SCR_022890) shared resources was supported by the NCI-funded Sylvester Comprehensive Cancer Center (P30CA240139). Graphical illustration was created with BioRender.com. This work’s content is solely the responsibility of the authors. It does not necessarily represent the official views of the National Institutes of Health, or the University of Miami.
Abbreviations List:
- PP2A
Protein phosphatase 2
- BE
Barrett’s esophagus
- SMAD3
SMAD family member 3
- TGF-β
Transforming growth factor-β
- RUNX3
Runt domain transcription factor 3
- TCGA
The Cancer Genome Atlas
- GEO
Gene Expression Omnibus
- GSEA
Gene set enrichment analysis
- NE
Normal esophagus
- PP5
protein phosphatase 5
- WIP1
wild type p53- induced phosphatase 1
- PDOs
patient-derived organoids
- DAPI
4′, 6-diamidino-2-phenylindole
- EAC
Esophageal adenocarcinomas
- qRT‒PCR
Quantitative real-time polymerase chain reaction
- FBS
Fetal bovine serum
- WB
Western blot
- IF
Immunofluorescence
- PDXs
patient-derived xenografts
Footnotes
The authors declare no potential conflicts of interest.
References
- 1.Siegel RL, Miller KD, Wagle NS, Jemal A, Cancer statistics, 2023. CA: A Cancer Journal for Clinicians 73, 17–48 (2023). [DOI] [PubMed] [Google Scholar]
- 2.Yang J et al. , Understanding Esophageal Cancer: The Challenges and Opportunities for the Next Decade. Front Oncol 10, 1727 (2020). [DOI] [PMC free article] [PubMed] [Google Scholar]
- 3.SEER Cancer Stat Facts: Esophageal Cancer.
- 4.Moon SU et al. , Effect of Smad3/4 on chemotherapeutic drug sensitivity in colorectal cancer cells. Oncol Rep 33, 185–192 (2015). [DOI] [PubMed] [Google Scholar]
- 5.Jung B, Staudacher JJ, Beauchamp D, Transforming Growth Factor β Superfamily Signaling in Development of Colorectal Cancer. Gastroenterology 152, 36–52 (2017). [DOI] [PMC free article] [PubMed] [Google Scholar]
- 6.Tauriello DVF, Batlle E, Targeting the Microenvironment in Advanced Colorectal Cancer. Trends Cancer 2, 495–504 (2016). [DOI] [PubMed] [Google Scholar]
- 7.Koveitypour Z et al. , Signaling pathways involved in colorectal cancer progression. Cell & Bioscience 9, 97 (2019). [DOI] [PMC free article] [PubMed] [Google Scholar]
- 8.Shi Y, Massagué J, Mechanisms of TGF-beta signaling from cell membrane to the nucleus. Cell 113, 685–700 (2003). [DOI] [PubMed] [Google Scholar]
- 9.Lin EW, Karakasheva TA, Hicks PD, Bass AJ, Rustgi AK, The tumor microenvironment in esophageal cancer. Oncogene 35, 5337–5349 (2016). [DOI] [PMC free article] [PubMed] [Google Scholar]
- 10.Benson JR, Role of transforming growth factor beta in breast carcinogenesis. Lancet Oncol 5, 229–239 (2004). [DOI] [PubMed] [Google Scholar]
- 11.Elliott RL, Blobe GC, Role of transforming growth factor Beta in human cancer. J Clin Oncol 23, 2078–2093 (2005). [DOI] [PubMed] [Google Scholar]
- 12.Natsugoe S et al. , Smad4 and transforming growth factor beta1 expression in patients with squamous cell carcinoma of the esophagus. Clin Cancer Res 8, 1838–1842 (2002). [PubMed] [Google Scholar]
- 13.von Rahden BH et al. , Overexpression of TGF-beta1 in esophageal (Barrett’s) adenocarcinoma is associated with advanced stage of disease and poor prognosis. Mol Carcinog 45, 786–794 (2006). [DOI] [PubMed] [Google Scholar]
- 14.Kim AH et al. , Transforming growth factor-beta is an endogenous radioresistance factor in the esophageal adenocarcinoma cell line OE-33. Int J Oncol 23, 1593–1599 (2003). [PubMed] [Google Scholar]
- 15.Blum AE et al. , Systems Biology Analyses Show Hyperactivation of Transforming Growth Factor-β and JNK Signaling Pathways in Esophageal Cancer. Gastroenterology 156, 1761–1774 (2019). [DOI] [PMC free article] [PubMed] [Google Scholar]
- 16.Stracker T, Roig I, Knobel P, Marjanović M, The ATM signaling network in development and disease. Frontiers in genetics 4, 37 (2013). [DOI] [PMC free article] [PubMed] [Google Scholar]
- 17.Chatterjee N, Walker GC, Mechanisms of DNA damage, repair, and mutagenesis. Environ Mol Mutagen 58, 235–263 (2017). [DOI] [PMC free article] [PubMed] [Google Scholar]
- 18.Moon J et al. , DNA Damage and Its Role in Cancer Therapeutics. International Journal of Molecular Sciences 24, 4741 (2023). [DOI] [PMC free article] [PubMed] [Google Scholar]
- 19.Labbé E, Silvestri C, Hoodless PA, Wrana JL, Attisano L, Smad2 and Smad3 positively and negatively regulate TGF beta-dependent transcription through the forkhead DNA-binding protein FAST2. Mol Cell 2, 109–120 (1998). [DOI] [PubMed] [Google Scholar]
- 20.Ballout F et al. , APE1 redox function is required for activation of Yes-associated protein 1 under reflux conditions in Barrett’s-associated esophageal adenocarcinomas. Journal of Experimental & Clinical Cancer Research 41, 264 (2022). [DOI] [PMC free article] [PubMed] [Google Scholar]
- 21.Corso S et al. , A Comprehensive PDX Gastric Cancer Collection Captures Cancer Cell-Intrinsic Transcriptional MSI Traits. Cancer Res 79, 5884–5896 (2019). [DOI] [PubMed] [Google Scholar]
- 22.Cheaito K et al. , Establishment and characterization of prostate organoids from treatment-naïve patients with prostate cancer. Oncol Lett 23, 6 (2022). [DOI] [PMC free article] [PubMed] [Google Scholar]
- 23.Mahe MM et al. , Establishment of Gastrointestinal Epithelial Organoids. Curr Protoc Mouse Biol 3, 217–240 (2013). [DOI] [PMC free article] [PubMed] [Google Scholar]
- 24.Stracker TH, Roig I, Knobel PA, Marjanović M, The ATM signaling network in development and disease. Front Genet 4, 37 (2013). [DOI] [PMC free article] [PubMed] [Google Scholar]
- 25.Lebman DA, Edmiston JS, Chung TD, Snyder SR, Heterogeneity in the transforming growth factor beta response of esophageal cancer cells. Int J Oncol 20, 1241–1246 (2002). [PubMed] [Google Scholar]
- 26.Onwuegbusi BA et al. , Impaired transforming growth factor beta signalling in Barrett’s carcinogenesis due to frequent SMAD4 inactivation. Gut 55, 764–774 (2006). [DOI] [PMC free article] [PubMed] [Google Scholar]
- 27.Gotovac JR et al. , Loss of SMAD4 Is Sufficient to Promote Tumorigenesis in a Model of Dysplastic Barrett’s Esophagus. Cell Mol Gastroenterol Hepatol 12, 689–713 (2021). [DOI] [PMC free article] [PubMed] [Google Scholar]
- 28.Soucheray M et al. , Intratumoral Heterogeneity in EGFR-Mutant NSCLC Results in Divergent Resistance Mechanisms in Response to EGFR Tyrosine Kinase Inhibition. Cancer Research 75, 4372–4383 (2015). [DOI] [PMC free article] [PubMed] [Google Scholar]
- 29.Chihara Y et al. , A small-molecule inhibitor of SMAD3 attenuates resistance to anti-HER2 drugs in HER2-positive breast cancer cells. Breast Cancer Res Treat 166, 55–68 (2017). [DOI] [PubMed] [Google Scholar]
- 30.Palomeras S et al. , Epigenetic silencing of TGFBI confers resistance to trastuzumab in human breast cancer. Breast Cancer Research 21, 79 (2019). [DOI] [PMC free article] [PubMed] [Google Scholar]
- 31.Bhagyaraj E et al. , TGF-β induced chemoresistance in liver cancer is modulated by xenobiotic nuclear receptor PXR. Cell Cycle 18, 3589–3602 (2019). [DOI] [PMC free article] [PubMed] [Google Scholar]
- 32.Quan Q, Zhong F, Wang X, Chen K, Guo L, PAR2 Inhibition Enhanced the Sensitivity of Colorectal Cancer Cells to 5-FU and Reduced EMT Signaling. Oncol Res 27, 779–788 (2019). [DOI] [PMC free article] [PubMed] [Google Scholar]
- 33.Song B et al. , Targeting FOXA1-mediated repression of TGF-β signaling suppresses castration-resistant prostate cancer progression. J Clin Invest 129, 569–582 (2019). [DOI] [PMC free article] [PubMed] [Google Scholar]
- 34.Zhang M et al. , TGF-β Signaling and Resistance to Cancer Therapy. Front Cell Dev Biol 9, 786728 (2021). [DOI] [PMC free article] [PubMed] [Google Scholar]
- 35.Cai J et al. , Simultaneous overactivation of Wnt/β-catenin and TGFβ signalling by miR-128–3p confers chemoresistance-associated metastasis in NSCLC. Nature Communications 8, 15870 (2017). [DOI] [PMC free article] [PubMed] [Google Scholar]
- 36.Vu T, Yang S, Datta PK, MiR-216b/Smad3/BCL-2 Axis Is Involved in Smoking-Mediated Drug Resistance in Non-Small Cell Lung Cancer. Cancers 12, 1879 (2020). [DOI] [PMC free article] [PubMed] [Google Scholar]
- 37.Chen J et al. , Targeting transforming growth factor-β signaling for enhanced cancer chemotherapy. Theranostics 11, 1345–1363 (2021). [DOI] [PMC free article] [PubMed] [Google Scholar]
- 38.Lambies G et al. , TGFβ-Activated USP27X Deubiquitinase Regulates Cell Migration and Chemoresistance via Stabilization of Snail1. Cancer Research 79, 33–46 (2019). [DOI] [PMC free article] [PubMed] [Google Scholar]
- 39.Serova M et al. , Effects of TGF-beta signalling inhibition with galunisertib (LY2157299) in hepatocellular carcinoma models and in ex vivo whole tumor tissue samples from patients. Oncotarget 6, (2015). [DOI] [PMC free article] [PubMed] [Google Scholar]
- 40.Bhola NE et al. , TGF-β inhibition enhances chemotherapy action against triple-negative breast cancer. J Clin Invest 123, 1348–1358 (2013). [DOI] [PMC free article] [PubMed] [Google Scholar]
- 41.Romano G et al. , The TGF-β pathway is activated by 5-fluorouracil treatment in drug resistant colorectal carcinoma cells. Oncotarget 7, 22077–22091 (2016). [DOI] [PMC free article] [PubMed] [Google Scholar]
Associated Data
This section collects any data citations, data availability statements, or supplementary materials included in this article.
Supplementary Materials
Data Availability Statement
All data are available in the main text or the supplementary materials. The datasets analyzed in this study are TCGA, GSE13898, and GSE165252.