

Abstract
Objective
To assess the impact and potential mechanistic pathways of prenatal alcohol exposure (PAE) on longitudinal growth and nutritional status in early childhood.
Study design
A cohort of 296 mother-infant dyads (32% with PAE vs. 68% unexposed) were recruited in Leyte, the Philippines, and followed from early gestation through 24 months of age. PAE was assessed using serum phosphatidylethanol (PEth) captured twice prenatally and in cord blood and supplemented with self-reported alcohol consumption. Linear mixed models were used to examine longitudinal effects of PAE on growth from birth through 2 years including key potential mediating factors (placental histopathology, and infant serum leptin and IGF-1).
Results
After adjusting for potential confounders, we found that PAE was significantly associated with a delayed blunting of linear growth trajectories (height-for-age z-score, body length) and weight (weight-for-age z-score, body weight) that manifested between 4 and 6 months and continued through 12 to 24 months. PAE was also associated with a decreased rate of mid-upper-arm circumference growth from birth to 12 months, and a lower mean IGF-1 levels at birth and 6 months.
Conclusion
This study demonstrates a delayed impact of PAE on growth that manifested around 6 months of age, underscoring the importance of routine clinical monitoring in early childhood. Furthermore, the findings supported prior animal model findings that suggest a mechanistic role for IGF-1 in PAE-induced growth delay.
Keywords: Prenatal Alcohol, Growth, IGF-1 in Early Childhood
Fetal alcohol spectrum disorder (FASD) comprises a wide range of preventable adverse effects on child development. Most current FASD research focuses specifically on birth outcomes and perinatal anthropometry (1–4), small for gestational age (SGA), low birth weight (LBW), and prematurity (3,5,6), timepoints at which only the most severely affected children may demonstrate apparent growth or developmental delay. However, research has found growth trajectory may serve as an important prognostic factor for the severity of neurodevelopmental deficits in FASD (7,8). Many clinicians now propose a combined approach that incorporates facial dysmorphology, neurocognitive indicators, and growth patterns to facilitate a more accurate and timely diagnosis by 18–24 months as a delayed diagnosis may miss the critical window for early intervention (9).
Furthermore, the biological mechanisms for the effects of prenatal alcohol on growth and development are not well characterized, though research suggests dysregulation of the Insulin-like Growth Factor-1 (IGF-1) signaling pathway given its key role in both pre-and postnatal growth and neurodevelopment (10–15). IGF-1 is critical for neurodevelopment (11,15–23), stimulates growth independent of pituitary growth hormone, and is the predominant driver of linear growth in early childhood (21). Several animal and in vitro models have implicated IGF signaling disruptions in alcohol-related growth delay (24–28), but this pathway is understudied in humans.
Notable research gaps exist to understand PAE and postnatal growth delay, particularly in low-and-middle-income (LMIC) countries, each with unique competing risks for adverse child development. Our prior studies in this Filipino cohort revealed widespread prenatal consumption of “tuba”, a local coconut wine containing 7–8% ethanol by mass spectroscopy (29). Using an objective biomarker of prenatal ethanol exposure and routine monitoring of a cohort of rural Filipino children from birth through 2 years, we sought to better categorize growth trajectories and examine potential mediating roles of fetal/infant IGF-1 and leptin on impaired growth in the context of PAE.
METHODS
This prospective cohort includes 296 mother-infant pairs who returned for follow-up after delivery, with 76% retention (225/296) through 24-months in April 2021. Pregnant women aged 18 or older and with a singleton pregnancy at <20 weeks’ gestation were recruited by community health workers in Leyte, The Philippines. Women with significant maternal illness at enrollment determined by history/ physical exam by a study obstetrician or ultrasound evidence of major congenital anomaly were excluded. Iron supplementation was provided to all women. All participants with helminth infection were offered, but all declined, anthelmintic treatment.
Biomarker Sample Collection and Processing
Maternal serum was collected at enrollment and 32 weeks’ gestation and stored at −80°C. At delivery, placentas were weighed after cleaning and trimming umbilical cords to 10 cm. Umbilical artery blood was sampled for newborn IGF-1 and leptin levels using ELISA (30), and 6- and 12-month serum was analyzed via a multiplexed sandwich antibody-based assay(31).
Phosphatidylethanol (PEth), a direct biomarker of alcohol metabolism with a detection window of 3 to 4 weeks (32) was collected on dried blood spot (DBS) cards at 3 time points in gestation, stored at 4°C, and sent to United States Drug and Testing Laboratories for quantifying (lower detection limit = 8 ng/dL) (33–36). Weekly alcohol intake was assessed via self-report at each pre- and postnatal visit (0, 1–2, 3–5, 6–8, 9–10 or 11+ drinks) and 3+ drinks/week was significantly associated with detectable PEth levels at corresponding visits (X2, p=0.001)
We used a tiered approach to capture Prenatal Alcohol Exposure (PAE) that included serum PEth levels and self-reported drinking frequency when PEth was missing (16% at enrollment, 11% at later gestation). PEth values of ≥ 20.0 ng/mL indicated “high” exposure based on current recommendations (37). PAE included any of the following criteria: (1) any “high” PEth ≥ 20.0 ng/mL during gestation; (2) a detectable PEth (≥ 8.0 ng/mL) at BOTH enrollment and later gestation (32wks or delivery); (3) a detectable PEth (≥ 8.0 ng/mL) at either enrollment and/or late gestation AND self-reported 3+ drinks/wk at BOTH enrollment and 32-week visit; and, (4) if missing all PEth data, self-reported of 3+ drinks/wk at BOTH enrollment and 32-week visits.
We measured infant anthropometry at birth, 1, 6, 12, 18, and 24 months of age using a length board and supine scale for body length (cm) and weight (kg), respectively. We used ultrasound to estimate gestational age (GA) and prematurity was defined as birth at <37 weeks of gestation. Low birth weight (LBW) was defined as ≤ 2.50 kg, and small-for-gestational-age (SGA) was defined as size <10th percentile using sex and gestational age adjusted birth percentiles using INTERGROWTH-21st healthy reference standards (38). We measured mid-upper arm circumference (MUAC) using a non-stretch, “Zerfuss” insertion tape to 0.1 cm. For repeat growth metrics, age- and sex-standardized z-scores for length (HAZ) and weight (WAZ) were derived from 2006 WHO Anthro Growth Standards (39).
Mediating and Confounding Covariates
Potential confounders of growth were considered a priori (40–42). At enrollment and 32 weeks of gestation, maternal age, nutritional status/anthropometry (height, weight, MUAC, BMI, thigh circumference and skin fold thickness), smoking status, and obstetric history/parity were recorded. Anemia was defined as hemoglobin ≤11.0 g/dL using a Horiba ABX hematology analyzer (Horiba Ltd.) (43). Maternal infection (yes/no) included evidence of parasitic infection by the Kato-Katz method (44) with S. japonicum, A. lumbricoides, T. trichiura, or hookworm. Maternal vascular malperfusion (MVM) (45) defined by Redline et. al.(46), and parity, were included as potential mediators of the ethanol-fetal IGF-1 relationship. Breastmilk protein concentration (mg/mL) and infant feeding practices were captured at 6 and 12 months postnatally. Socioeconomic status (SES) was determined using a previously validated tool from this study population (29,47–49). We used principal components analysis to assign numeric weights to SES indicators from 4 domains described elsewhere (50); a weighted combination of indicators was dichotomized (≥ median). Highest maternal education was dichotomized as high school or below.
Statistical Analysis
We summarized continuous characteristics using mean/standard deviation or median/IQR where appropriate, categorical variables using relative frequencies n (%), and compared distributions between exposure groups using two sample t-tests (Wilcoxon rank sum) or chi-square tests. We fit linear mixed models to evaluate the longitudinal impact of PAE on infant anthropometry and IGF-1 levels over time using a random intercept to allow for subject-specific baseline values, random effects for age and time-varying covariates, and assumed an unstructured covariance to account for intrasubject heterogeneity. To improve model fit, we used a likelihood-based stepwise selection procedure (51) to include the best subset of covariates, time polynomials, and two-way interaction terms. For comparison, we modeled a 12- and 24-month trajectory separately for each outcome using identical covariates, except 12-month models also include IGF-1 and leptin as they were measured at birth, 6-and 12-months only. An additional multiple linear regression model assessed PAE on IGF-1 levels at birth, 6- and 12-months. Margins plots present mean outcomes by ETOH exposure averaging over model covariates at specified 2- or 4-month age intervals. Analyses were done using Stata v.17 (52) and with an α = .05 level of significance. Analysis used complete visit data with little-to-no missing survey or outcome data. Sensitivity analyses determined missingness was non-differential and not associated with exposure or outcome data, including key covariates used in this analysis.
This study was approved by IRBs at Rhode Island Hospital and the Research Institute of Tropical Medicine (Philippines). Midwife-administered surveys at each prenatal visit included education about teratogenic effects of alcohol and advised participants that drinking during pregnancy can irreversibly harm an unborn fetus. All participants provided informed consent.
RESULTS
Maternal characteristics (Table I) and birth outcomes (Table II) were similar between exposure groups (PAE, n=93; unexposed, n=203). Mothers in the PAE group had higher parity (p=0.02) and tended to be less well educated compared with controls (p=0.07), though we observed no notable differences in gestational length, prematurity rates, breastfeeding practices, breastmilk quality (protein) or birth outcomes between groups. Body length, weight, HAZ, WAZ, and infant MUAC were similar between groups from birth through 6-months, diverging between 6- and 12-months, during which time infants with ETOH-exposure experienced a more stunted growth trajectory and remained smaller than unexposed infants through 2 years. Head circumference was similar at all time points. Although leptin levels were similar, serum IGF-1 was greater in unexposed infants at birth (p=0.002) and 6-months (p=0.05).
Preliminary analyses demonstrated no relationship between prenatal or postnatal alcohol exposure and head circumference, breastfeeding practices, or breastmilk quality. Further, breastfeeding practices and breastmilk protein were not associated with infant length or weight at any follow-up visit, and therefore neither covariate was retained in final models. The adverse effect of PAE on longitudinal growth was non-differential regarding sex when examined separately, though males had slightly greater growth rates overall, and therefore sex was retained in all final models.
Effects of Prenatal Ethanol on Growth Trajectories and IGF-1 Levels
Model results and predicted growth plots were adjusted for all indicated model covariates.
Table III and Figure 1(A–D) present effects of PAE on linear growth. Children with ETOH-exposure had a steeper decline in HAZ through 12-months (PAE x age interaction term, ß= − 0.041, 95% CI: −0.072, −0.011) and demonstrated a more negative slope for absolute length (“blunted growth trajectory”) from birth through 12-months (ß = −0.100, 95% CI: −0.166, −0.034) and through 24-months (ß = −0.040, 95% CI: −0.071, −0.008). IGF-1 and maternal height were strongly associated with greater HAZ and body length over time, though infant leptin, maternal MUAC or SES did not influence linear growth.
Table 3:
Linear Mixed Models for Effects of Prenatal Alcohol Exposure on Height-for-Age Z-score (HAZ) and Body Length (cm)
| Outcome Model | HAZ to 12-mos | HAZ to 24-mos | Length to 12-mos | Length to 24-mos | ||||
|---|---|---|---|---|---|---|---|---|
| 95% CI | 95% CI | 95% CI | 95% CI | |||||
| PAE | 0.168 | −0.118 to 0.454 | −0.064 | −0.281 to 0.153 | 0.366 | −0.183 to 0.915 | −0.061 | −0.485 to 0.363 |
| Age (months) | 0.011 | −0.038 to 0.060 | −0.050 ** | −0.087 to −0.013 | 3.633 *** | 3.257 to 3.738 | 3.504 *** | 3.420 to 3.589 |
| Age2 (months) | −0.004 * | −0.007 to −0.001 | −0.004 * | −0.008 to −0.001 | −0.134 *** | −0.140 to −0.127 | −0.173 *** | −0.181 to −0.164 |
| PAE x Age b | −0.041 ** | −0.072 to −0.011 | −0.010 | −0.021 to 0.002 | −0.100 ** | −0.166 to −0.034 | −0.040 ** | −0.071 to −0.008 |
| Sex (male) | −0.206 * | −0.391 to −0.020 | −0.230 ** | −0.399 to −0.060 | 0.935 *** | 0.533 to 1.337 | 0.871 *** | 0.493 to 1.249 |
| IGF-1 (ng/mL) | 0.263 *** | 0.144 to 0.381 | 0.576 *** | 0.323 to 0.828 | ||||
| Leptin (pg/mL)a | −0.005 | −0.030 to 0.021 | 0.000 | −0.059 to 0.060 | ||||
| Maternal MUAC at enrollment (cm) | 0.005 | −0.027 to 0.036 | 0.014 | −0.014 to 0.043 | 0.007 | −0.061 to 0.075 | −0.037 to 0.090 | |
| Maternal Height (cm) | 0.032 ** | 0.014 to 0.050 | 0.036 *** | 0.019 to 0.052 | 0.057 ** | 0.018 to 0.097 | 0.061 ** | 0.025 to 0.098 |
| SES (≥ median) | 0.084 | −0.104 to 0.271 | 0.123 | −0.049 to 0.294 | 0.153 | −0.254 to 0.559 | 0.235 | −0.147 to 0.617 |
| Intercept | −8.261 to −2.882 | −8.081 to −3.165 | 32.54 to 44.21 | 34.33 to 45.26 | ||||
ß-estimates (excluding intercept) represent mean change in outcome per 1 unit change in covariate over time, adjusted for covariates.
ß-estimates and robust standard errors (SE) adjusted for within-subject correlation.
p< 0.001,
p< 0.01,
p< 0.05
Leptin, IGF-1 ln transformed;
PAExAge interaction represents different rate of change in outcome in ETOH exposed vs Unexposed groups
Cubic (age3) and/or Quadratic terms (age2) improved model fit for non-linear trend over time in 12-month and 24-month models, respectively;
Note: Random effects for age, age2, age3 inc. in models with corresponding main effect only; Random effect for IGF-1, Leptin in 12-month models only
Figure 1.
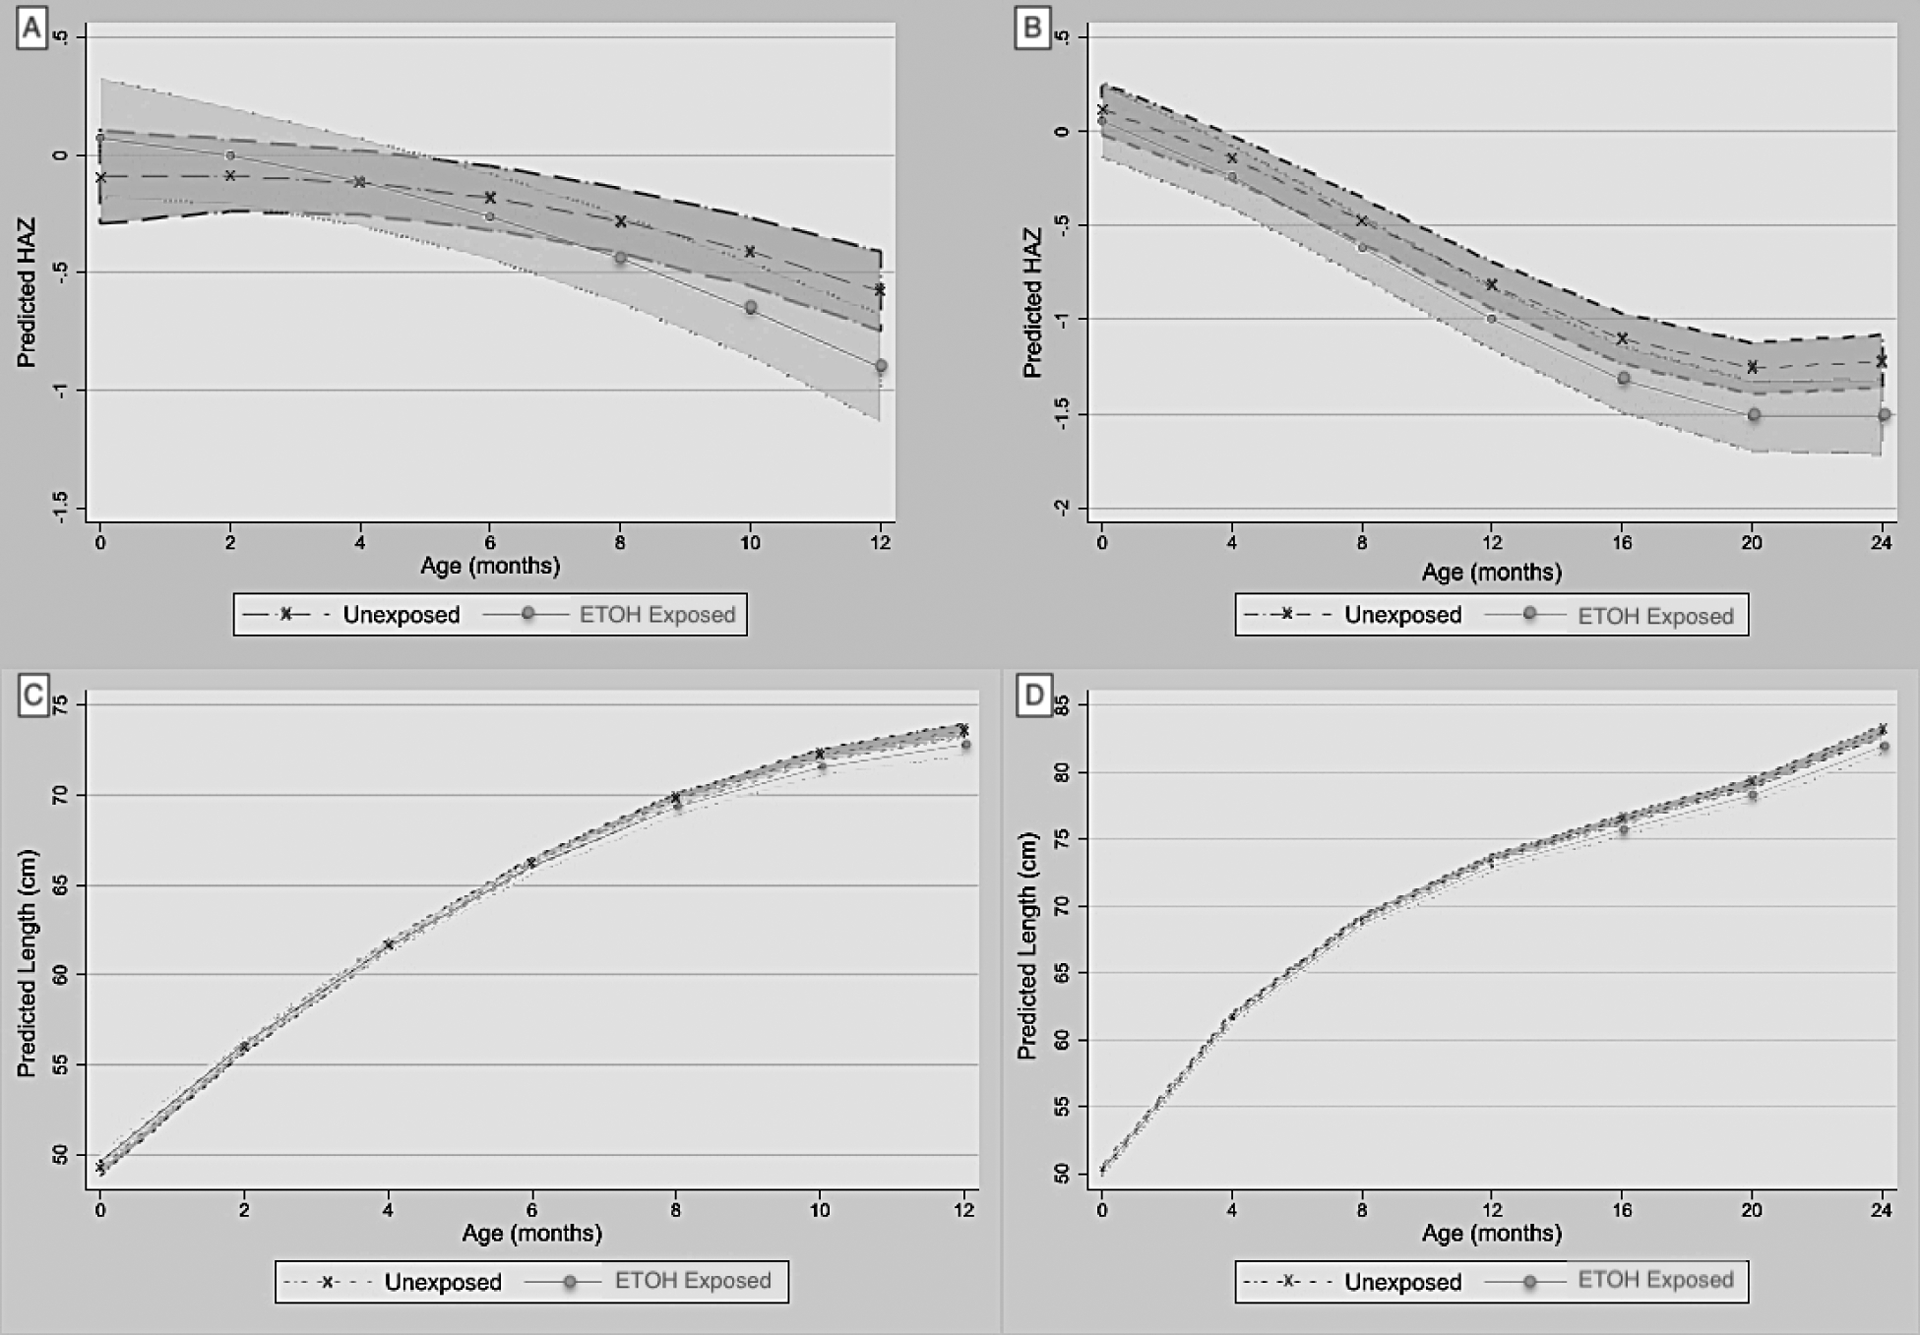
Adjusted linear mixed model marginal plots of predicted mean height estimates over time by exposure group (+/− shaded 95% confidence limits). (A) Predictive Mean Height-for-Age z-score (HAZ) over 12-months, and (B) 24-months. (C) Predictive Mean Body Length (cm) over 12-months, and (D) 24-months.
Table IV and Figure 2 (A–D) include similar effects on weight over time. PAE was associated with a steeper decline in WAZ from birth through 12 months (ß = −0.022, 95% CI: −0.039, −0.005) and 24 months (ß = −0.012, 95% CI: −0.021, −0.003), as well as body weight through 12 months (ß = −0.021, 95% CI: −0.037, −0.005) and 24 months (ß = −0.015, 95% CI: −0.025, −0.005). IGF-1 levels correlated with greater mean WAZ and weight, whereas leptin was associated with mean body weight only. Maternal MUAC, height and SES were associated with greater mean WAZ and/or body weight to varying degrees.
Table 4:
Linear Mixed Model for Effects of PAE on Weight-for-Age Z-score (WAZ) and Body Weight (kg)
| Outcome Model | WAZ to 12-mos | WAZ to 24-mos | Weight (kg) to 12-mos | Weight (kg) to 24-mos | ||||||||
|---|---|---|---|---|---|---|---|---|---|---|---|---|
| 95% CI | 95% CI | 95% CI | 95% CI | |||||||||
| PAE | 0.047 | 0.085 | −0.199, 0.214 | 0.018 | 0.089 | −0.156, 0.191 | 0.030 | 0.039 | −0.046, 0.106 | 0.033 | 0.048 | −0.061, 0.128 |
| Age (months) | 0.004 | 0.021 | −0.037, 0.044 | −0.075 *** | 0.014 | −0.103, −0.048 | 0.903 *** | 0.016 | 0.873, 0.933 | 0.857 *** | 0.013 | 0.832, 0.882 |
| Age2 (months) | −0.003 * | 0.001 | −0.006, −0.001 | 0.001 | 0.001 | −0.001, 0.004 | −0.038 *** | 0.001 | −0.040, −0.036 | −0.048 *** | 0.001 | −0.050, −0.045 |
| PAE x Age b | −0.022 * | 0.009 | −0.039, −0.005 | −0.012 ** | 0.005 | −0.021, −0.003 | −0.021 ** | 0.008 | −0.037, −0.005 | −0.015 ** | 0.005 | −0.025, −0.005 |
| Sex (male) | 0.052 | 0.075 | −0.094, 0.198 | 0.021 | 0.074 | −0.124, 0.167 | 0.165 *** | 0.037 | 0.093, 0.237 | 0.250 *** | 0.045 | 0.161, 0.339 |
| IGF-1 (ng/mL) | 0.144 *** | 0.041 | 0.065, 0.224 | 0.097 *** | 0.027 | 0.045, 0.149 | ||||||
| Leptin (pg/mL)a | 0.011 | 0.008 | −0.006, 0.027 | 0.021 ** | 0.007 | 0.006, 0.035 | ||||||
| Maternal MUAC at enrollment (cm) | 0.047 *** | 0.013 | 0.022, 0.072 | 0.049 *** | 0.012 | 0.025, 0.074 | 0.017 ** | 0.006 | 0.005, 0.030 | 0.025 *** | 0.008 | 0.010, 0.040 |
| Maternal Height (cm) | 0.016 * | 0.007 | 0.002, 0.030 | 0.016 * | 0.007 | 0.002, 0.030 | 0.006 | 0.004 | −0.001, 0.013 | 0.005 | 0.004 | −0.004, 0.014 |
| SES (≥ median) | 0.175 * | 0.075 | 0.029, 0.322 | 0.118 | 0.075 | −0.028, 0.265 | 0.081 * | 0.036 | 0.009, 0.152 | 0.039 | 0.046 | −0.050, 0.129 |
| Intercept | −7.113, −2.878 | −6.501, −2.300 | −0.082, 2.011 | 0.279, 2.855 | ||||||||
ß-estimates (excluding intercept) represent mean change in outcome per 1 unit change in covariate over time, adjusted for covariates.
ß-estimates and standard errors (SE) adjusted for within-subject correlation.
p< 0.001,
p< 0.01,
p< 0.05
Leptin, IGF-1 ln transformed;
PAExAge interaction represents different rate of change in outcome in ETOH exposed vs Unexposed groups;
Quadratic term (age2) improved model fit for non-linear trend over time;
Note: Random effects for age, age2 inc. in models with corresponding main effect; Random effect for IGF-1, Leptin in 12-month models only
Figure 2.
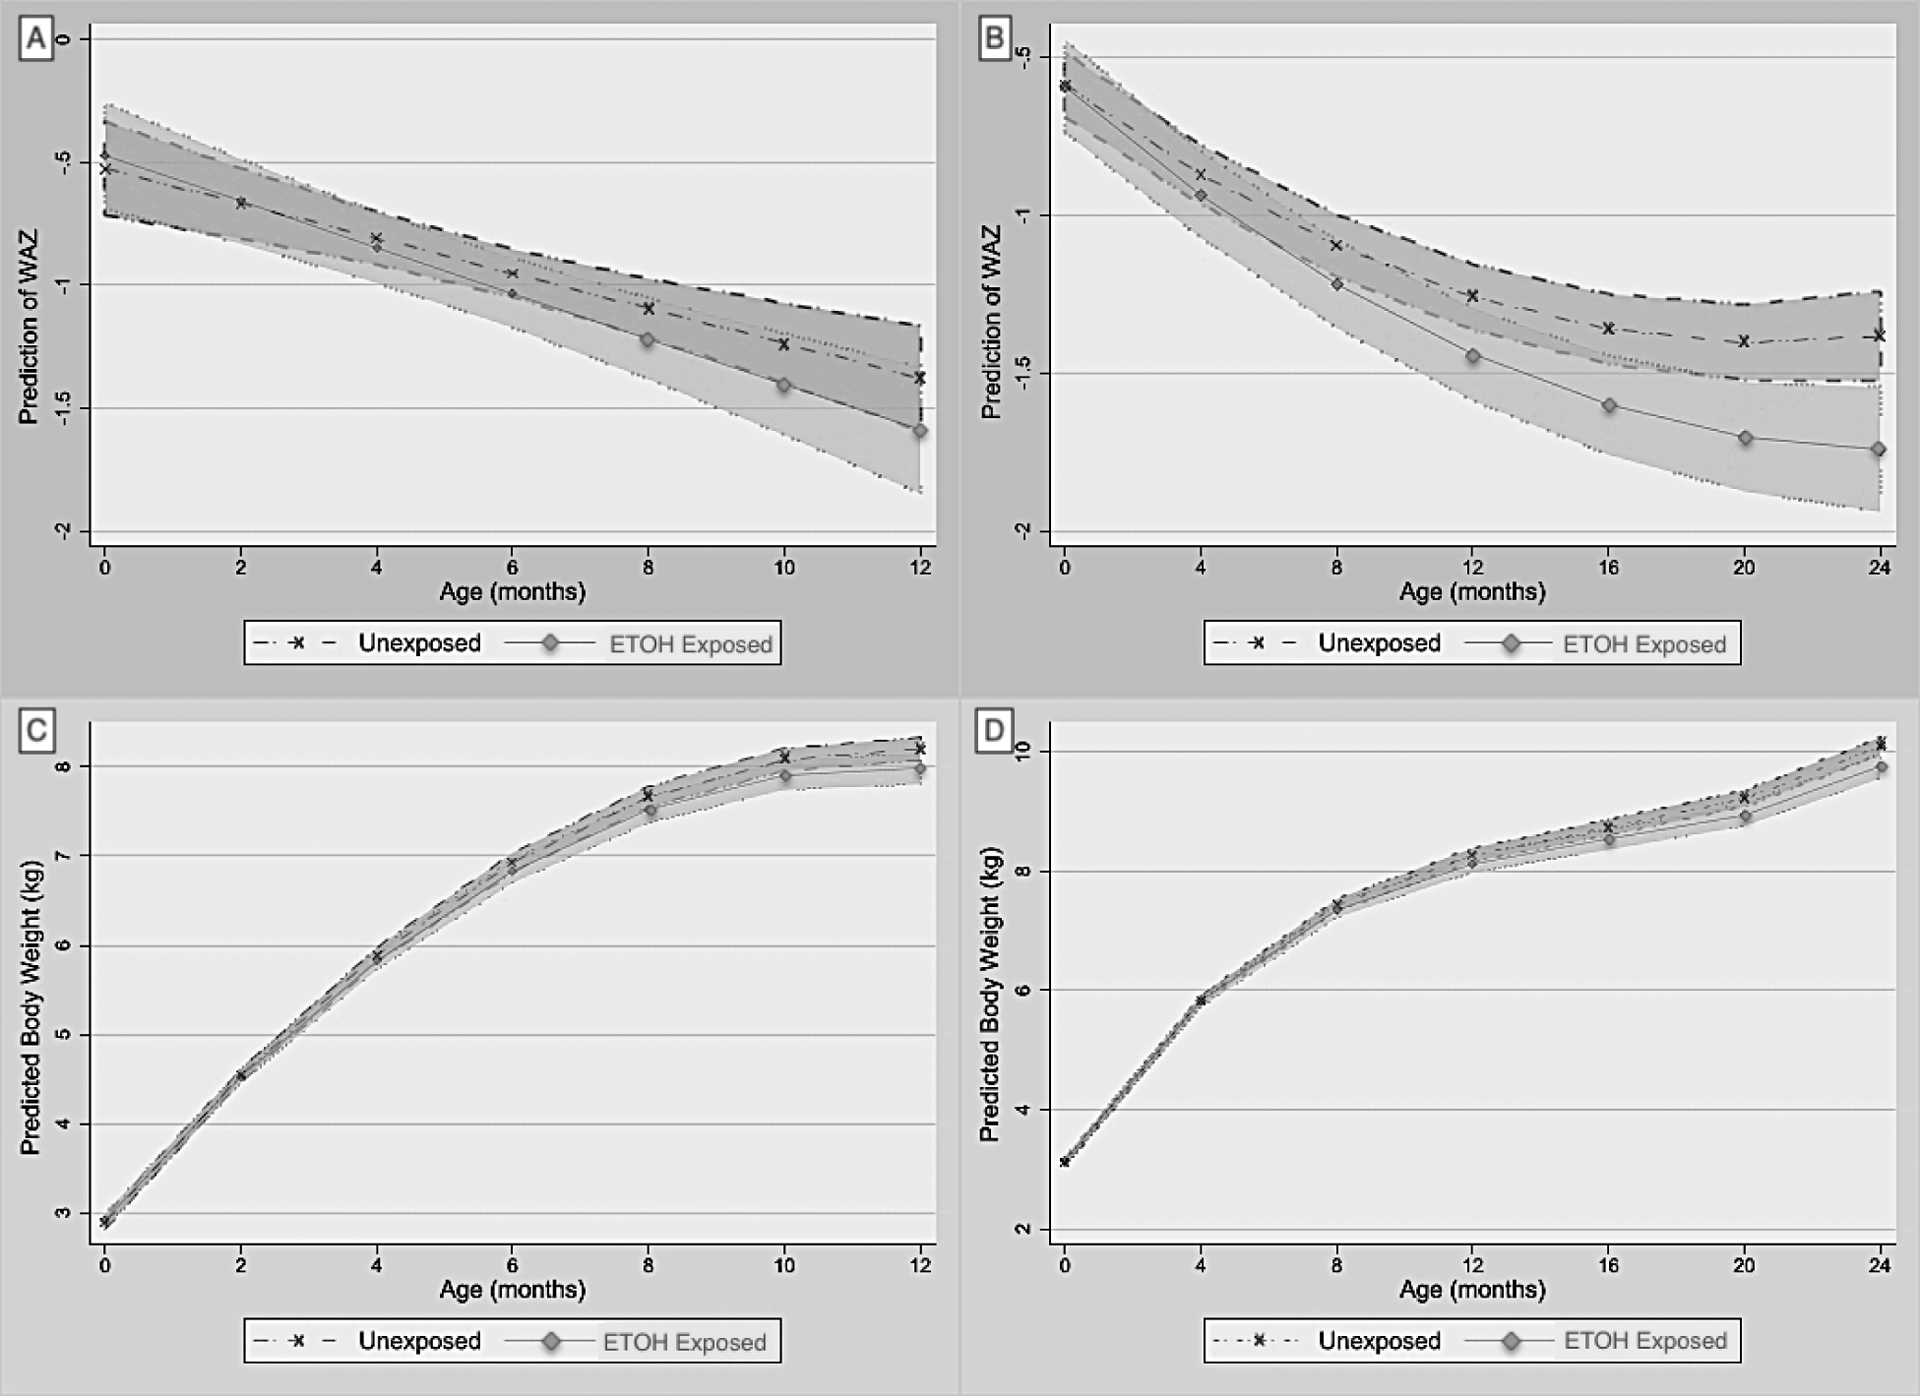
Adjusted linear mixed model marginal plots of predicted mean weight estimates over time by exposure group (+/− shaded 95% confidence limits). (A) Predictive Mean Weight-for-Age z-score (WAZ) over 12-months, and (B) 24-months. (C) Predictive Mean Body Weight (kg) over 12-months, and (D) 24-months.
IGF-1 levels were lower at birth and 6months in infants with ETOH-exposure (Table V; online). Although IGF-1 levels declined over time in both groups, there was no difference in IGF-1 rates of decline over 12- months (not shown). Infant MUAC growth rate over the first 12 months was more negative in the ETOH-exposed group (ß = −0.060, 95% CI: −0.108, −0.012) (Table VI; online). Maternal MUAC and SES were associated with greater infant MUAC and/or WHZ to varying degrees, though growth rates for infant MUAC and WHZ were similar between groups.
DISCUSSION
We longitudinally assessed prenatal ethanol exposure on growth trajectories in an LMIC setting with an objective biomarker of ethanol exposure and repeated measures of validated, standardized growth metrics throughout infancy. Our results demonstrated that teratogenic effects of even mild to moderate levels of prenatal ethanol contributed to adverse growth and nutritional status that manifested most apparently around 6-months of age and appeared to be partially explained through disruptions to fetal and infant IGF-1 signaling beginning in utero.
In this prospective cohort, we observed a delayed adverse effect of PAE on growth and nutrition among infants with and without ETOH exposure who had similar birth outcomes. Infants with PAE appeared to “drop off” growth curves between 4 and 8 months and tracked below unexposed counterparts through 24 months. These findings coincide with earlier PAE studies from the 1990’s that were among the first to report a lag in growth rates in the first 8 months of life (53). Even among children without an FASD diagnosis, those exposed to alcohol prenatally demonstrated a diminished growth capacity from gestation through 36 months (54) and 14 years (55) after controlling for nutritional and environmental factors. This delayed effect is supported by another cohort study which found that, even among children with similar birth characteristics, those with the most apparent growth deficiency over time were more likely to present with severe neurocognitive effects at FASD diagnosis (56). Kalberg et al assessed early life predictors of FASD phenotypes at age 5 and found that developmental differences between children with and without a FASD diagnosis were not readily apparent by 9 to 18 months of age (9). Comparable rates of head growth were less surprising as prenatal alcohol often has a less pronounced effect on head circumference (57–59) – termed the “head sparing phenomenon”– implying that tracking other growth parameters such as length or weight may prove more valuable in guiding diagnosis. These findings emphasize the utility of longitudinal growth trajectories as a more sensitive method of risk stratification versus cross-sectional infant anthropometry alone.
We observed both direct and indirect adverse effects of PAE on growth via the downregulation of IGF-1 in early childhood as evidenced by similar conclusions using longitudinal models with and without controlling for IGF-1 at 12 and 24 months, respectively. Our results are consistent with other animal and human studies which link PAE with IGF downregulation (60,61). One human study found that IGF dysregulation in early childhood was associated with adverse growth and neurocognitive scores among 8–12-year-olds (62). These findings lend credence to the hypothesis that developmental delays in FASD are due, in part, to IGF-1 signaling disruption in early life. It is worth noting, however, the multifactorial causes of birth outcomes such as genetics, placental health, and the fetal environment, which this study did not fully account for and was not powered to explain the discrepancy between fetal IGF-1 levels and birth outcomes between groups.
Interestingly, we observed a lag in IGF-1 with low levels in the exposed group at birth that equalized by 12 months. This could be due to toxic in-utero effects of alcohol on the fetal liver as the primary source of fetal IGF-1 (63) which, after birth, no longer contributes to placental insufficiency or direct toxic effects as feeding and environmental factors take over. IGF-1 is critical in many synergistic metabolic pathways, namely insulin metabolism and bone and muscle growth (64), which may partially explain the few months delay in growth lagging behind the decline in IGF-1 levels.
Although breastfeeding and breastmilk quality (protein) was not associated with PAE or infant growth in this cohort, it is possible that the impact of PAE on decreased linear growth and nutrition status in early childhood could be explained by other postnatal maternal factors. Specifically, it is possible that women who drink during pregnancy may also be more likely to consume alcohol postnatally, which could have affected both quantity and quality of breast milk, in turn impacting infant growth (65). In contrast to what many women incorrectly believe based on surveys globally, one study reported that breast milk production was decreased by 9.3% if women drank alcohol within two hours breast feeding(66). Other studies suggest decreased milk intake overall (65), whereas others have not (67). Further, although some studies demonstrate an impact of alcohol use on earlier discontinuation of breast feeding (at 6 months) (68), other studies do not support this (69). A recent study in South Africa sought to understand whether postnatal differences in infant feeding practices, including duration and exclusivity of breastfeeding and introduction of complementary foods, could explain the delayed impact on infant growth. It concluded that fetal alcohol-related postnatal growth restriction was not attributable to differences in postnatal feeding practices or alcohol exposure in breast milk and thus is likely a direct teratogenic effect of PAE (70). With respect to breastmilk quality, some studies have examined the impact of alcohol intake on immunologic factors in breastmilk (71), but few if any have found differences in the nutrient quality of breast milk.
In this population, postnatal factors appeared to have less effect on growth and nutrition for several reasons. First, very few women had high prenatal PEth levels, and smoking and substance use are highly uncommon among women in this population. Though some may drink enough to adversely impact their own nutritional status while breastfeeding, or hinder securing nutritious foods, this is less likely to be the case in this population than in other settings where women have significant alcohol use or other co-morbid substance use disorders. Finally, adjusting for SES likely removes effects of confounding due to nutrition education and food resources, which in most LMIC settings is a significant predictor of child nutritional status.
Our study has several strengths, including a relatively high retention. A notable absence of smoking and drug use in this cohort removes the most common confounders in perinatal research, and out cohort is relatively homogenous both genetically and environmentally, which limits common sources of residual confounding. Robust measures of SES and breastfeeding practice controls for key drivers of infant growth in LMICs, and use of an objective biomarker of alcohol exposure limits exposure misclassification vs. self-report alone. Thus, we are confident these results are likely due to PAE rather than other competing risks.
Our study has some limitations. First, multiple mother-baby dyads missed follow-up visits due to the SARS-CoV-2 pandemic. Also, the utility of PEth is limited by its 4-week window and lower limit of detection, and we presume some participants with low-to-moderate drinking may be misclassified as unexposed. Lastly, our results are limited to a 2-year follow-up, which may not capture FASD phenotypes that remain sub-clinical until later childhood or adolescence.
FASD studies have increasingly focused on identifying sensitive biomarkers to improve timely diagnosis, though these are costly and unavailable in many LMICs. Alternatively, standardized growth curves are widely accessible and represent a more economically feasible alternative in resource-limited settings for early identification of children at risk for FASD. In our cohort and several others, PAE did not predict prematurity or other common birth parameters, suggesting that infants with PAE may be misclassified as “low risk” for FASD if birth parameters alone are used to risk stratify. Lastly, in many LMICs, there is limited public health messaging about the harms of alcohol in pregnancy. Despite education by midwives, we found that alcohol exposure continued throughout gestation and impacted early childhood growth and nutrition, manifesting most apparently between 6 and 12 months of age, with IGF-1 downregulation playing an indirect mechanistic role. Likewise, another study from this cohort addressed knowledge and beliefs about risks of prenatal alcohol and found many were unaware of potential fetal harm and reported continued use in pregnancy (72). Results were shared with the Ministry of Health and midwives in Leyte. Future studies should consider parsing out long-term effects of other growth and nutritional hormones dysregulated by prenatal ethanol exposure, including IGF-1 and IGF-2, to identify modifiable risk factors and targets for early intervention.
Supplementary Material
Funding:
This study was supported by grants from the National Institutes of Health (K01AI113068 to EM) and (R01AA024092 to JFF and FG).
Role of Funder/Sponsor:
The NIH had no role in the design and conduct of the study.
Abbreviations
- CI
Confidence Interval
- FASD
Fetal Alcohol Spectrum Disorder
- HAZ
height/length-for-age z-score
- IGF-1
Insulin-like Growth Factor 1
- LBW
low birth weight
- LMIC
low- and middle-income countries
- MUAC
middle-upper-arm circumference
- PAE
Prenatal Alcohol Exposure
- SES
socioeconomic status
- SGA
small-for-gestational age
- sTfR
soluble transferrin receptor
- WAZ
weight-for-age z-score
- WHZ
weight-for-height z-score
Footnotes
Publisher's Disclaimer: This is a PDF file of an unedited manuscript that has been accepted for publication. As a service to our customers we are providing this early version of the manuscript. The manuscript will undergo copyediting, typesetting, and review of the resulting proof before it is published in its final form. Please note that during the production process errors may be discovered which could affect the content, and all legal disclaimers that apply to the journal pertain.
Financial Disclosure: The authors have no financial relationships to this article to disclose.
Conflict of Interest: Authors have indicated they have no conflicts of interest other incentives relevant to this article to disclose.
Data sharing:
Requests for access to the data should be made to the Center for International Health Research at Rhode Island Hospital, cc: Jennifer F. Friedman, MD, PhD (Jennifer_Friedman@brown.edu).
REFERENCES:
- 1.May PA, Baete A, Russo J, Elliott AJ, Blankenship J, Kalberg WO, et al. Prevalence and Characteristics of Fetal Alcohol Spectrum Disorders. Pediatrics. 2014 Nov 1;134(5):855–66. [DOI] [PMC free article] [PubMed] [Google Scholar]
- 2.Subramoney S, Eastman E, Adnams C, Stein DJ, Donald KA. The Early Developmental Outcomes of Prenatal Alcohol Exposure: A Review. Front Neurol. 2018 Dec 18;9:1108. [DOI] [PMC free article] [PubMed] [Google Scholar]
- 3.Hasken JM, Marais AS, de Vries M, Joubert B, Cloete M, Botha I, et al. Gestational age and birth growth parameters as early predictors of fetal alcohol spectrum disorders. Alcohol Clin Exp Res. 2021 Aug 1;45(8):1624–38. [DOI] [PMC free article] [PubMed] [Google Scholar]
- 4.Carter RC, Jacobson JL, Molteno CD, Dodge NC, Meintjes EM, Jacobson SW. Fetal Alcohol Growth Restriction and Cognitive Impairment. Pediatrics. 2016 Aug 1;138(2):2. [DOI] [PMC free article] [PubMed] [Google Scholar]
- 5.Burd L Fetal alcohol spectrum disorder: Complexity from comorbidity. The Lancet. 2016 Mar 5;387(10022):926–7. [DOI] [PubMed] [Google Scholar]
- 6.Mukherjee RAS, Hollins S, Turk J. Fetal Alcohol Spectrum Disorder: An Overview. J R Soc Med. 2006 Jun 23;99(6):298–302. [DOI] [PMC free article] [PubMed] [Google Scholar]
- 7.Popova S, Lange S, Shield K, Mihic A, Chudley AE, Mukherjee RAS, et al. Comorbidity of fetal alcohol spectrum disorder: A systematic review and meta-analysis. The Lancet. 2016 Mar 5;387(10022):978–87. [DOI] [PubMed] [Google Scholar]
- 8.Carter RC, Jacobson JL, Molteno CD, Dodge NC, Meintjes EM, Jacobson SW. Fetal Alcohol Growth Restriction and Cognitive Impairment. Pediatrics. 2016 Aug 1;138(2):2. [DOI] [PMC free article] [PubMed] [Google Scholar]
- 9.Kalberg WO, May PA, Buckley D, Hasken JM, Marais AS, De Vries MM, et al. Early-life predictors of fetal alcohol spectrum disorders. Pediatrics. 2019 Dec 1;144(6). [DOI] [PMC free article] [PubMed] [Google Scholar]
- 10.Aleman A, Torres-Alemán I. Circulating insulin-like growth factor I and cognitive function: Neuromodulation throughout the lifespan. Prog Neurobiol. 2009. Nov;89(3):256–65. [DOI] [PubMed] [Google Scholar]
- 11.Davila D, Piriz J, Trejo JL, Nunez A, Torres-Aleman I. Insulin and insulin-like growth factor I signalling in neurons. Frontiers in Bioscience. 2007;12(9):3194–202. [DOI] [PubMed] [Google Scholar]
- 12.de la Monte SM, Wands JR. Review of insulin and insulin-like growth factor expression, signaling, and malfunction in the central nervous system: Relevance to Alzheimer’s disease. Journal of Alzheimer’s Disease. 2005 Mar 3;7(1):45–61. [DOI] [PubMed] [Google Scholar]
- 13.Trejo J, Piriz J, Llorens-Martin MV, Fernandez AM, Bolós M, LeRoith D, et al. Central actions of liverderived insulin-like growth factor I underlying its pro-cognitive effects. Mol Psychiatry. 2007 Dec 11;12(12):1118–28. [DOI] [PubMed] [Google Scholar]
- 14.Åberg ND, Johansson UE, Åberg MAI, Hellström NAK, Lind J, Bull C, et al. Peripheral Infusion of Insulin-Like Growth Factor-I Increases the Number of Newborn Oligodendrocytes in the Cerebral Cortex of Adult Hypophysectomized Rats. Endocrinology. 2007 Aug 1;148(8):3765–72. [DOI] [PubMed] [Google Scholar]
- 15.Aberg ND, Brywe KG, Isgaard J. Aspects of growth hormone and insulin-like growth factor-I related to neuroprotection, regeneration, and functional plasticity in the adult brain. ScientificWorldJournal. 2006 Jan 18;6:53–80. [DOI] [PMC free article] [PubMed] [Google Scholar]
- 16.Dyer AH, Vahdatpour C, Sanfeliu A, Tropea D. The role of Insulin-Like Growth Factor 1 (IGF-1) in brain development, maturation and neuroplasticity. Neuroscience. 2016;325:89–99. [DOI] [PubMed] [Google Scholar]
- 17.Huat TJ, Khan AA, Pati S, Mustafa Z, Abdullah JM, Jaafar H. IGF-1 enhances cell proliferation and survival during early differentiation of mesenchymal stem cells to neural progenitor-like cells. BMC Neurosci. 2014 Jul 22;15(1):1–13. [DOI] [PMC free article] [PubMed] [Google Scholar]
- 18.Savage MO, Burren CP, Rosenfeld RG. The continuum of growth hormone-IGF-I axis defects causing short stature: Diagnostic and therapeutic challenges. Clin Endocrinol (Oxf). 2010;72(6):721–8. [DOI] [PubMed] [Google Scholar]
- 19.Hellström A, Ley D, Hansen-Pupp I, Hallberg B, Ramenghi L, Löfqvist C, et al. Role of Insulinlike Growth Factor 1 in Fetal Development and in the Early Postnatal Life of Premature Infants. Am J Perinatol. 2016 Sep 7;33(11):1067–71. [DOI] [PMC free article] [PubMed] [Google Scholar]
- 20.Özkan H, Aydin A, Demir N, Erci T, Büyükgebiz A. Associations of IGF-I, IGFBP-1 and IGFBP-3 on Intrauterine Growth and Early Catch-Up Growth. Neonatology. 1999. Nov;76(5):274–82. [DOI] [PubMed] [Google Scholar]
- 21.Laron Z Insulin-like growth factor 1 (IGF-1): a growth hormone. Mol Pathol. 2001 Oct 1;54(5):311–6. [DOI] [PMC free article] [PubMed] [Google Scholar]
- 22.Bollen KA, Noble MD, Adair LS. Are gestational age, birth weight, and birth length indicators of favorable fetal growth conditions? A structural equation analysis of Filipino infants. Stat Med. 2013 Jul 30;32(17):2950–61. [DOI] [PMC free article] [PubMed] [Google Scholar]
- 23.Monzavi R, Cohen P. IGFs and IGFBPs: Role in health and disease. Best Pract Res Clin Endocrinol Metab. 2002;16(3):433–47. [DOI] [PubMed] [Google Scholar]
- 24.De La Monte SM, Kril JJ. Human alcohol-related neuropathology. Acta Neuropathol. 2014;127(1):71–90. [DOI] [PMC free article] [PubMed] [Google Scholar]
- 25.Chu J, Tong M, De La Monte SM. Chronic ethanol exposure causes mitochondrial dysfunction and oxidative stress in immature central nervous system neurons. Acta Neuropathol. 2007;113:659–73. [DOI] [PubMed] [Google Scholar]
- 26.de la Monte SM, Tong M, Bowling N, Moskal P. si-RNA inhibition of brain insulin or insulin-like growth factor receptors causes developmental cerebellar abnormalities: relevance to fetal alcohol spectrum disorder. Mol Brain. 2011;4(1):13. [DOI] [PMC free article] [PubMed] [Google Scholar]
- 27.de la Monte SM, Wands JR. Role of central nervous system insulin resistance in fetal alcohol spectrum disorders. J Popul Ther Clin Pharmacol. 2010;17(3):e390–404. [PMC free article] [PubMed] [Google Scholar]
- 28.de la Monte SM, Tong M, Carlson RI, Carter JJ, Longato L, Silbermann E, et al. Ethanol inhibition of aspartyl-asparaginyl-β-hydroxylase in fetal alcohol spectrum disorder: Potential link to the impairments in central nervous system neuronal migration. Alcohol. 2009. May;43(3):225–40. [DOI] [PMC free article] [PubMed] [Google Scholar]
- 29.Olveda RM, Acosta LP, Tallo V, Baltazar PI, Lesiguez JLS, Estanislao GG, et al. Efficacy and safety of praziquantel for the treatment of human schistosomiasis during pregnancy: A phase 2, randomised, doubleblind, placebo-controlled trial. Lancet Infect Dis. 2016;16(2):199–208. [DOI] [PMC free article] [PubMed] [Google Scholar]
- 30.Abioye AI, McDonald EA, Park S, Joshi A, Kurtis JD, Wu H, et al. Maternal, placental and cord blood cytokines and the risk of adverse birth outcomes among pregnant women infected with Schistosoma japonicum in the Philippines. Cantacessi C, editor. PLoS Negl Trop Dis. 2019 Jun 12;13(6):e0007371. [DOI] [PMC free article] [PubMed] [Google Scholar]
- 31.Barry MA, Colt S, Vargas Z, Barry CV, Tallo V, Sagliba MJ, et al. Impaired Intrauterine Growth in the Context of Maternal Hookworm Infection During Gestation. J Infect Dis. 2022 May 16;225(10):1856–60. [DOI] [PMC free article] [PubMed] [Google Scholar]
- 32.Hannuksela ML, Liisanantti MK, Nissinen AET, Savolainen MJ. Biochemical markers of alcoholism. Clin Chem Lab Med. 2007 Jan 1;45(8):953–61. [DOI] [PubMed] [Google Scholar]
- 33.Faller A, Richter B, Kluge M, Koenig P, Seitz HK, Thierauf A, et al. LC-MS/MS analysis of phosphatidylethanol in dried blood spots versus conventional blood specimens. Anal Bioanal Chem. 2011. Sep;401(4):1163–6. [DOI] [PubMed] [Google Scholar]
- 34.Faller A, Richter B, Kluge M, Koenig P, Seitz HK, Skopp G. Stability of phosphatidylethanol species in spiked and authentic whole blood and matching dried blood spots. Int J Legal Med. 2013. May;127(3):603–10. [DOI] [PubMed] [Google Scholar]
- 35.Bakhireva LN, Savich RD, Raisch DW, Cano S, Annett RD, Leeman L, et al. The feasibility and cost of neonatal screening for prenatal alcohol exposure by measuring phosphatidylethanol in dried blood spots. Alcohol Clin Exp Res. 2013 Jun 1;37(6):1008–15. [DOI] [PMC free article] [PubMed] [Google Scholar]
- 36.Bakhireva LN, Leeman L, Savich RD, Cano S, Gutierrez H, Savage DD, et al. The Validity of Phosphatidylethanol in Dried Blood Spots of Newborns for the Identification of Prenatal Alcohol Exposure. Alcohol Clin Exp Res. 2014 Apr 1;38(4):1078–85. [DOI] [PMC free article] [PubMed] [Google Scholar]
- 37.Ulwelling W, Smith K. The PEth Blood Test in the Security Environment: What it is; Why it is Important; and Interpretative Guidelines. J Forensic Sci. 2018 Nov 1;63(6):1634–40. [DOI] [PubMed] [Google Scholar]
- 38.Villar J, Ismail LC, Victora CG, Ohuma EO, Bertino E, Altman DG, et al. International standards for newborn weight, length, and head circumference by gestational age and sex: The Newborn Cross-Sectional Study of the INTERGROWTH-21st Project. The Lancet. 2014;384(9946):857–68. [DOI] [PubMed] [Google Scholar]
- 39.WHO Multicentre Growth Reference Study Group. WHO Child Growth Standards based on length/height, weight and age. Acta paediatrica Suppl. 2006. Apr;450:76–85. [DOI] [PubMed] [Google Scholar]
- 40.Esper LH, Furtado EF. Identifying maternal risk factors associated with Fetal Alcohol Spectrum Disorders: a systematic review. Eur Child Adolesc Psychiatry. 2014;23(10):877–89. [DOI] [PubMed] [Google Scholar]
- 41.May PA, Tabachnick BG, Gossage JP, Kalberg WO, Marais AS, Robinson LK, et al. Maternal risk factors predicting child physical characteristics and dysmorphology in fetal alcohol syndrome and partial fetal alcohol syndrome. Drug Alcohol Depend. 2011;119(1–2):18–27. [DOI] [PMC free article] [PubMed] [Google Scholar]
- 42.May PA, Gossage JP. Maternal risk factors for fetal alcohol spectrum disorders: Not as simple as it might seem. Alcohol Research and Health. 2011;34(1):15–26. [PMC free article] [PubMed] [Google Scholar]
- 43.World Health Organization/United Nations Children’s Fund/United Nations University. Iron deficiency anemia: prevention, assessment and control–report of a joint WHO/UNICEF/UNU consultation, World Health Organization, Geneva. World Health Organization. Geneva (Switzerland); 2001. [Google Scholar]
- 44.Barry MA, Colt S, Vargas Z, Barry CV, Tallo V, Sagliba MJ, et al. Impaired Intrauterine Growth in the Context of Maternal Hookworm Infection During Gestation. J Infect Dis. 2022 Jan 29; [DOI] [PMC free article] [PubMed] [Google Scholar]
- 45.Tai M, Piskorski A, Kao JCW, Hess LA, de la Monte SM, Gündoğan F. Placental morphology in fetal alcohol spectrum disorders. Alcohol and Alcoholism. 2017 Mar 9;52(2):138–44. [DOI] [PMC free article] [PubMed] [Google Scholar]
- 46.Redline RW, Boyd T, Campbell V, Hyde S, Kaplan C, Khong TY, et al. Maternal Vascular Underperfusion: Nosology and Reproducibility of Placental Reaction Patterns. Pediatric and Developmental Pathology 2004 7:3. 2004 Mar 17;7(3):237–49. [DOI] [PubMed] [Google Scholar]
- 47.Ezeamama AE, Friedman JF, Acosta LP, Bellinger DC, Langdon GC, Manalo DL, et al. Helminth infection and cognitive impairment among Filipino children. American Journal of Tropical Medicine and Hygiene. 2005;72(5):540–8. [PMC free article] [PubMed] [Google Scholar]
- 48.Kanzaria H, Langdon G, Wu HW, Olveda RM. Relationship between Schistosoma japonicum and nutritional status among children and young adults in Leyte, the Philippines. ASTMH. 2005;72(5):527–33. [PubMed] [Google Scholar]
- 49.Kanzaria HK, Acosta LP, Langdon GC, Manalo DL, Olveda RM, McGarvey ST, et al. Schistosoma japonicum and occult blood loss in endemic villages in Leyte, The Philippines. American Journal of Tropical Medicine and Hygiene. 2005;72(2):115–8. [PubMed] [Google Scholar]
- 50.Filmer D, Pritchett LH. Estimating wealth effects without expenditure data—or tears: An application to educational enrollments in states of India. Demography. 2001 Feb 1;38(1):115–32. [DOI] [PubMed] [Google Scholar]
- 51.Ryoo JH. Model Selection with the Linear Mixed Model for Longitudinal Data. Multivariate Behav Res. 2011. Jul;46(4):598–624. [DOI] [PubMed] [Google Scholar]
- 52.StataCorp. Stata Statistical Software: Release 17. Stata: Release 17. College Station, TX: StataCorp LLC.; 2021. [Google Scholar]
- 53.Day NL, Richardson G, Robles N, Sambamoorthi U, Taylor P, Scher M, et al. Effect of prenatal alcohol exposure on growth and morphology of offspring at 8 months of age. Pediatrics. 1990 May 1;85(5):748–52. [PubMed] [Google Scholar]
- 54.Day NL, Robles N, Richardson G, Geva D, Taylor P al, Scher M, et al. The effects of prenatal alcohol use on the growth of children at three years of age. Alcohol Clin Exp Res. 1991;15(1):67–71. [DOI] [PubMed] [Google Scholar]
- 55.Day NL, Leech SL, Richardson GA, Cornelius MD, Robles N, Larkby C. Prenatal Alcohol Exposure Predicts Continued Deficits in Offspring Size at 14 Years of Age. Alcohol Clin Exp Res. 2002 Oct 1;26(10):1584–91. [DOI] [PubMed] [Google Scholar]
- 56.Astley SJ, Bledsoe JM, Davies JK. The essential role of growth deficiency in the diagnosis of fetal alcohol spectrum disorder. Adv Pediatr Res. 2016 Dec 1;3(9):1–20. [DOI] [PMC free article] [PubMed] [Google Scholar]
- 57.Bandoli G, Coles CD, Kable JA, Wertelecki W, Yevtushok L, Zymak-Zakutnya N, et al. Patterns of Prenatal Alcohol Use That Predict Infant Growth and Development. Pediatrics. 2019 Feb 1;143(2). [DOI] [PMC free article] [PubMed] [Google Scholar]
- 58.Bake S, Tingling JD, Miranda RC. Ethanol Exposure During Pregnancy Persistently Attenuates Cranially Directed Blood Flow in the Developing Fetus: Evidence from Ultrasound Imaging in a Murine Second Trimester Equivalent Model. Alcohol Clin Exp Res. 2012;36(5). [DOI] [PMC free article] [PubMed] [Google Scholar]
- 59.Probyn ME, Zanini S, Ward LC, Bertram JF, Moritz KM. A rodent model of low- to moderate-dose ethanol consumption during pregnancy: patterns of ethanol consumption and effects on fetal and offspring growth. Reprod Fertil Dev. 2012;24(6):859. [DOI] [PubMed] [Google Scholar]
- 60.Breese CR, Sonntag WE. Effect of Ethanol on Plasma and Hepatic Insulin-Like Growth Factor Regulation in Pregnant Rats. Alcohol Clin Exp Res. 1995 Aug 1;19(4):867–73. [DOI] [PubMed] [Google Scholar]
- 61.Ni Q, Tan Y, Zhang X, Luo H, Deng Y, Magdalou J, et al. Prenatal ethanol exposure increases osteoarthritis susceptibility in female rat offspring by programming a low-functioning IGF-1 signaling pathway. Scientific Reports 2015 5:1. 2015 Oct 5;5(1):1–13. [DOI] [PMC free article] [PubMed] [Google Scholar]
- 62.Andreu-Fernández V, Bastons-Compta A, Navarro-Tapia E, Sailer S, Garcia-Algar O. Serum concentrations of IGF-I/IGF-II as biomarkers of alcohol damage during foetal development and diagnostic markers of Foetal Alcohol Syndrome. Sci Rep. 2019 Dec 1;9(1). [DOI] [PMC free article] [PubMed] [Google Scholar]
- 63.Han VK, Lund PK, Lee DC, D’Ercole AJ. Expression of somatomedin/insulin-like growth factor messenger ribonucleic acids in the human fetus: identification, characterization, and tissue distribution. J Clin Endocrinol Metab. 1988 Feb 1;66(2):422–9. [DOI] [PubMed] [Google Scholar]
- 64.LeRoith D, Yakar S. Mechanisms of disease: metabolic effects of growth hormone and insulin-like growth factor 1. Nat Clin Pract Endocrinol Metab. 2007. Mar;3(3):302–10. [DOI] [PubMed] [Google Scholar]
- 65.Haastrup MB, Pottegård A, Damkier P. Alcohol and breastfeeding. Basic Clin Pharmacol Toxicol. 2014. Feb;114(2):168–73. [DOI] [PubMed] [Google Scholar]
- 66.Mennella JA. Short-term effects of maternal alcohol consumption on lactational performance. Alcohol Clin Exp Res. 1998. Oct;22(7):1389–92. [DOI] [PubMed] [Google Scholar]
- 67.Mennella JA. Regulation of Milk Intake After Exposure to Alcohol in Mothers’ Milk. Alcohol Clin Exp Res. 2001 Apr 11;25(4):590–3. [PMC free article] [PubMed] [Google Scholar]
- 68.Giglia RC, Binns CW, Alfonso HS, Scott JA, Oddy WH. The effect of alcohol intake on breastfeeding duration in Australian women. Acta Paediatr. 2008 May 3;97(5):624–9. [DOI] [PubMed] [Google Scholar]
- 69.Wilson J, Tay RY, McCormack C, Allsop S, Najman J, Burns L, et al. Alcohol consumption by breastfeeding mothers: Frequency, correlates and infant outcomes. Drug Alcohol Rev. 2017. Sep;36(5):667–76. [DOI] [PubMed] [Google Scholar]
- 70.Edwards AC, Jacobson SW, Senekal M, Dodge NC, Molteno CD, Meintjes EM, et al. Fetal Alcohol-Related Postnatal Growth Restriction Is Independent of Infant Feeding Practices and Postnatal Alcohol Exposure in a Prospective South African Birth Cohort. Nutrients. 2023 Apr 22;15(9):2018. [DOI] [PMC free article] [PubMed] [Google Scholar]
- 71.Na HR, Daniels LC, Seelig LL. Preliminary study of how alcohol consumption during pregnancy affects immune components in breast milk and blood of postpartum women. Alcohol Alcohol. 1997;32(5):581–9. [DOI] [PubMed] [Google Scholar]
- 72.Huang AM, Neale MN, Darveau SC, Sagliba MJ, Moreno AJ, Urbina MPG, et al. Knowledge, attitudes, practices, and beliefs regarding prenatal alcohol consumption among women in Leyte, the Philippines. Front Glob Womens Health. 2023 Aug 9;4. [DOI] [PMC free article] [PubMed] [Google Scholar]
Associated Data
This section collects any data citations, data availability statements, or supplementary materials included in this article.
Supplementary Materials
Data Availability Statement
Requests for access to the data should be made to the Center for International Health Research at Rhode Island Hospital, cc: Jennifer F. Friedman, MD, PhD (Jennifer_Friedman@brown.edu).