

Abstract
Clear cell renal cell carcinoma (ccRCC) incidence has risen steadily over the last decade. Elevated lipid uptake and storage is required for ccRCC cell viability. As stored cholesterol is the most abundant component in ccRCC intracellular lipid droplets, it may also play an important role in ccRCC cellular homeostasis. In support of this hypothesis, ccRCC cells acquire exogenous cholesterol through the HDL receptor SCARB1, inhibition or suppression of which induces apoptosis. Here, we showed that elevated expression of 3 beta-hydroxy steroid dehydrogenase type 7 (HSD3B7), which metabolizes cholesterol-derived oxysterols in the bile acid biosynthetic pathway, is also essential for ccRCC cell survival. Development of an HSD3B7 enzymatic assay and screening for small molecule inhibitors uncovered the compound celastrol as a potent HSD3B7 inhibitor with low micromolar activity. Repressing HSD3B7 expression genetically or treating ccRCC cells with celastrol resulted in toxic oxysterol accumulation, impaired proliferation, and increased apoptosis in vitro and in vivo. These data demonstrate that bile acid synthesis regulates cholesterol homeostasis in ccRCC and identifies HSD3B7 as a plausible therapeutic target.
Keywords: kidney cancer, clear cell renal cell carcinoma, HSD3B7, oxysterols, celastrol
INTRODUCTION
Altered cellular metabolism is a hallmark of ccRCC, which accounts for 75% of human kidney cancers (1,2). Expression of the von Hippel-Lindau (pVHL) tumor suppressor protein, which targets Hypoxia Inducible Factor (HIF) transcriptional regulators for degradation, is lost in approximately 90% of ccRCCs. Although elevated HIF activity contributes to many metabolic features of ccRCC, we and others have used integrated metabolomic, genomic, and transcriptomic data to demonstrate that enzymes in multiple metabolic pathways are universally depleted in human ccRCC tumors relative to normal kidney. For example, expression of the gluconeogenic enzyme fructose-1,6-bisphoshatase 1 (FBP1) is uniformly silenced in human ccRCCs, whereas ectopic FBP1 expression in ccRCC cell lines inhibits proliferation and cell survival in vitro and in vivo (3). Similarly, repression of the urea cycle enzyme arginase 2 (ARG2) promotes ccRCC tumor growth (4). These and similar data indicate that human ccRCCs are dependent on commonly altered metabolic features, despite their overall genetic heterogeneity, which may in turn represent effective targets for ccRCC therapy.
The defining “clear” cytoplasm of ccRCC cells reflects the presence of large intracellular lipid droplets (LDs) that store accumulated neutral lipids, including cholesterol, cholesterol esters (CE) and triglycerides (TG) (5). We demonstrated previously that ccRCC cells are strictly dependent on LD formation for growth and survival, and that blocking their formation causes ccRCC cell death (6). As cholesterol and cholesterol esters are the most abundant lipids in ccRCC LDs, we hypothesized that stored cholesterol species play an important role in ccRCC cellular homeostasis. We recently reported that pVHL-deficient ccRCC cells are, surprisingly, cholesterol auxotrophs and express elevated levels of the high-density lipoprotein (HDL) receptor SCARB1 (7), which mediates the majority of ccRCC cholesterol uptake in the form of HDL particles. Inhibiting SCARB1 either genetically or pharmacologically induced ccRCC cell cycle arrest, accumulation of reactive oxygen species (ROS), repressed PI3K/Akt signaling, and apoptosis. Collectively, these data suggest that ccRCC cells require import and storage of exogenous cholesterol to maintain cellular homeostasis, although the precise mechanisms involved are not fully understood.
Given their high levels of intracellular cholesterol, we hypothesized that ccRCC cells may also require the activity of metabolic pathways that catabolize cholesterol derivatives (e.g., oxysterols), such as bile acid synthesis and secretion (Fig. 1a), to avoid lipotoxic stress. To test this hypothesis, we investigated the previously unexplored role of bile acids in human ccRCC cells and determined that the expression of genes in the bile acid biosynthetic pathway is elevated in ccRCC tumors relative to normal kidney tissue. Moreover, transcript levels for HSDB37, a rate-limiting bile acid biosynthetic enzyme, are inversely correlated with ccRCC patient survival. Blocking HSD3B7 expression through shRNA or CRISPR-Cas9 techniques induced p53 accumulation, cell cycle arrest and apoptosis in ccRCC cells and greatly reduced xenograft tumor growth. HSD3B7 loss in ccRCC cells correlated with toxic accumulation of the oxysterol HSD3B7 substrate 7α-hydroxycholesterol (7α-OHC) and concomitant reduction in the downstream oxysterol product 7α-hydroxy-3-oxo-4-cholestenoic acid (7-HOCA), effects that were reversed by ectopic HSD3B7 expression. Importantly, exposing ccRCC cells to exogenous 7α-OHC resulted in DNA damage, p53 activation and apoptosis, which was similarly repressed by ectopic expression of catalytically active HSD3B7.
Figure 1. ccRCC tumors and cell lines activate bile acid metabolism.

A, Simplified schematic of the two branches of the “Bile Acid” pathway. Mammalian cells catabolize cholesterol through two independent pathways, the classical or the alternative, which are required for dietary lipid absorption.
B, Gene set enrichment analysis (GSEA) of RNAseq data provided by the TCGA KIRC project indicating that genes belonging to the “Bile Acid” pathway have higher expression in ccRCC tumors compared to normal kidney tissue. 538 ccRCC tumors and 72 normal kidney tissues were included. Generated metabolic gene sets were ranked based on normalized enrichment score changes in ccRCC compared to normal kidney tissue.
C, Metabolic gene set analysis of RNAseq data provided by the TCGA KIRC project. 538 ccRCC tumors and 72 normal kidney tissues were included. 2,752 genes encoding all human metabolic enzymes and transporters were classified according to KEGG. Generated metabolic gene sets were ranked based on their log2 median fold expression changes in ccRCC compared to normal tissue.
D, TCGA KIRC dataset analysis shows that expression of genes involved in the “Bile Acid” pathway are significantly up-regulated in ccRCC tumors vs. normal kidney tissue (left panel). BAAT, Bile Acid-CoA:Amino Acid N-Acyltransferase; AKR1D1, Aldo-Keto Reductase Family 1 Member D1; HSD3B7, Hydroxy-Delta-5-Steroid Dehydrogenase, 3 Beta- And Steroid Delta-Isomerase 7; CYP3A5, Cytochrome P450 Family 3 Subfamily A Member 5; CYP27A1, Cytochrome P450 Family 27 Subfamily A Member 1; CYP7A1, Cytochrome P450 Family 7 Subfamily A Member 1; CYP7B1, Cytochrome P450 Family 7 Subfamily B Member 1; CYP8B1, Cytochrome P450 Family 8 Subfamily B Member 1. Normalized RNASeq reads of HSD3B7 in 72 normal kidneys and 538 ccRCC tumors (TCGA KIRC) (right panel).
E, Normalized RNASeq reads of HSD3B7 in 72 normal kidneys and 538 ccRCC tumors grouped into stage I-IV (TCGA KIRC).
F, Kaplan-Meier analysis indicating that patients with tumors that expressed middle and high levels of HSD3B7 mRNA had a shorter overall survival (TCGA KIRC). 538 ccRCC tumors split into thirds based on HSD3B7 mRNA expression.
G, Real-time qPCR analysis of HSD3B7 mRNA performed on 17 tumor tissues and their normal counterparts. HSD3B7 gene expression is highly increased in tumors compared to normal tissues. Beta-2 microglobulin (B2M) was used as the housekeeping gene.
H, HSD3B7 protein expression in normal kidney tissue and ccRCC tumors assessed by immunoblots (top panel) with quantification by ImageJ (bottom panel). Tubulin (TUB) was used as the loading control.
I, HSD3B7 mRNA expression in ccRCC (KIRC), papillary RCC (KIRP) and chromophobe RCC (KICH) from TCGA. HSD3B7 gene expression is significantly increased in ccRCC compared to other subtypes.
(All experiments were performed in at least triplicates and statistical analysis was applied with *=P<0.05, **=P<0.01, ***=<0.001, n.s=non-significant).
To explore the potential utility of HSD3B7 as a therapeutic target in ccRCC, we developed an HSD3B7 enzymatic assay and screened for small molecule inhibitors. The compound celastrol emerged as a potent HSD3B7 inhibitor with low micromolar activity. Inhibiting HSD3B7 with celastrol correlated with toxic 7α-OHC accumulation, phenocopying the effects of diminished HSD3B7 expression, induced apoptosis in ccRCC cells and significantly reduced ccRCC tumor growth in vivo. Collectively, our data support a model in which ccRCC cells take up large quantities of HDL cholesterol through SCARB1, which can be deposited into LDs; however, these cells also require elevated HSD3B7 expression to convert toxic cholesterol-derived 7α-OHC into bile acids to maintain cellular homeostasis. These results demonstrate the importance of bile acid metabolism in ccRCC, implicate HSD3B7 as a potential therapeutic target, and identify celastrol as a potential tool compound for further drug development.
METHODS
EXPERIMENTAL MODEL AND SUBJECT DETAILS
Primary patient samples and gene expression data.
Matched tumor/normal samples were obtained from the Cooperative Human Tissue Network (CHTN). Tumors were homogenized in TRIZOL (see quantitative real-time PCR) or whole cell elution buffer (see western blot) and analyzed for HSD3B7 mRNA and protein expression. RNA-seq data for 538 ccRCC and 72 normal kidney samples were downloaded from the KIRC TCGA (RRID:SCR_003193) data set in April, 2020. Additionally, RNA-seq data were downloaded from the LUAD (585 lung adenocarcinomas and 59 normal lung samples) and BRCA (1098 breast invasive carcinomas and 113 normal breast samples) TCGA data sets in July, 2023. Differential gene expression analysis of tumor and normal samples was performed using DeSeq (Bioconductor Version 2.12). TCGA mutation and copy number data were downloaded from cBioPortal (RRID:SCR_014555) for Cancer Genomics. HOMER analysis was performed using HOMER (v4.4.1, https://homer.ucsd.edu, RRID:SCR_010881) to find and score enriched, known transcription factor binding site (TFBS) motifs in promotor regions for genes co-expressed with HSD3B7 as described previously (8).
Mice.
Experiments were approved by the Institutional Animal Care and Use Committee at the University of Pennsylvania (Philadelphia, PA), IACUC protocol #807488. NIH-III nude mice (Charles River Laboratories, RRID:SCR_003792, strain 201, 4–6 weeks old) were injected in each flank with 2×10⁶ A498, or A498 shcontrol (shSCR) or A498 shHSD3B7 cells. Prior to injection, cells were grown in complete media (DMEM containing 10% FBS) in 15-cm dishes. Cells were then resuspended in ice-cold PBS and were mixed 1:1 with Matrigel (BD Biosciences, cat. 356234) in a final volume of 200 μL per injection. Tumor volumes were recorded at the indicated time points using caliper measurements, calculated by the formula V = (π/6)x(L)x(W2), where L was the longer measurement and W was the shorter measurement. For mice bearing A498 xenografts expressing doxycycline-inducible shSCR or shHSD3B7, tumor growth was closely monitored and, when tumor volume reached 100 mm3, mice were randomized and switched to a chow diet containing 200 mg/kg of doxycycline (Bio-Serv, cat. S3888). For mice bearing A498 xenografts and receiving vehicle [PEG400 (45%), 1x PBS (45%), and EtOH (10%)] or celastrol (0.2 mg/kg, Sigma-Aldrich, cat. C0869) by daily intraperitoneal (IP) injection, tumor growth was closely monitored and, when tumor volume reached 100 mm3, mice were randomized and divided into treatment groups showing similar tumor volumes and body weights. At the end of the experiment, mice were sacrificed by CO2 inhalation, and tumors were dissected for further analyses.
Cell Culture.
Human ccRCC cell lines (786-O (RRID:CVCL_1051), 769-P (RRID:CVCL_1050), A498 (RRID:CVCL_1056), RCC4 (RRID:CVCL_0498), RCC10 (RRID:CVCL_6265), UMRC2 (RRID:CVCL_2739)), Human Kidney hTERT immortalized RPTEC (RRID:CVCL_K278), H1299 (RRID:CVCL_0060), MCF7 (RRID:CVCL_0031), and 293T (RRID:CVCL_0063) cells were obtained from the American Type Culture Collection and were cultured in DMEM (ThermoFisher Scientific, cat. 11965092) supplemented with 10% FBS (Gemini Bio-Products, cat. 900–108). Culture media was supplemented with 7α-hydroxycholesterol (10–50 μM, Abcam, cat. 146144) every other day for indicated experiments. Immortalized proximal tubular renal epithelial cells (HK2, RRID:CVCL_0302) obtained from ATCC (RRID:SCR_001672) and cultured in Keratinocyte Serum Free Media with appropriate supplements (ThermoFisher Scientific, cat. 17005042). Cells were routinely tested for mycoplasma (MycoAlert, Lonza, cat. LT07–318) and experiments performed with early passages.
Constructs and Viral Transduction.
Human single-guide RNAs (sgRNA) targeting HSD3B7 #1 (cgtgacccaggcccatgagg) and control gRNA targeting mouse Rosa26 locus (aagatgggcgggagtcttct) were cloned into LentiCRISPRv2 puro plasmid (Addgene Cat. 98290, RRID:Addgene_98290). Mature antisense human EPAS1 shRNA sequence (clone ID: TRCN0000003806) was used to generate the shRNA targeting HIF-2α. Mature antisense human STAT3 shRNA #1 sequence (clone ID: TRCN0000020843) and STAT3 shRNA #2 sequence (clone ID: TRCN0000329888) were used to generate the shRNA targeting STAT3. Mature antisense human HSD3B7 shRNA #1 sequence (clone ID: TRCN0000026515), HSD3B7 shRNA #2 sequence (clone ID: TRCN0000026572) along with scrambled (SCR) control (Addgene Cat. 136035, RRID:Addgene_136035) were cloned into a doxycycline-inducible pLKO.1 lentiviral plasmid (Addgene Cat. 21915, RRID:Addgene_21915). HSD3B7 cDNA resistant to short hairpin RNA and catalytic mutant HSD3B7 (Y159S) were generated by performing site directed mutagenesis using the Q5® Site-Directed Mutagenesis Kit (New England BioLabs, cat. E0554S). HSD3B7 cDNA resistant to short hairpin RNA and catalytically inactive HSD3B7 (Y159S) were cloned into a pCDH-CMV-MCS-EF1α-Hygro lentiviral plasmid (System Biosciences, cat. CD510B-1) for overexpression. Lentivirus was prepared by co-transfection of HEK293T cells (ATCC Cat. CRL-3216, RRID:CVCL_0063) with shRNA or CRISPR plasmid of interest along with packaging plasmids pMD2.G (Addgene Cat. 12259, RRID:Addgene_12259), psPAX2 (Addgene Cat# 12260, RRID:Addgene_12260) and Lipofectamine PLUS and LTX transfection reagent (Invitrogen, cat. 15338). Lentivirus-containing media was collected from plates at 48 hrs post-transfection, filtered using a 0.45 μm filter, and stored at −80°C. For viral transduction, cells were incubated with lentivirus-containing medium and 8 μg/mL polybrene for 6h. Cells were allowed to recover for another 48 hrs before selection with puromycin (2 μg/mL) or hygromycin (500 μg/mL). All experiments were performed with cells that survived puromycin or hygromycin selection and displayed knockdown/knockout of HSD3B7 as assayed by western blot.
Liquid-chromatography-high resolution mass spectrometry (LC-HRMS).
Extraction of cholesterol metabolites from the cells was performed as described in (9) with the only difference being the addition of 500 ng (20 μL of a mixture of each at 25 ng/ μL in methanol) of the internal standards before the beginning of extractions, all from Avanti Polar Lipids (RRID:SCR_016391): 7α-hydroxycholesterol-D7 (Avanti # 700043), 7ß-hydroxycholesterol-D7 (#700044), 7-ketocholesterol-D7 (#700046), 7α-OH cholestenone-D7 (#700112), 22(R)-hydroxycholesterol-D7 (#700052P), 24(R/S)-hydroxycholesterol-D7 (#700018P), 25-hydroxycholesterol-D6 (#700053), 27-hydroxycholesterol-D6 (#700059P), 5α,6α-epoxycholestanol-D7 (#700047), 24(R/S), 25-epoxycholestrol-D6 (#700048) and 3β-Hydroxy-7-oxocholest-5-enoic acid-D3 (#700225). Calibration curves have been constructed by plotting the area ratio of the individual standards to the corresponding internal standard in the range 0–200 ng per plate. The LC-HRMS method and data analysis was as described before (9). Final amounts were normalized to the original amount of protein per plate.
High Throughput Screen.
The high throughput screen and counter screens were completed using the NAD(P)H Glo-Detection System (Promega, #G9061) according to the manufacturer’s specifications with slight modifications. Assays were run at room temperature in a Reaction Buffer (RB) composed of 20mM Potassium Phosphate pH 7.4, 10% Glycerol, 0.04% DDM, and 5% DMSO. 800 natural products (Microsource Discovery Systems) were dispensed into 20 nM HSD3B7 in RB and 6 μM 7α-OHC using a Janus Modular Dispensing Tool (PerkinElmer) at a final compound concentration of 40 μM. Positive control samples were heated at 90°C for 2 minutes to inactivate HSD3B7 protein and DMSO was dispensed into HSD3B7 protein at room temperature for negative control samples. Reactions were started with 20 μM NAD+ to a final reaction volume of 12.5 μL and incubated at room temperature for 10 min. Reactions were subsequently stopped with 5 μL of NAD(P)H-Glo detection reagent. Detection reagent was incubated at room temperature for 60 min and luminescence was read on an EnVision Xcite multi-mode plate reader (PerkinElmer). For counter screening, the compound library was dispensed into the same RB but with 2 μM NADH in place of HSD3B7 protein. Plots were made using GraphPad Prism 10 (RRID:SCR_002798).
Data Availability
The data generated in this study are available within the article and its supplementary data files. Expression profile data analyzed in this study were obtained from The Cancer Genome Atlas (TCGA, RRID:SCR_003193) program (https://portal.gdc.cancer.gov). Further information and request for resources and reagents should be directed to and will be fulfilled by the lead contact, M. Celeste Simon (celeste2@pennmedicine.upenn.edu). This study did not generate new unique reagents.
RESULTS
Genes involved in bile acid metabolism are upregulated in ccRCC
Gene set enrichment analysis (GSEA) of RNA sequencing data from The Cancer Genome Atlas (TCGA) revealed that genes involved in bile acid metabolism are significantly elevated in primary human ccRCC tumors relative to normal kidney (Fig. 1b–d), suggesting that this pathway plays an important role in ccRCC initiation and/or progression. We focused on HSD3B7, a rate-limiting bile acid biosynthetic enzyme, as its expression was consistently and significantly increased in ccRCC (Fig. 1d). In contrast, mRNA levels of the cytochrome P450 enzyme CYP7A1, which catalyzes the initial oxidation of cholesterol, were not (Supplementary Fig. S1a). Interestingly, cBioPortal analysis of multiple TCGA ccRCC patient data sets suggests that structural alterations in the HSD3B7 locus were rarely found, in contrast to VHL (Supplementary Fig. S1b, c). Further examination of TCGA datasets indicated that high HSD3B7 expression is evident in early-stage disease and correlates significantly with worse overall patient survival (Fig. 1e, f). HSD3B7 mRNA and HSD3B7 protein overexpression was similarly observed in an additional 17 primary ccRCC human patient samples and a ccRCC tissue microarray (Fig. 1g, h and Supplementary Fig. S1d, e), as well as ccRCC cell lines, and appears to be higher in ccRCC than other cancer types (Supplementary Fig. S1f, g). Interestingly, HSD3B7 accumulation was higher in ccRCC than papillary and chromophobe kidney cancers, suggesting it may serve a function specific for ccRCC (Fig. 1i). A separate large-scale proteogenomic study (10) also reported that genes involved in bile acid metabolism were upregulated in ccRCC (Supplementary Fig. S1h, i).
In contrast, bile acid pathway gene expression was downregulated in liver (11), lung, and breast cancers compared to corresponding normal tissues, (Supplementary Fig. S2a, b). Although the overall pathway is suppressed, HSD3B7 mRNA expression was instead slightly upregulated in lung and breast cancers but did not have a significant impact on patient survival (Supplementary Fig. S2c–f), as demonstrated for ccRCC. Taken together, these data demonstrate unexpectedly elevated expression of bile acid biosynthetic enzymes, particularly HSD3B7, in ccRCC tumors suggesting a potential functional role. Moreover, other cancer types appear to be less dependent on bile acid synthesis for disease progression.
Regulation of HSD3B7 expression is independent of the VHL-HIF axis
VHL mutation and subsequent HIF subunit stabilization leads to enhanced transcription of hundreds of target genes involved in diverse biological pathways such as angiogenesis, and cell proliferation, migration and metabolism. We investigated whether pVHL and/or HIF-2α, essential drivers of ccRCC development and progression, control HSD3B7 expression. pVHL re-expression in 786-O cells or HIF-2α inhibition in A498 cells did not affect HSD3B7 protein levels or cell growth in the case of HIF-2α loss (Fig. 2a–d). Aberrant STAT3 activation has been related to the onset of more than half of all human cancers, including ccRCC where it has been shown to cooperate with HIF-1α to induce VEGF expression, thus promoting tumor angiogenesis (12). Interestingly, bioinformatic assessment showed that 75% of the 20 genes most abundantly co-expressed with HSD3B7 in ccRCC are also established STAT3 targets (Supplementary Fig. S3a). HOMER analysis, i.e. transcription factor binding motif evaluation, confirmed STAT3 as a potential regulator of HSD3B7 expression (Supplementary Fig. S3b). Further inspection of the HSD3B7 promotor revealed a putative STAT3 binding motif (TTCCGGGAAG) (Fig. 2e), although further functional studies would be needed to confirm STAT3 binds to this site in ccRCC cells. shRNA targeting of STAT3 in A498 and 769-P cells and 786-O cells +/− pVHL reduced HSD3B7 expression and impaired cell growth, suggesting that STAT3 can be a transcriptional regulator of the HSD3B7 locus (Fig. 2f, g). We concluded that HSD3B7 abundance in ccRCC is independent of the pVHL/HIF axis, unlike many other critical factors involved in disease progression, and may contribute to STAT3 effects on ccRCC.
Figure 2. STAT3 regulates HSD3B7 expression in ccRCC cells.

A, HSD3B7, VHL, and HIF2α protein expression assessed by immunoblots in 786-O cells expressing empty vector or VHL cDNA. HSP90 was used as the loading control.
B, Representative photographs of shSCR and shHIF2α A498 cells grown in media supplemented with 10% FBS. Magnification (100X).
C, Real-time qPCR analysis of HIF2α and VEGFA mRNA levels in A498 cells after shSCR or shHIF2α lentiviral infection and puromycin selection (48h, 2μg/mL). Beta-2 microglobulin (B2M) was used as the housekeeping gene.
D, HSD3B7 and HIF2α protein expression assessed by immunoblots in shSCR and shHIF2α A498 cells. GAPDH was used as the loading control.
E, STAT3 binding motif in HSD3B7 promoter.
F, HSD3B7 and STAT3 protein expression assessed by immunoblots in shSCR and shSTAT3 A498 and 769-P cells. Tubulin was used as the loading control. HSD3B7 and STAT3 protein expression assessed by immunoblots in shSCR and shSTAT3 786-O cells expressing empty vector or VHL cDNA. HSP90 was used as the loading control.
G, Representative photographs of shSCR and shSTAT3 786-O cells expressing empty vector or VHL cDNA grown in media supplemented with 10% FBS from Figure 2H. Magnification (100X).
(All experiments were performed in at least triplicates and statistical analysis was applied with *=P<0.05, **=P<0.01, ***=<0.001, n.s=non-significant).
HSD3B7 is essential for ccRCC cell viability and proliferation in vitro and in vivo
To investigate potential functional roles of HSD3B7 in ccRCC, we employed inducible shRNA and CRISPR-Cas9 techniques to reduce HSD3B7 expression in ccRCC cell lines A498 and 786-O (Fig. 3a, b and Supplementary Fig. S4a–d). HSD3B7 depletion inhibited A498 and 786-O proliferation (Fig. 3c, d and Supplementary Fig. S4e–h), whereas the non-transformed, immortalized HK-2 renal epithelial cell line was unaffected (Fig. 3e, f). Expression of an shRNA-resistant HSD3B7 mRNA in ccRCC cells fully rescued these phenotypes, confirming that they were specific for HSD3B7 loss and not due to off-target effects (Fig. 3g, h and Supplementary Fig. S4i). Additionally, we generated xenograft tumors in mice with A498 cells expressing a doxycycline inducible HSD3B7 shRNA. When tumors reached 100mm3, doxycycline was added to mouse chow, which inhibited the subsequent growth of HSD3B7-shRNA expressing tumors (Fig. 3i–m and Supplementary Fig. S4j, k). Our in vitro observations were also confirmed in additional ccRCC cell lines (RCC10 and UMRC2) and, surprisingly, in breast (MCF7) and lung (H1299) cancer cells (Supplementary Fig. S5a–h), an observation discussed further below. Collectively, our data suggest that elevated HSD3B7 expression is required for ccRCC proliferation in vitro and tumor growth in vivo.
Figure 3. Targeting HSD3B7 reduces ccRCC proliferation in vitro and in vivo.
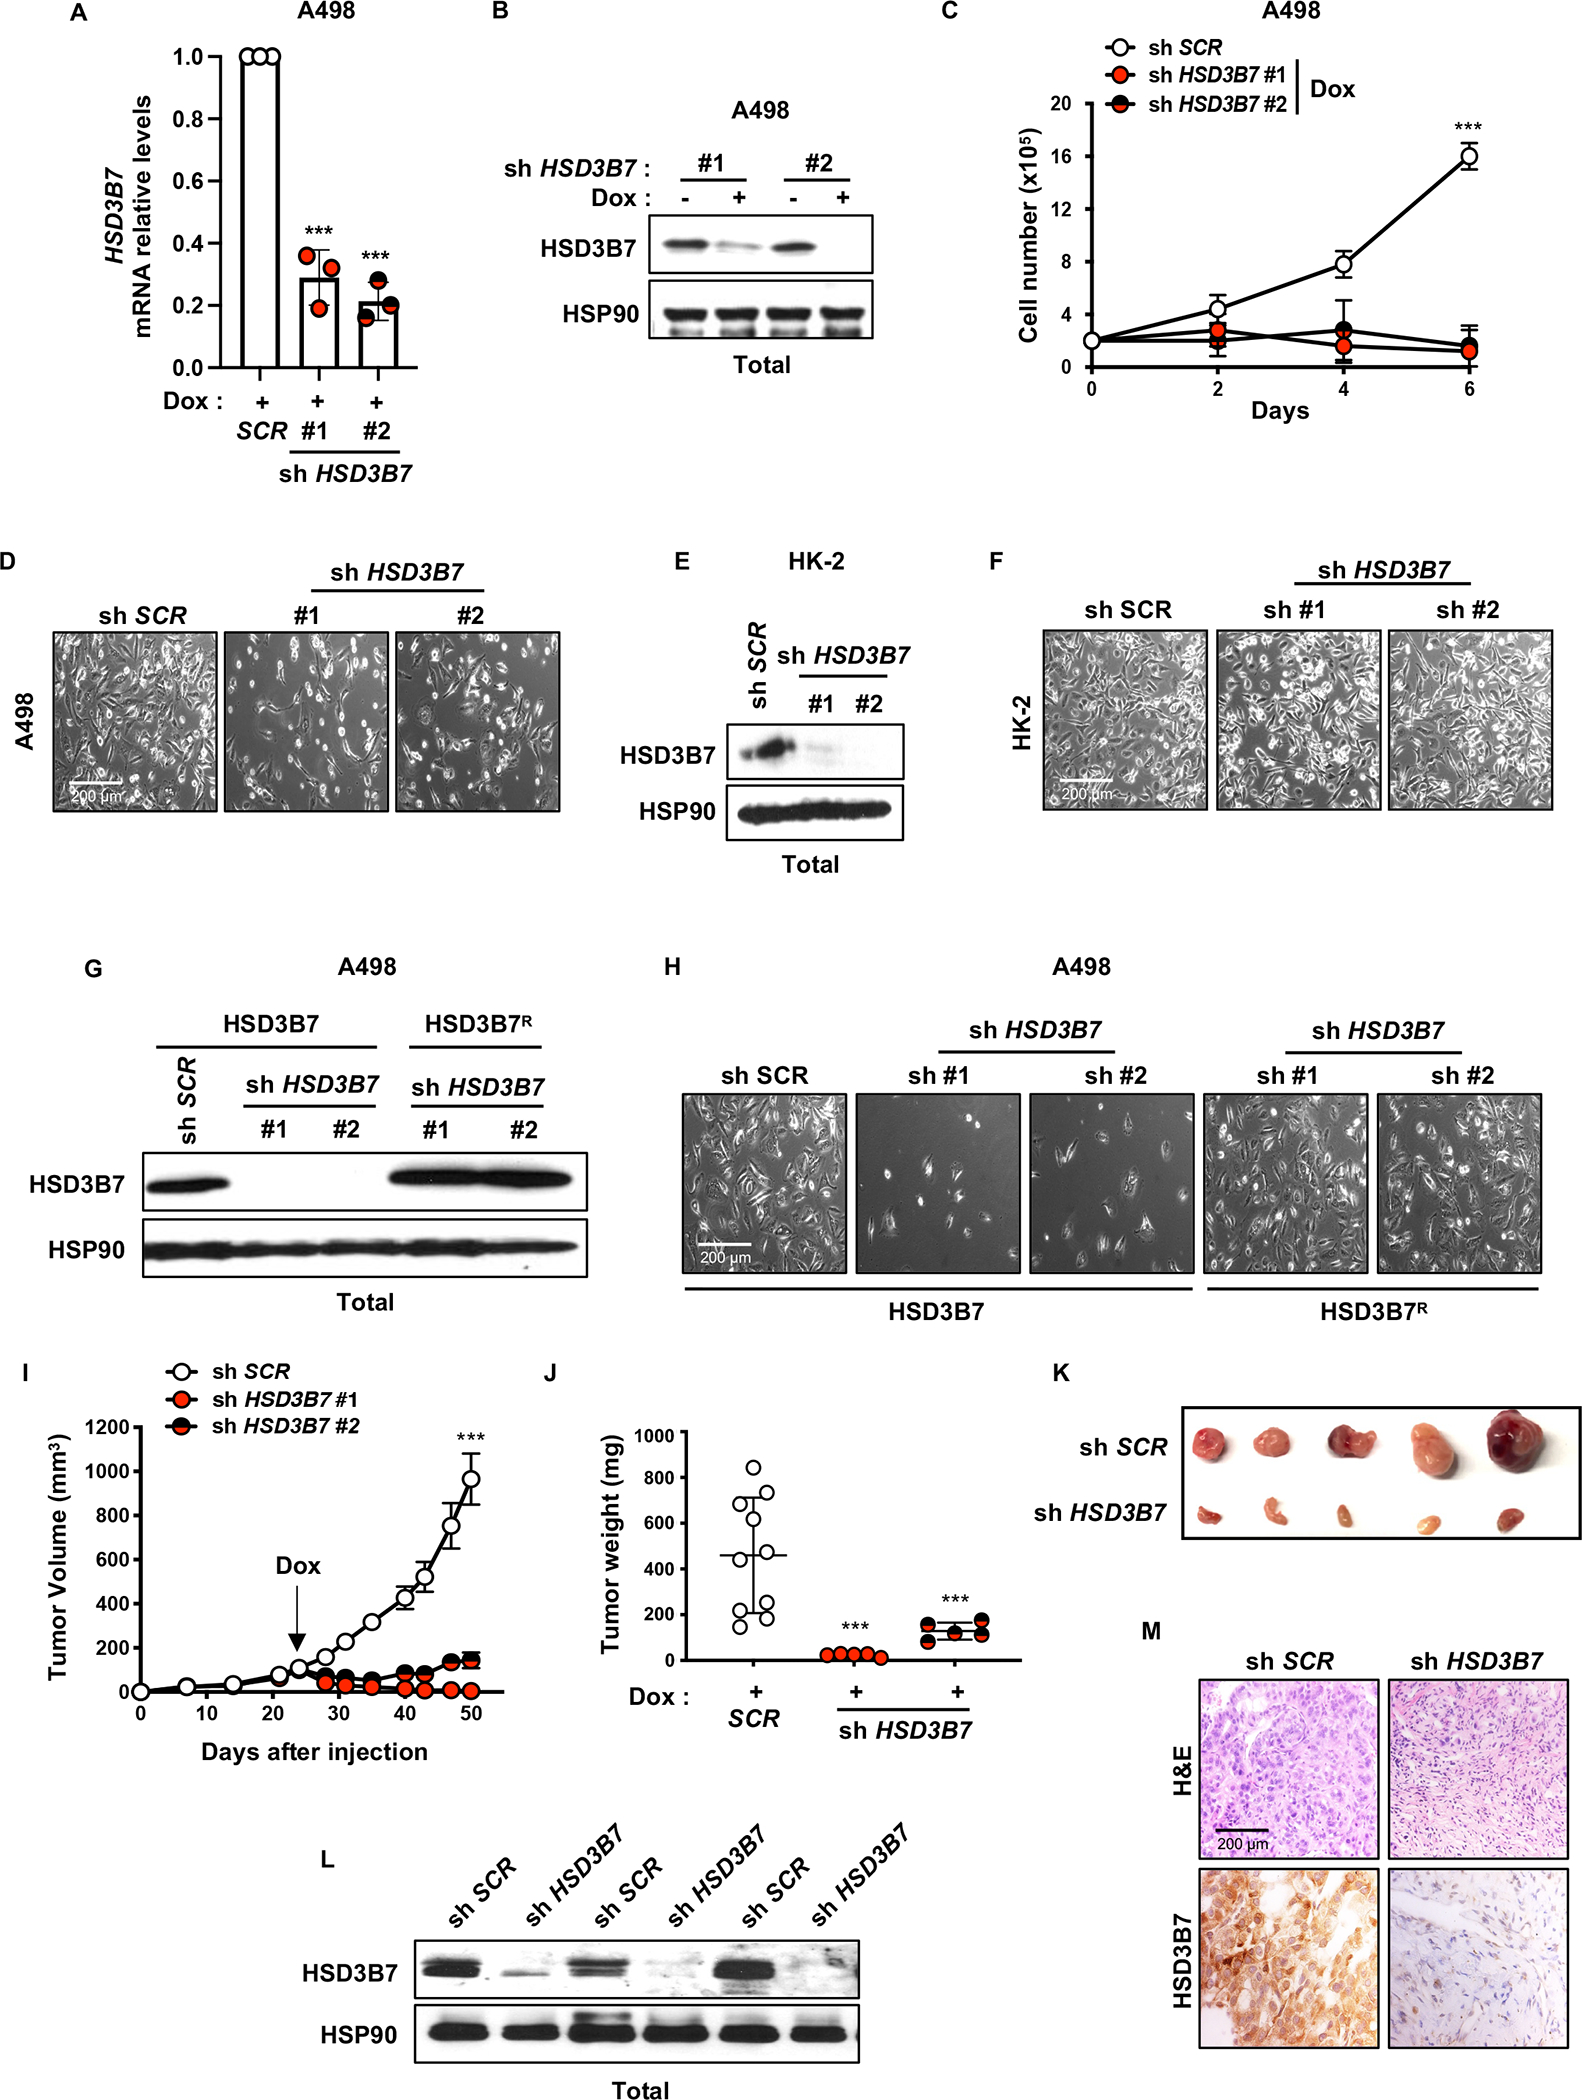
A, Real-time qPCR analysis of HSD3B7 mRNA level in A498 cells after shSCR or shHSD3B7 lentiviral infection, puromycin selection (48h, 2μg/mL) and doxycycline (Dox) treatment for 4 days (1μg/mL). Beta-2 microglobulin (B2M) was used as the housekeeping gene.
B, HSD3B7 protein expression assessed by immunoblots in shSCR and shHSD3B7 A498 cells treated or not with doxycycline (Dox) (4 days, 1μg/mL). HSP90 was used as the loading control.
C, Proliferation assay performed on shSCR and shHSD3B7 A498 cells grown in media with 10% FBS and supplemented with doxycycline (Dox) (1μg/mL) to induce HSD3B7 knockdown.
D, Representative photographs of shSCR and shHSD3B7 A498 cells grown in media with 10% FBS and supplemented with doxycycline (Dox) (1μg/mL) to induce HSD3B7 knockdown from Figure 3C. Magnification (100X).
E, HSD3B7 protein expression assessed by immunoblots in shSCR and shHSD3B7 HK-2 cells. HSP90 was used as the loading control.
F, Representative photographs of shSCR and shHSD3B7 HK-2 cells from Figure 4B. Magnification (100X).
G, HSD3B7 protein expression assessed by immunoblots in shSCR and shHSD3B7 A498 cells expressing HSD3B7 or HSD3B7 short hairpin resistant cDNA (HSD3B7R). HSP90 was used as the loading control.
H, Representative photographs of shSCR and shHSD3B7 A498 cells expressing HSD3B7 or HSD3B7 short hairpin resistant cDNA (HSD3B7R) from supplementary Figure 3I. Magnification (100X).
I, Tumor growth curves from doxycycline-inducible shSCR and shHSD3B7 A498 cells subcutaneously implanted in NIH-III nude mice fed a diet containing doxycycline (Dox) (200mg/kg) when tumors reached a volume of ~100mm3. Tumor volume was assessed at the indicated timepoints using caliper measurements (n=5 mice per shHSD3B7 group and n=10 mice for shSCR group).
J, Tumor weight from shSCR and shHSD3B7 A498 cells subcutaneously implanted in NIH-III nude mice fed a diet containing doxycycline (Dox) (200mg/kg), 50 days after implantation.
K, Representative photographs of shSCR and shHSD3B7#1 A498 tumors grown in NIH-III nude mice fed a diet containing doxycycline (Dox) (200mg/kg), 50 days after implantation.
L, HSD3B7 protein expression assessed by immunoblots of tumor lysates from shSCR and shHSD3B7 A498 tumors grown in NIH-III nude mice fed a diet containing doxycycline (DOX) (200mg/kg), 50 days after implantation. HSP90 was used as the loading control.
M, Representative photographs of immunohistochemistry analysis (H&E and HSD3B7 staining) performed on shSCR and shHSD3B7 A498 tumors grown in NIH-III nude mice fed a diet containing doxycycline (DOX) (200mg/kg), 50 days after implantation. Magnification (100X).
(All experiments were performed in at least triplicates and statistical analysis was applied with *=P<0.05, **=P<0.01, ***=<0.001, n.s=non-significant).
HSD3B7 deficiency triggers ccRCC apoptosis associated with toxic oxysterol accumulation
Flow cytometric analysis using Annexin V staining and propidium iodide further revealed that HSD3B7 depletion reduced A498 and 786-O cell viability, but not control HK-2 cells (Fig. 4a, b and Supplementary Fig. S6a, b). The caspase inhibitor zVAD-fmk restored cell viability, confirming that HSD3B7 depletion induced apoptosis in ccRCC cells (Supplementary Fig. S6c, d). Furthermore, we observed elevated protein levels of p53, as well as cleaved PARP-1 and cleaved caspase 3 (CC3) in cultured HSD3B7-depleted A498 cells and xenograft tumors (Fig. 4c and Supplementary Fig. S4k). p53 activation was confirmed by increased expression of its canonical target genes, NOXA, PUMA, and p21 (Fig. 4d) suggesting that HSD3B7 inhibition induces ccRCC cell death in a p53-dependent mechanism. The increased apoptotic cell death was accompanied by an increase in intracellular DCF-DA staining, indicating radical oxygen species (ROS) production upon HSD3B7 inhibition (Fig. 4e and Supplementary Fig. S6e, f). However, the antioxidant, N-acetyl-L-cysteine (NAC) reduced ROS levels but failed to rescue cell death (Fig. 4e, f and Supplementary Fig. S6e, f), indicating that ROS were not the cause of the ccRCC apoptosis upon HSD3B7 depletion.
Figure 4. Knocking down HSD3B7 induces apoptosis and p53.

A, Annexin-V/PI staining and flow cytometry analysis performed on shSCR and shHSD3B7 A498 cells after 96h of doxycycline (Dox) treatment (1μg/mL).
B, Annexin-V/PI staining and flow cytometry analysis performed on shSCR and shHSD3B7 HK-2 cells after 96h.
C, TP53, PARP and Cleaved Caspase 3 (CC3) protein expression assessed by immunoblots in shSCR and shHSD3B7 A498 cells. HSP90 was used as the loading control.
D, Real-time qPCR analysis performed on shSCR and shHSD3B7 A498 cells, evaluating expression of TP53 target genes; NOXA, PUMA and p21. Beta-2 microglobulin (B2M) was used as the housekeeping gene.
E, Reactive oxygen species (ROS) levels assessed by flow cytometry measuring DCFDA mean fluorescence intensity (MFI) in shSCR and shHSD3B7 A498 cells cultured in media with 10% FBS supplemented with or without N-acetyl-cysteine (NAC; 10mM) for 72h.
F, Annexin-V/PI staining and flow cytometry analysis performed on shSCR and shHSD3B7 A498 cells treated with or without N-acetyl-cysteine (NAC; 10mM) after 96h.
G, Liquid chromatography-tandem mass spectrometry (LC/MS) analysis assessing cholesterol in shSCR and shHSD3B7 A498 cells.
(All experiments were performed in at least triplicates and statistical analysis was applied with *=P<0.05, **=P<0.01, ***=<0.001, n.s=non-significant).
We next performed metabolomics studies to investigate the molecular mechanisms by which HSD3B7 deficiency triggers ccRCC cell death. Surprisingly, cholesterol levels and lipid droplet formation were not affected upon HSD3B7 knockdown (Fig. 4g and Supplementary Fig. S6g). In liver, 7α−hydroxylation of cholesterol by the cytochrome P450 enzyme CYP7A1 generates the oxysterol 7α−hydroxycholesterol (7α−OHC) and constitutes the first reaction in bile acid biosynthesis; however, 7α−OHC can also form through non-enzymatic oxidation of cholesterol by ROS. HSD3B7 then converts the oxysterol 7α−OHC into 7α-hydroxy-4-cholesten-3-one (7α−OH–ONE) (see Fig. 1a). In addition, HSD3B7 metabolizes related intermediates in the alternative bile acid synthetic pathway to produce the oxysterol 7α−hydroxy–3–oxo–4–cholestenoic acid (7-HOCA), among others (Fig. 5a). Interestingly, two independent pan-metabolomic analyses of primary human ccRCC tumors and matching normal kidney tissues exhibit significant 7-HOCA accumulation in tumors compared to normal tissues (Fig. 5b and Supplementary Fig. S7a–f), consistent with increased HSD3B7 activity. Further mass spectrometry experiments on A498 ccRCC cells revealed increased levels of 7α−OHC and decreased 7–HOCA levels following HSD3B7 depletion (Fig. 5c, d). Consistent with the cell death phenotype observed in HSD3B7-deficient ccRCC cells, treating A498 cells with exogenous oxysterols 7α−OHC, 7α−25–OHC and 7α−27–OHC, which are normally processed by HSD3B7 in the alternate pathway, induced apoptosis (Fig. 5e–g and Supplementary Fig. S7g–j). Furthermore, supraphysiologic HSD3B7 expression (HSD3B7R) in A498 cells rescued the cell death phenotype mediated by 7α−OHC treatment (Fig. 5f and Supplementary Fig. S7i, j). Moreover, exposure to exogenous 7α−OHC resulted in p53 activation, expression of its target genes (NOXA, PUMA, and p21), DNA damage (γ−H2AX), and PARP/caspase-3 cleavage in A498 and 786-O cells (Fig. 5h, i and Supplementary Fig. S7k). This is consistent with our HSD3B7 shRNA data in Figure 4. These data support a model in which ccRCC cells require elevated HSD3B7 expression to avoid toxicity associated with accumulation of oxysterols, including 7α−OHC, 7α−25–OHC and 7α−27–OHC. Lastly, we investigated whether HSD3B7 enzymatic activity was required for its function in ccRCC cells by generating a catalytically inactive form of HSD3B7, which is also resistant to HSD3B7 targeting shRNAs (HSD3B7R-Y159S) (Fig. 5j and Supplementary Fig. S7l, m). HSD3B7R-Y159S expression was unable to rescue the cell death induced by HSD3B7 inhibition, indicating that HSD3B7 enzymatic activity is required for its role in promoting ccRCC survival (Fig. 5k). These results suggest that pharmacological HSD3B7 inhibition might similarly induce ccRCC cell death, creating an opportunity for novel therapeutic approaches to treating kidney cancer.
Figure 5. HSD3B7 is essential for ccRCC viability by regulating oxysterols homeostasis.

A, Simplified schematic of oxysterols production through cholesterol catabolism.
B, Metabolomics analysis of 7α-hydroxy-3-oxo-4-cholestenoic acid in 97 normal kidney tissues and 135 ccRCC tumors.
C, Quantification of the HSD3B7 upstream product, 7α-hydroxy-cholesterol in shSCR and shHSD3B7 A498 cells after 72h, using liquid chromatography-high resolution mass spectrometry (LC/HRMS).
D, Quantification of the HSD3B7 downstream product, 7α-hydroxy-3-oxo-4-cholestenoic acid in shSCR and shHSD3B7 A498 cells after 72h, using LC/HRMS.
E, Representative photographs of CTR and HSD3B7 short hairpin resistant cDNA (HSD3B7R) expressing A498 cells treated with 10μM 7α-hydroxy-cholesterol from supplementary Figure 6J. Magnification (100X).
F, Annexin-V/PI staining and flow cytometry analysis performed on shSCR and shHSD3B7 A498 cells expressing empty vector or HSD3B7 short hairpin resistant cDNA (HSD3B7R) cultured in media with 10% FBS supplemented with vehicle (DMSO) or 7α-hydroxycholesterol (10μM) every other day for 96h.
G, Annexin-V/PI staining and flow cytometry analysis performed on A498 cells cultured in media supplemented with or without 7α-hydroxycholesterol (10μM) every other day and treated with vehicle (DMSO) or Z-Vad-fmk (50μM) for 96h.
H, Real-time qPCR analysis performed on A498 cells cultured in media supplemented with or without 7α-hydroxycholesterol (10μM) every other day for 96h, evaluating expression of TP53 target genes; NOXA, PUMA and p21. Beta-2 microglobulin (B2M) was used as the housekeeping gene.
I, TP53, PARP, γ-H2A.X, and Cleaved Caspase 3 protein expression assessed by immunoblots in A498 cells cultured in media supplemented with or without 7α-hydroxycholesterol (10μM) every other day for 96h. GAPDH was used as the loading control.
J, HSD3B7 protein expression assessed by immunoblots in shSCR and shHSD3B7 A498 cells expressing HSD3B7 short hairpin resistant cDNA (HSD3B7R) or catalytic inactive HSD3B7R (HSD3B7R-Y159S). HSP90 was used as the loading control.
K, Annexin-V/PI staining and flow cytometry analysis performed on shSCR and shHSD3B7 A498 cells expressing HSD3B7 short hairpin resistant cDNA (HSD3B7R) or catalytic inactive HSD3B7R (HSD3B7R-Y159S) after 96h.
(All experiments were performed in at least triplicates and statistical analysis was applied with *=P<0.05, **=P<0.01, ***=<0.001, n.s=non-significant).
HSD3B7 compound screen identifies celastrol as a potent inhibitor
To identify molecules that inhibit HSD3B7 activity and trigger ccRCC cell apoptosis, we developed a HSD3B7 assay to monitor activity and facilitate high-throughput screening. In brief, the initial assay employed recombinant human HSD3B7 protein, whose enzymatic activity was assessed by monitoring fluorescence induced by NAD+ reduction to NADH (Ex/Em = 340/460) that was coupled to 7α−OHC oxidation to generate 7α−OH–ONE (Supplementary Fig. S8a–c). Fluorescence was observed only when 7α−OHC was added, indicating that NAD+ reduction in this reaction was dependent on HSD3B7 (Supplementary Fig. S8d–e). A luminescence-based assay was subsequently developed, optimized, and then used to screen for HSD3B7 inhibitors within a natural product compound library (Fig. 6a, b).
Figure 6. Celastrol identified as a novel HSD3B7 inhibitor that impairs ccRCC cells growth in vitro and in vivo.

A, Reaction scheme for monitoring HSD3B7 activity via luminescence assay.
B, Percent of control (POC) for high throughput screening compounds towards HSD3B7 and coupling enzymes. Compounds with less than 20% HSD3B7 activity and greater than 75% counter screening enzyme activity are highlighted in red.
C, IC50 Dose-response curves for isoginkgetin and celastrol on HSD3B7 activity (n=3).
D, Structure comparison between celastrol and 7α-hydroxycholesterol.
E, Annexin-V/PI staining and flow cytometry analysis performed on A498 cells after 24h of celastrol treatment (1, 2, 5μM).
F, Proliferation assay performed on A498 cells grown in media with 10% FBS and treated with celastrol (2μM), or vehicle control (DMSO).
G, Annexin-V/PI staining and flow cytometry analysis performed on RPTEC cells after 24h of celastrol treatment (2μM).
H, Liquid chromatography-tandem mass spectrometry (LC/MS) analysis assessing HSD3B7 upstream product, 7α-hydroxycholesterol in A498 cells treated with celastrol (2μM), or vehicle control (DMSO) for indicated time point.
I, Tumor growth curves from A498 cells subcutaneously implanted in NIH-III nude mice treated with vehicle (PEG400 (45%), 1X PBS (45%), and EtOH (10%)) or celastrol (0.2mg/kg) by intraperitoneal injection daily for 23 days after tumor volume reached ~100mm3. Tumor volume was assessed at the indicated timepoints using caliper measurements (n=9 mice for celastrol treated group and n=8 mice for vehicle treated group).
J, Tumor weight from A498 cells subcutaneously implanted in NIH-III nude mice treated with vehicle or celastrol (0.2mg/kg) by intraperitoneal injection daily for 23 days.
K, Representative photographs of A498 tumors grown in NIH-III nude mice treated with vehicle or celastrol (0.2mg/kg) by intraperitoneal injection daily for 23 days.
L, Tumor volume from A498 cells subcutaneously implanted in NIH-III nude mice treated with vehicle or celastrol (0.2mg/kg) by intraperitoneal injection daily for 23 days.
M, Liquid chromatography-tandem mass spectrometry (LC/MS) analysis assessing HSD3B7 upstream product, 7α-hydroxy-cholesterol in A498 tumors treated with celastrol (0.2 mg/kg) or vehicle control for 23 days.
N, Liquid chromatography-tandem mass spectrometry (LC/MS) analysis assessing cholesterol in A498 tumors treated with celastrol (0.2 mg/kg) or vehicle control for 23 days.
(All experiments were performed in at least triplicates and statistical analysis was applied with *=P<0.05, **=P<0.01, ***=<0.001, n.s=non-significant).
Celastrol and isoginkgetin exhibited the strongest inhibitory effects on HSD3B7, and each was active at low micromolar concentrations (Fig. 6c). We focused initially on celastrol, as recent studies have highlighted celastrol’s anti-cancer properties in various tumor types, including ccRCC (13,14). Initially isolated from the roots of a traditional Chinese herb, celastrol is also used for obesity treatment and has a noticeable “cholesterol-like” structure (Fig. 6d). Celastrol treatment decreased ccRCC cell proliferation and triggered apoptotic cell death in a dose-dependent manner, at concentrations as low as 1–2 μM (IC50 of 3.0 μM (95% CI [2.3, 4.0]) (Fig. 6e, f and Supplementary Fig. S8f–k) but had no effect on normal primary renal proximal kidney epithelial cells (RPTEC) (Fig. 6g and Supplementary Fig. S8g). Although isoginkgetin demonstrated low micromolar activity against HSD3B7 in our enzymatic assay (Fig. 6c), it also exhibited a suboptimal IC50 of 40 μM in cultured ccRCC cells (Supplementary Fig. S8l) and was not explored further. Importantly, A498 cells treated with celastrol exhibited elevated levels of 7α−OHC compared to vehicle-treated cells (Fig. 6h), phenocopying the effects of HSD3B7 depletion and confirming the on-target effect of celastrol in ccRCC cells. Finally, we assessed the effects of celastrol on xenograft tumors derived from A498 cells. As reported previously for 786-O xenografts, celastrol treatment (0.2 mg/kg) significantly reduced A498 tumor growth with limited impact on mouse weight (Fig. 6i–l and Supplementary Fig. S8m). Intriguingly, metabolomic measurements of intratumoral 7α−OHC and cholesterol levels did not reveal any difference between vehicle [PEG400 (45%), 1x PBS (45%), and EtOH (10%)]-control- and celastrol-treated animals (Fig. 6m, n). This is likely due to heterogeneous cell types harbored in subcutaneous tumors beyond the HSD3B7 expressing ccRCC cells. Furthermore, cells exhibiting higher levels of 7α−OHC are likely to die during tumor growth also reducing overall levels. In aggregate, our findings demonstrate that ccRCC cells are dependent on elevated HSD3B7 expression to prevent the accumulation of toxic cholesterol-derived oxysterols. Either genetic or pharmacological inhibition of HSD3B7 increased oxysterol accumulation, inhibited proliferation, and induced apoptosis in ccRCC cells, but not in normal kidney cells (Supplementary Fig. S9). These data suggest that celastrol (or similar compounds) could be further developed as a novel therapeutic to treat kidney cancer.
DISCUSSION
ccRCC has been described as a metabolic disease, due in part to the myriad consequences of constitutive HIF signaling in pVHL-deficient tumors. For example, we reported previously that the gluconeogenic enzyme FBP1 has the unexpected ability to directly repress HIF transcriptional activity in ccRCC cells and demonstrated that 100% of the >1000 human ccRCC tumors we analyzed had silenced FBP1 expression (3). An additional metabolic ccRCC abnormality is the import and storage of large quantities of lipids, primarily cholesterol and cholesterol esters, a process on which these cells depend upon for survival (15). Here, we show that elevated expression of the bile acid biosynthetic enzyme HSD3B7 (independent of pVHL/HIF-2α activity) is also required for ccRCC cell viability, and that HSD3B7 ablation or inhibition results in the accumulation of toxic cholesterol-derived oxysterols (16). We also demonstrate that HSD3B7 enzymatic activity is necessary for its role in ccRCC cells. Our current and published data support a model in which synthesis of bile acid derivatives is required to alleviate the cytotoxic effects of cholesterol and oxysterol overload in ccRCC cells.
Cholesterol has multiple critical cellular functions, particularly in cancer cells, and is a precursor to bile acids, steroid hormones, and vitamin D (15). Bile acids are synthesized primarily in the liver and conjugated to taurine or glycine to form bile salts. These are released from the gall bladder into the duodenum to promote the emulsification and absorption of dietary fats, as well as excess cholesterol excretion and gut microbial homeostasis (17). Loss-of-function HSD3B7 mutations are associated with the disease congenital bile acid synthesis defect type 1 (CBAS defect type 1), which is life-threatening but can be successfully managed with exogenous bile acid (chenodeoxycholic acid and/or cholic acid) administration (18,19). Similarly, Hsd3b7 deletion in mice results in death, typically within 3 weeks of birth; however, their viability can also be maintained by oral bile acid and vitamin supplements (20). Additional roles for HSD3B7 have been identified in other cellular contexts. For example, it was demonstrated recently in lymphoid stromal cells that HSD3B7 inactivates 7α−25-hydroxycholesterol, an oxysterol ligand for the G protein-coupled receptor EBI2, to maintain proper B cell development and function (21). The presence of bile acids in urine is typically considered a sign of liver injury, and elevated bile acid levels can be found in serum and urine of patients with hepatocellular carcinoma (22). Interestingly, ccRCC patients also exhibit high levels of urinary bile acids (23), presumably a consequence of elevated synthesis in tumors. RNA sequencing and unsupervised clustering of gene expression profiles comparing primary VHL mutant to wild type ccRCC cells identified relatively few gene networks that were upregulated in VHL mutant cells, which include glycolysis, electron transport, hypoxia response, histone modification, bile acid synthesis, and bile salt transport (24). Gene set enrichment analysis of TCGA RNA sequencing data reported here also demonstrated bile acid metabolism genes as significantly up-regulated in ccRCC tumors compared to normal adjacent tissues. Finally, combined transcriptomic and proteomic approaches on core biopsies and normal adjacent tissue identified HSD3B7 among the 20 most abundant proteins differentially expressed in ccRCC (25). Overall, these findings implicate bile acid synthesis as a central metabolic characteristic of ccRCC. Intriguingly, HSD3B7 knockdown also induced apoptosis of lung (H1299) and breast (MCF7) cell lines; however, the repression of the entire bile acid pathway in corresponding human cancers and lack of correlation with patient survival suggests that this phenotype is not related to changes in bile acid synthesis as described here.
In a 2016 paper, Villa and colleagues demonstrated that glioblastoma multiforme (GBM) cells also take up large amounts of cholesterol, synthesized by astrocytes, through the low-density lipoprotein receptor (LDLR) while suppressing de novo cholesterol synthesis (26). Furthermore, GBM cells under-express CYP46A1, the primary oxysterol-generating enzyme in the brain, by more than 10-fold relative to normal brain tissue. The authors proposed that this arrangement allows GBM cells to avoid metabolizing 16 molecules of NADPH required to synthesize one molecule of cholesterol while simultaneously inhibiting the production of oxysterols that serve as ligands for the Liver X Receptor (LXR) transcription factors (27), whose activation represses LDLR expression and promotes cholesterol efflux. Consequently, GBM cells are exquisitely sensitive to select LXR agonists, which reduce cholesterol levels and cause cell death (rescued by supplying exogenous membrane-permeabilized cholesterol). It is striking that ccRCC and GBM cells are both cholesterol auxotrophs and suppress de novo cholesterol synthesis, although the selective advantage this affords to each tumor type is not entirely clear. A recent study highlighted the effects of LXRα agonist and inverse agonist function in ccRCC (28), which suggests that the LXRα-oxysterol signaling axis may also be a therapeutic target for ccRCC.
Our findings demonstrate that decreased HSD3B7 activity and subsequent function in ccRCC cells generates a previously unrecognized metabolic vulnerability and identifies celastrol as a potent HSD3B7 inhibitor that might be developed as a novel ccRCC therapy. Celastrol is a natural compound extracted from the root of Tripterygium wilfordii, an herb used in Chinese medicine, and celastrol as a possible anti-cancer agent led to a recently opened clinical trial (NCT05494112, NCT05413226) to assess its safety in human subjects (29). Interestingly, a connection between celastrol and LXRα has been made in ccRCC, where celastrol inhibited ccRCC cell invasion by triggering LXRα-mediated autophagy and ABCA1-mediated cholesterol efflux (13). Although the mechanism of activation of LXRα in response to celastrol was unclear, we hypothesize that celastrol treatment, through HSD3B7 inhibition, results in accumulation of toxic oxysterols and oxysterol-dependent activation of LXRα. Our preclinical data provide an initial rationale for further preclinical and clinical investigation of celastrol or its derivatives as potential treatments for ccRCC. Potential toxicities arising from reduced systemic bile acid synthesis could conceivably be managed by supplying exogenous cholic and/or chenodeoxycholic acids, as currently used to treat human HSD3B7 deficiency.
In conclusion, the unique lipid-related qualities of ccRCC provide multiple metabolic vulnerabilities that include, but are not limited to, dependence on lipid droplet formation to store excess cholesterol, cholesterol esters, and triglycerides, HDL-cholesterol import via surface SCARB1 activity, and detoxification of deleterious cholesterol derivatives through HSD3B7. As such, we propose each of these processes as attractive future therapeutic targets for the benefit of ccRCC patients.
Supplementary Material
STATEMENT OF SIGNIFICANCE.
The bile acid biosynthetic enzyme HSD3B7 is essential for clear cell renal cell carcinoma cell survival and can be targeted to induce accumulation of cholesterol-derived oxysterols and apoptotic cell death.
ACKNOLEDGEMENTS
We acknowledge the National Institutes of Health grants P01CA104838 and R35CA197602 to M.C.S, which support N.S, and Damon Runyon Cancer Research postdoctoral fellowship DRG2326-18 to R.R, F30CA271654 to N.J.C, R35GM118090 to R.M, and T32GM132039 that supported S.M.G. Mass spectrometry and analysis were performed by J.X and C.M was supported by the National Institute of Environmental Health Sciences grant P30ES013508. High Throughput Screening resources were supported by David Nguyen in the High Throughput Screening Core (RRID:SCR_022379) at the University of Pennsylvania. We are grateful to J. Tobias (RRID:SCR_022382) for help with processing the human TCGA data and P. Lal for providing the tissue microarrays. We thank members of the Simon and Marmorstein laboratories for helpful discussions and comments on the manuscript. Illustrations were generated using Servier medical art.
Footnotes
DECLARATION OF INTERESTS
The authors declare no potential conflicts of interest with respect to the research, authorship, and/or publication of this article.
REFERENCES
- 1.Qi X, Li Q, Che X, Wang Q, Wu G. The Uniqueness of Clear Cell Renal Cell Carcinoma: Summary of the Process and Abnormality of Glucose Metabolism and Lipid Metabolism in ccRCC. Front Oncol. 2021. Sep 15;11:727778. doi: 10.3389/fonc.2021.727778. [DOI] [PMC free article] [PubMed] [Google Scholar]
- 2.Rini BI, Campbell SC, Escudier B. Renal cell carcinoma. Lancet. 2009. Mar 28;373:1119–32. doi: 10.1016/S0140-6736(09)60229-4. [DOI] [PubMed] [Google Scholar]
- 3.Li B, Qiu B, Lee DSM, Walton ZE, Ochocki JD, Mathew LK, et al. Fructose-1,6-bisphosphatase opposes renal carcinoma progression. Nature. 2014. Sep 11;513:251–5. doi: 10.1038/nature13557. [DOI] [PMC free article] [PubMed] [Google Scholar]
- 4.Ochocki JD, Khare S, Hess M, Ackerman D, Qiu B, Daisak JI, et al. Arginase 2 Suppresses Renal Carcinoma Progression via Biosynthetic Cofactor Pyridoxal Phosphate Depletion and Increased Polyamine Toxicity. Cell Metab. 2018. Jun 5;27:1263–1280.e6. doi: 10.1016/j.cmet.2018.04.009. [DOI] [PMC free article] [PubMed] [Google Scholar]
- 5.Gebhard RL, Clayman RV, Prigge WF, Figenshau R, Staley NA, Reesey C, et al. Abnormal cholesterol metabolism in renal clear cell carcinoma. J Lipid Res. 1987. Oct;28:1177–84. [PubMed] [Google Scholar]
- 6.Ackerman D, Tumanov S, Qiu B, Michalopoulou E, Spata M, Azzam A, et al. Triglycerides Promote Lipid Homeostasis during Hypoxic Stress by Balancing Fatty Acid Saturation. Cell Rep. 2018. Sep 4;24:2596–2605.e5. doi: 10.1016/j.celrep.2018.08.015. [DOI] [PMC free article] [PubMed] [Google Scholar]
- 7.Riscal R, Bull CJ, Mesaros C, Finan JM, Carens M, Ho ES, et al. Cholesterol Auxotrophy as a Targetable Vulnerability in Clear Cell Renal Cell Carcinoma. Cancer Discov. 2021. Dec 1;11:3106–3125. doi: 10.1158/2159-8290.CD-21-0211. [DOI] [PMC free article] [PubMed] [Google Scholar]
- 8.Heinz S, Benner C, Spann N, Bertolino E, Lin YC, Laslo P, et al. Simple combinations of lineage-determining transcription factors prime cis-regulatory elements required for macrophage and B cell identities. Mol Cell. 2010. May 28;38:576–89. doi: 10.1016/j.molcel.2010.05.004. [DOI] [PMC free article] [PubMed] [Google Scholar]
- 9.Wang D, Ho ES, Cotticelli MG, Xu P, Napierala JS, Hauser LA, et al. Skin fibroblast metabolomic profiling reveals that lipid dysfunction predicts the severity of Friedreich’s ataxia. J Lipid Res. 2022. Sep 63:100255. doi: 10.1016/j.jlr.2022.100255. [DOI] [PMC free article] [PubMed] [Google Scholar]
- 10.Clark DJ, Dhanasekaran SM, Petralia F, Pan J, Song X, Hu Y, et al. Integrated Proteogenomic Characterization of Clear Cell Renal Cell Carcinoma. Cell. 2019. Oct 31;179:964–983.e31. doi: 10.1016/j.cell.2019.10.007. [DOI] [PMC free article] [PubMed] [Google Scholar]
- 11.Missiaen R, Anderson NM, Kim LC, Nance B, Burrows M, Skuli N, et al. GCN2 inhibition sensitizes arginine-deprived hepatocellular carcinoma cells to senolytic treatment. Cell Metab. 2022. Aug 2;34:1151–1167.e7. doi: 10.1016/j.cmet.2022.06.010. [DOI] [PMC free article] [PubMed] [Google Scholar]
- 12.Pawlus MR, Wang L, Hu CJ. STAT3 and HIF1α cooperatively activate HIF1 target genes in MDA-MB-231 and RCC4 cells. Oncogene. 2014. Mar 27;33:1670–9. doi: 10.1038/onc.2013.115. [DOI] [PMC free article] [PubMed] [Google Scholar]
- 13.Zhang C juan, Zhu N, Long J, Wu H tao, Wang Y xiang, Liu B yuan, et al. Celastrol induces lipophagy via the LXRα/ABCA1 pathway in clear cell renal cell carcinoma. Acta Pharmacol Sin. 2021. Sep;42:1472–1485. doi: 10.1038/s41401-020-00572-6. [DOI] [PMC free article] [PubMed] [Google Scholar]
- 14.Zhang CJ, Zhu N, Wang YX, Liu LP, Zhao TJ, Wu HT, et al. Celastrol Attenuates Lipid Accumulation and Stemness of Clear Cell Renal Cell Carcinoma via CAV-1/LOX-1 Pathway. Front Pharmacol. 2021. Apr 16:12:658092. doi: 10.3389/fphar.2021.658092. [DOI] [PMC free article] [PubMed] [Google Scholar]
- 15.Riscal R, Skuli N, Simon MC. Even Cancer Cells Watch Their Cholesterol! Mol Cell. 2019. Oct 17;76:220–231. doi: 10.1016/j.molcel.2019.09.008. [DOI] [PMC free article] [PubMed] [Google Scholar]
- 16.Lordan S, Mackrill JJ, O’Brien NM. Oxysterols and mechanisms of apoptotic signaling: implications in the pathology of degenerative diseases. J Nutr Biochem. 2009. May;20:321–36. doi: 10.1016/j.jnutbio.2009.01.001. [DOI] [PubMed] [Google Scholar]
- 17.Di Gregorio MC, Cautela J, Galantini L. Physiology and Physical Chemistry of Bile Acids. Int J Mol Sci. 2021. Feb 10;22:1780. doi: 10.3390/ijms22041780. [DOI] [PMC free article] [PubMed] [Google Scholar]
- 18.Gonzales E, Matarazzo L, Franchi-Abella S, Dabadie A, Cohen J, Habes D, et al. Cholic acid for primary bile acid synthesis defects: a life-saving therapy allowing a favorable outcome in adulthood. Orphanet J Rare Dis. 2018. Oct 29;13:190. doi: 10.1186/s13023-018-0920-5. [DOI] [PMC free article] [PubMed] [Google Scholar]
- 19.Kimura A, Mizuochi T, Takei H, Ohtake A, Mori J, Shinoda K, et al. Bile Acid Synthesis Disorders in Japan: Long-Term Outcome and Chenodeoxycholic Acid Treatment. Dig Dis Sci. 2021. Nov;66:3885–3892. doi: 10.1007/s10620-020-06722-4. [DOI] [PubMed] [Google Scholar]
- 20.Shea HC, Head DD, Setchell KDR, Russell DW. Analysis of HSD3B7 knockout mice reveals that a 3alpha-hydroxyl stereochemistry is required for bile acid function. Proc Natl Acad Sci U S A. 2007. Jul 10;104:11526–33. doi: 10.1073/pnas.0705089104. [DOI] [PMC free article] [PubMed] [Google Scholar]
- 21.Yi T, Wang X, Kelly LM, An J, Xu Y, Sailer AW, et al. Oxysterol gradient generation by lymphoid stromal cells guides activated B cell movement during humoral responses. Immunity. 2012. Sep 21;37:535–48. doi: 10.1016/j.immuni.2012.06.015. [DOI] [PMC free article] [PubMed] [Google Scholar]
- 22.Chen T, Xie G, Wang X, Fan J, Qiu Y, Zheng X, et al. Serum and urine metabolite profiling reveals potential biomarkers of human hepatocellular carcinoma. Mol Cell Proteomics. 2011. Jul;10:M110.004945. doi: 10.1074/mcp.M110.004945. [DOI] [PMC free article] [PubMed] [Google Scholar]
- 23.Monteiro MS, Barros AS, Pinto J, Carvalho M, Pires-Luís AS, Henrique R, et al. Nuclear Magnetic Resonance metabolomics reveals an excretory metabolic signature of renal cell carcinoma. Sci Rep. 2016. Nov 18:6:37275. doi: 10.1038/srep37275. [DOI] [PMC free article] [PubMed] [Google Scholar]
- 24.Lobo NC, Gedye C, Apostoli AJ, Brown KR, Paterson J, Stickle N, et al. Efficient generation of patient-matched malignant and normal primary cell cultures from clear cell renal cell carcinoma patients: clinically relevant models for research and personalized medicine. BMC Cancer. 2016. Jul 16:16:485. doi: 10.1186/s12885-016-2539-z. [DOI] [PMC free article] [PubMed] [Google Scholar]
- 25.Koch E, Finne K, Eikrem Ø, Landolt L, Beisland C, Leh S, et al. Transcriptome-proteome integration of archival human renal cell carcinoma biopsies enables identification of molecular mechanisms. Am J Physiol Renal Physiol. 2019. May 1;316:F1053–F1067. doi: 10.1152/ajprenal.00424.2018. [DOI] [PubMed] [Google Scholar]
- 26.Villa GR, Hulce JJ, Zanca C, Bi J, Ikegami S, Cahill GL, et al. An LXR-Cholesterol Axis Creates a Metabolic Co-Dependency for Brain Cancers. Cancer Cell. 2016. Nov 14;30:683–693. doi: 10.1016/j.ccell.2016.09.008. [DOI] [PMC free article] [PubMed] [Google Scholar]
- 27.Lin CY, Vedin LL, Steffensen KR. The emerging roles of liver X receptors and their ligands in cancer. Expert Opin Ther Targets. 2016;20:61–71.doi: 10.1517/14728222.2015.1081169. [DOI] [PubMed] [Google Scholar]
- 28.Wu G, Wang Q, Xu Y, Li J, Zhang H, Qi G, et al. Targeting the transcription factor receptor LXR to treat clear cell renal cell carcinoma: agonist or inverse agonist? Cell Death Dis. 2019. May 28;10:416. doi: 10.1038/s41419-019-1654-6. [DOI] [PMC free article] [PubMed] [Google Scholar]
- 29.Lim HY, Ong PS, Wang L, Goel A, Ding L, Li-Ann Wong A, et al. Celastrol in cancer therapy: Recent developments, challenges and prospects. Cancer Lett. 2021. Sep 8:521:252–267. doi: 10.1016/j.canlet.2021.08.030. [DOI] [PubMed] [Google Scholar]
Associated Data
This section collects any data citations, data availability statements, or supplementary materials included in this article.
Supplementary Materials
Data Availability Statement
The data generated in this study are available within the article and its supplementary data files. Expression profile data analyzed in this study were obtained from The Cancer Genome Atlas (TCGA, RRID:SCR_003193) program (https://portal.gdc.cancer.gov). Further information and request for resources and reagents should be directed to and will be fulfilled by the lead contact, M. Celeste Simon (celeste2@pennmedicine.upenn.edu). This study did not generate new unique reagents.