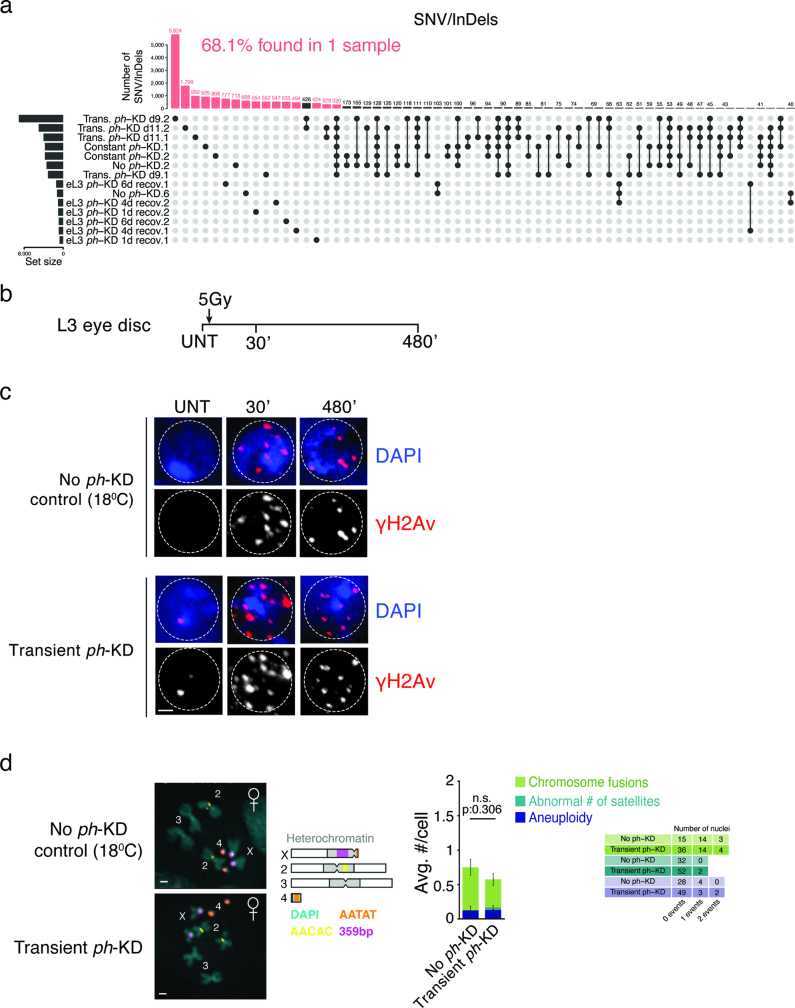
Extended Data Fig. 2. ph-KD does not induce the accumulation of mutations or aneuploidy.
a- SNV/InDels overlaps between all sequenced gDNA samples. Each vertical bar corresponds to an intersection (corresponding samples are shown below) and horizontal bars (bottom left) indicate the total number of SNV/InDels found in each sample. Only intersections containing ≥40 SNV/InDels are shown and SNV/InDels that are specific to one sample are shown in orange (68.1% of all SNV/InDels detected). b- Schematic view of the repair kinetic experiments. γH2Av foci were counted before or 30 min and 480 min after ionizing radiation (IR). c- Representative γH2Av staining in no ph-KD (control, top) and transient ph-KD EDs (bottom). Nuclei were counterstained with DAPI (in blue). d- Representative karyotypes (left) and quantification of chromosome abnormalities in EDs after no ph-KD (control, top) and transient ph-KD (bottom). The schematic representation shows the position of the satellites stained by FISH. Abnormalities were quantified from two biological replicates per condition (bar plot on the right, n = 32 for No ph-KD and n = 53 for ph-KD karyotypes). Bars correspond to the mean number of aberrations per cell ±standard error (whiskers). Two-sided t.test: ns = pval>0.05 (not significant). For each type of type of abnormality (see colour legend), the number of counted events are shown on the right (tables). Scale bars = 1 μm (c, d).

