

This cohort replication study investigates the ability of multitrait polygenic risk scores to strengthen genetic prediction of longitudinal depression across adolescence.
Key Points
Question
Could multitrait polygenic risk scores be used to strengthen genetic prediction of longitudinal depression across adolescence?
Findings
In this longitudinal cohort replication study of 14 112 adolescents, stronger effect sizes of multitrait polygenic risk association with adverse depression trajectories were found compared with unitrait genetic risk.
Meaning
Longitudinal depression has a robust genetic underpinning, and leveraging shared genetic information across multiple psychiatric traits may strengthen prediction models of depression in adolescence.
Abstract
Importance
Adolescent depression is characterized by diverse symptom trajectories over time and has a strong genetic influence. Research has determined genetic overlap between depression and other psychiatric conditions; investigating the shared genetic architecture of heterogeneous depression trajectories is crucial for understanding disease etiology, prediction, and early intervention.
Objective
To investigate univariate and multivariate genetic risk for adolescent depression trajectories and assess generalizability across ancestries.
Design, Setting, and Participants
This cohort study entailed longitudinal growth modeling followed by polygenic risk score (PRS) association testing for individual and multitrait genetic models. Two longitudinal cohorts from the US and UK were used: the Adolescent Brain and Cognitive Development (ABCD; N = 11 876) study and the Avon Longitudinal Study of Parents and Children (ALSPAC; N = 8787) study. Included were adolescents with genetic information and depression measures at up to 8 and 4 occasions, respectively. Study data were analyzed January to July 2023.
Main Outcomes and Measures
Trajectories were derived from growth mixture modeling of longitudinal depression symptoms. PRSs were computed for depression, anxiety, neuroticism, bipolar disorder, schizophrenia, attention-deficit/hyperactivity disorder, and autism in European ancestry. Genomic structural equation modeling was used to build multitrait genetic models of psychopathology followed by multitrait PRS. Depression PRSs were computed in African, East Asian, and Hispanic ancestries in the ABCD cohort only. Association testing was performed between all PRSs and trajectories for both cohorts.
Results
A total sample size of 14 112 adolescents (at baseline: mean [SD] age, 10.5 [0.5] years; 7269 male sex [52%]) from both cohorts were included in this analysis. Distinct depression trajectories (stable low, adolescent persistent, increasing, and decreasing) were replicated in the ALSPAC cohort (6096 participants; 3091 female [51%]) and ABCD cohort (8016 participants; 4274 male [53%]) between ages 10 and 17 years. Most univariate PRSs showed significant uniform associations with persistent trajectories, but fewer were significantly associated with intermediate (increasing and decreasing) trajectories. Multitrait PRSs—derived from a hierarchical factor model—showed the strongest associations for persistent trajectories (ABCD cohort: OR, 1.46; 95% CI, 1.26-1.68; ALSPAC cohort: OR, 1.34; 95% CI, 1.20-1.49), surpassing the effect size of univariate PRS in both cohorts. Multitrait PRSs were associated with intermediate trajectories but to a lesser extent (ABCD cohort: hierarchical increasing, OR, 1.27; 95% CI, 1.13-1.43; decreasing, OR, 1.23; 95% CI, 1.09-1.40; ALSPAC cohort: hierarchical increasing, OR, 1.16; 95% CI, 1.04-1.28; decreasing, OR, 1.32; 95% CI, 1.18-1.47). Transancestral genetic risk for depression showed no evidence for association with trajectories.
Conclusions and Relevance
Results of this cohort study revealed a high multitrait genetic loading of persistent symptom trajectories, consistent across traits and cohorts. Variability in univariate genetic association with intermediate trajectories may stem from environmental factors. Multitrait genetics may strengthen depression prediction models, but more diverse data are needed for generalizability.
Introduction
Adolescence is a crucial period of change in the brain and body, marking the onset of many mental health conditions including depression.1,2,3 Depression symptoms markedly increase between age 13 and 18 years4,5,6 during which symptom severity is higher compared with that of adult-onset depression.7,8 Depression is heterogeneous across adolescence due to the complex interplay between biological and environmental factors.8 Heterogeneity makes stratifying subgroups of depression essential for effective prediction, prevention, and treatment targeting.9
Longitudinal stratification provides a scaffold for identifying specific factors associated with early patterns of depression. Studies have used latent growth modeling to characterize distinct depression trajectories that capture important intraindividual differences.10,11,12
Approximately 90% of studies report 3 or 4 main trajectory groups.11 These studies typically find a stable low or nondepressed group, a stable high or persistent depressed group, and intermediate groups with positive or negative slopes over time. Slope variation in intermediate groups indicates reduced stability, thought to reflect underpinning by transient environmental rather than fixed biological factors.13 The highest proportion of individuals are found in the stable low group (>70%), whereas the other groups are more evenly split with the fewest individuals in the stable high group. Risk factors for more adverse trajectories include children of parents with depression14 and those with higher genetic risk for depression.15,16
Quantitative genetic and genome-wide association studies have demonstrated the heritability of major depressive disorder (MDD).9,17,18,19 Single nucleotide variation (SNV) heritability of early-onset depression was found to be 3-fold higher than late-onset depression.7 Consistent evidence from cross-sectional and longitudinal research shows that polygenic risk scores (PRSs) of multiple psychiatric conditions, such as depression/MDD, anxiety, attention-deficit/hyperactivity disorder (ADHD) and schizophrenia, are associated with depression at increasing levels throughout adolescence.15,16,20 Moreover, increased polygenic risk is associated with more severe and persistent trajectory liability.21
However, these studies have generally focused on genetic risk for MDD alone or other individual conditions such as anxiety and schizophrenia.22 Depression is a complex polygenic trait and shares a high genetic correlation with many psychiatric conditions.23 Genomic structural equation modeling (GSEM) was recently developed to explore correlated polygenicity among traits, including psychopathology.24,25 GSEM is a dimensional approach that captures shared genetic covariance to determine SNV loadings onto a latent genetic psychopathology factor (p-factor). This approach is akin to the p-factor of phenotypic psychopathology or general intelligence factor (g-factor).26 Genetic p-factor PRSs show increased predictive power compared with single-trait PRSs24 and multivariate architectures of psychopathological symptoms determine p-factor heritability up to 60% in twin models.27
The demonstrated association of univariate PRSs with adverse depression trajectories, coupled with the advancements offered by multivariate methods to leverage shared genetic architecture, provides the rationale for investigating the combined multitrait genetic risk of stratified longitudinal depression trajectories. This approach may uncover whether genetic susceptibility to correlated traits manifests differently in heterogenous subgroups, thereby providing a more informative forecast for characterizing complex depression phenotypes across adolescence and enhanced clinical utility.
Finally, despite the advancements in statistical genetics and depression research, the underrepresentation of minority ethnic groups, who face elevated depression risks, limits the generalizability of findings across populations.10,11 We leverage recently available advances in genome-wide studies of major depression across ancestries to include minority groups. Unfortunately, there is insufficient statistical power for other psychiatric conditions.
This study had 3 aims. The first aim was to derive and determine the replicability of depression trajectories across 2 adolescent cohorts. Our second aim was to investigate the association of univariate PRSs for 7 traits and a corresponding multitrait PRS with patterns of longitudinal depression across cohorts. Lastly, we aimed to test the generalizability of findings for major depression PRSs across underrepresented ancestries. Overall, our study sought to characterize the nature and etiology of multitrait PRSs on depression trajectories to identify how shared genetic risk underpins development across adolescence so that future research can adopt this work and extend it toward the health care system.
Methods
Sample Populations
The Adolescent Brain and Cognitive Development (ABCD) study is a longitudinal North American cohort of 11 876 individuals recruited between the ages of 9 and 10 years at baseline28 accessed through the National Institute of Mental Health Data Archive database.29 Self-reported race and ethnicity in the ABCD cohort were as follows: Asian, Black, Hispanic, White, and other (an alternative survey option). The Avon Longitudinal Study of Parents and Children (ALSPAC) is a UK-based cohort of 15 645 children born between 1991 and 1992.30,31 Self-reported race and ethnicity in the ALSPAC cohort was overwhelmingly European White race. Both studies received ethics approval and informed consent; detail and further cohort information is available in eAppendix 1 and 2 in Supplement 1. This study followed the Strengthening the Reporting of Observational Studies in Epidemiology (STROBE) reporting guidelines.
Depression Measures
In the ABCD study, the Brief Problem Monitoring (BPM) youth report scale provides a 6-item 3-point Likert subscale of internalizing symptoms collected every 6 months.32 BPM is a self-report validated scale33,34 with items derived from the more known Child Behavior Checklist. Eight occasions of BPM were recorded between ages 10.4 and 14.1 years. In the ALSPAC study, the Short Mood and Feeling Questionnaire (SMFQ) comprises an annual collection of 13 items scored on a 3-point Likert scale relating to depressive symptoms35 and is indicative of clinical depression.36,37 In ALSPAC, we used the first 4 occasions between ages 10.6 and 16.7 years to enable quadratic latent factor analysis and for matching cohort age with the ABCD study. For both cohorts, descriptive statistics, questionnaire items, and attrition rates are in eTables 1 to 5 in Supplement 1.
Genome-Wide Association Study Discovery Samples
Genome-wide association study (GWAS) summary statistics were obtained for 7 major psychiatric trait conditions in European ancestry: anxiety,38 neuroticism,39 MDD,40 ADHD,41 autism spectrum disorder (ASD),42 schizophrenia43 and bipolar II or III.44 Adequately powered summary statistics for diverse ancestries were available for MDD via 23andMe Inc from the Psychiatric Genetics Consortium in African, American Admixed (Hispanic), East Asian, and European.45,46 Sample size details for discovery cohorts are in eTables 6 and 7 in Supplement 1.
Multivariate Genomic Structural Equation Modeling
We used Genomic Structural Equation Modeling (GenomicSEM) to combine genetic correlations and SNV heritability across GWAS of complex traits using structural equation methods.24 We used GenomicSEM to conduct multivariate modeling for the 7 genetic traits in European ancestry. In the ABCD cohort, Europeans were identified using k-means clustering following the same approach used previously.47 The first 2 functions munge the summary statistics and perform linkage-disequilibrium score regression (LDSC) using the HapMap3 (Broad Institute) reference file for allele alignment. We estimated the effective sample size for cohorts where the SNV-specific sum was unavailable.
We initially constructed the common factor model as our baseline. In this model, a single overarching latent factor loads onto all indicators (traits) and explains the shared covariance among indicators. Next, we performed an exploratory factor analysis of traits grouped into 3 hypothesized trait parcels: mood, psychotic, and neurodevelopmental. We conducted confirmatory factor analyses and compared cross-model fit parameters for the following model structures: common, correlated, hierarchical, and bifactor. Multitrait summary statistics were generated for the latent genetic factors (p-factor or higher-order factors) for comparison using the 1000 genomes phase 3 reference file for SNV variance, information score greater than 0.8, and minor allele frequency greater than 0.01. Lastly, the multivariate GWAS function combined summary statistics, LDSC output, and the relevant structural equation model structure to retrieve the SNV association with the latent factors in each model. Further description of the factor models is discussed in eAppendix 7 in Supplement 1.
PRSs
Full quality control information for the ALSPAC and ABCD studies has been described elsewhere21,47 but can also be found in eAppendices 4 and 5 in Supplement 1, respectively. In the ABCD study, we calculated the top 10 genetic principal components (PCs) with the 1000 Genomes reference panel.48 We trained a random forest on the reference superpopulations using the first 6 PCs to predict the genetic clusters into African, American Admixed (Hispanic), and East Asian ancestries (eFigure 1 in Supplement 1).
PRS were computed with PRSice-2, version 2.1.11 (Choi and O’Reilly)49 using clumping and thresholding (clump-kb 250kb, clump-r2 0.1, clump-p 1.0). We generated PRS for P value thresholds 5 × 10⁻⁸, 1 × 10⁻⁶, 1 × 10⁻⁴, 0.001, 0.01, 0.05, 0.1, 0.2, 0.5, and 1. The best predictive P value threshold for each PRS was chosen across the phenotype at all time points. Thresholds and SNV counts are in eTables 8 and 9 in Supplement 1.
Trajectory Modeling
We used growth mixture modeling (GMM) to identify subgroups of individuals with different developmental trajectories or classes. GMM is a method for class enumeration that allows for individual variation within class. Classes are iteratively added to the model, assessing fit at each iteration to determine the best model. GMM was performed in MPlus, version 8.0 (Muthén & Muthén),50 which uses maximum-likelihood estimation for parameters. Growth models consisted of intercept, slope, and quadratic latent factors. We included individuals with at least 1 depression measure, to maximize available sample size, as these individuals can still contribute to the associations between trajectory groups and the varying PRS.15 Missing data are handled using full-information maximum-likelihood (FIML) estimation. Model fit was assessed through a combination of fit criterion and likelihood ratio tests detailed in eAppendix 6 in Supplement 1.
Statistical Analyses
Multinomial logistic regression was performed to evaluate the classification of genetic risk scores with each trajectory in both cohorts (significance level of 2-sided P < .05). The stable low class was the reference level, and association was determined as the odds ratio (OR) of each class vs the reference with corresponding confidence intervals. Regression analyses were adjusted for sex and the top 6 ancestry principal components. Final associations for European ancestry were for each trajectory with PRSs for 7 univariate traits, 3 correlated factors (mood, psychotic, neurodevelopmental), and 2 latent factors (common, hierarchical). For African, East Asian, and Hispanic ancestries, MDD PRS association was tested with classes in the ABCD cohort.
To account for uncertainty in the classification of participants into trajectories, we ran the 3-step bias-adjusted model.51 We examined the impact of attrition by running trajectories for individuals with 50% or more depression measures. We tested trajectory associations adjusting for all PRSs in a multivariable model to determine which contributed most strongly. To determine whether sample size or nosology are impacting the multitrait PRS associations, we performed a leave-one-out (LOO) common factor model for the most informative (MDD) and least informative (ASD) traits. To examine the association between genetic risk and attrition, we tested whether PRSs show consistency in association across questionnaires and whether PRSs were associated with attrition in both cohorts. Although sample sizes for independent ancestries in the ABCD cohort are underpowered, we derived non-European trajectories for completeness. We performed trajectory associations of self-report ethnicity for comparison with ancestry. Study data were analyzed January to July 2023.
Results
Sample Characteristics
A total sample size of 14 112 adolescents (at baseline: mean [SD] age, 10.5 [0.5] years; 6830 female [48%]; 7269 male [52%]) from both cohorts were included in this analysis. Participants were selected for availability of genotyped data and at least 1 occasion of depression (phenotype) score. In the ALSPAC cohort, this resulted in 6096 adolescents (3091 female [51%]; 2995 male [49%]) of European ancestry. In the ABCD cohort, there were a total of 8016 adolescents (3739 female [47%]; 4274 male [53%]) including 1715 African, 94 East Asian, 4135 European, and 2072 Hispanic ancestries. Self-reported ethnicity sample sizes for the 8016 individuals from the ABCD cohort are as follows: 85 Asian (1.1%), 1384 Black (17.3%), 1739 Hispanic (21.7%), 4261 White (53.2%), and 547 other (6.8%).
Cross-Cohort Validation of Depression Trajectories
GMM of depressive symptoms and evaluation of model fit parameters identified 4 trajectories in both cohorts (Figure 1). Subgroups show highly similar but not identical longitudinal patterns. Cross-cohort trajectory subgroups are stable low (ABCD cohort: 6182 [77.1%]; ALSPAC cohort: 4972 [81.6%]), increasing (ABCD cohort: 632 [7.9%]; ALSPAC cohort: 407 [6.7%]), decreasing (ABCD cohort: 761 [9.5%]; ALSPAC cohort: 351 [5.8%]), and adolescent persistent (ABCD cohort: 441 [5.5%]; ALSPAC cohort: 366 [6.0%]). Results for 1 to 5 class models, fit parameters, and class counts are in eTables 10 to 13 in Supplement 1. Phenotypic validations for several risk factors (including diagnosis of depression, poorer sleep, family history of depression, lower socioeconomic status, and childhood bullying) showed consistent and as expected associations across cohorts, thus validating our trajectories (eTable 14 in Supplement 1).
Figure 1. Replication of Depression Trajectories Across Adolescence.
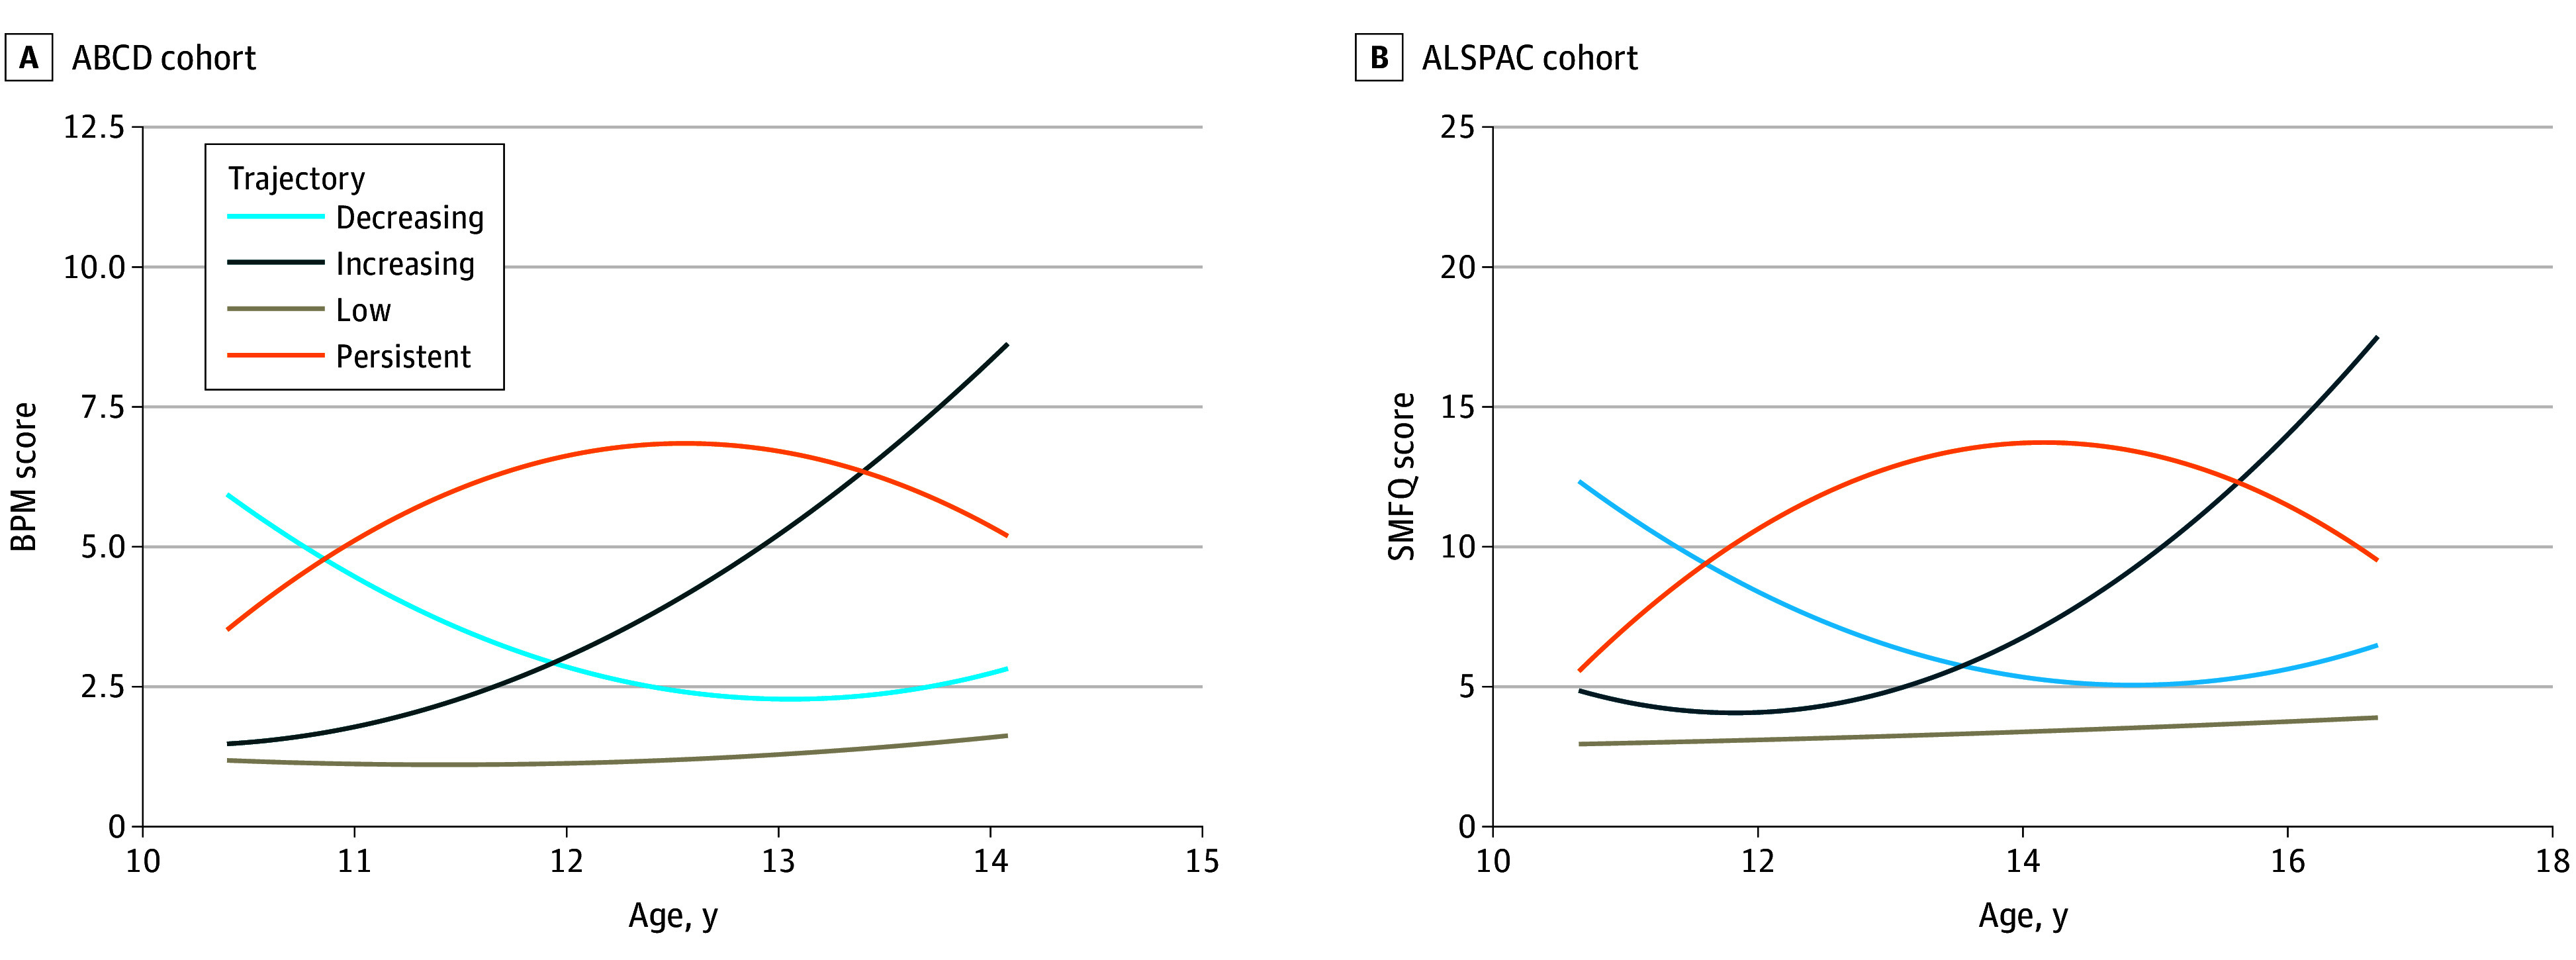
Quadratic growth curves of the Adolescent Brain and Cognitive Development (ABCD) cohort trajectories from 8 measures of Brief Problem Monitoring (BPM) youth report scale (A) and the Avon Longitudinal Study of Parents and Children (ALSPAC) cohort from 4 measures of the Short Mood and Feeling Questionnaire (SMFQ) (B). Plotted as estimated sample means.
Hierarchical Model for Genetic Psychopathology
Exploratory factor analysis of the 7 univariate traits revealed traits grouped into loadings on 3 independent factors (mood, psychotic, and neurodevelopmental conditions) as hypothesized (eFigure 2 and eTable 15 in Supplement 1). Confirmatory factor analysis with the multivariable LDSC output returned the hierarchical factor model as the best fit (χ2 = 86.4, Akaike information criterion [AIC] = 120.4, comparative fit index [CFI] = 0.99, standardized root mean square residual [SRMR] = 0.04), followed by the correlated factor model (χ2 = 307.2, AIC = 337.2, CFI = 0.96, SRMR = 0.06), and then the common factor model (χ2 = 1113.4, AIC = 1141.4, CFI = 0.83, SRMR = 0.12) (Figure 2). The bifactor model did not converge. Model fit indices, estimates, and factor loadings are in eTables 16 to 19 in Supplement 1. For brevity, we only discuss the hierarchical model PRS but present results for all multitrait models in Table, Figure 3, and eAppendix 7 and eTables 17 to 19 in Supplement 1.
Figure 2. Standardized Multitrait Factor Models.

Standardized estimate results of the common factor model (A), correlated factor model (B), and hierarchical factor model (C). Latent genetic factors are in circles, trait indicators are in rectangles. Straight arrows represent regression pathways. Curved arrows indicate residual (u = unexplained) variances. ADHD indicates attention-deficit/hyperactivity disorder; ANX, anxiety; ASD, autism spectrum disorder; BIP, bipolar disorder; F1, mood factor; F2, psychotic factor; F3, neurodevelopmental factor; MDD, major depressive disorder; NEU, neuroticism; SCZ, schizophrenia.
Table. Association of Univariate and Multivariate Polygenic Risk Scores (PRSs) With Depression Trajectories in European Ancestry.
| PRS | OR (95% CI) | P value thresholda | ||
|---|---|---|---|---|
| Persistent | Increasing | Decreasing | ||
| ABCD | ||||
| MDD | 1.40 (1.22-1.61) | 1.28 (1.14-1.44) | 1.34 (1.18-1.52) | .50 |
| NEU | 1.33 (1.16-1.52) | 1.09 (0.97-1.22) | 1.13 (1.00-1.28) | .20 |
| ANX | 1.22 (1.06-1.40) | 1.15 (1.02-1.29) | 1.09 (0.96-1.23) | .05 |
| SCZ | 1.19 (1.04-1.37) | 1.12 (0.99-1.26) | 1.04 (0.92-1.18) | .50 |
| BIP | 1.07 (0.93-1.23) | 1.17 (1.04-1.31) | 1.13 (0.99-1.28) | .0001 |
| ADHD | 1.24 (1.08-1.43) | 0.97 (0.86-1.08) | 1.15 (1.01-1.30) | .20 |
| ASD | 1.16 (1.02-1.33) | 1.03 (0.92-1.16) | 1.08 (0.96-1.22) | .001 |
| MOODb | 1.35 (1.55-1.17) | 1.24 (1.40-1.12) | 1.22 (1.38-1.08) | .10 |
| PSYCHOTICb | 1.19 (1.37-1.04) | 1.17 (1.31-1.04) | 1.07 (1.21-0.94) | .05 |
| NEURODEVb | 1.25 (1.43-1.09) | 0.90 (1.01-0.80) | 1.22 (1.38-1.08) | .10 |
| COMMON | 1.42 (1.23-1.63) | 1.22 (1.09-1.37) | 1.24 (1.09-1.40) | .20 |
| HIERARCHICAL | 1.46 (1.26-1.68) | 1.27 (1.13-1.43) | 1.23 (1.09-1.40) | .05 |
| ALSPAC | ||||
| MDD | 1.25 (1.12-1.39) | 1.12 (1.01-1.24) | 1.23 (1.10-1.37) | .50 |
| NEU | 1.27 (1.14-1.41) | 1.17 (1.05-1.30) | 1.25 (1.12-1.39) | .05 |
| ANX | 1.18 (1.06-1.31) | 1.00 (0.90-1.10) | 1.16 (1.04-1.29) | .10 |
| SCZ | 1.10 (0.98-1.22) | 0.99 (0.90-1.10) | 1.02 (0.91-1.14) | .0001 |
| BIP | 1.20 (1.08-1.34) | 0.98 (0.88-1.08) | 1.05 (0.95-1.17) | .50 |
| ADHD | 1.18 (1.06-1.32) | 1.07 (0.97-1.19) | 1.34 (1.20-1.49) | 1 |
| ASD | 1.17 (1.05-1.30) | 1.16 (1.05-1.29) | 1.24 (1.12-1.39) | 1 |
| MOODb | 1.27 (1.42-1.14) | 1.15 (1.27-1.03) | 1.30 (1.45-1.17) | .50 |
| PSYCHOTICb | 1.17 (1.30-1.05) | 1.03 (1.15-0.93) | 1.02 (1.14-0.92) | .05 |
| NEURODEVb | 1.29 (1.44-1.16) | 1.10 (1.22-0.99) | 1.32 (1.47-1.18) | .05 |
| COMMON | 1.33 (1.19-1.48) | 1.16 (1.04-1.28) | 1.31 (1.17-1.46) | .50 |
| HIERARCHICAL | 1.34 (1.20-1.49) | 1.16 (1.04-1.28) | 1.32 (1.18-1.47) | .50 |
Abbreviations: ABCD, Adolescent Brain and Cognitive Development; ADHD indicates attention-deficit/hyperactivity disorder; ALSPAC, Avon Longitudinal Study of Parents and Children; ANX, anxiety; ASD, autism spectrum disorder; BIP, bipolar disorder; MDD, major depressive disorder; NEU, neuroticism; NEURODEV, neurodevelopmental; OR, odds ratio; SCZ, schizophrenia.
P value of the PRS threshold explaining the most phenotypic variance.
MOOD, PSYCHOTIC, and NEURODEV correspond to the intermediate grouping factors in the correlated factor model.
Figure 3. Polygenic Risk Score Associations With Depression Trajectories.

Adolescent Brain and Cognitive Development (ABCD) European ancestry univariate and multivariate p-factor association (A). Avon Longitudinal Study of Parents and Children (ALSPAC) European ancestry univariate and multivariate P factor association (B). Error bars represent odds ratios (ORs) of each trajectory compared with the low (reference) trajectory with 95% CIs. ADHD indicates attention-deficit/hyperactivity disorder; ANX, anxiety; ASD, autism spectrum disorder; BIP, bipolar disorder; MDD, major depressive disorder; NEU, neuroticism; SCZ, schizophrenia.
Univariate PRS Associations With Depression Trajectories
The adolescent persistent symptom trajectory was associated with PRSs for ADHD, ASD, anxiety, neuroticism, and MDD in both cohorts (ABCD cohort: ADHD, OR, 1.24; 95% CI, 1.08-1.43; ASD, OR, 1.16; 95% CI, 1.02-1.33; ANX, OR, 1.22; 95% CI, 1.06-1.40; NEU, OR, 1.33; 95% CI, 1.16-1.52; MDD, OR, 1.40; 95% CI, 1.22-1.61; ALSPAC cohort: ADHD, OR, 1.18; 95% CI, 1.06-1.32; ASD, OR, 1.17; 95% CI, 1.05-1.30; ANX, OR, 1.18; 95% CI, 1.06-1.31; NEU, OR, 1.27; 95% CI, 1.14-1.41; MDD, OR, 1.25; 95% CI, 1.12-1.39). Schizophrenia was associated with persistent patterns in the ABCD cohort (OR, 1.19; 95% CI, 1.04-1.37) and bipolar disorder II or III with persistent patterns in the ALSPAC cohort (OR, 1.20; 95% CI, 1.08-1.34). The increasing symptom trajectory was associated with PRSs for bipolar disorder II or III, anxiety, and MDD in the ABCD cohort (BIP, OR, 1.17; 95% CI, 1.04-1.31; ANX, OR, 1.15; 95% CI, 1.02-1.29; MDD, OR, 1.28; 95% CI, 1.14-1.44) and for ASD, neuroticism, and MDD in the ALSPAC cohort (ASD, OR, 1.16; 95% CI, 1.05-1.29; NEU, OR, 1.17; 95% CI, 1.05-1.30; MDD, OR, 1.12; 95% CI, 1.01-1.24). The decreasing symptom trajectory was associated with PRS for MDD, neuroticism, and ADHD in the ABCD cohort (MDD, OR, 1.34; 95% CI, 1.18-1.52; NEU, OR, 1.13; 95% CI, 1.00-1.28; ADHD, OR, 1.15; 95% CI, 1.01-1.30) and for ASD, ADHD, neuroticism, anxiety, and MDD in the ALSPAC cohort (ASD, OR, 1.24; 95% CI, 1.12-1.39; ADHD, OR, 1.34; 95% CI, 1.20-1.49; NEU, OR, 1.25; 95% CI, 1.12-1.39; ANX, OR, 1.16; 95% CI, 1.04, 1.29; MDD, OR, 1.23; 95% CI, 1.10-1.37).
No consistent associations were found between MDD PRS for non-European ancestries and depression trajectories in the ABCD cohort (Figure 4 and eTable 20 in Supplement 1).
Figure 4. Multiancestry Polygenic Risk Score (PRS) Associations With Depression Trajectories.

The Adolescent Brain and Cognitive Development multiancestry major depressive disorder PRS associations for African, East Asian, European, and Hispanic ancestries using 23andMe summary statistics. Error bars represent odds ratios (ORs) of each trajectory compared with the low (reference) trajectory with 95% CIs.
Multivariate PRS Associations With Depression Trajectories
Hierarchical model multitrait PRS was strongly associated with all trajectories in both cohorts (Figure 3). The strongest association was with the adolescent persistent trajectories in both the ABCD (OR, 1.46; 95% CI, 1.26-1.68) and ALSPAC (OR, 1.34; 95% CI, 1.20-1.49) cohorts surpassing univariate PRS associations. In the ABCD cohort, multitrait hierarchical PRS had similar effect sizes for the increasing (OR, 1.27; 95% CI, 1.13-1.43) and decreasing (OR, 1.23; 95% CI, 1.09-1.40) trajectories. In the ALSPAC cohort, multitrait PRS was associated with the increasing trajectory (OR 1.16; 95% CI, 1.04-1.28) but more strongly with decreasing trajectory (OR, 1.32; 95% CI, 1.18-1.47).
Sensitivity Analyses
The 3-step bias-adjusted models showed consistent results with reported trajectories (eTable 21 in Supplement 1). In the majority of samples, trajectories were consistent with the 4-class solution for individuals with 50% or more depression measures (eTables 22-25 in Supplement 1). As expected, results attenuated in the adjusted multivariable model, likely due to polygenicity, multicollinearity and opposite direction effects (eTable 26 in Supplement 1). Of note, MDD and neuroticism PRSs were consistently associated with adverse trajectories, but there was also some evidence in the ALSPAC cohort that ADHD and ASD PRSs were associated with the decreasing trajectory. The LOO common factor model showed no divergence from the full model associations (eFigure 3 in Supplement 1). PRS association with depression score were consistent across time points (eFigures 4-5 in Supplement 1). There was some evidence that PRS were associated with questionnaire completion; however, this varied substantially across PRSs (eFigures 6-7 in Supplement 1). Trajectories differed across non-European ancestries; however, we caution interpretation of trajectory results given limited sample size, low convergence, and class counts (eFigure 8 and eTables 27-30 in Supplement 1). Results for self-reported ethnicity associations with MDD PRS in ABCD are in eAppendix 8 and eTable 31 in Supplement 1.
Discussion
For the first time, we explored how the shared genetic architecture of psychiatric disorders underlies longitudinal patterns of depression across adolescence. In a cross-cohort replication of trajectories, our results suggest that multitrait genetic risk exceeded the association of univariate risk with a more severe adolescent persistent trajectory across psychiatric traits and cohorts. Intermediate patterns of increasing and decreasing symptoms exhibited a less pronounced and consistent association with psychiatric genetic risk, possibly suggesting a stronger influence of external environmental factors and cohort differences, as suggested in previous work.15 We highlighted the lack of psychiatric genetic data for non-European ancestries, which is imperative to prevent health inequalities for prediction modeling in depression and treatment stratification.
Multitrait Genetics of Longitudinal Depression Patterns
In line with previous work using GenomicSEM, we found a parceled structure of genetic psychopathology into factor domains of mood or internalizing conditions, psychotic conditions, and neurodevelopmental conditions52,53,54 with a hierarchical model demonstrating the strongest p-factor loading.25
The multivariate genetic p-factor showed strong associations across all trajectories, with the adolescent persistent pattern demonstrating the strongest effect sizes. The persistent pattern was also associated with univariate genetic risk for multiple psychiatric conditions in a homogenous fashion. Genetic factors predominantly contribute to the longitudinal stability of depression and anxiety symptoms from childhood to adulthood.13 Our findings suggest that a high genetic predisposition to any psychopathology could underpin the more stable persistent group.
Intermediate trajectories (increasing and decreasing) were also associated with the multitrait p-factor, although this was less consistently than for the persistent trajectory. The ABCD cohort showed comparable p-factor associations between increasing and decreasing trajectories, whereas associations with the decreasing trajectory in the ALSPAC cohort were considerably higher than for increasing. Of note is the strong association of neurodevelopmental PRS with the decreasing trajectories in both cohorts and the multivariable model associations of ADHD and ASD PRSs in the ALSPAC cohort only (eTable 26 in Supplement 1). These findings may reflect the early onset of depression for individuals with neurodevelopmental conditions who subsequently recover as neurodivergence is managed or adapted to, particularly in ADHD.
The p-factor involves pleiotropic genes contributing to an overall psychiatric risk26,55,56,57 and a latent intercept factor that captures baseline stability has been shown as significantly more heritable than depression at any other time point.58 Our observations indicate that “p” may be more important at younger ages of depression onset related to comorbidity of neurodevelopmental traits.16,59 In risk-prediction models, multitrait genetic information may be useful for supporting the identification of longitudinal risk groups for early intervention in combination with other environmental information. This is supported by transdiagnostic clinical frameworks that exploit shared cross-disorder treatment responses in unified protocols.26,60
Intermediate trajectories exhibit less pronounced associations across univariate polygenic risk. Environmental factors are more likely to inform variable patterns of depressive symptoms,11 with genetic heritability shown to decrease with age.13 In the increasing trajectory, environmental risk factors such as low socioeconomic status61 may be escalating depressive symptoms toward adulthood. Protective environmental factors could drive a reduction of depressive symptoms over time in the decreasing group. Machine learning methods that combine biological and environmental factors could further characterize the relative contributions that assign an individual to a trajectory.
Achieving Equity in Genetic Association Modeling Through Ancestrally Diverse Data
We found weaker associations for MDD polygenic risk association with longitudinal depression in non-European ancestries, which was not unexpected given the smaller sample sizes. Epidemiological studies show that Asian, Black, and Hispanic adolescents have increased depression symptoms over time compared with White adolescents, impacted by socioeconomic status and stress.62,63 Racial discrimination is thought to increase depression risk through stress-induced cortisol in the hypothalamic-pituitary-adrenal axis64 and leads to disproportionate suffering in ethnic minorities. Self-reported associations tended to support this (eTable 31 in Supplement 1).
Despite the impact of environmental factors, such as discrimination, on the elevated risk of depression in minority groups, we anticipated a genetic risk profile that aligns closely with that of European populations. Our findings highlight a cavity in the acquisition of ancestrally representative genetic data, particularly in genome-wide association studies. Researchers must interpret carefully when generalizing findings from European-only ancestries. This is crucial to address when embedding genetic risk-prediction models to prevent the exacerbation of health inequalities. Efforts to sequence and analyze ancestrally diverse genetic data are imperative to design universal models. Importantly, well-phenotyped data from longitudinal cohorts across the globe, particularly non-Western countries, will help improve generalizability of research relating to mental health trajectories.
Limitations
This study demonstrates robustness through cross-validation of 2 large adolescent cohorts with repeated depression measures and genetic data. However, ages did not precisely align between cohorts; the ALSPAC cohort had fewer measures over more years. ALSPAC participants were recruited up to 15 years before the ABCD cohort, implying different generational experiences. Despite sources of heterogeneity across the cohorts—depression measure, measure occasions, generation, and age range—we found consistent evidence for genetic underpinnings across both studies suggesting strong evidence of replicable findings. Intrinsic to longitudinal studies, both cohorts experienced participant attrition (eTable 5 in Supplement 1). While using FIML in trajectory modeling, this assumes random data missing, which may not hold true. However, we found that trajectories are consistent when restricting to individuals with 50% or more depression measures (eTables 22-25 in Supplement 1). We reiterate the low sample sizes for non-European ancestries in the ABCD cohort. For example, only 94 East Asian individuals had genetic and depression data. The availability of more diverse longitudinal cohorts with accompanying genetic data should hope to overcome this in future work.
Conclusions
This cohort study contributes novel evidence highlighting the value of leveraging genetic information across multiple psychopathological traits that correlate with major depression to understand the biological underpinning of depression in a longitudinal context. This is a step toward teasing apart the challenge of genetic-environmental interplay in longitudinal depression etiology for early intervention. To enhance the comprehensiveness of these findings, it is imperative that we include genetic and longitudinal phenotypic data from diverse ancestries and geographies.
eAppendix 1. ABCD and the Brief Problem Monitoring (Youth) Scale
eTable 1. ABCD Depression Scores and Cohort Descriptives for 8 Occasions
eTable 2. Brief Problem Monitoring (Youth)
eAppendix 2. ALSPAC and the Short Mood and Feelings Questionnaire
eTable 3. ALSPAC Depression Scores and Cohort Descriptives for 4 Occasions
eTable 4. Short Mood and Feelings Questionnaire
eTable 5. Count of Individuals With Minimum N Completed Time Points
eAppendix 3. GWAS Discovery Cohort Samples
eTable 6. European Discovery Cohort Counts in Main Analysis
eTable 7. 23andMe Transancestry Discovery Cohort Counts
eAppendix 4. ABCD Genotyping and Quality Control
eFigure 1. First 2 Principal Components of Ancestries in ABCD Projected Onto the 1-kg Superpopulations
eAppendix 5. ALSPAC Genotyping and Quality Control
eTable 8. P-value Thresholds That Explain the Most Variance at Each Time Point (Phenotype) in ABCD
eTable 9. P-value Thresholds That Explain the Most Variance at Each Time Point (Phenotype) in ALSPAC
eAppendix 6. Growth Mixture Modeling (GMM) – Model Fit Results
eTable 10. GMM Results for 1-5 Classes in ALSPAC for all Individuals With Depression Data
eTable 11. GMM Results for 1-5 Classes in ALSPAC for all Individuals With Genetic and Depression Data
eTable 12. GMM Results for 1-5 Classes in ABCD for all Individuals With Depression Data
eTable 13. GMM Results for 1-5 Classes in ABCD for all Individuals With Genetic and Depression Data
eTable 14. Phenotypic Validation of Trajectories
eFigure 2. Genetic Correlation Matrix (LDSC) Between all 7 Summary Statistics Used in the Multitrait Model
eTable 15. Results of the Exploratory Factor Analysis and Factor Loadings
eAppendix 7. Models
eTable 16. Model Fit Parameters of 3 Multivariate Genetic Structural Equation Models
eTable 17. Common Factor Model Fit Estimates
eTable 18. Correlated Factor Model Fit Estimates
eTable 19. Hierarchical Factor Model Fit Estimates
eTable 20. Association of Univariate MDD Polygenic Risk Scores With Depression Trajectories
eTable 21. PRS Associations With Classes From the Bias-Adjusted 3-Step Model
eTable 22. GMM Results for 1-5 Classes in ABCD Individuals With Phenotypic Data 4+ (≥50%) Time Points
eTable 23. GMM Results for 1-5 Classes in ALSPAC Individuals With Phenotypic Data 2+ (≥50%) Time Points
eTable 24. GMM Results for 1-5 Classes in ABCD Individuals With Phenotypic and Genetic Data 4+ Time Points
eTable 25. GMM Results for 1-5 Classes in ALSPAC Individuals With Phenotypic and Genetic Data 2+ Time Points
eTable 26. Multivariable PRS Association Results (All Univariate Traits in the Same Regression Model)
eFigure 3. Common Factor PRS Associations for EUR Ancestry in ABCD and ALSPAC Omitting MDD or ASD
eFigure 4. PRS Association With BPM Questionnaire Occasion in ABCD
eFigure 5. PRS Association With SMFQ Questionnaire Occasion in ALSPAC
eFigure 6. PRS Association With BPM Questionnaire Attrition in ABCD
eFigure 7. PRS Association With SMFQ Questionnaire Attrition in ALSPAC
eTable 27. GMM Results for 1-5 Classes in ABCD for EUR Only
eTable 28. GMM Results for 1-5 Classes in ABCD for AMR Only
eTable 29. GMM Results for 1-5 Classes in ABCD for AFR Only
eTable 30. GMM Results for 1-5 Classes in ABCD for EAS Only
eFigure 8. GMM-Derived Trajectories (Estimated Sample) for Independent Genetic Ancestries in ABCD
eAppendix 8. Self-Report Ethnicity With Multiancestry PRS Associations
eTable 31. Trajectory Associations by Self-Report Ethnicity vs Nondepressed (Low) Class
eReferences
Data Sharing Statement.
References
- 1.Dahl RE, Allen NB, Wilbrecht L, Suleiman AB. Importance of investing in adolescence from a developmental science perspective. Nature. 2018;554(7693):441-450. doi: 10.1038/nature25770 [DOI] [PubMed] [Google Scholar]
- 2.Malhi GS, Mann JJ. Depression. Lancet. 2018;392(10161):2299-2312. doi: 10.1016/S0140-6736(18)31948-2 [DOI] [PubMed] [Google Scholar]
- 3.Solmi M, Radua J, Olivola M, et al. Age at onset of mental disorders worldwide: large-scale meta-analysis of 192 epidemiological studies. Mol Psychiatry. 2022;27(1):281-295. doi: 10.1038/s41380-021-01161-7 [DOI] [PMC free article] [PubMed] [Google Scholar]
- 4.Andersen SL, Teicher MH. Stress, sensitive periods, and maturational events in adolescent depression. Trends Neurosci. 2008;31(4):183-191. doi: 10.1016/j.tins.2008.01.004 [DOI] [PubMed] [Google Scholar]
- 5.Hankin BL, Abramson LY, Moffitt TE, Silva PA, McGee R, Angell KE. Development of depression from preadolescence to young adulthood: emerging gender differences in a 10-year longitudinal study. J Abnorm Psychol. 1998;107(1):128-140. doi: 10.1037/0021-843X.107.1.128 [DOI] [PubMed] [Google Scholar]
- 6.Kwong ASF, Manley D, Timpson NJ, et al. Identifying critical points of trajectories of depressive symptoms from childhood to young adulthood. J Youth Adolesc. 2019;48(4):815-827. doi: 10.1007/s10964-018-0976-5 [DOI] [PMC free article] [PubMed] [Google Scholar]
- 7.Nguyen TD, Harder A, Xiong Y, et al. Genetic heterogeneity and subtypes of major depression. Mol Psychiatry. 2022;27(3):1667-1675. doi: 10.1038/s41380-021-01413-6 [DOI] [PMC free article] [PubMed] [Google Scholar]
- 8.Thapar A, Eyre O, Patel V, Brent D. Depression in young people. Lancet. 2022;400(10352):617-631. doi: 10.1016/S0140-6736(22)01012-1 [DOI] [PubMed] [Google Scholar]
- 9.Rice F, Harold G, Thapar A. The genetic aetiology of childhood depression: a review. J Child Psychol Psychiatry. 2002;43(1):65-79. doi: 10.1111/1469-7610.00004 [DOI] [PubMed] [Google Scholar]
- 10.Musliner KL, Munk-Olsen T, Eaton WW, Zandi PP. Heterogeneity in long-term trajectories of depressive symptoms: patterns, predictors, and outcomes. J Affect Disord. 2016;192:199-211. doi: 10.1016/j.jad.2015.12.030 [DOI] [PMC free article] [PubMed] [Google Scholar]
- 11.Schubert KO, Clark SR, Van LK, Collinson JL, Baune BT. Depressive symptom trajectories in late adolescence and early adulthood: a systematic review. Aust N Z J Psychiatry. 2017;51(5):477-499. doi: 10.1177/0004867417700274 [DOI] [PubMed] [Google Scholar]
- 12.Shore L, Toumbourou JW, Lewis AJ, Kremer P. Review: longitudinal trajectories of child and adolescent depressive symptoms and their predictors—a systematic review and meta-analysis. Child Adolesc Ment Health. 2018;23(2):107-120. doi: 10.1111/camh.12220 [DOI] [PubMed] [Google Scholar]
- 13.Nivard MG, Dolan CV, Kendler KS, et al. Stability in symptoms of anxiety and depression as a function of genotype and environment: a longitudinal twin study from ages 3 to 63 years. Psychol Med. 2015;45(5):1039-1049. doi: 10.1017/S003329171400213X [DOI] [PubMed] [Google Scholar]
- 14.Olino TM, Klein DN, Lewinsohn PM, Rohde P, Seeley JR. Latent trajectory classes of depressive and anxiety disorders from adolescence to adulthood: descriptions of classes and associations with risk factors. Compr Psychiatry. 2010;51(3):224-235. doi: 10.1016/j.comppsych.2009.07.002 [DOI] [PMC free article] [PubMed] [Google Scholar]
- 15.Kwong ASF, López-López JA, Hammerton G, et al. Genetic and Environmental risk factors associated with trajectories of depression symptoms from adolescence to young adulthood. JAMA Netw Open. 2019;2(6):e196587. doi: 10.1001/jamanetworkopen.2019.6587 [DOI] [PMC free article] [PubMed] [Google Scholar]
- 16.Rice F, Riglin L, Thapar AK, et al. Characterizing developmental trajectories and the role of neuropsychiatric genetic risk variants in early-onset depression. JAMA Psychiatry. 2019;76(3):306-313. doi: 10.1001/jamapsychiatry.2018.3338 [DOI] [PMC free article] [PubMed] [Google Scholar]
- 17.Kendler KS, Ohlsson H, Lichtenstein P, Sundquist J, Sundquist K. The genetic epidemiology of treated major depression in Sweden. Am J Psychiatry. 2018;175(11):1137-1144. doi: 10.1176/appi.ajp.2018.17111251 [DOI] [PubMed] [Google Scholar]
- 18.Sullivan PF, Neale MC, Kendler KS. Genetic epidemiology of major depression: review and meta-analysis. Am J Psychiatry. 2000;157(10):1552-1562. doi: 10.1176/appi.ajp.157.10.1552 [DOI] [PubMed] [Google Scholar]
- 19.Wray NR, Ripke S, Mattheisen M, et al. ; eQTLGen; 23andMe; Major Depressive Disorder Working Group of the Psychiatric Genomics Consortium . Genome-wide association analyses identify 44 risk variants and refine the genetic architecture of major depression. Nat Genet. 2018;50(5):668-681. doi: 10.1038/s41588-018-0090-3 [DOI] [PMC free article] [PubMed] [Google Scholar]
- 20.Halldorsdottir T, Piechaczek C, Soares de Matos AP, et al. Polygenic risk: predicting depression outcomes in clinical and epidemiological cohorts of youths. Am J Psychiatry. 2019;176(8):615-625. doi: 10.1176/appi.ajp.2019.18091014 [DOI] [PubMed] [Google Scholar]
- 21.Kwong ASF, Morris TT, Pearson RM, et al. Polygenic risk for depression, anxiety, and neuroticism are associated with the severity and rate of change in depressive symptoms across adolescence. J Child Psychol Psychiatry. 2021;62(12):1462-1474. doi: 10.1111/jcpp.13422 [DOI] [PubMed] [Google Scholar]
- 22.Nivard MG, Gage SH, Hottenga JJ, et al. Genetic overlap between schizophrenia and developmental psychopathology: longitudinal and multivariate polygenic risk prediction of common psychiatric traits during development. Schizophr Bull. 2017;43(6):1197-1207. doi: 10.1093/schbul/sbx031 [DOI] [PMC free article] [PubMed] [Google Scholar]
- 23.Anttila V, Bulik-Sullivan B, Finucane HK, et al. ; Brainstorm Consortium . Analysis of shared heritability in common disorders of the brain. Science. 2018;360(6395):eaap8757. doi: 10.1126/science.aap8757 [DOI] [PMC free article] [PubMed] [Google Scholar]
- 24.Grotzinger AD, Rhemtulla M, de Vlaming R, et al. Genomic structural equation modelling provides insights into the multivariate genetic architecture of complex traits. Nat Hum Behav. 2019;3(5):513-525. doi: 10.1038/s41562-019-0566-x [DOI] [PMC free article] [PubMed] [Google Scholar]
- 25.Grotzinger AD, Mallard TT, Akingbuwa WA, et al. ; iPSYCH; Tourette Syndrome and Obsessive Compulsive Disorder Working Group of the Psychiatric Genetics Consortium; Bipolar Disorder Working Group of the Psychiatric Genetics Consortium; Major Depressive Disorder Working Group of the Psychiatric Genetics Consortium; Schizophrenia Working Group of the Psychiatric Genetics Consortium . Genetic architecture of 11 major psychiatric disorders at biobehavioral, functional genomic and molecular genetic levels of analysis. Nat Genet. 2022;54(5):548-559. doi: 10.1038/s41588-022-01057-4 [DOI] [PMC free article] [PubMed] [Google Scholar]
- 26.Caspi A, Houts RM, Belsky DW, et al. The p factor: one general psychopathology factor in the structure of psychiatric disorders? Clin Psychol Sci. 2014;2(2):119-137. doi: 10.1177/2167702613497473 [DOI] [PMC free article] [PubMed] [Google Scholar]
- 27.Allegrini AG, Cheesman R, Rimfeld K, et al. The p factor: genetic analyses support a general dimension of psychopathology in childhood and adolescence. J Child Psychol Psychiatry. 2020;61(1):30-39. doi: 10.1111/jcpp.13113 [DOI] [PMC free article] [PubMed] [Google Scholar]
- 28.Volkow ND, Koob GF, Croyle RT, et al. The conception of the ABCD study: from substance use to a broad NIH collaboration. Dev Cogn Neurosci. 2018;32:4-7. doi: 10.1016/j.dcn.2017.10.002 [DOI] [PMC free article] [PubMed] [Google Scholar]
- 29.NIMH Data Archive . ABCD data repository. Accessed January 20, 2023. https://nda.nih.gov/abcd/
- 30.Boyd A, Golding J, Macleod J, et al. Cohort profile: the ‘children of the 90s’—the index offspring of the Avon Longitudinal Study of Parents and Children. Int J Epidemiol. 2013;42(1):111-127. doi: 10.1093/ije/dys064 [DOI] [PMC free article] [PubMed] [Google Scholar]
- 31.Fraser A, Macdonald-Wallis C, Tilling K, et al. Cohort profile: the Avon Longitudinal Study of Parents and Children: ALSPAC mothers cohort. Int J Epidemiol. 2013;42(1):97-110. doi: 10.1093/ije/dys066 [DOI] [PMC free article] [PubMed] [Google Scholar]
- 32.Achenbach T, McConaughy S, Ivanova M, Rescorla L. Manual for the ASEBA Brief Problem Monitor (BPM). ASEBA; 2011. [Google Scholar]
- 33.Piper BJ, Gray HM, Raber J, Birkett MA. Reliability and validity of Brief Problem Monitor, an abbreviated form of the Child Behavior Checklist. Psychiatry Clin Neurosci. 2014;68(10):759-767. doi: 10.1111/pcn.12188 [DOI] [PMC free article] [PubMed] [Google Scholar]
- 34.Richter J. Preliminary evidence for good psychometric properties of the Norwegian version of the Brief Problem Monitor (BPM). Nord J Psychiatry. 2015;69(3):174-178. doi: 10.3109/08039488.2014.951070 [DOI] [PubMed] [Google Scholar]
- 35.Angold A, Costello EJ, Messer SC, Pickles A. Development of a short questionnaire for use in epidemiological studies of depression in children and adolescents. Int J Methods Psychiatr Res. 1995;5(4):237-249. [Google Scholar]
- 36.Thapar A, McGuffin P. Validity of the shortened Mood and Feelings Questionnaire in a community sample of children and adolescents: a preliminary research note. Psychiatry Res. 1998;81(2):259-268. doi: 10.1016/S0165-1781(98)00073-0 [DOI] [PubMed] [Google Scholar]
- 37.Turner N, Joinson C, Peters TJ, Wiles N, Lewis G. Validity of the Short Mood and Feelings Questionnaire in late adolescence. Psychol Assess. 2014;26(3):752-762. doi: 10.1037/a0036572 [DOI] [PubMed] [Google Scholar]
- 38.Purves KL, Coleman JRI, Meier SM, et al. A major role for common genetic variation in anxiety disorders. Mol Psychiatry. 2020;25(12):3292-3303. doi: 10.1038/s41380-019-0559-1 [DOI] [PMC free article] [PubMed] [Google Scholar]
- 39.Luciano M, Hagenaars SP, Davies G, et al. Association analysis in over 329 000 individuals identifies 116 independent variants influencing neuroticism. Nat Genet. 2018;50(1):6-11. doi: 10.1038/s41588-017-0013-8 [DOI] [PMC free article] [PubMed] [Google Scholar]
- 40.Als TD, Kurki MI, Grove J, et al. Depression pathophysiology, risk prediction of recurrence, and comorbid psychiatric disorders using genome-wide analyses. Nat Med. 2023;29(7):1832-1844. doi: 10.1038/s41591-023-02352-1 [DOI] [PMC free article] [PubMed] [Google Scholar]
- 41.Demontis D, Walters GB, Athanasiadis G, et al. ; ADHD Working Group of the Psychiatric Genomics Consortium; iPSYCH-Broad Consortium . Genome-wide analyses of ADHD identify 27 risk loci, refine the genetic architecture, and implicate several cognitive domains. Nat Genet. 2023;55(2):198-208. doi: 10.1038/s41588-022-01285-8 [DOI] [PMC free article] [PubMed] [Google Scholar]
- 42.Grove J, Ripke S, Als TD, et al. ; Autism Spectrum Disorder Working Group of the Psychiatric Genomics Consortium; BUPGEN; Major Depressive Disorder Working Group of the Psychiatric Genomics Consortium; 23andMe Research Team . Identification of common genetic risk variants for autism spectrum disorder. Nat Genet. 2019;51(3):431-444. doi: 10.1038/s41588-019-0344-8 [DOI] [PMC free article] [PubMed] [Google Scholar]
- 43.Trubetskoy V, Pardiñas AF, Qi T, et al. ; Indonesia Schizophrenia Consortium; PsychENCODE; Psychosis Endophenotypes International Consortium; SynGO Consortium; Schizophrenia Working Group of the Psychiatric Genomics Consortium . Mapping genomic loci implicates genes and synaptic biology in schizophrenia. Nature. 2022;604(7906):502-508. doi: 10.1038/s41586-022-04434-5 [DOI] [PMC free article] [PubMed] [Google Scholar]
- 44.Mullins N, Forstner AJ, O’Connell KS, et al. ; HUNT All-In Psychiatry . Genome-wide association study of more than 40,000 bipolar disorder cases provides new insights into the underlying biology. Nat Genet. 2021;53(6):817-829. doi: 10.1038/s41588-021-00857-4 [DOI] [PMC free article] [PubMed] [Google Scholar]
- 45.23andMe Research Team . 23andMe Publication dataset access program. Accessed May 24, 2023. https://research.23andme.com/dataset-access/
- 46.Meng X, Navoly G, Giannakopoulou O, et al. Multiancestry genome-wide association study of major depression aids locus discovery, fine mapping, gene prioritization, and causal inference. Nat Genet. 2024;56(2):222-233. doi: 10.1038/s41588-023-01596-4 [DOI] [PMC free article] [PubMed] [Google Scholar]
- 47.Thng G, Shen X, Stolicyn A, et al. Comparing personalized brain-based and genetic risk scores for major depressive disorder in large population samples of adults and adolescents. Eur Psychiatry. 2022;65(1):e44. doi: 10.1192/j.eurpsy.2022.2301 [DOI] [PMC free article] [PubMed] [Google Scholar]
- 48.Fairley S, Lowy-Gallego E, Perry E, Flicek P. The International Genome Sample Resource (IGSR) collection of open human genomic variation resources. Nucleic Acids Res. 2020;48(D1):D941-D947. doi: 10.1093/nar/gkz836 [DOI] [PMC free article] [PubMed] [Google Scholar]
- 49.Choi SW, O’Reilly PF. PRSice-2: polygenic risk score software for biobank-scale data. Gigascience. 2019;8(7):giz082. doi: 10.1093/gigascience/giz082 [DOI] [PMC free article] [PubMed] [Google Scholar]
- 50.Muthén LK, Muthén BO. Mplus User’s Guide. 8th ed. Muthén & Muthén; 1998. [Google Scholar]
- 51.Heron J, Croudace TJ, Barker ED, Tilling K. A comparison of approaches for assessing covariate effects in latent class analysis. Longit Life Course Stud. 2015;6(4):420-434. doi: 10.14301/llcs.v6i4.322 [DOI] [Google Scholar]
- 52.Levey DF, Stein MB, Wendt FR, et al. ; 23andMe Research Team; Million Veteran Program . Biancestral depression GWAS in the Million Veteran Program and meta-analysis in >1.2 million individuals highlight new therapeutic directions. Nat Neurosci. 2021;24(7):954-963. doi: 10.1038/s41593-021-00860-2 [DOI] [PMC free article] [PubMed] [Google Scholar]
- 53.Schwaba T, Mallard TT, Maihofer AX, et al. Comparison of the multivariate genetic architecture of 8 major psychiatric disorders across sex. medRxiv. Preprint posted online June 5, 2023. doi: 10.1101/2023.05.25.23290545 [DOI]
- 54.Wu Y, Cao H, Baranova A, et al. Multitrait analysis for genome-wide association study of 5 psychiatric disorders. Transl Psychiatry. 2020;10(1):209. doi: 10.1038/s41398-020-00902-6 [DOI] [PMC free article] [PubMed] [Google Scholar]
- 55.Lahey BB, Applegate B, Hakes JK, Zald DH, Hariri AR, Rathouz PJ. Is there a general factor of prevalent psychopathology during adulthood? J Abnorm Psychol. 2012;121(4):971-977. doi: 10.1037/a0028355 [DOI] [PMC free article] [PubMed] [Google Scholar]
- 56.Pettersson E. Opportunities of measuring hierarchical models of psychopathology. JCPP Adv. 2023;3(4):e12187. doi: 10.1002/jcv2.12187 [DOI] [PMC free article] [PubMed] [Google Scholar]
- 57.Pettersson E, Larsson H, Lichtenstein P. Common psychiatric disorders share the same genetic origin: a multivariate sibling study of the Swedish population. Mol Psychiatry. 2016;21(5):717-721. doi: 10.1038/mp.2015.116 [DOI] [PubMed] [Google Scholar]
- 58.Lubke GH, Miller PJ, Verhulst B, et al. A powerful phenotype for gene-finding studies derived from trajectory analyses of symptoms of anxiety and depression between age 7 and 18. Am J Med Genet B Neuropsychiatr Genet. 2016;171(7):948-957. doi: 10.1002/ajmg.b.32375 [DOI] [PMC free article] [PubMed] [Google Scholar]
- 59.Jaffee SR, Moffitt TE, Caspi A, Fombonne E, Poulton R, Martin J. Differences in early childhood risk factors for juvenile-onset and adult-onset depression. Arch Gen Psychiatry. 2002;59(3):215-222. doi: 10.1001/archpsyc.59.3.215 [DOI] [PubMed] [Google Scholar]
- 60.Barlow DH, Allen LB, Choate ML. Toward a unified treatment for emotional disorders—republished article. Behav Ther. 2016;47(6):838-853. doi: 10.1016/j.beth.2016.11.005 [DOI] [PubMed] [Google Scholar]
- 61.Costello DM, Swendsen J, Rose JS, Dierker LC. Risk and protective factors associated with trajectories of depressed mood from adolescence to early adulthood. J Consult Clin Psychol. 2008;76(2):173-183. doi: 10.1037/0022-006X.76.2.173 [DOI] [PMC free article] [PubMed] [Google Scholar]
- 62.Adkins DE, Wang V, Elder GH Jr. Structure and stress: trajectories of depressive symptoms across adolescence and young adulthood. Soc Forces. 2009;88(1):31-60. doi: 10.1353/sof.0.0238 [DOI] [PMC free article] [PubMed] [Google Scholar]
- 63.Brown JS, Meadows SO, Elder GH Jr. Race-ethnic inequality and psychological distress: depressive symptoms from adolescence to young adulthood. Dev Psychol. 2007;43(6):1295-1311. doi: 10.1037/0012-1649.43.6.1295 [DOI] [PubMed] [Google Scholar]
- 64.Berger M, Sarnyai Z. “More than skin deep”: stress neurobiology and mental health consequences of racial discrimination. Stress. 2015;18(1):1-10. doi: 10.3109/10253890.2014.989204 [DOI] [PubMed] [Google Scholar]
Associated Data
This section collects any data citations, data availability statements, or supplementary materials included in this article.
Supplementary Materials
eAppendix 1. ABCD and the Brief Problem Monitoring (Youth) Scale
eTable 1. ABCD Depression Scores and Cohort Descriptives for 8 Occasions
eTable 2. Brief Problem Monitoring (Youth)
eAppendix 2. ALSPAC and the Short Mood and Feelings Questionnaire
eTable 3. ALSPAC Depression Scores and Cohort Descriptives for 4 Occasions
eTable 4. Short Mood and Feelings Questionnaire
eTable 5. Count of Individuals With Minimum N Completed Time Points
eAppendix 3. GWAS Discovery Cohort Samples
eTable 6. European Discovery Cohort Counts in Main Analysis
eTable 7. 23andMe Transancestry Discovery Cohort Counts
eAppendix 4. ABCD Genotyping and Quality Control
eFigure 1. First 2 Principal Components of Ancestries in ABCD Projected Onto the 1-kg Superpopulations
eAppendix 5. ALSPAC Genotyping and Quality Control
eTable 8. P-value Thresholds That Explain the Most Variance at Each Time Point (Phenotype) in ABCD
eTable 9. P-value Thresholds That Explain the Most Variance at Each Time Point (Phenotype) in ALSPAC
eAppendix 6. Growth Mixture Modeling (GMM) – Model Fit Results
eTable 10. GMM Results for 1-5 Classes in ALSPAC for all Individuals With Depression Data
eTable 11. GMM Results for 1-5 Classes in ALSPAC for all Individuals With Genetic and Depression Data
eTable 12. GMM Results for 1-5 Classes in ABCD for all Individuals With Depression Data
eTable 13. GMM Results for 1-5 Classes in ABCD for all Individuals With Genetic and Depression Data
eTable 14. Phenotypic Validation of Trajectories
eFigure 2. Genetic Correlation Matrix (LDSC) Between all 7 Summary Statistics Used in the Multitrait Model
eTable 15. Results of the Exploratory Factor Analysis and Factor Loadings
eAppendix 7. Models
eTable 16. Model Fit Parameters of 3 Multivariate Genetic Structural Equation Models
eTable 17. Common Factor Model Fit Estimates
eTable 18. Correlated Factor Model Fit Estimates
eTable 19. Hierarchical Factor Model Fit Estimates
eTable 20. Association of Univariate MDD Polygenic Risk Scores With Depression Trajectories
eTable 21. PRS Associations With Classes From the Bias-Adjusted 3-Step Model
eTable 22. GMM Results for 1-5 Classes in ABCD Individuals With Phenotypic Data 4+ (≥50%) Time Points
eTable 23. GMM Results for 1-5 Classes in ALSPAC Individuals With Phenotypic Data 2+ (≥50%) Time Points
eTable 24. GMM Results for 1-5 Classes in ABCD Individuals With Phenotypic and Genetic Data 4+ Time Points
eTable 25. GMM Results for 1-5 Classes in ALSPAC Individuals With Phenotypic and Genetic Data 2+ Time Points
eTable 26. Multivariable PRS Association Results (All Univariate Traits in the Same Regression Model)
eFigure 3. Common Factor PRS Associations for EUR Ancestry in ABCD and ALSPAC Omitting MDD or ASD
eFigure 4. PRS Association With BPM Questionnaire Occasion in ABCD
eFigure 5. PRS Association With SMFQ Questionnaire Occasion in ALSPAC
eFigure 6. PRS Association With BPM Questionnaire Attrition in ABCD
eFigure 7. PRS Association With SMFQ Questionnaire Attrition in ALSPAC
eTable 27. GMM Results for 1-5 Classes in ABCD for EUR Only
eTable 28. GMM Results for 1-5 Classes in ABCD for AMR Only
eTable 29. GMM Results for 1-5 Classes in ABCD for AFR Only
eTable 30. GMM Results for 1-5 Classes in ABCD for EAS Only
eFigure 8. GMM-Derived Trajectories (Estimated Sample) for Independent Genetic Ancestries in ABCD
eAppendix 8. Self-Report Ethnicity With Multiancestry PRS Associations
eTable 31. Trajectory Associations by Self-Report Ethnicity vs Nondepressed (Low) Class
eReferences
Data Sharing Statement.