

Abstract

The solubility of eplerenone (EP) in 13 pure solvents (acetonitrile, N,N-dimethylformamide (DMF), acetone, 2-butanone, 4-methyl-2-pentanone, ethyl formate, methyl acetate, ethyl acetate, propyl acetate, butyl acetate, methyl propionate, ethyl propionate, ethanol, and 1-propanol) was determined by the gravimetric method at atmospheric pressure and various temperatures (from 283.15 to 323.15 K). The results showed that the solubility of EP in the selected solvents was positively correlated with the thermodynamic temperature, and the order of solubility of EP at 298.15 K was acetonitrile > DMF > 2-butanone > methyl acetate > 4-methyl-2-pentanone > methyl propionate > ethyl acetate > propyl acetate > ethyl formate > acetone > butyl acetate > ethanol >1-propanol. The modified Apelblat model, van’t Hoff model, λh model, and polynomial empirical model were used for fitting the solubility data, and then the λh model was found to have the highest fitting accuracy with a minimum ARD of 7.0 × 10⁻³ and a minimum RMSD of 6.1 × 10⁻⁶. The solvent effect between the solute and the solvent was analyzed using linear solvation energy relationship (LSER), and the enthalpy of solvation (ΔsolH°), entropy of solvation (ΔsolS°), and Gibbs free energy of solvation (ΔsolG°) of the dissolution process of EP were calculated by the van’t Hoff model, which indicated that the dissolution process of EP in the selected solvents was endothermic, nonspontaneous, and entropy-increasing. In this work, the solubility, dissolution characteristics, and thermodynamic parameters of EP were studied, which will provide data support for the production, crystallization, and purification of EP and will provide important guidance for the crystallization optimization of EP in industry.
1. Introduction
Eplerenone (EP) is a novel selective aldosterone receptor antagonist first developed by Pfizer, which was initially marketed in the US in 2002 for the treatment of hypertension and heart failure.1−3 EP, CAS No. 107724-20-9, the systematic name of 9α,11-epoxy-7α-methoxycarbonyl-3-oxo-17α-pregn-4-ene-21,17-carbolactonean, molecular formula: C24H30O6, molecular weight: 414.49 g·mol–1, is an odorless, white or off-white crystal powder, and its chemical structure and three-dimensional (3D) structure are depicted in Figure 1.4,5
Figure 1.
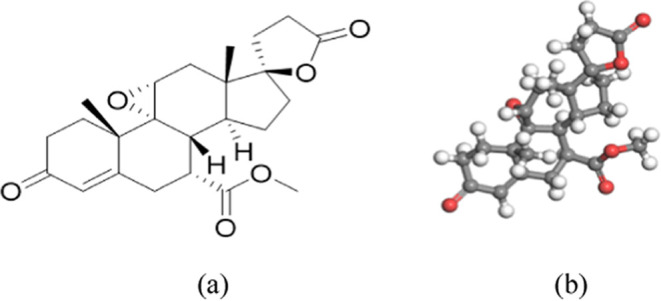
Chemical structure and 3D structure of EP.4 (a) Chemical structure; (b) 3D structure.
As a novel selective aldosterone receptor antagonist, EP has stronger antagonistic effects on aldosterone than spironolactone. Additionally, it exhibits minimal affinity for androgen and progesterone receptors, leading to reduce adverse reactions. Due to its improved tolerance and fewer adverse reactions, EP can be considered an excellent alternative to spironolactone for the treatment of hypertension, heart failure, and myocardial infarction.6,7 Pardo-Martínez et al.8 evaluated the efficacy of spironolactone and EP in patients with heart failure and reduced ejection fraction (HFrEF) in a clinical trial in 2022, and the results of the study showed that EP reduced cardiovascular mortality and all-cause mortality in patients with HFrEF compared to spironolactone. In addition, EP can be combined with other drugs. El Mokadem’s team9 found that angiotensin-converting enzyme inhibitors (ramipril) combined with mineralocorticoid receptor antagonists (EP) were effective in patients with chronic kidney disease. And the combination of ramipril and EP improved antialbuminuric effects when compared to monotherapy. In recent years, researchers have found that EP may be used to treat chronic central serous chorioretinopathy,10 but the role of EP in this regard was controversial. Katrin Fasler’s research group11 reported that there was no evidence of efficacy of EP on subretinal fluid (SRF) regression in patients with acute and chronic central serous chorioretinopathy (CSCR) in clinical trials, and this study was still under exploration. Nowadays, studies on EP have mainly focused on clinical observation and treatment, chemical synthesis, and the pharmacological and biological activities of drugs.6,12 However, the solubility and thermodynamic properties of EP in organic solvents have not been reported. Solubility is the physicochemical property of drugs which is crucial for the bioavailability of drugs in the human body. Moreover, studying the solubility of drugs in different solvents can provide effective data support and reference for subsequent industrial production and crystallization process research. Therefore, it is necessary to study the solid–liquid equilibrium of EP. Currently, the methods for the determination of solubility primarily include gravimetry, spectroscopy, chromatography, and dynamic laser monitoring. Bhola et al.13 used gravimetric methods to determine the solubility of benzethonium chloride (BTC) in 9 pure solvents and two mixed solvents. Daniela’s group14 adopted UV–vis spectrophotometry to determine the solubility of isoniazid in nine (PEG 200 + water) cosolvent mixtures and calculated thermodynamic solution, mixing, and transfer functions, which showed that solution entropy was beneficial to the solution dissolution process. Cheng15 exploited high-performance liquid chromatography (HPLC) to determine the solubility of esculetin in 10 single solvents and concluded that it was highest in methanol and lowest in water. Vahid16 measured the solubility of ketoconazole in a mixed solvent of propylene glycol and ethanol by a laser monitoring technique in the temperature range of 293.2 to 313.2 K.
In this paper, the solubility of EP was investigated. Under atmospheric pressure and temperatures ranging from 283.15 to 323.15 K, the solubility of EP in 13 pure solvents (acetonitrile, N,N-dimethylformamide (DMF), acetone, 2-butanone, 4-methyl-2-pentanone, ethyl formate, methyl acetate, ethyl acetate, propyl acetate, butyl acetate, methyl propionate, ethanol, and 1-propanol) was determined by the gravimetric method. Four thermodynamic models (such as the modified Apelblat model, van’t Hoff model, λh model, and polynomial empirical model) were employed to fit the solubility data. The model that exhibited a better fitting degree was selected. Furthermore, the solvent effect between solutes was analyzed by linear solvation energy relationship, and according to the van’t Hoff model, the thermodynamic properties of the dissolution process of EP were obtained.
2. Experimental Section
2.1. Material
The raw material for the experiment, eplerenone (purity ≥98%), was purchased from Hubei Widely Reagent Co., Ltd. in China, and other analytical research-grade organic reagents are listed in Table 1 for details. The selected solvents were commonly used organic solvents, and the chosen temperature fell within the optimal range for industrial production. Studying the solubility of EP in various solvents under conditions of 283.15 to 323.15 K could provide valuable insights for practical production and crystallization. Some analysis methods used for materials, such as high-performance liquid chromatography (HPLC) and gas chromatography (GC), were provided by the supplier.
Table 1. Descriptions of the Materials Used in the Experiments.
| materials | CAS NO. | molecular formula | molar mass (g·mol-1) | molar volume (cm3·mol–1)a | mass fractionb | analysis methodc | source |
|---|---|---|---|---|---|---|---|
| eplerenone | 107724-20-9 | C24H30O6 | 414.49 | 318.84 | ≥0.980 | HPLC | Hubei Widely Reagent Co., Ltd. |
| benzoic acidd | 65-85-0 | C7H6O2 | 122.12 | 92.52 | ≥0.980 | HPLC | Tianjin Institute of Metrology Supervision and Testing Science |
| sodium chloride | 7647-14-5 | NaCl | 58.44 | ≥0.995 | HPLC | Sinopharm Chemical Reagent Co., Ltd. | |
| ethanol | 64-17-5 | C2H6O | 46.07 | 58.52 | ≥0.997 | GC | Sinopharm Chemical Reagent Co., Ltd. |
| 1-propanol | 71-23-8 | C3H8O | 60.1 | 74.94 | ≥0.995 | GC | Tianjin Damao Chemical Reagent Factory |
| ethyl formate | 109-94-4 | C3H6O2 | 74.08 | 80.83 | ≥0.990 | GC | Tianjin Damao Chemical Reagent Factory |
| methyl acetate | 79-20-9 | C3H6O2 | 74.08 | 79.89 | ≥0.980 | GC | Tianjin Damao Chemical Reagent Factory |
| ethyl acetate | 141-78-6 | C4H8O2 | 88.11 | 96.94 | ≥0.995 | GC | Tianjin Fuyu Fine Chemical Co., Ltd. |
| propyl acetate | 109-60-4 | C5H10O2 | 102.13 | 115.48 | ≥0.990 | GC | Shanghai Macklin Biochemical Co., Ltd. |
| butyl acetate | 123-86-4 | C6H12O2 | 116.16 | 132.55 | ≥0.990 | GC | Tianjin Damao Chemical Reagent Factory |
| methyl propionate | 554-12-1 | C4H8O2 | 88.11 | 98.59 | ≥0.990 | GC | Shanghai Macklin Biochemical Co., Ltd. |
| N,N-dimethylformamide (DMF) | 68-12-2 | C3H7NO | 73.09 | 77.37 | ≥0.995 | GC | Tianjin Fuyu Fine Chemical Co., Ltd. |
| acetonitrile | 75-05-8 | C2H3N | 41.05 | 52.68 | ≥0.995 | GC | Tianjin Kermel Chemical Reagent Co., Ltd. |
| acetone | 67-64-1 | C3H6O | 58.08 | 73.93 | ≥0.990 | GC | Tianjin Damao Chemical Reagent Factory |
| 2-butanone | 78-93-3 | C4H8O | 72.11 | 90.20 | ≥0.990 | GC | Tianjin Damao Chemical Reagent Factory |
| 4-methyl-2-pentanone | 108-10-1 | C6H12O | 100.16 | 125.76 | ≥0.990 | GC | Sinopharm Chemical Reagent Co., Ltd. |
Molar volumes of 13 pure solvents were taken from the literature ,17 and molar volumes of EP and benzoic acid were calculated by the formula (Molar volume = Molar mass/Density), whose densities were equal to 1.30 and 1.32 g·cm–3 respectively.18,19
Mass fractions of all materials were provided by the supplier.
Analysis methods of all materials were provided by the supplier, and no additional purification steps were performed.
Benzoic acid purchased was the melting point standard material GBW13233e.
2.2. Characterization Methods
2.2.1. Differential Scanning Calorimetry (DSC) and Thermal Gravimetric Analysis (TGA)
The melting temperature (Tm) of EP was determined by using a differential scanning calorimeter (DSC 204 HP, NETZSCH, Germany) under the following conditions: EP sample weight: 5–10 mg, nitrogen flow rate: 20 mL/min, heating rate: 10 K/min, and temperature range: 298.15 to 573.15 K.
A thermal gravimetric analyzer (METTLER TOLEDO) was used to determine whether the weightless decomposition of EP occurred prior to the melting peak, and the determination conditions were the same as DSC, but the temperature range was 303.15 to 873.15 K.
2.2.2. Powder X-ray Diffraction (PXRD)
PXRD could make sure whether the crystal structure of EP changes when dissolved in various solvents. The test samples were the solid–liquid mixtures that remained in the system after reaching solid–liquid phase equilibrium, which were dried in a vacuum drying oven at −0.09 MPa and 60 °C and were milled before testing. The X-ray diffractometer (model: SmartLab SE) of Rigaku Company in Japan was used in this experiment. The measurement conditions included a Cu target, tube voltage of 40 kV, tube current of 40 mA, test angle range of 5–80°, and scanning step length of 0.02°.
2.3. Solubility Determination
The solubility of EP in 13 pure solvents (acetonitrile, DMF, acetone, 2-butanone, 4-methyl-2-pentanone, ethyl formate, methyl acetate, ethyl acetate, propyl acetate, butyl acetate, methyl propionate, ethanol, and 1-propanol) was determined by the gravimetric method13,20 over the temperature range from 283.15 to 323.15 K under atmospheric pressure. All test temperatures were controlled by a cryogenic bath (DHC-1005-A, Hangzhou Qiwei Co., Ltd.) with an error of ±0.05 K. The cryogenic bath was turned on and the test temperature was set; 30 mL of the solvent and excessive EP were added into the glass jacket crystallizer after the temperature was constant. Pre-experiments indicate that the solution reaches a saturated state after stirring for 10 h at a constant temperature. Therefore, the solution was stirred for 10 h with a magnetic stirrer and then let to stand for 2 h at the experimental temperature. The supernatant liquid was taken with a disposable syringe and filtered through a 0.22 μm nylon filter into a beaker of known mass. To ensure accuracy and prevent data inaccuracies caused by solvent evaporation, the nylon filter and the beaker were preheated to the testing temperature before filtration. After that, the beaker with supernatant liquid was put into a vacuum drying oven to dry at 60 °C for 24 h and then weighed using an analytical balance with an accuracy of ±0.0001 g (model: FA214A, Shanghai Haosheng Scientific Instrument Co., Ltd.) until the quality of the product was unchanged. The above procedures were repeated three times, changing the temperatures or solvents to measure the next set of data. To check the stability of the device, the solubility of sodium chloride (NaCl) in water was measured first, and the experimental results are shown in Figure 2. The solubilities of NaCl in water measured by this device were consistent with the reported results.21
Figure 2.

Experimental and literature values for the solubility of sodium chloride in water. w represents the mass fraction.
The measured solubility data were used to calculate the molar solubility (x1) of EP in different pure solvents, according to eq 1
| 1 |
where m1 and m2 are the mass (g) of EP and the selected solvents, respectively; M1 and M2 are the molar mass (g·mol–1) of EP and the selected solvents, respectively.
3. Calculation Models
3.1. Thermodynamic Models
3.1.1. Modified Apelblat Model
The modified Apelblat model, derived from the Clausius–Clapeyron equation, is a semiempirical thermodynamic model commonly used to describe the relationships between the molar solubility of the solute and its temperature.22,23 The equation can be described as follows
| 2 |
The solubility data is modeled using the following equation
| 3 |
where x1 is the molar solubility of EP at temperature T/K and A1, B1, and C1 are model parameters. The values of A1 and B1 show the change in the activity coefficient, describing the effect of the nonideality of the solution on the solubility of the solute, and C1 shows the effect of temperature on the heat of melting as a heat capacity deviation.
3.1.2. van′t Hoff Model
The van’t Hoff model was first proposed by Jacobus Henricus van’t Hoff, which can be expressed as a two-parameter empirical model, reflecting the existence of a link between solubility and thermodynamic temperature.13,24 And the van’t Hoff model exhibits that the logarithm of the molar solubility of the solute is linearly related to the reciprocal of the thermodynamic temperature. It is shown by eq 4
| 4 |
Solve eq 4 to get the following modeling equation
| 5 |
where x1 is the molar solubility of EP at temperature T/K and A2 and B2 are model parameters. The values of A2 and B2 are model parameters related to the entropy and enthalpy of the solution.
3.1.3. λh Model
In 1980, Buchowski et al.25 derived and proposed the λh model based on the generalized solubility equation. The λh model is a two-parameter empirical model, which is simple and suitable for associating solubility data with thermodynamic temperature.20 The expression is as follows:
| 6 |
The modeling equation is as follows:
| 7 |
where x1 is the molar solubility of EP at temperature T/K, Tm is the melting point of EP, λ, and h are model parameters, the value of λ represents the nonideality of the solution system, and h represents the enthalpy of the solution.
3.1.4. Polynomial Empirical Model
The polynomial empirical model can be applied to correlate and fit the solubility data. Additionally, the molar solubility of solute is a function of temperature when the external influence conditions are fixed,26,27 which is expressed as
| 8 |
where x1 is the molar solubility of EP at temperature T/K and A3, B3, C3, and D3 are model parameters.
3.2. Evaluation Criteria of Models
The average relative deviation (ARD) and root-mean-square deviation (RMSD) are regularly used to evaluate the accuracy of the fitting results of thermodynamic models and their corresponding formulas as follows:
| 9 |
| 10 |
where N represents the number of data points, x1 represents the experimentally observed value, and xcal represents the predicted value from the model.
3.3. KAT-LSER Model
The linear solvation energy relationship (LSER) is a quantitative structure–activity relationship (QSAR) model used to describe the solvent effect of solute–solvent interactions on the dissolution process.28 At present, the LSER model has been successfully applied to predict the solubility of substances, octanol/water partition coefficient, and various biological toxicity properties.29 The LSER model explains solvent effects by dividing solvent–solvent interactions into specific (such as hydrogen bond force) and nonspecific (including electrostatic force, dipole–dipole force, dipole–induced dipole force, and dispersion force) interactions.30 The Gibbs free energy (XYZ) during dissolution is the sum of solute–solvent interaction energy and cavity creation energy,31−33 as shown in eq 11
| 11 |
where XYZ0 is the intercept of the equation, which is only related to the properties of the solvent.
In the 1980s, Kamlet et al.31 developed the KAT-LSER model by analyzing the solubility data in conjunction with the solvent properties, which explains the change of Gibbs free energy during the dissolution process from multiple perspectives. The KAT-LSER model is expressed as follows
| 12 |
where x1 is the molar solubility of EP at temperature T/K, π*, α, and β are denoted as polarity/dipolarity of the solvent, summation of the hydrogen bond donor propensities of the solvent, and summation of the hydrogen bond acceptor propensities of the solvent, respectively. Vs is the molar volume of the solvent (cm3/mol), δH is the Hildebrand solubility parameter, and R is the molar constant of the gas (which takes the value of 8.314 J/(mol·K). The conversion of δH to Vs(δH)2/(100RT) is to make it dimensionless and within a certain range with the other three properties. In the equation, c0 is the intercept of the model when π* = α = β = δH = 0. c1 and c4 denote the sensitivities of the solute–solvent and the solvent–solvent via nonspecific electrostatic interactions, while c2 and c3 represent the interactions of the solute–solvent through the specific hydrogen-bonding interactions.
3.4. Thermodynamic Properties of the Solution
The solubility of a solute is closely related to the thermodynamic properties of solutions. To investigate the thermodynamic behavior of the dissolution process between EP and pure solvents, several thermodynamic parameters such as standard enthalpy of dissolution (ΔsolH°), standard entropy of dissolution (ΔsolS°), and standard Gibbs free energy of dissolution (ΔsolG°) can be analyzed.24,34,35 The standard enthalpy of dissolution (ΔsolH°) can be calculated according to the van’t Hoff model, as shown in eq 13
| 13 |
| 14 |
where x1 is the molar solubility of EP at temperature T/K and Tav is the average harmonic temperature of the experiment. From eq 13, ln x1 is linearly related to (1/T – 1/Tav), and the slope of the curve is (−ΔsolH°)/R with an intercept of b, as obtained by graphing with the software.
The equations of standard entropy of dissolution (ΔsolS°) and standard Gibbs free energy of dissolution (ΔsolG°) are expressed as eqs 15 and 16, respectively.
| 15 |
| 16 |
To compare the contribution of ΔsolH° and ΔsolS° to Gibbs free energy, the relative contribution of enthalpy (ξH/%) and entropy (ξTS/%)36,37 during the dissolution process can be calculated by eqs 17 and 18.
| 17 |
| 18 |
4. Results and Discussion
4.1. Characterizations of EP
4.1.1. DSC and TGA
The calibration material of DSC in this paper was benzoic acid, the standard material of melting point, which was measured three times according to the steps in Section 2.2.1. The average melting point and melting enthalpy (ΔfusH) of benzoic acid were 395.65 K and 16.49 kJ/mol, respectively, and the standard uncertainties of melting point and melting enthalpy of benzoic acid were 0.05 K and 0.28 kJ/mol, respectively. The melting point and melting enthalpy (ΔfusH) of benzoic acid in the literature38 were 395.40 K and 17.1 kJ/mol, respectively. The relative deviation was less than 4%, indicating that the device was reliable.
The DSC and TGA curves of EP are presented in Figure 3, and it could be found that there is no weightless decomposition of EP before the endothermic peak. And EP had an endothermic melting peak (Tp) at 512.00 K, and its standard uncertainty was 0.25 K. In addition, EP had another endothermic melting peak at 517.85 K. The test results were similar to the literature results.39 The average melting point (Tm) and average melting enthalpy (ΔfusH) of EP obtained by DSC analysis software were 506.60 K and 25.70 kJ/mol, respectively, and their standard uncertainties were 0.65 K and 0.03 kJ/mol, respectively. Due to the different experimental conditions, environment, and sample sources, there were some deviations between the test and the literature results.
Figure 3.

DSC and TGA curves of EP.
4.1.2. PXRD
EP raw material and EP recovered from solvents were analyzed by PXRD, and since the characteristic peak positions of EP were mainly concentrated at 5 to 35°, only the spectra of 5 to 35° are shown in Figure 4. It was clear that the characteristic peak position of EP recovered from solvents was consistent with that of the raw material, indicating that the crystalline form of EP had not been transformed in the process of dissolution. But the peak strength changed, which may be due to factors such as the roughness of the crystal surface, the presence of defects on the crystal surface, and the degree of crystallinity.
Figure 4.

PXRD patterns of raw material and EP recovered from solvents.
4.2. Solubility Results
The trends of solubility of EP in 13 pure solvents are plotted in Figure 5. The fitting curve in Figure 5 was obtained by fitting the polynomial empirical model. And the solubility and the fitted data are listed in Table 2. From Table 2, it could be found that the solubility of EP in 13 solvents increased with an increase in temperature. However, the influence of temperature on the solubility of each solvent was not uniform, so some same kinds of solvents had an increasing difference in solubility as the temperature increased. In addition, the solubility sequence of EP at 298.15 K was acetonitrile > DMF > 2-butanone > methyl acetate > 4-methyl-2-pentanone > methyl propionate > ethyl acetate > propyl acetate > ethyl formate > acetone > butyl acetate > ethanol > 1-propanol. Within the experimental range, EP had the maximum molar solubility in acetonitrile solution (2.67 × 10⁻², 323.15 K) and the minimum molar solubility in 1-propanol solution (3.65 × 10⁻⁵, 283.15 K).
Figure 5.

Molar solubility of EP in 13 pure solvents. (a) Ester solvents, (b) ketone solvents, (c) alcohol solvents, and (d) others.
Table 2. Experimental and Fitting Data of Molar Solubility of EP in 13 Pure Solvents at Temperatures from 283.15–323.15 K and Pressure 101.3 kPaa,b.
| T/K | 104xexp1 | 104xApelblat1 | 104xvan′tHoff1 | 104xλh1 | 104xpolynomial1 |
|---|---|---|---|---|---|
| Ethyl Formate | |||||
| 283.15 | 10.3252 | 10.1607 | 9.4000 | 9.4328 | 10.3967 |
| 288.15 | 12.0202 | 12.1064 | 11.6335 | 11.6579 | 12.0973 |
| 293.15 | 14.8700 | 14.4605 | 14.2933 | 14.3069 | 14.3165 |
| 298.15 | 16.8370 | 17.3108 | 17.4403 | 17.4416 | 17.1436 |
| 303.15 | 20.2534 | 20.7638 | 21.1411 | 21.1302 | 20.6681 |
| 308.15 | 25.3326 | 24.9491 | 25.4675 | 25.4475 | 24.9795 |
| 313.15 | 29.9784 | 30.0244 | 30.4976 | 30.4755 | 30.1671 |
| 318.15 | 36.6205 | 36.1812 | 36.3147 | 36.3043 | 36.3205 |
| 323.15 | 43.3808 | 43.6519 | 43.0085 | 43.0325 | 43.5289 |
| Methyl Acetate | |||||
| 283.15 | 24.6822 | 23.8355 | 24.8952 | 25.0074 | 24.7655 |
| 288.15 | 27.9883 | 28.7029 | 29.2930 | 29.3547 | 28.4687 |
| 293.15 | 34.4863 | 34.1599 | 34.2769 | 34.2854 | 33.5278 |
| 298.15 | 40.3703 | 40.2059 | 39.8980 | 39.8561 | 39.6875 |
| 303.15 | 46.0086 | 46.8298 | 46.2088 | 46.1271 | 46.6924 |
| 308.15 | 52.4982 | 54.0097 | 53.2633 | 53.1635 | 54.2872 |
| 313.15 | 62.8985 | 61.7130 | 61.1170 | 61.0348 | 62.2166 |
| 318.15 | 71.8265 | 69.8973 | 69.8262 | 69.8160 | 70.2251 |
| 323.15 | 77.1693 | 78.5112 | 79.4482 | 79.5882 | 78.0576 |
| Ethyl Acetate | |||||
| 283.15 | 20.6757 | 20.4522 | 20.0454 | 20.2062 | 20.6293 |
| 288.15 | 22.7423 | 22.6862 | 22.5037 | 22.5833 | 22.6235 |
| 293.15 | 24.5364 | 25.1507 | 25.1641 | 25.1680 | 25.0074 |
| 298.15 | 27.9556 | 27.8673 | 28.0336 | 27.9743 | 27.7542 |
| 303.15 | 30.8534 | 30.8595 | 31.1194 | 31.0171 | 30.8373 |
| 308.15 | 34.8187 | 34.1525 | 34.4279 | 34.3130 | 34.2298 |
| 313.15 | 37.3006 | 37.7738 | 37.9656 | 37.8798 | 37.9049 |
| 318.15 | 41.8303 | 41.7530 | 41.7382 | 41.7372 | 41.8359 |
| 323.15 | 46.1055 | 46.1221 | 45.7513 | 45.9066 | 45.9961 |
| Propyl Acetate | |||||
| 283.15 | 12.3694 | 12.0194 | 10.9726 | 11.0363 | 12.5370 |
| 288.15 | 13.8637 | 13.6339 | 13.0587 | 13.1014 | 13.5120 |
| 293.15 | 15.1359 | 15.5719 | 15.4494 | 15.4686 | 15.1939 |
| 298.15 | 17.3686 | 17.8986 | 18.1750 | 18.1703 | 17.5551 |
| 303.15 | 20.6262 | 20.6937 | 21.2672 | 21.2416 | 20.5676 |
| 308.15 | 24.0728 | 24.0547 | 24.7589 | 24.7201 | 24.2037 |
| 313.15 | 28.5204 | 28.1010 | 28.6843 | 28.6466 | 28.4357 |
| 318.15 | 33.3844 | 32.9790 | 33.0786 | 33.0652 | 33.2356 |
| 323.15 | 38.4751 | 38.8677 | 37.9783 | 38.0236 | 38.5758 |
| Butyl Acetate | |||||
| 283.15 | 3.9511 | 4.0077 | 4.2634 | 4.2754 | 3.9261 |
| 288.15 | 5.1100 | 5.1390 | 5.3071 | 5.3151 | 5.1452 |
| 293.15 | 6.5641 | 6.4912 | 6.5571 | 6.5601 | 6.5375 |
| 298.15 | 7.9483 | 8.0839 | 8.0443 | 8.0417 | 8.1316 |
| 303.15 | 10.2477 | 9.9337 | 9.8025 | 9.7946 | 9.9564 |
| 308.15 | 12.0042 | 12.0539 | 11.8686 | 11.8570 | 12.0406 |
| 313.15 | 14.2454 | 14.4533 | 14.2826 | 14.2714 | 14.4130 |
| 318.15 | 17.1843 | 17.1363 | 17.0879 | 17.0844 | 17.1024 |
| 323.15 | 20.1350 | 20.1021 | 20.3311 | 20.3472 | 20.1374 |
| Methyl Propionate | |||||
| 283.15 | 24.0936 | 24.0650 | 23.1973 | 23.3920 | 23.9443 |
| 288.15 | 26.1842 | 26.3305 | 25.9522 | 26.0493 | 26.3785 |
| 293.15 | 28.5936 | 28.8820 | 28.9234 | 28.9302 | 28.9780 |
| 298.15 | 32.6294 | 31.7537 | 32.1177 | 32.0494 | 31.8227 |
| 303.15 | 34.3830 | 34.9841 | 35.5417 | 35.4229 | 34.9924 |
| 308.15 | 39.0631 | 38.6169 | 39.2018 | 39.0681 | 38.5670 |
| 313.15 | 42.3920 | 42.7011 | 43.1036 | 43.0038 | 42.6261 |
| 318.15 | 47.1056 | 47.2918 | 47.2526 | 47.2509 | 47.2498 |
| 323.15 | 52.6321 | 52.4511 | 51.6538 | 51.8323 | 52.5178 |
| Acetone | |||||
| 283.15 | 9.8301 | 9.1744 | 8.8552 | 8.8907 | 9.6448 |
| 288.15 | 10.5105 | 10.9881 | 10.7952 | 10.8196 | 10.8829 |
| 293.15 | 12.8691 | 13.1322 | 13.0716 | 13.0827 | 12.8059 |
| 298.15 | 15.5404 | 15.6615 | 15.7269 | 15.7236 | 15.3725 |
| 303.15 | 18.2994 | 18.6394 | 18.8064 | 18.7898 | 18.5413 |
| 308.15 | 22.9550 | 22.1385 | 22.3588 | 22.3333 | 22.2709 |
| 313.15 | 25.9253 | 26.2421 | 26.4357 | 26.4105 | 26.5202 |
| 318.15 | 31.2586 | 31.0457 | 31.0919 | 31.0829 | 31.2476 |
| 323.15 | 36.5097 | 36.6584 | 36.3851 | 36.4176 | 36.4120 |
| 2-Butanone | |||||
| 283.15 | 25.3266 | 25.1259 | 24.9352 | 24.9884 | 25.4650 |
| 288.15 | 30.7864 | 30.7883 | 30.6692 | 30.7060 | 30.7507 |
| 293.15 | 37.8333 | 37.4975 | 37.4564 | 37.4729 | 37.2898 |
| 298.15 | 45.0327 | 45.4046 | 45.4399 | 45.4341 | 45.1953 |
| 303.15 | 53.8321 | 54.6759 | 54.7747 | 54.7481 | 54.5800 |
| 308.15 | 65.8053 | 65.4943 | 65.6281 | 65.5871 | 65.5568 |
| 313.15 | 78.5798 | 78.0595 | 78.1795 | 78.1387 | 78.2385 |
| 318.15 | 92.7111 | 92.5894 | 92.6204 | 92.6059 | 92.7381 |
| 323.15 | 109.0753 | 109.3205 | 109.1547 | 109.2085 | 109.1684 |
| 4-Methyl-2-pentanone | |||||
| 283.15 | 25.7568 | 26.4928 | 25.6915 | 25.9085 | 25.5549 |
| 288.15 | 28.8281 | 28.9381 | 28.5993 | 28.7032 | 29.2948 |
| 293.15 | 32.3161 | 31.6656 | 31.7199 | 31.7210 | 32.4338 |
| 298.15 | 36.0587 | 34.7064 | 35.0591 | 34.9762 | 35.2925 |
| 303.15 | 38.2014 | 38.0949 | 38.6220 | 38.4843 | 38.1916 |
| 308.15 | 41.1332 | 41.8694 | 42.4137 | 42.2622 | 41.4515 |
| 313.15 | 44.5408 | 46.0724 | 46.4384 | 46.3286 | 45.3929 |
| 318.15 | 51.4835 | 50.7513 | 50.7004 | 50.7039 | 50.3364 |
| 323.15 | 56.2323 | 55.9586 | 55.2034 | 55.4106 | 56.6025 |
| Ethanol | |||||
| 283.15 | 0.7097 | 0.7104 | 0.7423 | 0.7436 | 0.7263 |
| 288.15 | 0.9442 | 0.9534 | 0.9774 | 0.9784 | 0.9579 |
| 293.15 | 1.3627 | 1.2616 | 1.2748 | 1.2755 | 1.2581 |
| 298.15 | 1.5867 | 1.6476 | 1.6481 | 1.6482 | 1.6404 |
| 303.15 | 2.0927 | 2.1250 | 2.1127 | 2.1121 | 2.1184 |
| 308.15 | 2.6624 | 2.7084 | 2.6865 | 2.6853 | 2.7054 |
| 313.15 | 3.4184 | 3.4136 | 3.3900 | 3.3887 | 3.4150 |
| 318.15 | 4.3549 | 4.2569 | 4.2466 | 4.2459 | 4.2606 |
| 323.15 | 5.2062 | 5.2554 | 5.2826 | 5.2843 | 5.2559 |
| 1-Propanol | |||||
| 283.15 | 0.3654 | 0.3956 | 0.3471 | 0.3474 | 0.3683 |
| 288.15 | 0.5539 | 0.5278 | 0.4879 | 0.4882 | 0.5460 |
| 293.15 | 0.7011 | 0.7045 | 0.6780 | 0.6782 | 0.7265 |
| 298.15 | 0.9919 | 0.9405 | 0.9317 | 0.9319 | 0.9475 |
| 303.15 | 1.2321 | 1.2557 | 1.2670 | 1.2671 | 1.2469 |
| 308.15 | 1.6722 | 1.6763 | 1.7060 | 1.7058 | 1.6622 |
| 313.15 | 2.1431 | 2.2373 | 2.2752 | 2.2750 | 2.2313 |
| 318.15 | 3.0962 | 2.9847 | 3.0071 | 3.0069 | 2.9919 |
| 323.15 | 3.9465 | 3.9799 | 3.9403 | 3.9405 | 3.9817 |
| Acetonitrile | |||||
| 283.15 | 138.9418 | 140.4332 | 136.4462 | 137.5795 | 138.2878 |
| 288.15 | 150.4217 | 151.0072 | 149.4428 | 149.9469 | 151.8765 |
| 293.15 | 165.3174 | 162.7465 | 163.1702 | 163.1263 | 164.5486 |
| 298.15 | 176.6819 | 175.7631 | 177.6341 | 177.1640 | 177.1092 |
| 303.15 | 190.8641 | 190.1814 | 192.8392 | 192.1106 | 190.3636 |
| 308.15 | 206.3069 | 206.1396 | 208.7885 | 208.0212 | 205.1169 |
| 313.15 | 220.5818 | 223.7908 | 225.4841 | 224.9564 | 222.1744 |
| 318.15 | 242.4299 | 243.3041 | 242.9266 | 242.9828 | 242.3413 |
| 323.15 | 266.6956 | 264.8664 | 261.1157 | 262.1735 | 266.4228 |
| DMF | |||||
| 283.15 | 23.3492 | 24.6754 | 23.9144 | 23.9245 | 23.4771 |
| 288.15 | 31.3367 | 30.7435 | 30.2376 | 30.2465 | 31.0421 |
| 293.15 | 38.8070 | 38.1400 | 37.9279 | 37.9349 | 38.9126 |
| 298.15 | 47.7039 | 47.1213 | 47.2138 | 47.2183 | 47.7315 |
| 303.15 | 57.7826 | 57.9868 | 58.3502 | 58.3516 | 58.1419 |
| 308.15 | 71.4673 | 71.0851 | 71.6195 | 71.6177 | 70.7868 |
| 313.15 | 85.6799 | 86.8211 | 87.3329 | 87.3286 | 86.3092 |
| 318.15 | 105.7395 | 105.6638 | 105.8320 | 105.8270 | 105.3522 |
| 323.15 | 128.4462 | 128.1547 | 127.4894 | 127.4875 | 128.5589 |
xexp1, xApelblat1, xvan’tHoff1, xλh1, and xpolynomial1 represent the experimental value and fitted value, respectively.
Standard uncertainties u: u(T) = 0.05 K, u(P) = 0.3 kPa, and relative standard uncertainty ur: ur(x) = 0.05.
Moreover, Figure 5a revealed that the solubility of EP in ester (R1COOR2) solvents decreased with the increase of R2. The solubility of EP in methyl acetate increased significantly more than that of several other esters with the rising temperature. The order of solubility of EP in six ester solvents was methyl acetate > methyl propionate > ethyl acetate > propyl acetate > ethyl formate > butyl acetate. According to Figure 5b, the solubility sequence of EP in the three ketone solvents was 2-butanone > 4-methyl-2-pentanone > acetone; the solubility of EP in ketone (CH3COR1) solvents increased with the increase of R1 but decreased if R1 had branched chains. At lower temperatures, the solubility of 4-methyl-2-pentanone was close to 2-butanone. But with the increase of temperature, the solubility of 4-methyl-2-pentanone was much lower than 2-butanone. As shown in Figure 5c, with the growth of the carbon chain, the solubility of EP in alcoholic solvents became smaller. The order of solubility of EP in both alcoholic solvents was ethanol > 1-propanol. Lastly, as shown in Figure 5d, the solubility of EP in acetonitrile was higher than DMF.
The physical properties of the 13 organic solvents such as boiling point (bp), polarity/dipolarity (π*), dipole moment (μ), dielectric constant (ε), hydrogen bond donor capacity (α), hydrogen bond acceptor capacity (β), and Hildebrand solubility parameters (δH) are listed in Table 3. The order of boiling points was DMF > butyl acetate > 4-methyl-2-pentanone > propyl acetate > 1-propanol > acetonitrile > 2-butanone ≈ methyl propionate > ethanol > ethyl acetate > methyl acetate > acetone > ethyl formate; the polarizability of solvents obeyed the order as DMF > acetonitrile > acetone > 4-methyl-2-pentanone > ethyl formate > methyl acetate > ethyl acetate > ethanol > 1-propanol > propyl acetate > butyl acetate; the order of dipole moments was acetonitrile > DMF > acetone > 4-methyl-2-pentanone > 2-butanone > ethyl formate = butyl acetate > propyl acetate > ethyl acetate > methyl acetate > ethyl acetate > ethanol > 1-propanol; dielectric constant was ranked as DMF > acetonitrile > ethanol > 1-propanol > acetone > 2-butanone > 4-methyl-2-pentanone > ethyl formate > methyl acetate > ethyl acetate > propyl acetate > butyl acetate; and the cohesion energy density was ethanol > 1-propanol > acetonitrile > DMF > acetone > methyl acetate > ethyl formate > 2-butanone > methyl propionate > ethyl acetate > 4-methyl-2-pentanone > propyl acetate > butyl acetate.
Table 3. Values of π*, μ, ε, α, β, and δH for the 13 Pure Solvents at 298.15 K.
| solvents | bp (°C)a | π*b | μb | εb | αb | βb | δHc (J1/2/cm3/2) |
|---|---|---|---|---|---|---|---|
| acetonitrile | 81 | 0.75 | 3.92 | 35.69 | 0.07 | 0.32 | 24.09 |
| DMF | 153 | 0.88 | 3.82 | 37.22 | 0.00 | 0.74 | 23.97 |
| acetone | 56.5 | 0.71 | 2.88 | 20.49 | 0.04 | 0.49 | 19.77 |
| 2-butanone | 79.6 | 0.67 | 2.78 | 18.25 | 0.00 | 0.51 | 18.80 |
| 4-methyl-2-pentanone | 117 | 0.65 | 2.81 | 12.89 | 0.00 | 0.51 | 17.83 |
| ethyl formate | 53 | 0.61 | 1.90 | 8.33 | 0.00 | 0.38 | 18.94 |
| methyl acetate | 57 | 0.60 | 1.72 | 6.86 | 0.00 | 0.45 | 19.44 |
| ethyl acetate | 76.5 | 0.55 | 1.78 | 5.99 | 0.00 | 0.45 | 18.35 |
| propyl acetate | 102 | 0.50 | 1.80 | 5.52 | 0.00 | 0.45 | 17.67 |
| butyl acetate | 124 | 0.46 | 1.90 | 4.99 | 0.00 | 0.45 | 17.58 |
| methyl propionate | 79 | 0.55 | 18.63 | ||||
| ethanol | 78.3 | 0.54 | 1.69 | 24.85 | 0.37 | 0.48 | 26.42 |
| 1-propanol | 97 | 0.52 | 1.55 | 20.52 | 0.37 | 0.48 | 24.56 |
However, the experimental results were inconsistent with the above four orders, indicating that there was no obvious correlation between the solubility of EP and the above orders of the physical properties of solvents. This phenomenon showed that the dissolution process of EP in different solvents was very complicated. The solubility of EP was not affected by a single factor but may be influenced by many factors. These factors may include the physical and chemical properties of solute and solvents, intermolecular forces (such as hydrogen bond, dispersion force, induction force, orientation force), molecular structure, and stereoscopic effects.
4.3. Evaluations of Models
The adjusted R2, model parameters, ARD, and RMSD of the four models are shown in Tables 4–6. As can be seen from Tables 4–6, the adjusted R2 of the four models was close to 1, and the maximum ARD values were 3.27 × 10⁻², 4.70 × 10⁻², 4.68 × 10⁻², and 2.37 × 10⁻², respectively. The maximum RMSD values were 1.664 × 10⁻⁴, 2.95 × 10⁻⁴, 2.392 × 10⁻⁴, and 1.006 × 10⁻⁴, respectively. The above data indicated that the four models can effectively describe the relationship between the solubility of EP and temperature. In combination with the total ARD and RMSD, the polynomial empirical model exhibited higher fitting accuracy and smaller error compared to the modified Apelblat model, van′t Hoff model, and λh model. However, some parameters in the modified Apelblat model, van′t Hoff model, and polynomial empirical model were not significant and did not have statistical significance, and all parameters were significant when all solubility data were only fitted with the λh model. Therefore, the λh model was selected as the predictive model for the solubility of EP in this study.
Table 4. Parameters of the Modified Apelblat Model and the van′t Hoff Model (P = 101.3 kPa)a,b.
| modified
Apelblat model |
van′t
Hoff model |
||||||
|---|---|---|---|---|---|---|---|
| solvents | 100R2 | A1 | B1 | C1 | 100R2 | A2 | B2 |
| acetonitrile | 99.77 | –106.82 ± 16.53 | 3396.67 ± 1131.17 | 16.04 ± 2.48 | 99.39 | 0.95 ± 0.14 | –1484.66 ± 41.52 |
| DMF | 99.94 | –65.61 ± 30.79 | 0* | 10.86 ± 4.51 | 99.93 | 7.48 ± 0.13 | –3828.24 ± 40.78 |
| acetone | 99.68 | –86.57 ± 52.09 | 0* | 13.52 ± 7.71 | 99.67 | 4.39 ± 0.23 | –3232.60 ± 70.09 |
| 2-butanone | 99.97 | 0* | –2506.98 ± 1102.63 | 2.83 ± 3.45 | 99.97 | 5.93 ± 0.07 | –3377.46 ± 21.22 |
| 4-methyl-2-pentanone | 98.97 | –108.79 ± 41.50 | 3192.74 ± 2873.15 | 16.22 ± 6.25 | 98.81 | 0* | –1749.62 ± 68.62 |
| ethyl formate | 99.86 | –187.05 ± 20.95 | 5307.10 ± 2006.01 | 28.59 ± 3.14 | 99.67 | 5.32 ± 0.25 | –3478.56 ± 76.20 |
| methyl acetate | 99.47 | 126.86 ± 41.01 | –8277.07 ± 2843.43 | –18.36 ± 6.28 | 99.40 | 3.38 ± 0.25 | –2654.48 ± 77.18 |
| ethyl acetate | 99.76 | –67.66 ± 27.58 | 0* | 10.13 ± 4.12 | 99.69 | 0.45 ± 0.12 | –1887.69 ± 37.64 |
| propyl acetate | 99.77 | –250.72 ± 14.54 | 8728.10 ± 1739.13 | 37.76 ± 2.22 | 99.22 | 3.22 ± 0.30 | –2840.19 ± 93.01 |
| butyl acetate | 99.91 | 153.83 ± 21.11 | –10380.31 ± 1599.96 | –22.14 ± 3.26 | 99.81 | 4.86 ± 0.20 | –3573.26 ± 60.79 |
| methyl propionate | 99.72 | –126.51 ± 20.50 | 3925.53 ± 1516.63 | 18.88 ± 3.09 | 99.38 | 0.40 ± 0.17 | –1831.21 ± 51.68 |
| ethanol | 99.80 | 96.15 ± 55.84 | –8608.78 ± 3381.69 | –13.34 ± 8.58 | 99.81 | 6.35 ± 0.26 | –4489.01 ± 80.02 |
| 1-propanol | 99.70 | –223.79 ± 47.10 | 0* | 34.60 ± 7.00 | 99.65 | 9.36 ± 0.45 | –5557.32 ± 138.58 |
Standard uncertainty u(P) = 0.3 kPa.
0* indicates that the parameter has no significance and is not statistically significant.
Table 6. Deviations of the Modified Apelblat Model, van′t Hoff Model, λh Model, and Polynomial Empirical Model (P = 101.3 kPa)a.
| modified
Apelblat model |
van′t
Hoff model |
λh model |
polynomial
empirical model |
|||||
|---|---|---|---|---|---|---|---|---|
| solvents | 102ARD | 105RMSD | 102ARD | 105RMSD | 102ARD | 105RMSD | 102ARD | 105RMSD |
| acetonitrile | 0.72 | 16.64 | 1.23 | 29.47 | 0.92 | 23.92 | 0.43 | 9.19 |
| DMF | 1.42 | 7.05 | 1.47 | 8.53 | 1.47 | 8.50 | 0.51 | 3.75 |
| acetone | 2.45 | 4.34 | 2.73 | 4.74 | 2.70 | 4.67 | 1.54 | 3.49 |
| 2-butanone | 0.62 | 4.01 | 0.73 | 4.18 | 0.70 | 4.11 | 0.53 | 3.48 |
| 4-methyl-2-pentanone | 1.82 | 8.38 | 1.93 | 9.72 | 1.81 | 9.07 | 1.17 | 5.91 |
| ethyl formate | 1.54 | 3.50 | 3.20 | 5.78 | 3.10 | 5.64 | 1.35 | 3.08 |
| methyl acetate | 2.04 | 11.18 | 1.96 | 12.91 | 2.03 | 13.38 | 1.76 | 10.06 |
| ethyl acetate | 0.84 | 3.52 | 1.30 | 4.29 | 1.09 | 3.82 | 0.78 | 3.34 |
| propyl acetate | 1.61 | 3.57 | 3.77 | 7.15 | 3.62 | 6.86 | 0.80 | 1.67 |
| butyl acetate | 1.14 | 1.40 | 2.20 | 2.14 | 2.26 | 2.21 | 0.99 | 1.32 |
| methyl propionate | 0.97 | 4.21 | 1.66 | 6.73 | 1.41 | 5.85 | 1.04 | 4.17 |
| ethanol | 2.15 | 0.57 | 2.79 | 0.61 | 2.81 | 0.61 | 2.37 | 0.56 |
| 1-propanol | 3.27 | 0.55 | 4.70 | 0.64 | 4.68 | 0.64 | 2.28 | 0.50 |
Standard uncertainty u(P) = 0.3 kPa.
Table 5. Parameters of the λh Model and the Polynomial Empirical Model (P = 101.3 kPa)a,b.
| λh model |
polynomial
empirical model |
|||||||
|---|---|---|---|---|---|---|---|---|
| solvents | 100R2 | λ | h | 100R2 | A3 | B3 | C3 | D3 |
| acetonitrile | 99.60 | 0.08 ± 5.88 × 10⁻³ | 15759.56 ± 601.45 | 99.92 | –2.78 ± 0.73 | 0.03 ± 7.20 × 10⁻³ | –9.46 × 10⁻⁵ ± 2.38 × 10⁻⁵ | 1.07 × 10⁻⁷ ± 2.61 × 10⁻⁸ |
| DMF | 99.93 | 0.93 ± 0.05 | 4130.14 ± 182.22 | 99.98 | –2.04 ± 0.30 | 0.02 ± 2.94 × 10⁻³ | –7.35 × 10⁻⁵ ± 9.70 × 10⁻⁶ | 8.57 × 10⁻⁸ ± 1.07 × 10⁻⁸ |
| acetone | 99.68 | 0.13 ± 0.01 | 25325.73 ± 1859.73 | 99.75 | 0* | 0* | 0* | 0* |
| 2-butanone | 99.97 | 0.46 ± 0.01 | 7268.96 ± 162.94 | 99.97 | 0* | 2.42 × 10⁻³ ± 2.72 × 10⁻³ | –1.05 × 10⁻⁵ ± 8.99 × 10⁻⁶ | 1.51 × 10⁻⁸ ± 9.89 × 10⁻⁹ |
| 4-methyl-2-pentanone | 98.97 | 0.02 ± 3.07 × 10⁻³ | 61218.96 ± 4271.03 | 99.39 | –1.14 ± 0.47 | 0.01 ± 4.63 × 10⁻³ | –3.82 × 10⁻⁵ ± 1.53 × 10⁻⁵ | 4.27 × 10⁻⁸ ± 1.68 × 10⁻⁸ |
| ethyl formate | 99.69 | 0.20 ± 0.02 | 17198.95 ± 1367.28 | 99.87 | 0* | 2.41 × 10⁻³ ± 2.41 × 10⁻³ | –9.27 × 10⁻⁶ ± 7.97 × 10⁻⁶ | 1.19 × 10⁻⁸ ± 8.77 × 10⁻⁹ |
| methyl acetate | 99.35 | 0.14 ± 0.02 | 19040.70 ± 1617.46 | 99.49 | 1.02 ± 0.79 | –9.95 × 10⁻³ ± 7.88 × 10⁻³ | 3.21 × 10⁻⁵ ± 2.60 × 10⁻⁵ | –3.40 × 10⁻⁸ ± 2.8610–8 |
| ethyl acetate | 99.76 | 0.03 ± 1.57 × 10⁻³ | 65461.72 ± 2368.57 | 99.74 | 0* | 0* | 0* | 0* |
| propyl acetate | 99.28 | 0.08 ± 0.01 | 34341.12 ± 3247.92 | 99.94 | 0.20 ± 0.13 | –1.71 × 10⁻³ ± 1.31 × 10⁻³ | 0* | 0* |
| butyl acetate | 99.80 | 0.11 ± 9.14 × 10⁻³ | 33568.65 ± 2257.24 | 99.90 | 0* | 7.82 × 10⁻⁴ ± 1.03 × 10⁻³ | 0* | 3.83 × 10⁻⁹ ± 3.76 × 10⁻⁹ |
| methyl propionate | 99.53 | 0.03 ± 2.22 × 10⁻³ | 60923.82 ± 2964.81 | 99.67 | 0* | 0* | 0* | 0* |
| ethanol | 99.80 | 0.08 ± 8.53 × 10⁻³ | 56639.38 ± 5003.79 | 99.77 | 0* | 0* | 0* | 1.80 × 10⁻⁹ ± 1.59 × 10⁻⁹ |
| 1-propanol | 99.65 | 0.20 ± 0.04 | 28025.26 ± 4390.36 | 99.69 | –0.12 ± 0.04 | 1.25 × 10⁻³ ± 3.95 × 10⁻⁴ | –4.34 × 10⁻⁶ ± 1.30 × 10⁻⁶ | 5.03 × 10⁻⁹ ± 1.43 × 10⁻⁹ |
Standard uncertainty u(P) = 0.3 kPa.
0* indicates that the parameter has no significance and is not statistically significant.
4.4. KAT-LSER Model
In this research, the KAT-LSER model was used to investigate the solvent effect of the dissolution process of EP in pure solvents and then to analyze the impact of the solvent effect on the solubility of EP. The values of π*, α, β, and δH for the pure solvents are presented in Table 3.
The solubility data of EP in pure solvents measured at 298.15 K was fitted to each property of the solvents using the KAT-LSER model. The model was obtained as
| 19 |
where n is the number of solvent species, R2 is adjusted R2, F is the F-test, and RSS is the residual sum of squares.
The above results were output directly by the statistical analysis software. The above data denoted that the KAT-LSER model fitted the solubility data of EP well, but the Hildebrand solubility parameter (δH) was not significant in this model and had no statistical significance, so δH was excluded. And from the fitting model, the regression coefficient c1 of π* was positive, which implied that the solubility of EP was positively correlated with this parameter. This indicated that the nonspecific polarity/dipolarity of solvents contributed to the dissolution of EP. The negative regression coefficients of α and β indicated that the solubility of EP decreased with the increase of hydrogen bond donor capacity and hydrogen bond acceptor capacity of solvents. That is, the solve–solvent interaction through specific hydrogen bond was not conducive to the dissolution process of EP. From the regression coefficients of π*, α, and β, the contribution of each parameter to the total solvent effect can be calculated by eq 20, and the following results were obtained: polarity/dipolarity 27.01%, hydrogen bond donor capacity 24.25%, and hydrogen bond acceptor capacity 19.55%. In conclusion, the sum of these coefficients accounted for up to 70.81% of the total solvent effect, demonstrating that the parameters of the KAT-LSER model played a decisive role in the solubility of EP in the selected solvents. Specifically, the solubility of EP in the selected solvents mainly depended on nonspecific polarity/dipolarity.
| 20 |
where λi is the contribution rate of each parameter.
4.5. Thermodynamic Properties of the Solution
According to the van’t Hoff model, it could be seen that there was a linear relationship between the logarithm of molar solubility of EP (ln x1) and (1/T – 1/Tav), so the linear fitting was plotted with ln x1 as the vertical coordinate and (1/T – 1/Tav) as the horizontal coordinate, and then the slope (−ΔsolH°)/R and the intercept b were obtained. The specific results are shown in Figure 6 and Table 7. Table 7 shows that the adjusted R2 of the models was close to 1, which meant a good fit of the model to the data.
Figure 6.

Relationship between the logarithm of the molar solubility (ln x1) and the reciprocal of temperature (1/T – 1/Tav) for EP in 13 pure solvents.
Table 7. Thermodynamic Parameters of the Dissolution Process of EP in 13 Pure Solvents (P = 101.3 kPa)a.
| solvents | 100R2 | intercept | slope | ΔsolS° (J/(mol·K)) | ΔsolH° (kJ/mol) | ΔsolG° (kJ/mol) | ξH/% | ξTS/% |
|---|---|---|---|---|---|---|---|---|
| acetonitrile | 99.52 | –3.95 ± 5.02 × 10⁻³ | –1454.32 ± 35.55 | 7.06 | 12.09 | 9.95 | 84.96 | 15.04 |
| DMF | 99.87 | –5.14 ± 6.73 × 10⁻³ | –3804.11 ± 47.68 | 61.58 | 31.63 | 12.96 | 62.88 | 37.12 |
| acetone | 99.21 | –6.27 ± 0.01 | –3142.01 ± 98.82 | 34.02 | 26.12 | 15.81 | 71.69 | 28.31 |
| 2-butanone | 99.96 | –5.21 ± 3.25 × 10⁻³ | –3354.22 ± 23.02 | 48.71 | 27.89 | 13.12 | 65.38 | 34.62 |
| 4-methyl-2-pentanone | 99.06 | –5.56 ± 8.38 × 10⁻³ | –1719.20 ± 59.33 | 0.96 | 14.29 | 14.00 | 98.01 | 1.99 |
| ethyl formate | 99.44 | –6.15 ± 0.01 | –3319.20 ± 87.94 | 39.89 | 27.60 | 15.50 | 69.53 | 30.47 |
| methyl acetate | 99.61 | –5.38 ± 8.45 × 10⁻³ | –2704.92 ± 59.83 | 29.46 | 22.49 | 13.56 | 71.58 | 28.42 |
| ethyl acetate | 99.61 | –5.77 ± 5.82 × 10⁻³ | –1857.99 ± 41.20 | 2.97 | 15.45 | 14.55 | 94.49 | 5.51 |
| propyl acetate | 98.54 | –6.15 ± 0.02 | –2667.20 ± 114.76 | 22.05 | 22.18 | 15.49 | 76.84 | 23.16 |
| butyl acetate | 99.73 | –6.94 ± 9.66 × 10⁻³ | –3704.77 ± 68.41 | 43.94 | 30.80 | 17.48 | 69.81 | 30.19 |
| methyl propionate | 99.36 | –5.64 ± 7.16 × 10⁻³ | –1783.94 ± 50.75 | 2.05 | 14.83 | 14.21 | 95.98 | 4.02 |
| ethanol | 99.72 | –8.47 ± 0.01 | –4556.31 ± 85.20 | 54.56 | 37.88 | 21.34 | 69.61 | 30.39 |
| 1-propanol | 99.66 | –8.95 ± 0.02 | –5320.97 ± 109.63 | 71.49 | 44.24 | 22.57 | 67.12 | 32.88 |
Standard uncertainty u(P) = 0.3 kPa.
The thermodynamic parameters of EP in 13 pure solvents could be calculated from the fitting results, and the detailed results are displayed in Table 7. From Table 7, it could be observed that ΔsolH°, ΔsolS°, and ΔsolG° were all positive during the dissolution process of EP, manifesting that the dissolution process of EP in the 13 pure solvents was endothermic, nonspontaneous, and entropy-increasing. In addition, it was also noted that the value of ξH/% of 13 pure solvents was greater than the value of ξTS/%, indicating that ΔsolH° was the main contributor to ΔsolG° during the dissolution of EP.
Furthermore, this study has identified certain limitations that warrant further improvement and extension in subsequent research. Regarding thermodynamic modeling, various types of models can be selected to correlate and fit the solubility data of EP. Examples of such models include the Wilson model and the NRTL model. For thermodynamic analysis of solutions, molecular dynamics simulations can be employed to investigate the interactions between eplerenone and solvent molecules, which can dynamically elucidate the relationship between solubility of EP and solvent properties.
5. Conclusions
The solubility of EP in 13 pure solvents (acetonitrile, DMF, acetone, 2-butanone, 4-methyl-2-pentanone, ethyl formate, methyl acetate, ethyl acetate, propyl acetate, butyl acetate, methyl propionate, ethyl propionate, ethanol, and 1-propanol) was determined by the gravimetric method at atmospheric pressure and temperature of 283.15 to 323.15 K. The following conclusions were drawn from the work. The solubility of EP in the selected solvents was positively correlated with the thermodynamic temperature. In the experimental range, EP had the highest molar solubility in acetonitrile (2.67 × 10⁻², 323.15 K) and the lowest in 1-propanol (3.65 × 10⁻⁵, 283.15 K). The modified Apelblat model, van’t Hoff model, λh model, and polynomial empirical model correlated well with the solubility data of EP, but the best model was the λh model, with a minimum ARD of 7.0 × 10⁻³ and a minimum RMSD of 6.1 × 10⁻⁶. Parameters such as polarity/dipolarity, hydrogen bond donor capacity, and hydrogen bond acceptor capacity accounted for 70.81% of the total solvent effect in KAT-LSER model but mainly depended on nonspecific polarity/dipolarity. The thermodynamic properties (ΔsolH°, ΔsolS°, and ΔsolG°) of the dissolution process of EP in 13 pure solvents were all positive, indicating that the dissolution process of EP was endothermic, nonspontaneous, and entropy-increasing.
This study provides valuable data on the solubility, dissolution characteristics, and thermodynamic parameters of EP. It offers important insights for the production, crystallization, and purification processes of EP, as well as guidance for optimizing the crystallization of EP in industry.
Acknowledgments
The authors are thankful to Wuhan Research Institute of Materials Protection for providing DSC equipment. The authors are also thankful to Li Yinhua for experimental guidance.
Author Contributions
J.L.: Project administration, funding acquisition, writing—review and editing, and supervision. T.L.: Conceptualization, data curation, and writing—original draft. R.Z.: Visualization and investigation. S.Y.: Software and validation. Y.Z.: Methodology. C.Y.: Supervision. S.P.: Data curation. Q.Y.: Resources.
The authors declare no competing financial interest.
References
- Azizi M. Aldosterone receptor antagonists. Ann. d’Endocrinol. 2021, 82 (3–4), 179–181. 10.1016/j.ando.2020.03.009. [DOI] [PubMed] [Google Scholar]
- Carey R. M.; Calhoun D. A.; Bakris G. L.; Brook R. D.; Daugherty S. L.; Dennison-Himmelfarb C. R.; Egan B. M.; Flack J. M.; Gidding S. S.; Judd E.; Lackland D. T.; Laffer C. L.; Newton-Cheh C.; Smith S. M.; Taler S. J.; Textor S. C.; Turan T. N.; White W. B.; Resistant Hypertension: Detection, Evaluation, and Management: A Scientific Statement From the American Heart Association. Hypertension 2018, 72 (5), e53–e90. 10.1161/HYP.0000000000000084. [DOI] [PMC free article] [PubMed] [Google Scholar]
- Wang Z.; Chen Z.; Zhang L.; Wang X.; Hao G. Status of hypertension in China: results from the China hypertension survey, 2012–2015. Circulation 2018, 137 (22), 2344–2356. 10.1161/CIRCULATIONAHA.117.032380. [DOI] [PubMed] [Google Scholar]
- Yang Q.; Ye W. D.; Yuan J. Y.; Nie J. J.; Xu D. J. Eplerenone ethanol solvate. Acta Crystallogr., Sect. E: Struct. Rep. Online 2008, 64 (5), o829. 10.1107/S1600536808009240. [DOI] [PMC free article] [PubMed] [Google Scholar]
- Yang Q.; Zhang B. Y.; Ye W. D.; Yuan J. Y.; Xu D. J.; Nie J. J. Crystal Structure of 9α,11-Epoxy-7α-(methoxycarbonyl)-3-oxo-17α-pregn-4-ene-21,17-carbolactone. J. Chem. Crystallogr. 2008, 38 (9), 659–661. 10.1007/s10870-008-9376-0. [DOI] [Google Scholar]
- Dams I.; Bialonska A.; Cmoch P.; Krupa M.; Pietraszek A.; Ostaszewska A.; Chodynski M. Synthesis and physicochemical characterization of the process-related impurities of eplerenone, an antihypertensive drug. Molecules 2017, 22 (8), 1354. 10.3390/molecules22081354. [DOI] [PMC free article] [PubMed] [Google Scholar]
- Nabati M.; Tabiban S.; Khani A.; Yazdani J.; Vafainezhad H. The effects of spironolactone and eplerenone on left ventricular function using echocardiography in symptomatic patients with new-onset systolic heart failure: a comparative randomised controlled trial. Heart, Lung Circ. 2021, 30 (9), 1292–1301. 10.1016/j.hlc.2021.02.005. [DOI] [PubMed] [Google Scholar]
- Pardo-Martínez P.; Barge-Caballero E.; Bouzas-Mosquera A.; Barge-Caballero G.; Couto-Mallon D.; Paniagua-Martin M. J.; Sagastagoitia-Fornie M.; Prada-Delgado O.; Muniz J.; Almenar-Bonet L.; Vazquez-Rodriguez J. M.; Crespo-Leiro M. G. Real world comparison of spironolactone and eplerenone in patients with heart failure. Eur. J. Int. Med. 2022, 97, 86–94. 10.1016/j.ejim.2021.12.027. [DOI] [PubMed] [Google Scholar]
- El Mokadem M.; Abd El Hady Y.; Aziz A. A prospective single-blind randomized trial of ramipril, eplerenone and their combination in type 2 diabetic nephropathy. Cardiorenal Med. 2020, 10 (6), 392–401. 10.1159/000508670. [DOI] [PubMed] [Google Scholar]
- Farooq O.; Habib A.; Shah M. A.; Ahmed N. Effect of oral eplerenone in anatomical and functional improvement in patients with chronic central serous chorioretinopathy. Pak. J. Med. Sci. 2019, 35 (6), 1544–1547. 10.12669/pjms.35.6.896. [DOI] [PMC free article] [PubMed] [Google Scholar]
- Fasler K.; Gunzinger J. M.; Barthelmes D.; Zweifel S. A. Routine clinical practice treatment outcomes of eplerenone in acute and chronic central serous chorioretinopathy. Front. Pharmacol. 2021, 12, 675295 10.3389/fphar.2021.675295. [DOI] [PMC free article] [PubMed] [Google Scholar]
- Tam T. S.; Wu M. H.; Masson S. C.; Tsang M. P.; Stabler S. N.; Kinkade A.; Tung A.; Tejani A. M. Eplerenone for hypertension. Cochrane Database Syst. Rev. 2017, 2017, CD008996 10.1002/14651858.CD008996.pub2. [DOI] [PMC free article] [PubMed] [Google Scholar]
- Bhola R.; Ghumara R.; Patel C.; Parsana V.; Bhatt K.; Kundariya D.; Vaghani H. Solubility and Thermodynamics Profile of Benzethonium Chloride in Pure and Binary Solvents at Different Temperatures. ACS Omega 2023, 8 (16), 14430–14439. 10.1021/acsomega.2c07877. [DOI] [PMC free article] [PubMed] [Google Scholar]
- Baracaldo-Santamaría D.; Calderon-Ospina C. A.; Ortiz C. P.; Cardenas-Torres R. E.; Martinez F.; Delgado D. R. Thermodynamic Analysis of the Solubility of Isoniazid in (PEG 200 + Water) Cosolvent Mixtures from 278.15 K to 318.15 K. Int. J. Mol. Sci. 2022, 23 (17), 10190 10.3390/ijms231710190. [DOI] [PMC free article] [PubMed] [Google Scholar]
- Yang C.; Yan H.; Huang Q.; Yang W.; Hu Y. Solubility Determination and Thermodynamic Model Analysis of Esculetin in Different Solvents from 273.15 to 318.15 K. J. Chem. Eng. Data 2024, 69 (4), 1546–1556. 10.1021/acs.jced.3c00771. [DOI] [Google Scholar]
- Kooshkebaghi F.; Jabbari M.; Farajtabar A. A study on the solubility of some amino acids in (H2O + EtOH) and (H2O + EtOH + NaI) systems by gravimetric method at T = 298.15 K: Experimental measurements and COSMO-RS calculations. J. Mol. Liq. 2024, 398, 124229 10.1016/j.molliq.2024.124229. [DOI] [Google Scholar]
- Yaws C. L.Solubility parameter, liquid volume, and van der waals area and volume. In Chemical Properties Handbook; McGraw-Hill Professional: New York, 1999. [Google Scholar]
- https://www.chemspider.com/Chemical-Structure.10203511.html.
- Nishiyama K.; Sakiyama M.; Seki K. Enthalpies of Combustion of Organic Compouds. V. 3- and 4-Nitroanilines. Bull. Chem. Soc. Jpn. 1983, 56 (10), 3171–3172. 10.1246/bcsj.56.3171. [DOI] [Google Scholar]
- Yu C.; Sun X.; Wang Y.; Du S.; Shu L.; Sun Q.; Xue F. Determination and Correlation of Solubility of Metformin Hydrochloride in Aqueous Binary Solvents from 283.15 to 323.15 K. ACS Omega 2022, 7 (10), 8591–8600. 10.1021/acsomega.1c06468. [DOI] [PMC free article] [PubMed] [Google Scholar]
- Pinho S. P.; Macedo E. A. Solubility of NaCl, NaBr, and KCl in Water, Methanol, Ethanol, and Their Mixed Solvents. J. Chem. Eng. Data 2005, 50 (1), 29–32. 10.1021/je049922y. [DOI] [Google Scholar]
- Apelblat A.; Manzurola E. Solubilities of o-acetylsalicylic, 4-aminosalicylic, 3,5-dinitrosalicylic, and p-toluicacid, and magnesium-DL-aspartate in water from T = (278 to 348) K. J. Chem. Thermodyn. 1999, 31, 85–91. 10.1006/jcht.1998.0424. [DOI] [Google Scholar]
- Wang Z.; Yu S.; Li H.; Liu B.; Xia Y.; Guo J.; Xue F. Solid–Liquid Equilibrium Behavior and Solvent Effect of Gliclazide in Mono- and Binary Solvents. ACS Omega 2022, 7 (42), 37663–37673. 10.1021/acsomega.2c04540. [DOI] [PMC free article] [PubMed] [Google Scholar]
- Li M.; Gao Z.; Li Z.; Wang Z.; Zhou R.; Wang B. Determination and correlation of solubility of 4,4′-difluorobenzophenone in pure and binary mixed solvents and thermodynamic properties of solution. J. Mol. Liq. 2020, 317, 113903 10.1016/j.molliq.2020.113903. [DOI] [Google Scholar]
- Buchowski H.; Ksiazczak A.; Pietrzyk S. Solvent activity along a saturation line and solubility of hydrogen-bonding solids. J. Phys. Chem. A 1980, 84, 975–979. 10.1021/j100446a008. [DOI] [Google Scholar]
- Guo H.-j.; Cao D.-l.; Liu Y.; Dang X.; Yang F.; Li Y.-x.; Hu W.-h.; Jiang Z.-m.; Li Z.-h. Determination and correlation of solubility of N-methyl-3,4,5-trinitropyrazole (MTNP) in ten pure solvents from 283.15 K to 323.15 K. Fluid Phase Equilib. 2017, 444, 13–20. 10.1016/j.fluid.2017.04.008. [DOI] [Google Scholar]
- Yang F.; Li Y.-x.; Dang X.; Chai X.-x.; Guo H.-j. Determination and correlation of solubility of 2,2′,4,4′,6,6′-hexanitro-1,1′-biphenyl and 2,2′,2″,4,4′,4″,6,6′,6″-Nonanitro-1,1′:3′,1″-terphenyl in six pure solvents. Fluid Phase Equilib. 2018, 467, 8–16. 10.1016/j.fluid.2018.03.021. [DOI] [Google Scholar]
- Li C.; Li Y.; Gao X.; Lv H. Rutaecarpine dissolved in binary aqueous solutions of methanol, ethanol, isopropanol and acetone: Solubility determination, solute-solvent and solvent-solvent interactions and preferential solvation study. J. Chem. Thermodyn. 2020, 151, 106253 10.1016/j.jct.2020.106253. [DOI] [Google Scholar]
- Endo S.; Goss K.-U. Applications of Polyparameter Linear Free Energy Relationships in Environmental Chemistry. Environ. Sci. Technol. 2014, 48 (21), 12477–12491. 10.1021/es503369t. [DOI] [PubMed] [Google Scholar]
- Huang W.; Wang H.; Li C.; Wen T.; Xu J.; Ouyang J.; Zhang C. Measurement and correlation of solubility, Hansen solubility parameters and thermodynamic behavior of Clozapine in eleven mono-solvents. J. Mol. Liq. 2021, 333, 115894 10.1016/j.molliq.2021.115894. [DOI] [Google Scholar]
- Kamlet M. J.; Abboud J.-L. M.; Abraham M. H.; Taft R. W. Linear solvation energy relationships. 23. a comprehensive collection of the solvatochromic parameters, π*, α, and β, and some methods for simplifying the generalized solvatochromic equation. J. Org. Chem. 1983, 48, 2877–2887. 10.1021/jo00165a018. [DOI] [Google Scholar]
- Park J. H.; Lee Y. K.; Cha J. S.; Kim S. K.; Lee Y. R.; Lee C.-S.; Carr P. W. Correlation of gas–liquid partition coefficients using a generalized linear solvation energy relationship. Microchem. J. 2005, 80 (2), 183–188. 10.1016/j.microc.2004.07.014. [DOI] [Google Scholar]
- Maitra A.; Bagchi S. Study of solute–solvent and solvent–solvent interactions in pure and mixed binary solvents. J. Mol. Liq. 2008, 137 (1–3), 131–137. 10.1016/j.molliq.2007.06.002. [DOI] [Google Scholar]
- Rezaei H.; Rahimpour E.; Zhao H.; Martinez F.; Jouyban A. Solubility measurement and thermodynamic modeling of caffeine in N-methyl-2-pyrrolidone + isopropanol mixtures at different temperatures. J. Mol. Liq. 2021, 336, 116519 10.1016/j.molliq.2021.116519. [DOI] [Google Scholar]
- Xu H.; Kang L.; Qin J.; Lin J.; Xue M.; Meng Z. Solubility of Azilsartan in Methanol, Ethanol, Acetonitrile, n-Propanol, Isopropanol, Tetrahydrofuran, and Binary Solvent Mixtures between 293.15 and 333.15 K. ACS Omega 2020, 5 (11), 6141–6145. 10.1021/acsomega.0c00156. [DOI] [PMC free article] [PubMed] [Google Scholar]
- Alshehri S.; Hussain A.; Ahsan M. N.; Ali R.; Siddique M. U. M. Thermodynamic, Computational Solubility Parameters in Organic Solvents and In Silico GastroPlus Based Prediction of Ketoconazole. ACS Omega 2021, 6 (7), 5033–5045. 10.1021/acsomega.0c06234. [DOI] [PMC free article] [PubMed] [Google Scholar]
- Kalam M. A.; Alshamsan A.; Alkholief M.; Alsarra I. A.; Ali R.; Haq N.; Anwer M. K.; Shakeel F. Solubility Measurement and Various Solubility Parameters of Glipizide in Different Neat Solvents. ACS Omega 2020, 5 (3), 1708–1716. 10.1021/acsomega.9b04004. [DOI] [PMC free article] [PubMed] [Google Scholar]
- Roy S.; Rigaa A. T.; Alexander K. S. Experimental design aids the development of a differential scanning calorimetry standard test procedure for pharmaceuticals. Thermochim. Acta 2002, 392-393, 399–404. 10.1016/S0040-6031(02)00317-9. [DOI] [Google Scholar]
- Yassin G. E.; Khalifa M. K. A. Development of eplerenone nano sono-crystals using factorial design: enhanced solubility and dissolution rate via anti solvent crystallization technique. Drug Dev. Ind. Pharm. 2022, 48 (12), 683–693. 10.1080/03639045.2022.2160985. [DOI] [PubMed] [Google Scholar]
- Gu C.-H.; Li H.; Gandhi R. B.; Raghavan K. Grouping solvents by statistical analysis of solvent property parameters: implication to polymorph screening. Int. J. Pharm. 2004, 283 (1–2), 117–125. 10.1016/j.ijpharm.2004.06.021. [DOI] [PubMed] [Google Scholar]