

Abstract
Gait analysis serves as a critical diagnostic tool for identifying neurologic and musculoskeletal damage. Traditional manual analysis of motion data, however, is labor-intensive and heavily reliant on the expertise and judgment of the therapist. This study introduces a binary classification method for the quantitative assessment of gait impairments, specifically focusing on Duchenne muscular dystrophy (DMD), a prevalent and fatal neuromuscular genetic disorder. The research compares spatiotemporal and sagittal kinematic gait features derived from 2D and 3D human pose estimation trajectories against concurrently recorded 3D motion capture (MoCap) data from healthy children. The proposed model leverages a novel benchmark dataset, collected from YouTube and publicly available datasets of their typically developed peers, to extract time-distance variables (e.g. speed, step length, stride time, and cadence) and sagittal joint angles of the lower extremity (e.g. hip, knee, and knee flexion angles). Machine learning and deep learning techniques are employed to discern patterns that can identify children exhibiting DMD gait disturbances. While the current model is capable of distinguishing between healthy subjects and those with DMD, it does not specifically differentiate between DMD patients and patients with other gait impairments. Experimental results validate the efficacy of our cost-effective method, which relies on recorded RGB video, in detecting gait abnormalities, achieving a prediction accuracy of 96.2% for Support Vector Machine (SVM) and 97% for the deep network.
Keywords: Human gait analysis, markerless techniques, 2D and 3D HPE, LSTM-CNN, biomechanics, and DMD
Introduction
Gait is a complex, whole-body movement, as each subject has its own biological characteristics, and a deviation in the patterns of walking can be an indication of various diseases.1-3 Studying and analyzing gait in a medical context can contribute to the diagnosis of pathologies that affect gait.4,5 However, marker-based gait analysis requires a dedicated gait lab with specialized equipment, such as high-speed cameras, the availability of instrumented walkways, or specific wearable sensors such as inertial measurement units (IMUs).6-8 In addition, collecting, processing, and interpreting the motion data requires extensive training and experience to ensure accuracy and reliability.9,10 For patients who are unable to wear such sensors due to injuries at the wrists, markerless vision-based gait tracking can create a nonintrusive means to monitor their safety. 11 Automatic diagnosis of musculoskeletal and neurological disorders using machine learning (ML) and deep neural networks (DNNs) technologies are capable of providing a cost-effective solution for the estimation of stick images or readily accessible devices (e.g. smartphones) and then gait assessment.
Gait metrics, such as walking speed, stride time, cadence, symmetry, and joint angles are valuable clinical measurements that are routinely used as part of diagnostics and treatment planning for pathological gait and many other disorders, 10 including Duchenne muscular dystrophy (DMD) 12 stroke, 8 Parkinson’s disease (PD), 4 cerebral palsy, 13 multiple sclerosis, 14 Alzheimer’s disease, 15 dementia, 16 osteoarthritis, 17 and patients suffering from different functional gait disorders.9,18
Recent advancements in deep learning have produced significant progress in markerless human pose estimation (HPE), making it possible to estimate anatomical landmarks from digital videos without the need for reflective markers and specialized labs equipped with motion capture (MoCap) systems. Such algorithms have the potential to quantify clinically the gait metrics from videos or images recorded with a handheld camera. Human pose estimation19-21 reformats input data either images or videos to locate human body parts and construct a graphical representation of the human body, such as a skeletal model.16,22,23 This study aims to develop a pathological gait classification model based on HPE methods in combination with DNN techniques for diagnosis of DMD.
Duchenne muscular dystrophy is a devastatingly severe, rare genetic condition distinguished by childhood-onset muscle weakness. 24 Duchenne muscular dystrophy almost affects boys, given that the x-chromosome contains the gene that encodes for dystrophin.12,25 On average, around the globe, the existing incidence is estimated to be between 1 in 3500 and 1 in 5000 live male births. Duchenne muscular dystrophy progression starts in early childhood and affects the health-related quality of life of both DMD subjects and their carers, which influences their preferences. The disorder results in a steady increase in muscle inflammation, harm, and loss of power and ability, initially impacting the muscles near the center of the body and subsequently affecting the muscles further away as the disease progresses.26,27 The main objective of this study is to develop and test a novel approach for distinguishing between healthy subjects and those with gait impairments, including DMD patients. Although we did not provide detailed information on the level of impairment of the DMD subjects, we believe that our approach using a combination of 2D and 3D pose estimation data, with extracted relevant spatiotemporal and kinematic gait features, and ML algorithms still has value in the diagnosis and monitoring of DMD. Our method is designed to be applicable to a wide range of impairment levels, including mild and moderate impairments. While simple statistical analysis could potentially be used for persons with severe impairments, our complex model allows us to achieve a higher level of accuracy. Therefore, our system provides a powerful tool for diagnosing and monitoring various gait disorders. Regarding data anonymization, we have taken several measures to ensure the privacy of the individuals involved, particularly the DMD children. First, all the videos used in our study were collected from public sources, and we made sure not to use any personally identifiable information. Any potential identifiers, such as faces or names, were blurred or removed from the videos. Second, we implemented a strict data anonymization process. All the data collected from the videos were anonymized and de-identified before analysis. This means that the data could not be traced back to the individuals involved. Third, this study was conducted in compliance with ethical standards and followed the guidelines for the protection of human subjects.
The contributions can be summarized as follows:
Proposing a spatiotemporal feature-analysis model that extracts clinical gait features from raw video sequences and classifies pathological DMD gait.
Computing time-distance variables including (gait speed, stride time, step length, and cadence) and biomechanical joint angles including (hip, knee, and knee flexion angles) to investigate neuromuscular disorders.
Developing a hybrid network architecture composed of long short-term memory (LSTM) and convolutional neural networks (CNNs) in combination with 2D and 3D HPE approaches.
Proposing a quantitative and low-cost automated tool for early prediction and effective diagnosis based on 3D motion data (typically developed children) and DMD children (raw YouTube videos).
The remainder of this article is organized as follows: Section “Related work” surveys some related features and the most recent trends of markerless gait analysis techniques. Section “Proposed method and model architecture” introduces the methodology and explains dataset acquisition. Implementation, experimental results, and discussion are all presented and analyzed in Section “Implementation details and experiments.” Finally, Section “Conclusion” concludes the article and proposes an outlook on future work.
Related Work
In recent years, there has been a growing interest in developing low-cost solutions for gait analysis, particularly in rehabilitation centers and home health care settings. One such solution proposed by Alanazi et al 28 who presents a novel method for human gait analysis that combines the micro-Doppler spectrogram and skeletal pose estimation based on the Kinect V2 sensor and millimeter wave (MMW) radar for human activity recognition (HAR). The authors developed a multilayer CNN to recognize and classify 5 different gait patterns with an accuracy of 95.7% to 98.8% using MMW radar data. Khokhlova et al 11 calculated kinematic gait parameters using skeleton joint orientation data and design an LSTM ensemble method for unsupervised gait classification. They achieved an accuracy of 94% and 91% on their proposed multi-modal gait symmetry (MMGS) dataset for ensemble model and single LSTM, respectively. 5 Classify pathological gaits by inputting skeletal information and exploiting Kinect v2 and a GRU classifier which showed 90.1% performance when the entire skeleton was used and 93.67% when only the leg joints were used as input. Zhu et al 9 proposed a 2-stream CNN (2s-CNN) for the prediction of neurological disorders from small data. The 2s-CNN method involves training 2 separate neural networks, with one learning from the time series of joint position and the other from the time series of relative joint displacement. As a binary classification, Zheng et al 29 collected gait parameters from 200 patients with a PD and 100 healthy controls (HCs) through the wearable sensors. Using SVM and feature selection methods, they achieve classification accuracy reaches 96.7%. Ramli et al 30 extracted temporospatial clinical gait features (CGFs) and employed artificial intelligence (AI) tools to classify DMD and typically developed (TD) peers using extracted features and raw data with an accuracy exceeding 91%. D’Angelo et al 25 investigated the gait pattern of 21 DMD patients against 10 HCs through 3D gait analysis. Romano et al 26 approached 3D gait analysis on 19 boys with DMD and evaluated gait features using the 6-Minute Walking Test (6MWT). They proved that the DMD gait pattern is distinguished by increased anterior pelvic tilt and ankle plantar flexion.
The combination of CNN and LSTM had shown promising results and gradually gathered more attention in the research community. Gao et al 2 proposed an algorithm based on LSTM and CNN (LCWSnet) to detect certain abnormal gait including hemiplegic, tiptoe, and cross-threshold gait with accuracy reaching 93.1% on the best. Albuquerque et al 31 combined both VGG-16 CNN and a bidirectional LSTM for the extraction of spatiotemporal features from gait sequences represented by a selection of binary silhouette keyframes with an overall accuracy of 91.4% using the GAIT-IT dataset.
Researchers have recently begun to extend deep learning methods and HPE for pathological gait analysis. Rahil et al 7 examined 3D HPE and DNN to automatically recognize related gait problems which are classified into 4 different classes including healthy, PD, poststroke, and orthopedic with an overall accuracy reaching 71%. Kim et al 32 proposed a graph-CNN model for pathological gait classification and diagnosis of sarcopenia. Ng et al 16 employed gait features extracted from the tracked pose information for recorded videos of older adults with dementia. Guo et al 6 presented an RGB-D-based mobile 3D gait analyzer for tracking both 3D lower limb pose and 6D camera in a canonical coordinate system.
For further progress, this study introduces a new method that integrates both 2D and 3D HPE which are then combined with ML and DNN for pathological gait analysis. This study aims to propose a low-cost automated tool to identify patterns that distinguish DMD gait disturbances from normal gait patterns. The model was trained specifically on gait data from healthy children and children diagnosed with DMD. Our model achieved a high-prediction accuracy in this binary classification task and has 3 key features. First, it allows early intervention clinical care before the disorders develop into bigger health issues. Second, the method is fully automated, with no additional equipment or extra sensors on the patient’s body, no calibration, and no manual intervention. Third, it supports therapists in making a more robust diagnosis by providing a computer-aided indicator and helps them effectively monitor patients’ health conditions.
Proposed Method and Model Architecture
This section begins with a detailed description of the overall framework and further introduces the underlying key technologies. Figure 1 signifies the fundamental structure of the suggested methodology. It first reads a video sequence and feeds it to the 2D estimator, OpenPose 33 which generates 2D joint positions in the JSON format. Then, the 3D pose estimator, MeTRAbs 34 is customized to estimate 3D joint positions by inferring the depth information. Finally, MediaPipe framework is used for skeleton detection and extraction. After estimators successfully predict the joint positions in 2D and 3D, a gait cycle extractor starts identifying the gaits to extract CGFs. It is also observed that most of the existing works only apply DNN on individual joint features such as the time series of joint positions. As a consequence, sub-optimal results are usually obtained by applying such methods, especially on smaller-scale medical datasets. Therefore, we extracted 9 spatiotemporal clinical characteristics from the raw videos such as distance-time parameters including (stride time, step time, stride length, step length, cadence, and speed) and flexion low-limb angles including (knee, knee flexion, and hip angles).
Figure 1.

Proposed framework. CNN indicates convolutional neural networks; LSTM, long short-term memory; RBF, radial basis function; SVM, support vector machine; FC, fully connected.
Now, the methodology has 2 different paths, the first one, is to use CGFs extracted from time-series joint positions to be classified with SVM. Eventually, SVM was used for classification as it has great usability in clinical routines without necessitating complex apparatus. 1 The second path exploits DNN with the spatiotemporal changes of key joint positions in a gait cycle for binary classification. The proposed pathological gait classification framework combines LSTM and CNN for feature extraction and classification. Since DMD symptoms appear in early childhood, our thrust was to target the problem of diagnosis and classification of DMD. Therefore, we have been acquiring a new benchmark about DMD conditions and comparing against recorded 3D MoCap from the overground walking of TD peers. Finally, the model performance was evaluated on a held-out test set as well as unseen data collected from YouTube about some DMD subjects.
2D and 3D key joints estimation
Pose estimation has been used to study human locomotion22,35 and provide spatiotemporal measures (e.g. gait speed, step length, and step time) and kinematic measures (e.g. lower limb joint angles). Each frame in the raw video is processed through different HPE algorithms as demonstrated in Figure 2 to compute joint positions, which are then corrected to remove outliers and inconsistencies.
Figure 2.

Tracking and 3D reconstruction. HPE indicate human pose estimation.
2D HPE
Specifically, OpenPose 33 framework was utilized to extract joint positions from 2D RGB video data since it supports 2D real-time keypoint detection. As such, each frame is represented by 25 predefined joints, along with an associated confidence score for prediction. Every joint is represented as where are the pixel coordinates and indicates the prediction probability of this joint. Examples of possible extracted joints include the ankle, knee, hip, wrist, elbow, shoulder, foot (e.g. heel, big and small toe), hand, and face parts as presented in Figure 3. The 2D pose estimator of OpenPose can be saved in the JSON file format. It should be considered that these estimates of 2D planar projections are too noisy and biased because of manually annotated ground truth and planar projection errors. 10 So, some corrections are needed.
Figure 3.

The joint index numbers of the OpenPose.
3D HPE
A particularly challenging task is monocular 3D HPE. In contrast to previous approaches that exhibit a 2-step approach for 3D HPE, it has been proven that the most straightforward way for 3D HPE is to design an end-to-end network to predict the 3D coordinates of joints. 20 Instead of being aligned with image space, MeTRAbs 34 is used for 3D HPE where all dimensions are expressed in metric 3D space. It is a method for estimating absolute 3D human poses from RGB images using metric-scale truncation-robust heatmaps. MeTRAbs is designed to estimate complete, metric-scale poses without relying on anthropometric heuristics, such as bone lengths, or having test-time knowledge of distance. Given only a single image, a person’s anatomical landmarks are directly sought in 3D space, that is, in millimeters instead of pixels. As a consequence, the input is an RGB image depicting a person and the desired output is a 3D skeleton, consisting of joint coordinates in millimeters, up to arbitrary translation.
Skeletal detection
Generally, the skeleton model is widely investigated in 2D HPE and can be extended to 3D. The raw skeletal data are a sequence of vectors that represent the 2D or 3D coordinates of human keypoints. 36 It can be represented as a tree structure that contains many keypoints of the human body and connects natural adjacent joints using edges. 20 Inspired by the study proposed by Han et al, 37 the marker position-based format is converted into a skeletal format, such that we can focus on the movement of joints instead of body surfaces.
The conversion to a skeletal format is facilitated by the MediaPipe (https://pypi.org/project/mediapipe/) framework. The skeletal definition we adapted consists of 33 joints corresponding to real-human joint positions, as shown in Figure 4. MediaPipe Pose is one of the ML solutions in the MediaPipe framework which is a bottom-up multiperson pose estimation model.
Figure 4.

The skeleton construction.
Data correction
To ensure consistency throughout the pipeline, the exported joint data are preprocessed prior to feature extraction. Such preprocessing involves remapping anomalous key joint positions caused by self-occlusion or inaccuracies during the joint estimation process. We first qualitatively guarantee that there is alignment between the predicted joint positions and the associated confidence scores. Then, the predicted confidence scores are used to calculate a confidence threshold by taking the average confidence score and subtracting 5% per joint. In practice, we ignore all joints that did not super pass the confidence threshold. 13 As such, the confidence threshold value for joint can be expressed as
where is the total number of frames, is the confidence score of joint at frame returned by the estimator. For joints that are identified as outliers, we calculate a revised joint position based on the coordinates of the joint in the nearest neighboring frames with confidence scores higher than the confidence threshold. In addition, all values were scaled by dividing by the Euclidean distance between the right hip and the right shoulder. Finally, to illustrate the detected pose, the keypoints are connected. Next, these signals are fed into ML and DNN that extract clinically relevant metrics.
Extraction of clinical gait features
Several spatiotemporal and kinematic gait features were extracted from both the 2D and 3D HPE data as part of our study. These features were carefully chosen and designed to be relevant to the diagnosis of DMD. Some of the spatiotemporal features we extracted included stride length, stride time, and gait speed, which were calculated from the 2D and 3D pose estimation data. These features were selected based on recommendations from previous studies25,30 that have studied gait in DMD diagnosis. In addition to spatiotemporal features, we also extracted kinematic features, such as joint rotation angles including knee flexion and extension. 12 These features were chosen to provide information on the range and quality of joint movements during gait.
The gait cycle can be defined as the period between 2 successive foot contacts of the same limb 28 and can be divided into 2 main phases: the stance phase and the swing phase. The first begins when the foot makes contact with the ground and ends when the toe lifts off. It represents approximately 60% of the gait cycle. 31 The second phase begins after the toe-off and continues until the next heel strike. It represents approximately 40% of the gait cycle. 38 The definition of gait phases typically involves identifying specific events in the gait cycle, such as heel strike, toe-off, and mid-stance, among others. These events are used to break down the gait cycle into different phases or subphases, each of which has distinct gait features and characteristics. In our study, the reference event for the definition of the gait cycles is indeed the heel strike as shown in Figure 5. This is a common practice in gait analysis as it marks the beginning of a new gait cycle. However, we acknowledge that this might not be applicable to all patients, especially those who strike the ground with the forefoot first. We used 25 frames per second to create videos of walking at normal speed. It is worth mentioning that the Kinect captures 25 frames per second for the overground walking of TD children. Hence, the time interval between each frame is 1/25 (0.04 s).
Figure 5.

Gait cycle and terminologies. 38
Stride time (s) or cycle time is the time taken by the subject to complete a gait cycle. If and are the frame numbers at the start and end of the gait cycle respectively, then stride time can be computed as
Step time(s) is the time elapsed between the heel strike of one leg to the heel strike of the alternate leg. Step time is considered to be half of the stride time as there will be 2 steps for each stride
Stride length (m) can be defined as the distance traveled by the subject in one gait cycle. So, the displacement of the ankle from to is calculated by the Euclidean distance. If are the coordinates of the ankle in frame and are the coordinates of ankle (same leg) in frame , then the Euclidian distance is given by
Step length (m): anterior-posterior distance between the right heel to the left heel 39 (heel-to-heel distance). 24 Normally, step length is considered to be half of the stride length.
Cadence: The number of steps per unit of time. 4 Since each stride has 2 steps, cadence is given by
Gait speed (m/s): was computed based on the absolute distance (m) traveled by the anterior superior spine marker divided by time (s). 30 Gait speed can be considered as the distance traveled by the subject in unit time and can be calculated using stride length and stride time
Moreover, flexion low-limb angles are widely used by clinicians to evaluate human gait. We calculated the sagittal plane hip, knee, and ankle angles of the left and right legs using estimated coordinates. The sagittal plane is used for lower limb joint calculations as depicted in Figure 6. The flexion and extension of the hip and knee are determined by applying the dot product.
Figure 6.

Planar model of the lower limb.
The knee angle can be computed from the coordinate of hip, knee, and ankle joints 10 (0° is vertical, flexion is positive, extension is negative). So, can be computed by the thigh and shank vectors 6 as the dot product of and , where begins at the hip and ends at the knee while begins at the knee and ends at the ankle as drawn in Figure 6.
Knee flexion angle at maximum extension is considered a key biomechanical parameter within the gait cycle in clinical decision-making. It is the angle formed by the extension line connecting the hip and knee, and the line connecting the knee and ankle, as shown in Figure 7.
Figure 7.

Knee and knee flexion angles determination.
The hip angle is formed by the position of the back and the thigh. was the vector between hip and knee (0° is vertical, flexion is positive, extension is negative) as shown in Figure 8.
Figure 8.

Hip angle determination.
It should be considered that the global coordinate system used in this study was based on a standard anatomical frame of reference, defined by the International Society of Biomechanics. 40 The origin of the global coordinate system was set at the midpoint of the ankle joint between the 2 feet, and the positive x-axis was oriented in the forward direction of walking. The positive y-axis was oriented perpendicular to the ground plane and pointing upward, while the positive z-axis was oriented along the vertical direction and pointing upward.
Classification using SVM
We first adopt the nonlinear SVM as the classifier using 10-fold cross-validation for binary classification (TD or DMD). In general, SVM is one of the most common ML approaches used for gait classification which can map the data to a higher dimensional space. It is a feature-based classifier utilized to establish hyperplane borders that maximize the margin between distinct classes. Such hyperplanes are optimal boundaries that can classify new sets of data and maximize the margin among classes in the training data. 1 In this experiment, the radial basis function (RBF) kernel is used which plots a single data item in an M-dimensional space (where M is several attributes), with the value of each attribute being the value of a particular coordinate.
Deep network model
Once we have obtained 3 different time series, the final stage is classifying those time series to detect a health problem. Instead of feature engineering and heavy data preprocessing, we feed the raw time series directly to the deep network which automatically learns complex feature representations. Deep learning allows multilevel abstractions of the raw data due to its deep architecture of nonlinear hidden layers which facilitates the automatic diagnosis of neurologic damage. 9 The proposed network concatenates both LSTM and CNN for the complete extraction of spatial and temporal features of the gait cycles. The depth network contains 2 LSTM layers ( and ) followed by 3 1D convolutional layers ( , and ). These convolutional layers are separated by 2 pooling layers ( and ), and the final prediction is then generated by a fully connected layer ( ) and Softmax layer.
LSTM
Recurrent neural networks (RNNs) learn dependencies between inputs in a time series and are suitable for extracting temporal features from a video sequence.6,31 LSTM network is an improved RNN proposed by Hochreiter and Schmidhuber. 41 Since human gait is bipedal using forward propulsion of the center of gravity (CoG) of the body, a certain pattern is repeated during the movement. Hence, LSTM can significantly capture the period of the gait cycle due to the periodicity of the gait signals. It solves the issue of weight explosion and gradient disappearance caused by the recursion under long-term time-dependent conditions. The depth network contains 2 LSTM layers with 64 units.
CNN
A 1D convolution was investigated as shown in Figure 9 where only a 1D convolution kernel is used. The feature extraction of a convolution layer mainly comes from the interaction between the convolution core and the input, that is, the convolution core can be considered as the feature extractor.
Figure 9.

A sample 1D CNN configuration with 3 CNN and 2 pooling layers. CNN indicate convolutional neural networks.
Deep neural network, on the contrary, takes the output value of as input to a CNN through dimension change, and the number of convolution kernels of , and is set to 128, 144, and 156; the size of the convolution kernels is 1 × 3, and the convolution step is 1. The parameters of the maximum pooling layers of and are the same. The stride length and pooling size are both 2. The network is connected to the fully connected layer which outputs a 2D vector representing the probability that the sample belongs to a certain class (TD or DMD). Then, the pooling layer (the max pooling) is used to select key features for classification 2 followed by the log softmax function as the activator which maps the feature vector extracted by LSTM and CNN to the output vector. To avoid overfitting and improve the generalization, we employ dropout with a rate of 0.5 in this layer. The following cross-entropy loss function is applied for the evaluation of training and testing:
where = [ , . . ., ] is a probability distribution, represents the probability that a sample belongs to class . is the one-hot representation of class labels, and is the number of classes.
The following Algorithm 1 expresses the steps involved in extracting gait parameters from videos using HPE methods and then employing ML and DNN techniques for classification. The algorithm provides a detailed and formal representation of the method, including the conversion of the input video into a sequence of frames, the application of HPE to each frame, the representation of each joint with its 2D-pixel coordinates and 3D in millimeters and prediction probability, the calculation of the confidence score for each joint, the extraction of gait parameters from the HPE results, and the performance of classification on the extracted gait parameters using ML and DNN techniques. The results of the ML and DNN classification are then compared for the gait classification of the 2 predefined groups (DMD or TD).
| Algorithm 1 DMD diagnosis and classification. |
|---|
|
Input: Video file or RGB image
Output: Classified as DMD or TD children 1. Convert the input video into a sequence of frames where n is the number of frames 2. For each frame in the sequence: a) Apply OpenPose and MediaPipe as 2D HPE For each joint : where are the pixel coordinates and is prediction probability End For b) Apply MeTRAbs as 3D HPE For each joint : End For c) Calculate the confidence score where is the number of frames, is the confidence score of joint at frame . End For 3. Calculate gait parameters from the HPE landmarks. 4. Diagnose DMD child 5. Classify DMD or TD using ML and DNN models 6. Compare and return the classification results. |
Materials and dataset acquisition
The absence of data is a big obstacle in clinical gait research as privacy protocols necessitate all videos to be stored on servers dedicated to the hospital, which means having to deal with high traffic and therefore slow data transfers. 16 Normal gait is more prevalent bacause several benchmarks can be used from different domains such as gait recognition. However, there are very few examples of abnormal gait publicly available for reuse. 11 Compared to the number of gait studies that have been conducted over the years, there are very few publicly available gait benchmarks. Even if the benchmarks are available, they commonly suffer from many limitations (e.g. few subjects, little gait cycles, absence of raw data, no metadata, lack of standard formats) and the most influential one is restrictive licensing. 42
Ground truth data acquisition for healthy children
Therefore, the public benchmark dataset created by Senden et al 42 was employed for training and classification. The TD (https://osf.io/3xqew/) dataset records the gait data of HC peer children (24 boys/31 girls). The average age was 9.38 years, the average body mass was 35.67 kg, the average leg length was 0.73 m, and the average height was 1.41 m walking at different walking speeds (slow—comfortable- fast). Such a dataset has many advantages as raw and processed data were presented for each child separately. Besides, the children’s demographics and the results from the physical examination are given. So, we can select TD children from the database to create a matched group, based on specific parameters (e.g. sex, mass, and speed). Our funding creates a subdataset from this data filtered based on sex (males are selected) as well as the type of speed (normal gait speed is preferred).
YouTube-DMD dataset
Unfortunately, large datasets are often not available in medical video/image analysis due to the restrictions on sharing data publicly in this domain. 9 Moreover, rare diseases make the process of obtaining a dataset problematic and a major impediment. So, we further train our proposed methods on various DMD videos collected from YouTube. For DMD body parsing, we select 21 various clips from the YouTube dataset. Twelve videos are used for extraction of CGFs and classification while 9 videos are for explaining symptoms. The average length of each video is about 400 frames. The underlying DMD dataset is diverse and challenging, as it includes children and teenagers of different races, poses, and appearances. Although we have a limited number of videos, they contain varying background scenes, viewpoints, and different lighting conditions. They also cover most DMD symptoms. The verification of DMD diagnosis in the videos was conducted through a 2-step process. First, the video content was examined. The individuals featured in the videos or their caregivers often explicitly state their diagnosis in the video or the video description. This provides an initial confirmation of the DMD diagnosis. Second, to ensure accuracy, each video was reviewed by a medical expert specializing in neuromuscular disorders. The expert assessed the symptoms and movements shown in the video, which are characteristic of DMD, thereby providing a secondary layer of verification. Meanwhile, we affirmed that we took several measures to address privacy concerns and protect the children’s privacy as much as possible. We made sure not to use any identifying information of the children featured in the videos, such as names or locations, and blurred any faces in the videos to conceal their identities and opt for videos that focused on the affected body parts or movements. We also used a strict data protection policy, ensuring that the data collected was kept confidential and only accessed by authorized individuals.
HPE for diagnosis of DMD
Diagnosis typically begins in early childhood after suggestive signs and symptoms are noticed, such as weakness and clumsiness. By the age of 3, some problems are noticed. The patient can find difficulty with stair climbing as in Figure 10. A Gowers’ sign (climbing up himself) begins to appear as in Figure 11. A 6-year-old finds walking more difficult and the child tends to walk on his toes due to the shortening of the Achilles tendon as in Figure 12.
Figure 10.

Trouble climbing stairs.
Figure 11.

A Gowers’ sign (joins estimated by MediaPipe).
Figure 12.

A tip-toe walking.
Seven years old struggles to keep up with his friends as in Figure 13. Every day, life can be very difficult. In 8 years, the characteristic DMD Trendelenburg sign (waddling gait) appears, where children are walking on their toes with an arched lower back as shown in Figure 14. By 9 years, strength continues to fade. Ten is the average age when walking is no longer possible as in Figure 15. Soon after the arms muscles begin to weaken as in Figure 16. Scoliosis (curvature of the spine) will occur in 90% of boys and surgery will be needed as in Figure 17. At 14 years, it is difficult to bring hand to mouth, and muscle damage can lead to paralysis as in Figure 18. Over time, DMD patients often require assistance with eating and breathing in the later stages of the disease. Cough assist machines are needed to clear the lungs. Bipap machines help older boys breathe at night.
Figure 13.

Trouble running.
Figure 14.

Waddling or Myopathic Gait.
Figure 15.

Using of wheelchair.
Figure 16.

Progressive arm and shoulder weakness.
Figure 17.

Scoliosis.
Figure 18.

Difficulties in bringing hand to mouth.
For all figures, the first column is the ground truth frame, the second one represents the extracted 2D landmarks which are overlaid on the original frame, the third column shows the same frame with 3D pose estimation and finally, and the last one gives the skeletal formatting. The underlying pose estimation methods and the preprocessing techniques used in this study were specifically robust to variations in clothing, lighting, and background clutter.
Implementation Details and Experiments
This section mainly lists and discusses the detailed experimental settings, hyperparameters, and results. Furthemore, comparisons and analyses of the proposed models are conducted to prove the robustness of the system at the end of this section.
Experimental setup
Python with support of the Keras framework using TensorFlow, was installed on a laptop computer with the Intel Core i7- 7660U CPU 7th Generation Processor 2.5 GHz and 16 GB of memory. The computing environment used during experiments is shown in Table 1. All other computations were done on a virtual machine (VM) on Google Cloud with 8 cores and 16 GB of RAM. The computation environment did not acquire GPU acceleration which means that the VM did not have a Graphics Processing Unit (GPU) attached to it. We conduct our experiments based on the open-source Python libraries TensorFlow (https://www.tensorflow.org/), Scikit-learn (scikit-learn.org), Keras (keras.io), and SciPy (scipy.org). To extract time series of anatomical joints, OpenPose proposed by Cao et al 33 was employed as a real-time pose estimator. OpenPose is used to obtain the 2D coordinates of 25 keypoints corresponding to the full body. For each video, there was a 25-dimensional time series of keypoints that were tracked across all frames.
Table 1.
Environmental settings.
| Parameter | Configuration information |
|---|---|
| CPU | Intel Core i7- 7660U |
| RAM | 16 GB DDR4 |
| Operating System | 64-bit Windows 10 |
Abbreviations: CPU, central processing unit; RAM, random access memory.
Once the set of coordinates of each video frame has been obtained, the OpenCV (https://opencv.org/) library is used to draw and join the 2D coordinates. The coordinates of each key point of the body are connected to form a digital skeleton. Then, MeTRAbs 34 pose estimator network estimates a 3D body pose for each frame of the video and constructs the corresponding time series. The SVM model was trained using an RPF kernel and then classified the input data into 1 of the 2 predefined groups (TD or DMD). CGFs including joint angles at a different moment in a phase of a gait cycle were fed to DNN for training and classification. The LSTM-CNN network was trained and model performance was evaluated on a held-out test set. (rectified linear unit, defined as is used as an activation function after each convolutional layer, instead of using a traditional hyperbolic tangent function exhibits a strong ability to inhibit the varnishing gradient and facilitates the training process of the network. Furthermore, it introduced sparsity in the network, which weakened the interdependence of the parameters and avoided over-fitting effectively.
The LSTM has 64 units. There are 3 1D convolutional layers ( , , and ), and 2 pooling layers ( and ). It is observed that employing stochastic-gradient descent (SGD) frequently leads to a local minimum on the error. Therefore, the DNN is trained in an end-to-end manner with an (adaptive moment estimation) Adam optimizer to control the learning rate. The hyper-parameters epoch, batch size, and learning rate are set as 100, 128, and 5 *10−3 respectively as indicated in Table 2. A hundred epochs were used because we do not have a very big dataset, and input features are low-dimensional. The evaluation is performed by 10-fold cross-validation, and the averaged outcome for all cross-validations is given as the final result.
Table 2.
DNN initialization parameters.
| Parameter name | Parameter | Value |
|---|---|---|
| Train Epoch | Epoch | 100 |
| Batch size | Batch | 128 |
| Learning rate | Ƞ | 0.005 |
| L2 regularization | λ | 0.01 |
| Convolutional kernel | C | 1X3 |
| LSTM layers | L | 2 |
| LSTM units | P | 64 |
Abbreviation: DNN, deep neural networks; LSTM, long short term memory.
Experimental results
For each frame in a video, OpenPose 33 returns (1) JSON files for every frame containing pixel coordinates of each detected landmark and (2) a new video file in which a stick figure that represents the extracted joints is overlaid on the original video. MeTRAbs 34 pose estimator network detects 3D body pose for video frames and constructs corresponding time series. MediaPipe Pose is a multiperson pose estimation model has been used for skeletal extraction. Then, CGFs are calculated for DMD subjects and compared against those of TD children. To validate the accuracy, a few additional steps were investigated:
Data Preprocessing: Since the 2 datasets are different, it is crucial to ensure that they are comparable. This could involve normalizing and interpolating missing data points.
Pose Estimation Validation: For the DMD dataset, we validate the accuracy of the pose estimation algorithm by comparing its output with manually annotated key points in the video.
Comparison with Healthy Data: Once we have validated the pose estimation algorithms, we then compare the gait characteristics of the DMD patients with those of TD children. This would involve extracting similar features from both datasets (such as stride length, cadence, etc.) and comparing them.
Statistical Analysis: Finally, a statistical analysis was performed to determine if the differences in gait characteristics between DMD conditions and healthy children are statistically significant. Table 3 shows the mean and standard deviation (SD) for some extracted features of DMD children and their TD peers.
Table 3.
Descriptive statistics of DMD and control.
| Group | DMD | TD | ||
|---|---|---|---|---|
| Metrics | Mean | SD | Mean | SD |
| Stride time | 1.81 | 0.84 | 1.08 | 0.067 |
| Stride length | 1.39 | 0.16 | 1.57 | 0.1 |
| Cadence | 1.1 | 0.05 | 1.85 | 0.02 |
| Gait speed | 0.77 | 0.1363 | 1.45 | 0.15 |
| The knee angle | 20 | 5.76 | 15 | 3.87 |
| The hip angle | 64.03 | 5.67 | 58.8 | 2.3 |
Abbreviations: DMD, Duchenne muscular dystrophy; SD, standard deviation; TD,Typically Developed.
Participants with DMD have a longer stride time, while their cadence and gait speed were slower compared to the TD group. This is due to the progressive muscle weakness and reduced motor control associated with the condition. The stride time for the DMD group has a larger SD compared to the TD group, suggesting more variability in the time it takes for individuals in the DMD group to complete a stride. In agreement with earlier observation,26,30 compared to TD children, DMD conditions had significantly shorter stride length values. This suggests that children with DMD take considerably longer to complete a gait cycle compared to their TD peers. Duchenne muscular dystrophy individuals exhibit knee flexion angles of approximately 15° to 23° at initial contact. Individuals with DMD may exhibit knee hyperextension or reduced knee flexion, which can affect their walking patterns and overall mobility. A normal knee pattern for healthy individuals is presented in Figure 19A. Abnormal left and right knee patterns are indicated in Figure 19B and C, respectively. The DMD group has a larger hip angle compared to the HC. This is because the weakness in the hip extensor muscles can cause compensatory movement patterns, and DMD patients may use increased hip flexion and abduction during the swing phase to lift the leg off the ground and advance it forward.
Figure 19.

(A) Normal knee pattern over one gait cycle. (B) Left knee pattern for some DMD subjects. (C) Right knee pattern for some DMD subjects. DMD indicate Duchenne muscular dystrophy.
To evaluate different classifiers, ML and DNN are used to infer 2D and 3D key joint positions in 2D video image sequences. Receiver operating characteristics (ROC) curves show true-positive (sensitivity) and false-positive rates (1—specificity) for the 3 different feature sets. In particular, SVM in combination with 3D HPE performs well by delivering an accuracy of 96.2%. This demonstrates that the extracted CGFs carry important information for gait classification compared to the absolute values of patient keypoints features. Three-dimensional HPE (using MeTRAbs) restores the missing depth dimension more than 2D HPE (using OpenPose). The key joint positions in 3D HPE are inherently viewpoint invariant so that they are also free from occlusion. Figure 20 displays ROC plots of RBF kernels when CGFs are used as inputs to train the SVM classifier. Two-dimensional HPE achieves 89% which is reflected in the shape of the ROC plots. Clearly, both 3D and 2D HPE showed better performance compared to the skeletal information which gives 75% classification accuracy. Since the skeleton data contain only coordinates of the human key joints, which is highly abstract information, many connections for these coordinates are missed. As a result, CGFs extracted from skeletal joint positions extracted by the MediaPipe framework were not accurate enough to classify individuals based on their gait features.
Figure 20.
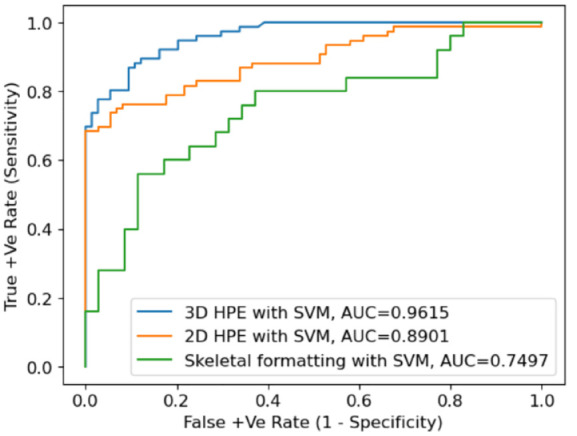
ROC curves for SVM classification. AUC indicates area under the curve; ROC, receiver operating characteristics; SVM, support vector machine.
Afterward, the estimated 2D and 3D key joint positions with CGFs extracted from the foot, knee, and hip were used as inputs. The batch size was 128, the number of epochs was 100, and Adam optimizer was employed for model optimization. The model accuracy, loss graphs, and ROC curves are demonstrated in Figure 21 for MeTRAbs 3D HPE, Figure 22 for OpenPose 2D HPE, and finally, Figure 23 for skeleton detection using MediaPipe.
Figure 21.

Accuracy, loss, and ROC curves for 3D HPE with DNN. DNN indicates deep neural networks; HPE, human pose estimation.
Figure 22.

Accuracy, loss, and ROC curves for 2D HPE with DNN. DNN indicates deep neural networks; HPE, human pose estimation.
Figure 23.

Accuracy, loss, and ROC curves for MediaPipe with DNN. AUC indicates area under the curve; DNN, deep neural networks.
Three-dimensional HPE has the lowest training and validation loss (0.1002 and 0.0998), indicating that it is performing the best among the 3 models. In addition, the highest validation accuracy of 93.1% is achieved with MeTRAbs in combination with DNN. The training accuracy is 93% while the area under the curve (AUC) is 97% which indicates that the model is performing better and can classify accurately between DMD and TD peers. MediaPipe framework when integrated with LSTM-CNN, the validation accuracy became 89.7%, the training loss was 0.12, and validation loss was 0.13 whereas the training accuracy was 89.3% and the AUC was 95%. Finally, 2D HPE extracted by OpenPose has the lowest validation accuracy of 89.6% and equal values of training loss and validation loss of 0.12. The training accuracy is 90% and the AUC is 96%. Overall, MeTRAbs seems to be performing the best among the 3 models based on its low loss values, high accuracy values, and high AUC value. MediaPipe and OpenPose are performing similarly, considering that MediaPipe has slightly better validation accuracy, and OpenPose has slightly better training accuracy. Furthermore, 3D HPE can sometimes locate body joints outside the image boundaries, which can result in complete estimates for truncated images. However, these methods are affected by pose-estimation performance and are, therefore, computationally expensive. For instance, 2D HPE by using OpenPose is computationally more demanding than 3D HPE by using MeTRAbs. Training time was greatly reduced for the skeleton-based extraction as the frame has an empty background and only a few keypoints with their connections proceeded. Although the MediaPipe framework gives fewer results, it is fast, lightweight, and very simple.
Such results show that gait parameters like knee flexion/extension angle can be accurately measured using pose estimation techniques. Therefore, 2D video gait analysis is possible by obtaining anatomical landmarks using 2D and 3D pose estimation techniques which in turn can be used to measure CGFs easily without the use of any markers. The 2D HPE was successful in extracting body parts from a small and blurred subject in an image or video. Even though, 3D HPE gives the best objective and quantitative information about the anatomical gait parameters and the deviations due to the muscular situation of DMD subjects. Although neural network achieves a higher accuracy, we believe that increasing the number of training data will enhance NN performance. Neural network typically requires a larger amount of training data and therefore performs suboptimally on smaller clinical databases. The proposed method demonstrates the workflow on DMD children and specifically defines a set of gait metrics. However, the same method can be customized to any patient population (e.g. Becker muscular dystrophy) and employ other metrics including gait deviation index (GDI), hip flexion, metabolic expenditure, and others.
Discussion
This study presents a novel framework for vision-based gait analysis, which has shown promising results in the quantitative assessment of gait impairments. The framework leverages advanced ML and deep learning techniques to extract and analyze spatiotemporal and sagittal kinematic gait features from 2D and 3D HPE trajectories. The proposed method introduces a cost-effective approach to gait analysis, relying on recorded RGB video data instead of traditional MoCap systems. This could potentially democratize access to gait analysis, making it more accessible to clinics and hospitals that may not have the resources for expensive MoCap equipment. In the development and application of the proposed framework, we are acutely aware of the sensitive nature of health-related data. We would like to emphasize that the privacy of all individuals involved in the study. The underlying dataset have been anonymized to ensure the privacy of the participants. Identifiable information was removed during the data preprocessing stage, and all analyses were conducted on de-identified data. This process ensures that the individuals’ identities remain protected while allowing for meaningful analysis of gait patterns. The study compares the effectiveness of different pose estimation techniques, including OpenPose, MeTRAbs, and MediaPipe, in extracting clinically relevant metrics. The results indicate that MeTRAbs, an end-to-end network for estimating complete, metric-scale poses from RGB images using metric-scale truncation-robust heatmaps, outperforms OpenPose and MediaPipe. The study also highlights the importance of using 3D HPE for gait analysis, as it provides more objective and quantitative information about anatomical gait parameters and deviations due to muscular situations in DMD subjects. It is worth mentioning that MediaPipe can be employed also for 2D pose estimation as presented in Figure 24.
Figure 24.

2D HPE using MediaPipe for DMD subjects. DMD indicates Duchenne muscular dystrophy; HPE, human pose estimation.
Moreover, MeTRAbs can be used as a 2D pose estimator from RGB images and complete the missing area in the image as predicted in Figure 25. That is, the output of MeTRAbs includes both 2D poses in pixel space as well as 3D poses in metric space. Different types of CGFs usually reflect meaningful and better classification results. This method does not rely on a particular view angle, but video clips must be long enough to have multiple gait cycles. While the current model has demonstrated high prediction accuracy in distinguishing between healthy subjects and those with DMD, it is important to note that the current model is capable of distinguishing between healthy subjects and those with DMD, but not specifically between DMD patients and patients with other gait impairments. This is an area for future research and development. The framework could potentially be adapted to analyze other types of gait impairments, given the appropriate training data.
Figure 25.

MeTRAbs for DMD symptoms diagnosis in 2D space. DMD indicates Duchenne muscular dystrophy.
This method has the potential to be widely investigated not only in medicine and welfare but also to predict the decline of gait function in healthcare, training, and skill evaluation in gyms, and sports facilities, and accurate projection of human movements onto an avatar by integrating with virtual reality systems.
Conclusion
This study presents a novel, cost-effective framework for vision-based gait analysis, leveraging advanced ML and deep learning techniques to extract and analyze spatiotemporal and sagittal kinematic gait features from 2D and 3D HPE trajectories. The results demonstrate the efficacy of the proposed method, with SVM in combination with 3D HPE delivering an accuracy of 96.2%, and deep learning with 3D HPE achieving an impressive accuracy of 97%. The framework’s potential extends beyond DMD to potentially include other types of gait impairments, given the appropriate training data. This study also highlights the importance of privacy and ethical considerations in handling sensitive health-related data. All data used in the study have been anonymized, and the research complies with all relevant ethical standards.
Future work could involve refining the model to distinguish between different types of gait impairments, expanding the benchmark dataset to include more diverse patient profiles, and conducting more research to validate the clinical applicability of this framework. We also aim to improve the proposed methodology to create specific models of different pathological gaits. This includes, but is not limited to, choreiform, hemiplegic, and diplegic gaits. By developing these specific models, we hope to enhance the precision and applicability of our framework for a wider range of gait impairments.
Footnotes
Funding: The author(s) received no financial support for the research, authorship, and/or publication of this article.
The author(s) declared no potential conflicts of interest with respect to the research, authorship, and/or publication of this article.
Author Contributions: MMA, MZ, and MMH participated in the design of the proposed gait analysis system for DMD diagnosis and classification. MMA and MMH led the software implementation. MMA and MZ. collected the datasets. MZ and MMH have been drawing all Figures and visualization results. MMA, MMH, and MZ participated in the preparation and review of the manuscript. All authors have read and agreed to the published version of the manuscript.
Availability of Data and Materials: The TD children dataset for different speeds angles and motion capture is accessible to the public at https://osf.io/3xqew/ (accessed on 20 June 2023). The DMD datasets used and/or analyzed during the present study are available from the corresponding authors upon reasonable request.
Ethical Approval: The authors have no relevant financial or non-financial interests to disclose. TD children benchmark used in this research is shared by Senden et al as part of the contributions in their published work and they obtained the ethics approval when capturing the data.
ORCID iD: Manal Mostafa Ali  https://orcid.org/0000-0001-7324-5349
References
- 1. Rueangsirarak W, Zhang J, Aslam N, Ho ESL, Shum HPH. Automatic musculoskeletal and neurological disorder diagnosis with relative joint displacement from human gait. IEEE Trans Neural Syst Rehabil Eng. 2018;26:2387-2396. [DOI] [PubMed] [Google Scholar]
- 2. Gao J, Gu P, Ren Q, Zhang J, Song X. Abnormal gait recognition algorithm based on LSTM-CNN fusion network. IEEE Access. 2019;7:163180-163190. doi: 10.1109/ACCESS.2019.2950254. [DOI] [Google Scholar]
- 3. Loureiro J, Correia PL. Using a skeleton gait energy image for pathological gait classification. Paper presented at: 2020 15th IEEE International Conference on Automatic Face and Gesture Recognition (FG 2020); 2020; Buenos Aires, Argentina. doi: 10.1109/FG47880.2020.00064. [DOI] [Google Scholar]
- 4. Sato K, Nagashima Y, Mano T, Iwata A, Toda T. Quantifying normal and Parkinsonian gait features from home movies: practical application of a deep learning–based 2D pose estimator. PLoS One. 2019;14:e0223549. [DOI] [PMC free article] [PubMed] [Google Scholar]
- 5. Jun K, Lee Y, Lee S, Lee D-W, Kim MS. Pathological gait classification using Kinect v2 and gated recurrent neural networks. IEEE Access. 2020;8:139881-139891. doi: 10.1109/ACCESS.2020.3013029. [DOI] [Google Scholar]
- 6. Guo Y, Deligianni F, Gu X, Yang G-Z. 3-D canonical pose estimation and abnormal gait recognition with a single RGB-D camera. IEEE Robot Autom Lett. 2019;4:3617-3624. doi: 10.1109/LRA.2019.2928775. [DOI] [Google Scholar]
- 7. Rahil M, Xi P, Shaoting Z, Ruisong L, Kang L. Automatic health problem detection from gait videos using deep neural networks. arXiv; 2020. doi: 10.48550/arXiv.1906.01480. [DOI] [Google Scholar]
- 8. Lonini L, Moon Y, Embry K, et al. Video-based pose estimation for gait analysis in stroke survivors during clinical assessments: a proof-of-concept study. Digit Biomark. 2022;6:9-18. doi: 10.1159/000520732. [DOI] [PMC free article] [PubMed] [Google Scholar]
- 9. Zhu M, Men Q, Ho ESL, et al. A two-stream convolutional network for musculoskeletal and neurological disorders prediction. J Medical Syst. 2022;46:76. doi: 10.1007/s10916-022-01857-5. [DOI] [PMC free article] [PubMed] [Google Scholar]
- 10. Kidziński Ł, Yang B, Hicks JL, Rajagopal A, Delp SL, Schwartz MH. Deep neural networks enable quantitative movement analysis using single-camera videos. Nat Commun. 2020;11:4054. doi: 10.1038/s41467-020-17807-z. [DOI] [PMC free article] [PubMed] [Google Scholar]
- 11. Khokhlova M, Migniot C, Morozov A, Sushkova O, Dipanda A. Normal and pathological gait classification LSTM model. Artif Intell Med. 2019;94:54-66. [DOI] [PubMed] [Google Scholar]
- 12. Thomas SS, Buckon CE, Nicorici A, Bagley A, McDonald CM, Sussman MD. Classification of the gait patterns of boys with Duchenne muscular dystrophy and their relationship to function. J Child Neurol. 2010;25:1103-1109. doi: 10.1177/0883073810371002. [DOI] [PMC free article] [PubMed] [Google Scholar]
- 13. McCay KD, Hu P, Shum HPH, et al. A pose-based feature fusion and classification framework for the early prediction of cerebral palsy in infants. IEEE Trans Neural Syst Rehabil Eng. 2022;30:8-19. doi: 10.1109/TNSRE.2021.3138185. [DOI] [PubMed] [Google Scholar]
- 14. Alaqtash M, Sarkodie-Gyan T, Yu H, Fuentes O, Brower R, Abdelgawad A. Automatic classification of pathological gait patterns using ground reaction forces and machine learning algorithms. In: Proceedings of the Annual International Conference of the IEEE Engineering in Medicine and Biology Society (EMBS). IEEE; 2011:453-457. doi: 10.1109/IEMBS.2011.6090063. [DOI] [PubMed] [Google Scholar]
- 15. Martinez-Murcia FJ, Ortiz A, Gorriz J-M, Ramirez J, Castillo-Barnes D. Studying the manifold structure of Alzheimer’s disease: a deep learning approach using convolutional autoencoders. IEEE J Biomed Health Inform. 2020;24:17-26. [DOI] [PubMed] [Google Scholar]
- 16. Ng K-D, Mehdizadeh S, Iaboni A, Mansfield A, Flint A, Taati B. Measuring gait variables using computer vision to assess mobility and fall risk in older adults with dementia. IEEE J Transl Eng Health Med. 2020;8:2100609. doi: 10.1109/JTEHM.2020.2998326. [DOI] [PMC free article] [PubMed] [Google Scholar]
- 17. Kubota K, Hanawa H, Yokoyama M, et al. Usefulness of muscle synergy analysis in individuals with knee osteoarthritis during gait. IEEE Trans Neural Syst Rehabil Eng. 2021;29:239-248. doi: 10.1109/TNSRE.2020.3043831. [DOI] [PubMed] [Google Scholar]
- 18. Slijepcevic D, Zeppelzauer M, Gorgas A-M, et al. Automatic classification of functional gait disorders. IEEE J Biomed Health Inf. 2017;22:1653-1661. doi: 10.1109/JBHI.2017.2785682. [DOI] [PubMed] [Google Scholar]
- 19. Munea TL, Jembre YZ, Weldegebriel HT, Chen L, Huang C, Yang C. The progress of human pose estimation: a survey and taxonomy of models applied in 2D human pose estimation. IEEE Access. 2020;8:133330-133348. doi: 10.1109/ACCESS.2020.3010248. [DOI] [Google Scholar]
- 20. Wang J, Tan S, Zhen X, et al. Deep 3D human pose estimation: a review. Comput Vis Image Underst. 2021;210:103225. doi: 10.1016/j.cviu.2021.103225. [DOI] [Google Scholar]
- 21. Lan G, Wu Y, Hu F, Hao Q. Vision-based human pose estimation via deep learning: a survey. IEEE Trans Hum-Mach Syst. 2023;53:253-268. doi: 10.1109/THMS.2022.3219242. [DOI] [Google Scholar]
- 22. Desmarais Y, Mottet D, Slangen P, Montesinos P. A review of 3D human pose estimation algorithms for markerless motion capture. Comput Vis Image Underst. 2021;212:103275. doi: 10.1016/j.cviu.2021.103275. [DOI] [Google Scholar]
- 23. Dang Q, Yin J, Wang B, Zheng W. Deep learning based 2D human pose estimation: a survey. Tsinghua Sci Technol. 2019;24:663-676. doi: 10.26599/TST.2018.9010100. [DOI] [Google Scholar]
- 24. Ferrer-Mallol E, Matthews C, Stoodley M, et al. Patient-led development of digital endpoints and the use of computer vision analysis in assessment of motor function in rare diseases. Front Pharmacol. 2022;13:916714. doi: 10.3389/fphar.2022.916714. [DOI] [PMC free article] [PubMed] [Google Scholar]
- 25. D’Angelo MG, Berti M, Piccinini L, et al. Gait pattern in Duchenne muscular dystrophy. Gait Posture. 2009;29:36-41. doi: 10.1016/j.gaitpost.2008.06.002. [DOI] [PubMed] [Google Scholar]
- 26. Romano A, Favetta M, Schirinzi T, et al. Evaluation of gait in Duchenne muscular dystrophy: relation of 3D gait analysis to clinical assessment. Neuromuscul Disord. 2019;29:920-929. doi: 10.1016/j.nmd.2019.10.007. [DOI] [PubMed] [Google Scholar]
- 27. Ricotti V, Kadirvelu B, Selby V, et al. Wearable full-body motion tracking of activities of daily living predicts disease trajectory in Duchenne muscular dystrophy. Nat Med. 2023;29:95-103. doi: 10.1038/s41591-022-02045-1. [DOI] [PMC free article] [PubMed] [Google Scholar]
- 28. Alanazi MA, Alhazmi AK, Alsattam O, et al. Towards a low-cost solution for gait analysis using millimeter wave sensor and machine learning. Sensors. 2022;22:5470. doi: 10.3390/s22155470. [DOI] [PMC free article] [PubMed] [Google Scholar]
- 29. Zheng Y, Weng Y, Yang X, Cai G, Cai G, Song Y. SVM-based gait analysis and classification for patients with Parkinson’s disease. In: 2021 15th International Symposium on Medical Information and Communication Technology (ISMICT). Xiamen, China; 2021:53-58. doi: 10.1109/ISMICT51748.2021.9434916. [DOI] [Google Scholar]
- 30. Ramli AA, Zhang H, Hou J, et al. Gait characterization in Duchenne muscular dystrophy (DMD) using a single-sensor accelerometer: classical machine learning and deep learning approaches. arXiv; 2021. https://arxiv.org/abs/2105.06295. [DOI] [PMC free article] [PubMed]
- 31. Albuquerque P, Verlekar TT, Correia PL, Soares LD. A spatiotemporal deep learning approach for automatic pathological gait classification. Sensors. 2021;21:6202. doi: 10.3390/s21186202. [DOI] [PMC free article] [PubMed] [Google Scholar]
- 32. Kim J, Seo H, Naseem MT, Lee C-S. Pathological-gait recognition using spatiotemporal graph convolutional networks and attention model. Sensors. 2022;22:4863. doi: 10.3390/s22134863. [DOI] [PMC free article] [PubMed] [Google Scholar]
- 33. Cao Z, Hidalgo G, Simon T, Wei S-E, Sheikh Y. OpenPose: realtime multi-person 2D pose estimation using part affinity fields. IEEE Trans Pattern Anal Mach Intell. 2021;43:172-186. doi: 10.1109/TPAMI.2019.2929257. [DOI] [PubMed] [Google Scholar]
- 34. Sárándi I, Linder T, Arras KO, Leibe B. MeTRAbs: metric-scale truncation-robust heatmaps for absolute 3D human pose estimation. IEEE Trans Biom Behav Identity Sci. 2021;3:16-30. doi: 10.1109/TBIOM.2020.3037257. [DOI] [Google Scholar]
- 35. Topham LK, Khan W, Al-Jumeily D, Hussain A. Human body pose estimation for gait identification: a comprehensive survey of datasets and models. ACM Comput Surv. 2022;55:1-42. doi: 10.1145/3533384. [DOI] [Google Scholar]
- 36. Wang L, Han R, Feng W. Combining the silhouette and skeleton data for gait recognition. Paper presented at: ICASSP 2023 – 2023 IEEE International Conference on Acoustics, Speech and Signal Processing (ICASSP); 2023; Rhodes Island, Greece. doi: 10.1109/ICASSP49357.2023.10096986. [DOI] [Google Scholar]
- 37. Han F, Reily B, Hoff W, Zhang H. Space-time representation of people based on 3D skeletal data: a review. Comput Vis Image Understand. 2017;158:85-105. [Google Scholar]
- 38. Vaughan CL, Davis BL, O’Connor JC. Dynamics of Human Gait. 2nd ed. Cape Town, South Africa: Kiboho Publishers; 1999. [Google Scholar]
- 39. Hollman JH, McDade EM, Petersen RC. Normative spatiotemporal gait parameters in older adults. Gait Posture. 2011;34:111-118. doi: 10.1016/j.gaitpost.2011.03.024. [DOI] [PMC free article] [PubMed] [Google Scholar]
- 40. Wu G, Siegler S, Allard P, et al. ISB recommendation on definitions of a joint coordinate system of various joints for the reporting of human joint motion—part I: ankle, hip, and spine. J Biomech. 2002;35:543-548. [DOI] [PubMed] [Google Scholar]
- 41. Hochreiter S, Schmidhuber J. Long short-term memory. Neural Comput. 1997;9:1735-1780. doi: 10.1162/neco.1997.9.8.1735. [DOI] [PubMed] [Google Scholar]
- 42. Senden R, Marcellis R, Meijer K, et al. Dataset of 3D gait analysis in typically developing children walking at three different speeds on an instrumented treadmill in virtual reality. Data Brief. 2023;48:109142. doi: 10.1016/j.dib.2023.109142. [DOI] [PMC free article] [PubMed] [Google Scholar]