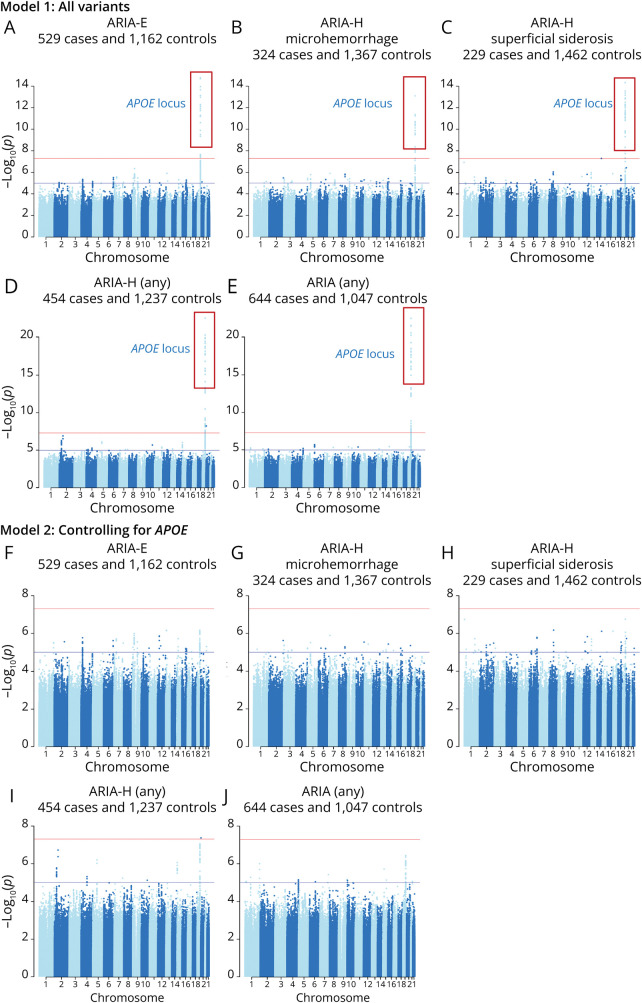
Figure. Manhattan Plots for GWAS for ARIA-E, ARIA-H Microhemorrhage, ARIA-H Superficial Siderosis, and Any ARIA.
All ARIA outcomes show a strong peak in the APOE locus (Model 1) and no additional genome-wide significant loci (as indicated by horizontal red line). Model 2, controlling for APOE-tagging SNPs, rs429358_C and rs7412_T, resulted in no genome-wide significant hits in any ARIA analysis, indicating a single independent peak within this locus. ARIA = amyloid-related imaging abnormality.

