

Significance
Water stands out as both the most abundant and anomalously behaving liquid. Experiments and simulations suggest that water’s anomalies arise from conflicting molecular orders that lead to phase separation of supercooled water into two distinct liquids under high pressures. Characterizing the liquid–liquid transition (LLT) in water has proven elusive due to the interference of rapid ice formation, a competition that has been challenging to reproduce in molecular simulations. This study demonstrates that a machine-learned monatomic water model enables successful modeling of both the LLT and ice crystallization. Our finding that water crystallizes most rapidly at the LLT explains why evading crystallization while studying this transition has been so formidable.
Keywords: water, polyamorphism, crystallization, glass transition, ice
Abstract
Mounting experimental evidence supports the existence of a liquid–liquid transition (LLT) in high-pressure supercooled water. However, fast crystallization of supercooled water has impeded identification of the LLT line TLL(p) in experiments. While the most accurate all-atom (AA) water models display a LLT, their computational cost limits investigations of its interplay with ice formation. Coarse-grained (CG) models provide over 100-fold computational efficiency gain over AA models, enabling the study of water crystallization, but have not yet shown to have a LLT. Here, we demonstrate that the CG machine-learned water model Machine-Learned Bond-Order Potential (ML-BOP) has a LLT that ends in a critical point at pc = 170 ± 10 MPa and Tc = 181 ± 3 K. The TLL(p) of ML-BOP is almost identical to the one of TIP4P/2005, adding to the similarity in the equation of state of liquid water in both models. Cooling simulations reveal that ice crystallization is fastest at the LLT and its supercritical continuation of maximum heat capacity, supporting a mechanistic relationship between the structural transformation of water to a low-density liquid (LDL) and ice formation. We find no signature of liquid–liquid criticality in the ice crystallization temperatures. ML-BOP replicates the competition between formation of LDL and ice observed in ultrafast experiments of decompression of the high-density liquid (HDL) into the region of stability of LDL. The simulations reveal that crystallization occurs prior to the coarsening of the HDL and LDL domains, obscuring the distinction between the highly metastable first-order LLT and pronounced structural fluctuations along its supercritical continuation.
The existence of a liquid–liquid phase transition (LLT) in supercooled water has been debated for over three decades (1, 2). Low-density amorphous (LDA) and high-density amorphous (HDA) ices are widely considered vitrified manifestations of the high- and low-density liquids (LDL and HDL), respectively, because their interconversion on compression and expansion has the sharpness and hysteresis typical of first-order transitions (3–5). However, it is not a foregone conclusion that the two nonequilibrium amorphous phases are the glasses of two distinct equilibrium liquids (6).
Isobaric cooling experiments have not been able to provide direct evidence of a LLT because water crystallization takes place before a transformation between the metastable liquids can be detected (7). However, recent ultrafast isochoric laser heating of HDA and LDA to drive water across the anticipated LLT has reported signatures consistent with the presence of a liquid–liquid transformation just before supercooled water crystallizes to ice I (8, 9).
Despite decades of efforts, the LLT line TLL(p) has not yet been directly established in experiments. The experimental limits of stability of LDA and HDA upon isothermal compression and decompression, respectively, extrapolate to a possible liquid–liquid critical point (LLCP) with critical temperature Tc ≈ 180 K and critical pressure pc ≈ 200 MPa (10). However, equations of state (EOS) of water parameterized from stable and supercooled liquid water support a LLT that ends at a LLCP with pc between 27 and 125 MPa (11–17).
Several all-atom water models have a LLT. These include the rigid nonpolarizable ST2 (18, 19), TIP4P/2005 (20) and TIP4P/Ice (20) models, as well as the flexible models q-TIP4P/F (21), E3B3 (22), WAIL (23), and the DPMD-SCAN neural network derived from density functional theory calculations (24). However, the high computational cost of all-atom models has hindered their use in addressing the interplay between LLT and crystallization observed in experiments (8, 9).
Coarse-grained (CG) models based on short-ranged anisotropic interactions (SRAI) are over 100 times computationally more efficient than the least expensive all atom models with long-range electrostatics (25, 26). The monatomic water model mW (25), based on the Stillinger–Weber potential (27), is the most studied of that class of models. While mW crystallizes in accessible simulation times (28–31), it does not have a LLT (32, 33). The more recently developed Machine-Learned Bond-Order Potential (ML-BOP) (26) is a CG SRAI water model based on the Tersoff potential (34) that crystallizes in accessible simulation times (26, 35), while reproducing the anomalies and equation of state of liquid water with the accuracy of TIP4P/2005, and the experimental melting line of ice Ih with the accuracy of TIP4P/Ice (35). ML-BOP captures well the pressure dependence of the height g2 of the second peak of the oxygen-oxygen radial distribution function of water (35), as well as the pressure-induced amorphization of ice Ih and the structure and phase behavior of LDA and HDA and their interconversion on compression and expansion (36). In what follows we show that ML-BOP has a LLT, with a critical point very close to those of TIP4P/2005 and TIP4P/Ice models (20, 37). We further demonstrate that ML-BOP reproduces the competition between LLT and crystallization of ultrafast HDL decompression experiments (9), and that the LLT coincides with the temperature of maximum ice crystallization rate of the model.
ML-BOP Has a LLT
One of the characteristics of a liquid approaching a critical point is the increase of the correlation length of density fluctuations. These long-range density fluctuations can be trapped during vitrification and appear as static correlations in the glass (38). Debenedetti et al. demonstrated that glasses made by isobaric cooling of TIP4P/2005 display a pronounced maximum in long-range density correlations near the pressure of the LLCP of that model, while these correlations are muted in the mW model and inexistent in a Lennard-Jones fluid (38). We cooled a periodic simulation cell with 8,000 ML-BOP molecules from the liquid to the glass at 10 K ns−1 at various pressures and characterize the extent of long-range correlations by extrapolation of the structure factor S(q) to zero wavevector (38) (SI Appendix, section A).
Fig. 1 shows that ML-BOP displays a pronounced increase of long-range structural correlations at both negative and positive pressures. The increase in correlations at negative pressures arises from the instability of the liquid against cavitation (35), while the increase at positive pressures is associated to a phase transformation in the supercooled liquid. The extrapolated long-range correlations of ML-BOP at positive pressures are most pronounced at 180 MPa and 177 K (Fig. 1 A and B), suggesting that to be close to the location of the LLCP.
Fig. 1.

Long-range correlations in ML-BOP along vitrification simulations. The correlations are represented by the extrapolated zero wavenumber structure factor, S(0) as a function of (A) temperature and (B) pressure, computed from cooling simulations with 8,000 water molecules at 10 K ns−1 rate following the procedure of ref. 38 (see SI Appendix, Figs. S1 and S2 in SI Appendix, section A). The uncertainties computed from 10 independent simulations are shown as shaded error regions in (A) and as error bars in (B). The amount of ice in the hyperquenched glasses at 77 K is ~5% (36) is consistent with the fraction of ice in experiments at the minimum cooling rate needed for vitrification of water (39).
To determine the location of the LLT and critical point of the ML-BOP model, we perform isothermal–isobaric simulations with a cell containing 192 molecules, following ref. 24. The small cell enables the sampling of phase coexistence between LDL and HDL through system-wide oscillations of the density and structure of the liquid as a function of time (SI Appendix, Figs. S3–S6), while also delaying the formation of ice. The timescales of the oscillations between the two liquids in ML-BOP are shorter than in all-atom models of water (20, 24), consistent with the faster translational dynamics of the coarse-gained model (26). We sample the density ρ and potential energy E of the 192 water molecule periodic cell over 15 independent trajectories at each T and p, collecting data until the onset of crystallization (SI Appendix, Figs. S9–S12), and compute the free energy from the corresponding histograms. Fig. 2 shows that the free energy profiles as a function of liquid density at pressure above 170 MPa have two well-defined minima, corresponding to the HDL and LDL phases. We identify the liquid–liquid temperatures TLL(p) as the T-p loci where the two liquid phases have the same free energies G(ρ) (Fig. 3 A and B).
Fig. 2.
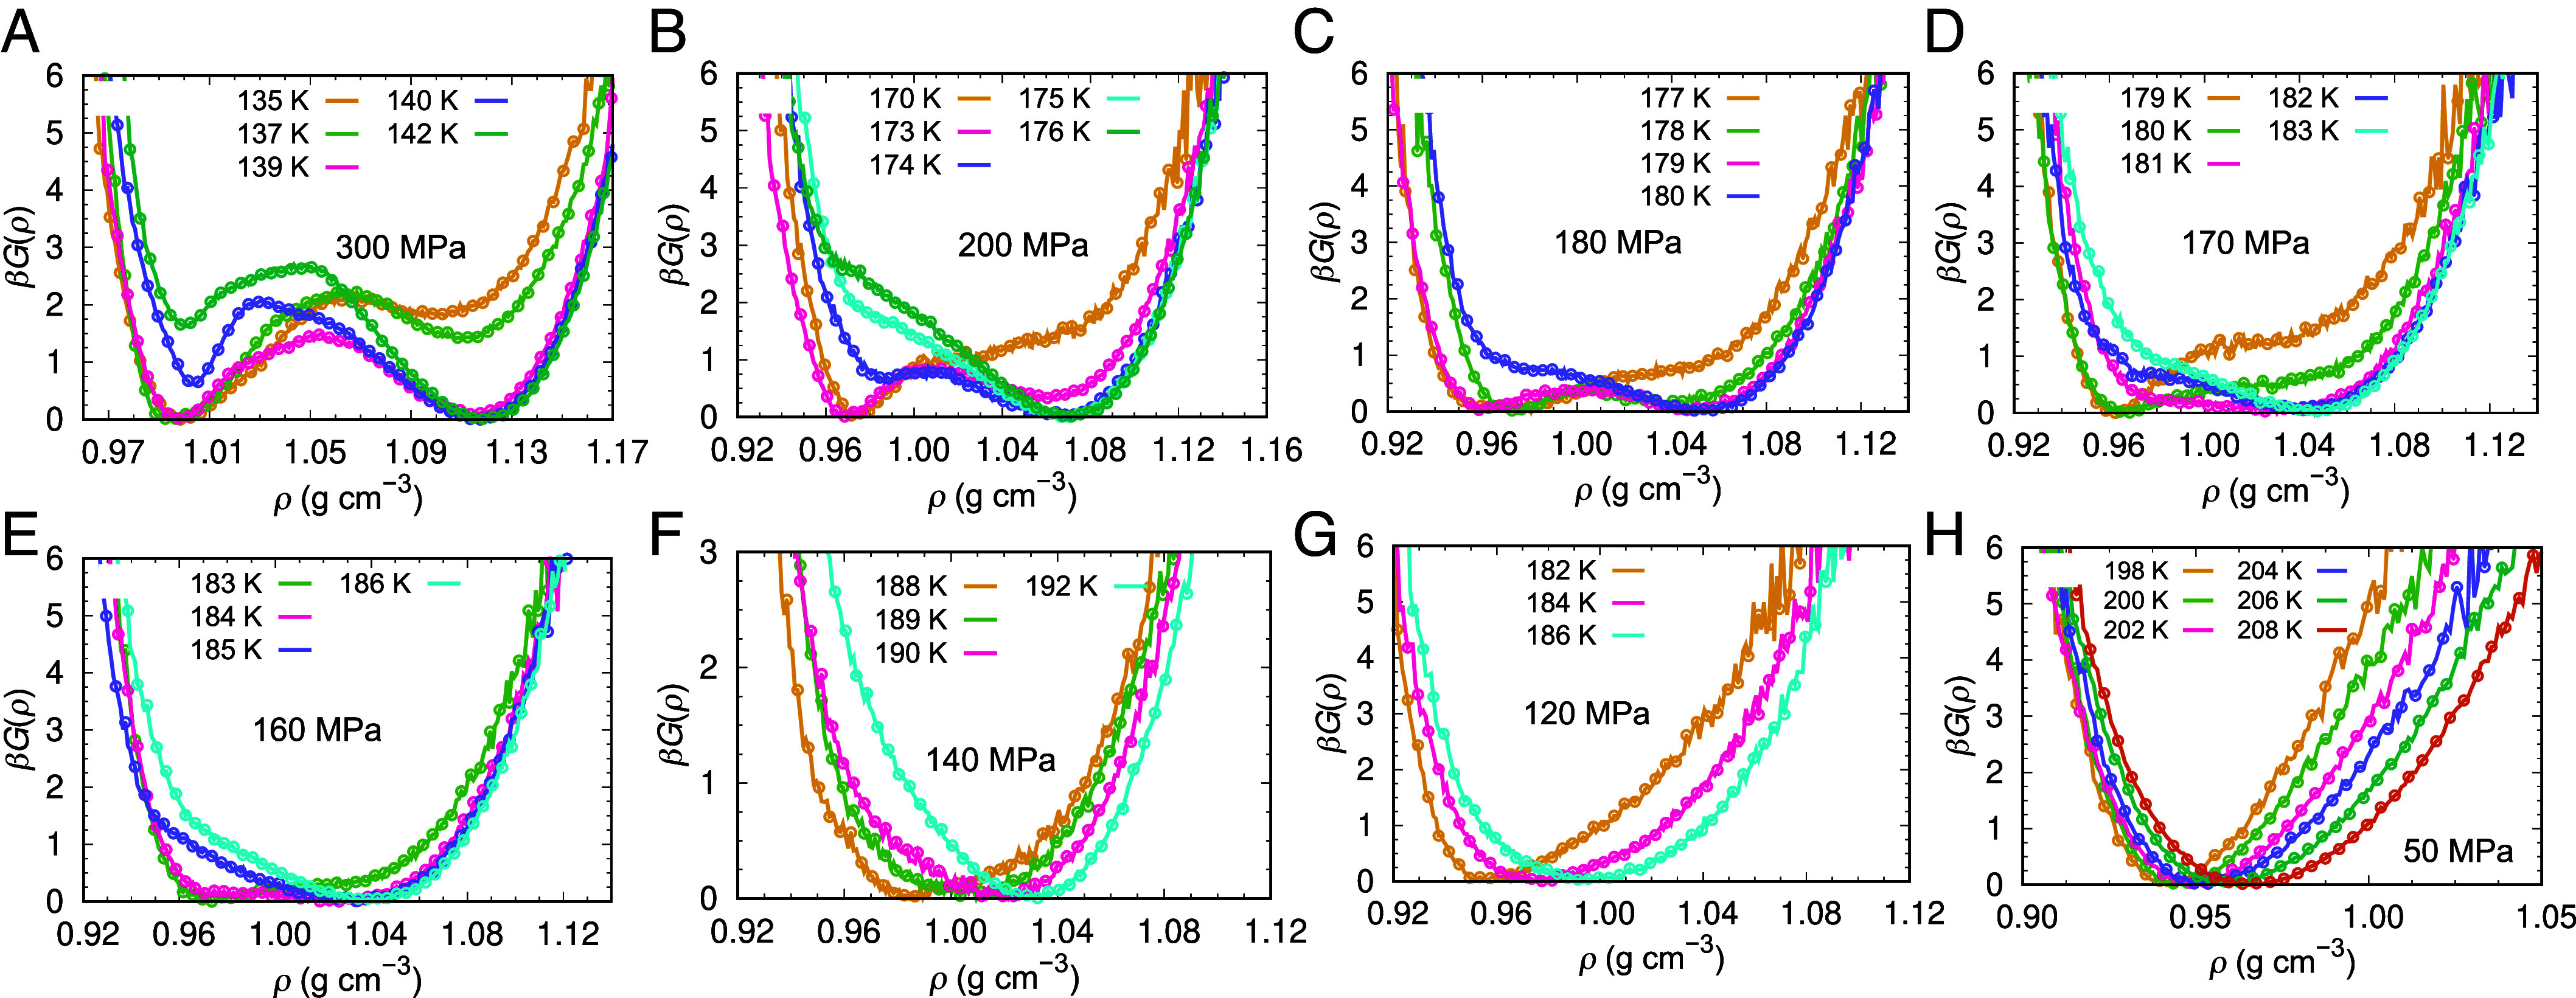
Free energy profiles of supercooled liquid ML-BOP as a function of density ρ, normalized by the thermal energy β−1 = RT. Each panel presents free energy profiles at the temperature indicated in the graphs and pressures (A) 300 MPa, (B) 200 MPa, (C) 180 MPa, (D) 170 MPa, (E) 160 MPa, (F) 140 MPa, (G) 120 MPa, and (H) 50 MPa. We identify 170 MPa as the critical pressure: At p > 170 MPa, there are temperatures with two basins for stable and/or metastable HDL and LDL, while at p < 170 MPa, there is only one minimum in the free energy landscape of the liquid. Sampling used for the calculation of TLL(300 MPa) (SI Appendix, Figs. S5 and S6) may be insufficient because of its closeness to Tg(300 MPa) (Fig. 4). SI Appendix, Fig. S8 presents snapshots of HDL and LDL in coexistence in the small simulation cell.
Fig. 3.
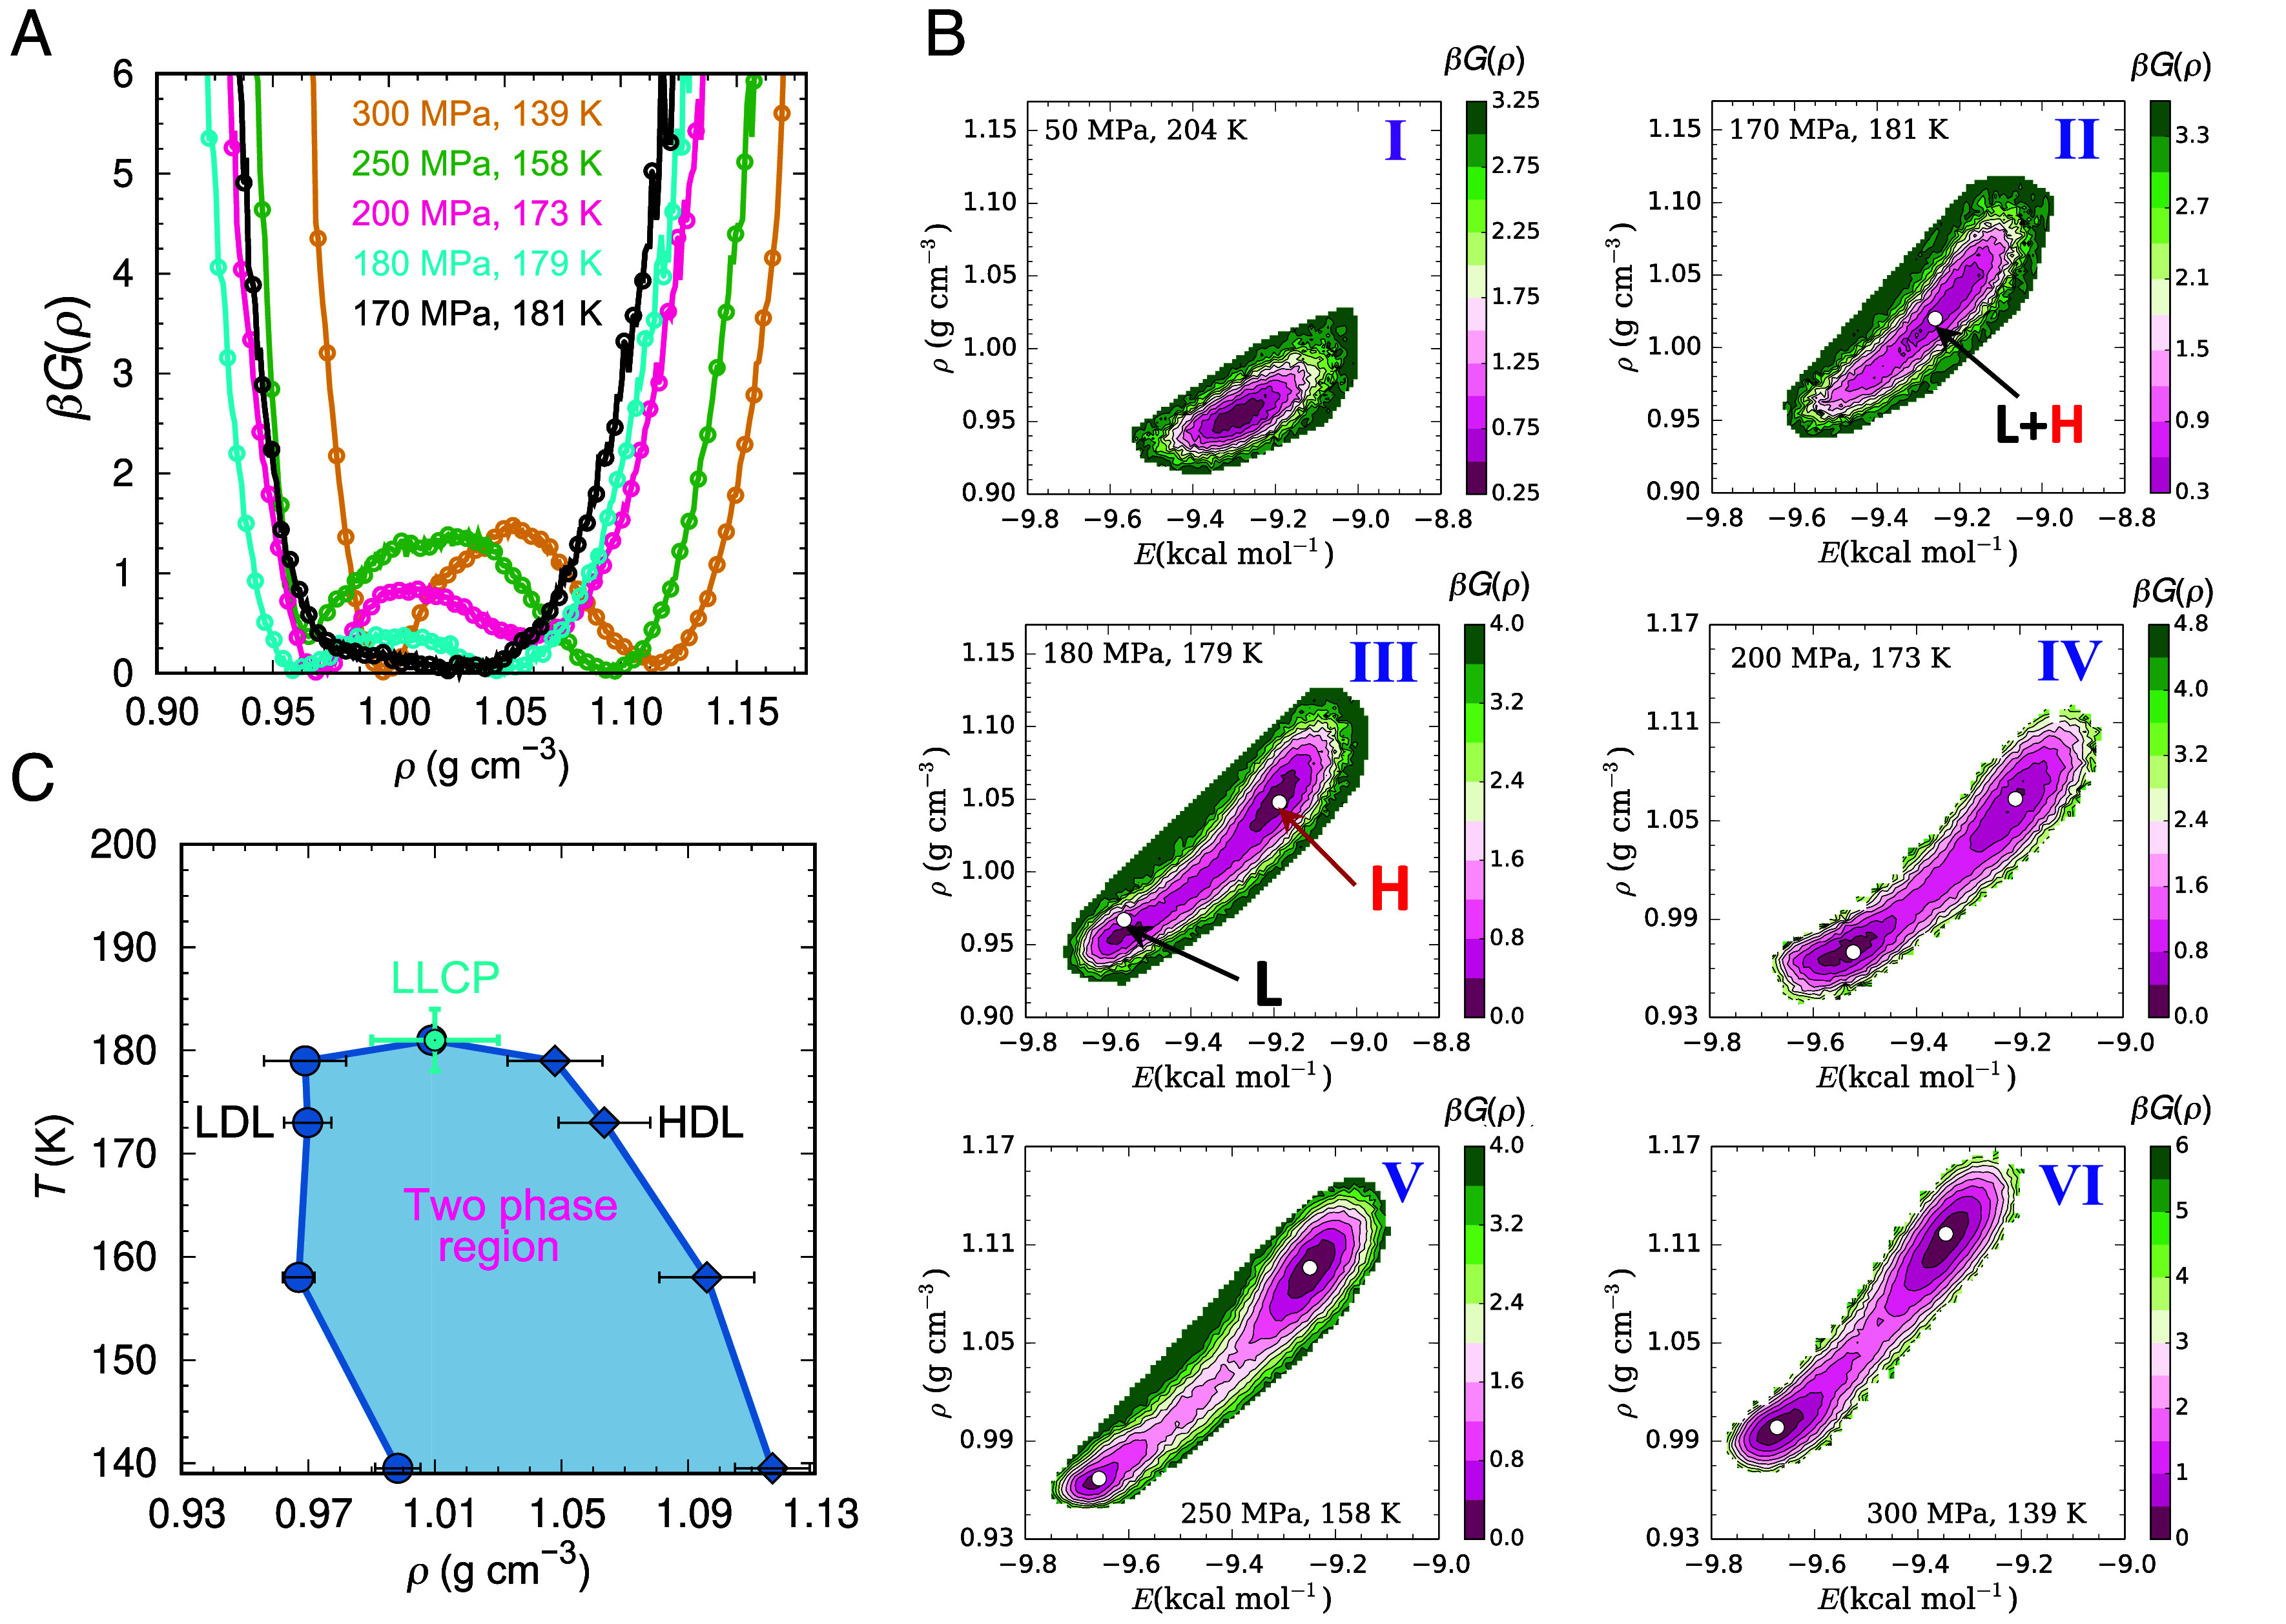
Liquid–liquid equilibrium in ML-BOP water. (A) Free energy as a function of density ρ along the LLT line. (B) Two-dimensional free energy as a function of density ρ and potential energy E for the state points of panel (A), as well as a supercritical liquid at 50 MPa and 204 K. The p and T are indicated in each I to VI panel. Panel (B) II corresponds to the LLCP. (C) T-ρ phase diagram of supercooled ML-BOP showing in light blue the region of two-phase coexistence.
The free energy basins for the two liquids merge at 170 MPa and 181 K (Fig. 3 A and B). As the maximum in extrapolated S(0) at 170 and 180 MPa are identical within their error bars (Fig. 1A), we assess that the LLCP of ML-BOP is located at pc = 170 ± 10 MPa and Tc = 181 ± 3 K. The critical density is ρc = 1.01 ± 0.02, same as for TIP4P/2005 and TIP4P/Ice (20). A study of the potential energy landscape of ML-BOP published when this manuscript was under review concurs that the model has a LLCP located at 175 ± 10 MPa and 181.5 ± 1 K (40). We estimate that the liquid–liquid surface tension is ~1 mJ m−2 at 300 MPa, comparable to the ~2 mJ m−2 reported for ST2 (19). The negative dρ/dT slopes of the LDL and HDL sides of the binodal of the LLT of ML-BOP (Fig. 3C) are consistent with predictions by EOS based on experimental water data (8).
Fig. 4 displays the phase diagram of ML-BOP. The ice-liquid equilibrium temperatures Tm(p) (35) are listed in SI Appendix, Table S1. The liquid–liquid equilibrium temperatures TLL(p) of ML-BOP obtained from the free energy calculations (Figs. 2 and 3) are shown with blue circles and listed in SI Appendix, Table S2. The LLCP of ML-BOP aligns closely with that reported for TIP4P/2005, TIP4P/Ice and other all-atom water models (17, 18, 20, 22, 23, 41) (Table 1). Indeed, SI Appendix, Fig. S13A shows that the TLL(p) of ML-BOP is almost indistinguishable from the one predicted for TIP4P/2005 from its two-state equation of state (TSEOS) (37).
Fig. 4.

Phase diagram of ML-BOP water. The black line shows the equilibrium melting line of hexagonal ice TmIh(p) (SI Appendix, Table S1) (35). The blue line shows the average between the LLT temperatures TLL(p) computed from large-scale isoenthalpic decompression simulations of HDL (blue circles) and the TLL(p) determined from free energy calculations with a small cell (blue triangles) (SI Appendix, Table S2). The cyan circle and cyan triangle indicate the LLCP, located at pc = 170 ± 10 MPa and Tc = 181 ± 3 K (free energy calculations) or Tc = 184 ± 1 K (NpH decompression of HDL). The open blue circles indicate the temperature of maximum heat capacity in the supercritical extension of the LLT (SI Appendix, Table S2). The magenta line shows the nonequilibrium line of maximum crystallization rate Tx(p) determined by isobaric cooling of simulation cells with 8,000 or 216,000 ML-BOP water molecules at the fastest cooling rate qc that results in crystallization of at least ~10% of the molecules, except for 300 MPa for which is 6% (SI Appendix, Figs. S21–S23 and Tables S2 and S3). The green line represents the glass transition temperature Tg(p) on 10 K ns−1 cooling simulations (wider p range presented in SI Appendix, Fig. S24). The purple dashed line is the extrapolation of the LLT and TCpmax using a 3rd order polynomial. The gray line shows the temperature of maximum structural correlations TS(p) upon isobaric cooling at 10 K ns−1 (Fig. 1). The red triangle at 360 MPa and 110 K indicates the intersection of the extrapolated TLL(p) with Tg(p). The red square shows that the extrapolated pressure for TLL(p) = 78 K is 410 MPa. SI Appendix, Fig. S13B presents a zoomed view of the phase diagram focused on TLL(p) and Tx(p).
Table 1.
Liquid–liquid critical pressure pc and temperature Tc for various water models
| Water model | pc (MPa) | Tc (K) |
|---|---|---|
| ML-BOP | 170 ± 10 | 181 ± 3* (184 ± 1†) |
| ML-BOP‡ | 175 ± 10 | 181.5 ± 1 |
| TIP4P/2005§ | 170 | 182 |
| TIP4P/2005¶ | 186.1 ± 0.9 | 172 ± 1 |
| TIP4P/Ice# | 173.9 ± 0.6 | 188.6 ± 1 |
| TIP4P/Ice|| | 165 ± 15 | 195 ± 5 |
| ST2** | 167 ± 24 | 237 ± 4 |
| E3B3†† | 210 ± 10 | 180 ± 2 |
| WAIL‡‡ | 36.5 ± 0.8 | 210.5 ± 0.3 |
| DeePMD§§ | 268.7 ± 0.68 | 224 ± 3 |
| q-TIP4P/F¶¶ | 167 ± 9 | 159 ± 6 |
†Tc computed from the isoenthalpic decompression of HDL to 170 MPa, SI Appendix, Fig. S16.
‡Computed from the potential energy landscape in ref. 40.
§Computed from TSEOS in ref. 37.
¶Computed using 3D Ising fit in ref. 20.
#Computed using 3D Ising fit in ref. 20.
||Computed from Maxwell construction in ref. 17.
**Computed using histogram reweighting Monte Carlo simulations in grand canonical ensemble in ref. 18.
††Computed from the extrapolation of extrema in kT and Cp in ref. 22.
‡‡Computed from TSEOS in ref. 23.
§§Computed from TSEOS in ref. 41.
¶¶Computed from TSEOS in ref. 21.
It is intriguing that the LLCP of ML-BOP, TIP4P/2005, and TIP4P/Ice are in good agreement with the extrapolation of the crossing of the limit of stability of the low- and high-density amorphous ices in experiments (8, 10), although those extrapolations carry significant uncertainty. More recent analyses suggest that the LLCP of water is located at Tc = 195 to 210 K and pc =100 to 125 MPa (11, 13, 17).
ML-BOP Replicates the Competition between LLT and Crystallization Observed in Ultrafast Experiments on Water
Having established the existence of a metastable LLT in ML-BOP, we investigate the interplay between LLT and ice crystallization through large-scale nonequilibrium simulations. Our approach is inspired by experiments of Kim et al. that monitored the populations of HDL, LDL, and ice as HDL decompressed from 250 to 350 MPa and ~205 K toward room pressure (Fig. 5A) (9). Heat transfer to the cold surroundings was estimated to occur in ~100 μs, and decompression to 0.1 MPa in ~10 ns to 100 μs (8, 9).
Fig. 5.
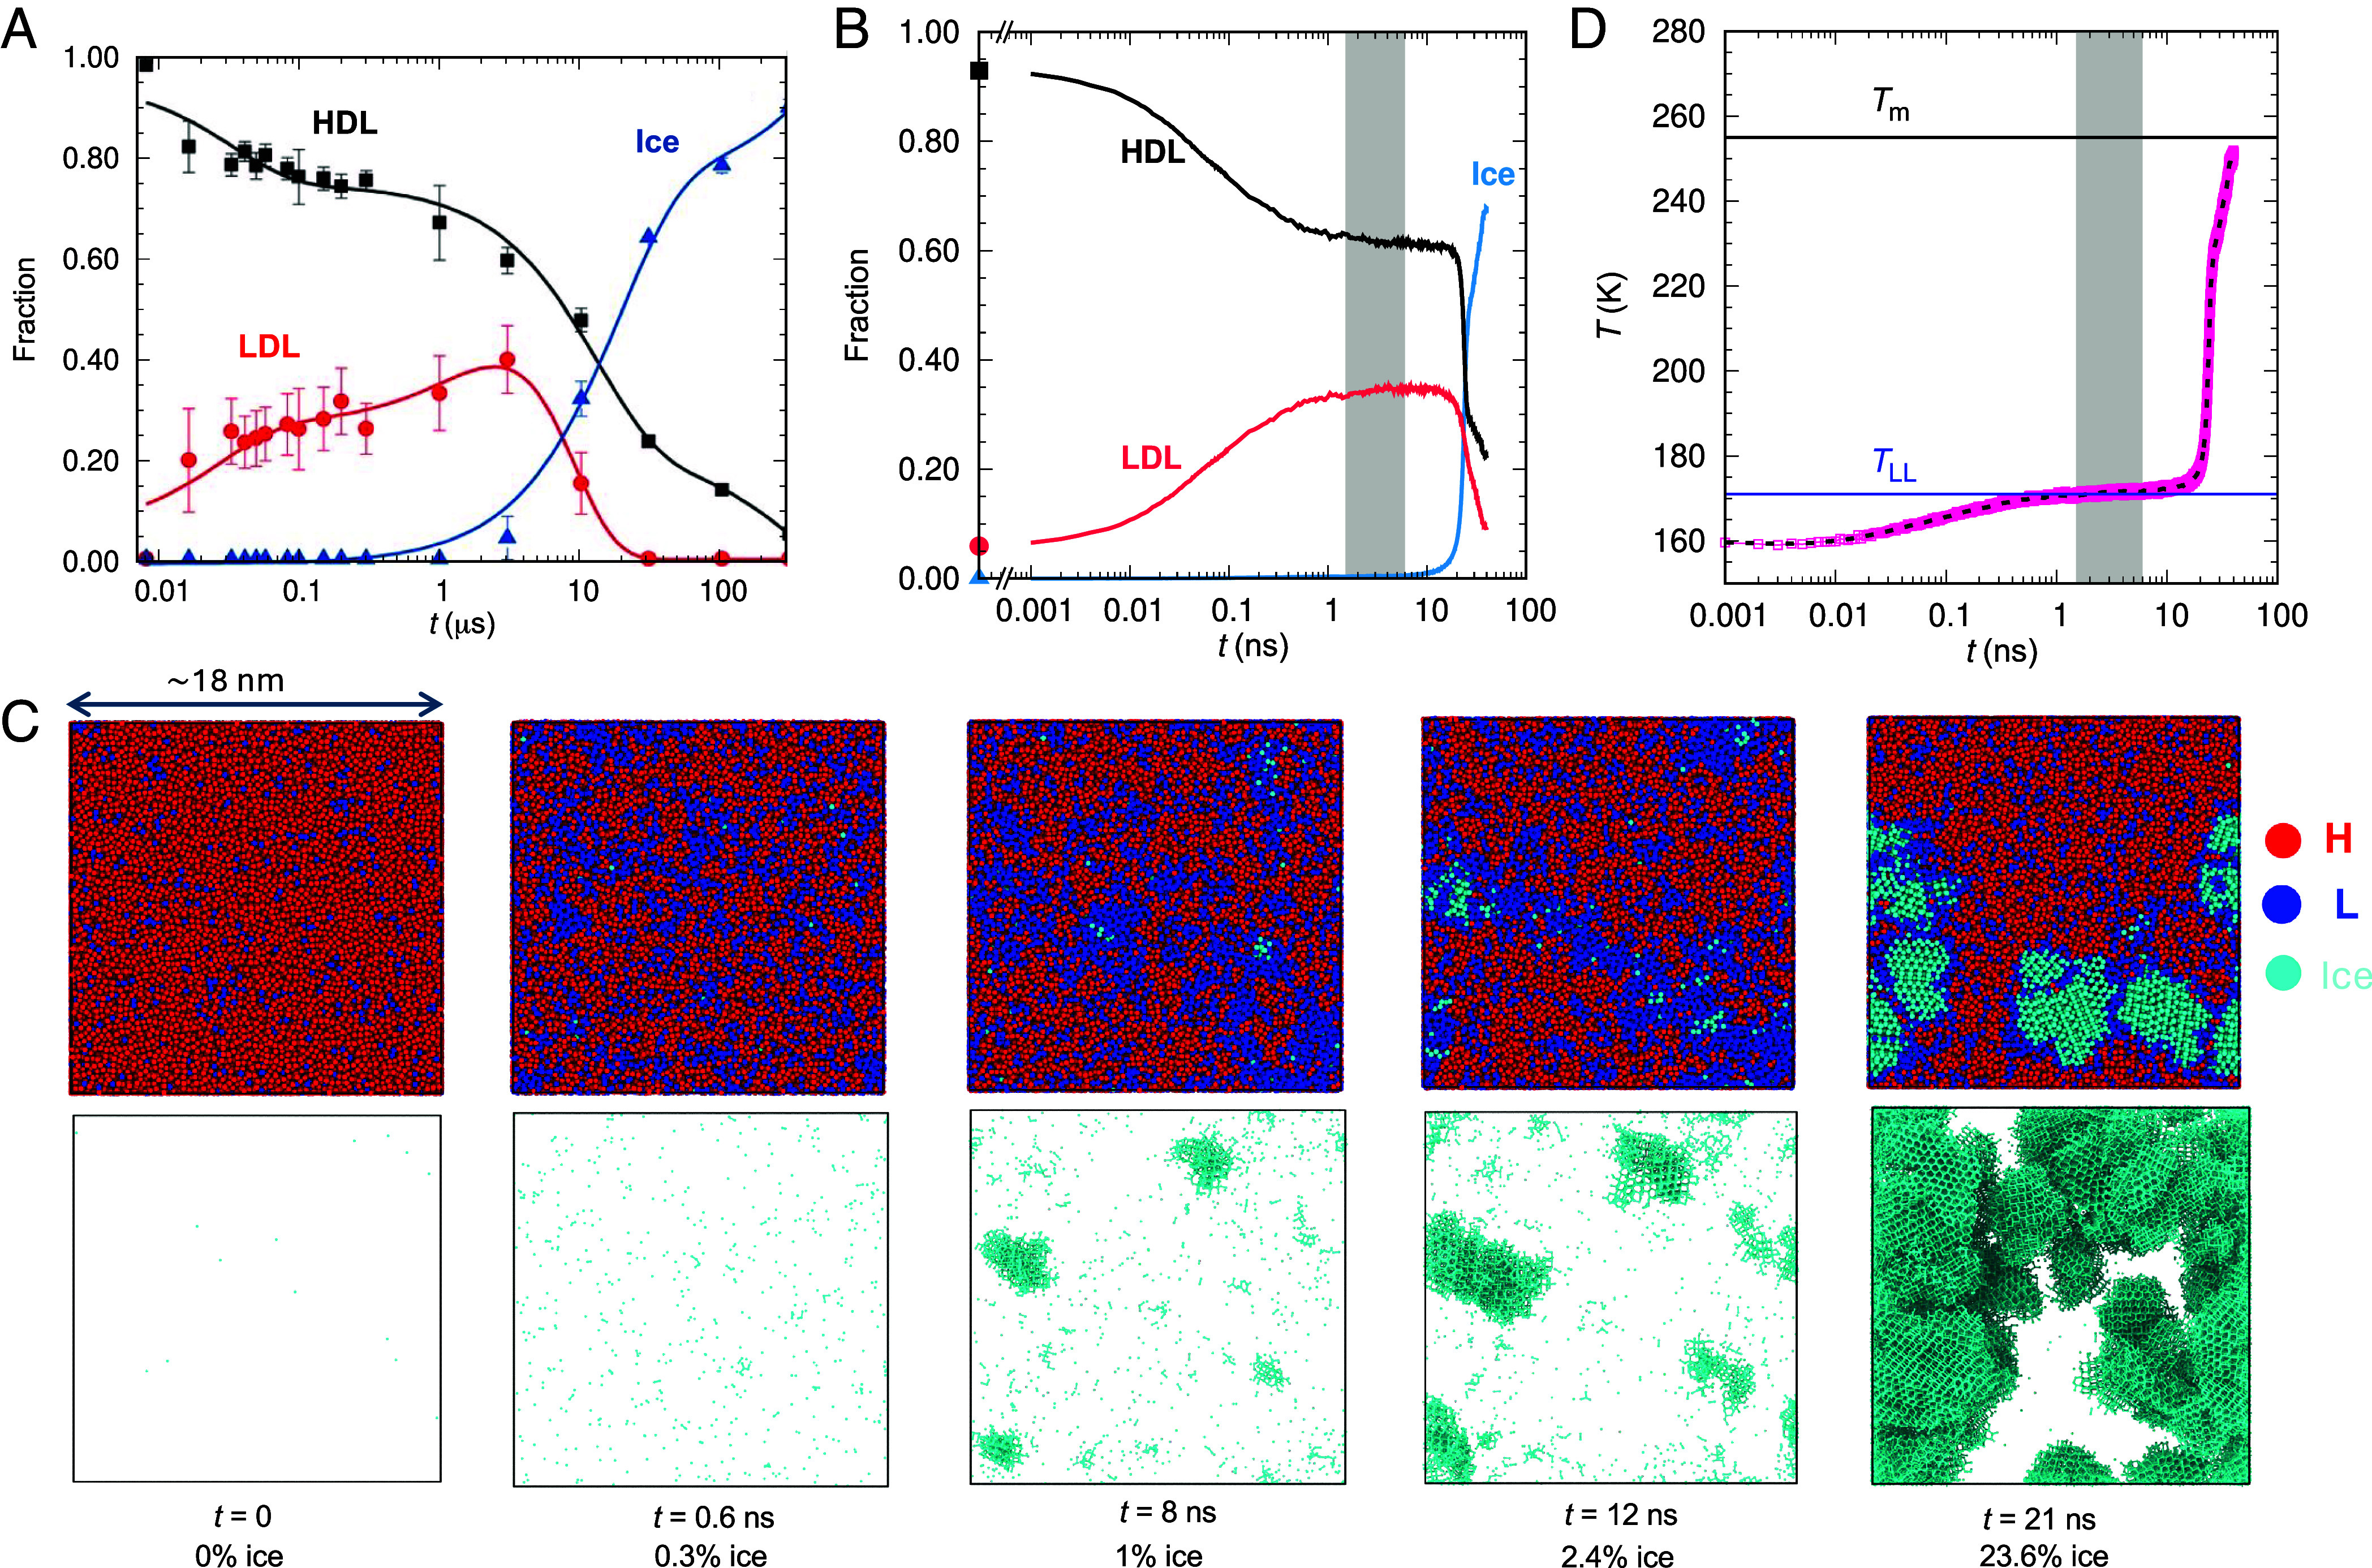
LLT and crystallization upon decompression of HDL into the region of stability of LDL. (A) Experimental conversion of HDL into LDL and ice upon decompression of the high-density liquid prepared by isochoric heating of e-HDA to ~205 K and 250 to 350 MPa (9). The continuous increase in the ratio of LDL to HDL with time may stem from slow decompression or heat exchange to the surroundings. (B) Conversion of HDL into LDL and ice upon isoenthalpic decompression of HDL from 160 K and 400 to 215 MPa in a simulation cell with 216,000 ML-BOP molecules. (C) Snapshots along the evolution of the simulation of isoenthalpic decompression of HDL at 215 MPa, times since decompression and percent of ice indicated at the Bottom. Snapshots in the Upper row show all ML-BOP molecules, classified as high-coordination liquid H (red), low-coordination liquid L (blue), and ice (cyan). The Lower panel shows only the ice in these configurations. Movie S1 presents the 21 first ns of the evolution of the simulation cell. (D) Evolution of the temperature along the decompression simulation. The blue line signals TLL(215 MPa) = 171 K, and the black line the ice-liquid equilibrium Tm(215 MPa) = 255 K. The gray region in (B) and (D) represents the center of the liquid–liquid coexistence plateau region. The integrated low q intensity of the structure factor in the simulation (SI Appendix, Fig. S17) has the same behavior as in the experiment.
In our simulations, we instantaneously decompress HDL equilibrated at 160 K and pressures either 400 or 255 MPa to a final pressure where HDL is unstable. We conduct our simulations at constant pressure and enthalpy (NpH ensemble), to model the slow heat transfer of the experiment (9). Previous modeling efforts have explored the decompression of HDL across the LLT and its supercritical continuation for TIP4P/Ice (42) and ST2 (43) along isothermal pathways with linearly decreasing pressure. However, isothermal decompression pathways result in complete transformation of HDL to LDL (42, 43), without the two-phase coexistence plateau depicted in Fig. 5A. The all-atom simulations did not reach the microsecond timescales at which ice formation was observed in the experiments (Fig. 5A).
We classify the molecules in the liquid as LDL-like (L) if they have local coordination 4, and as HDL-like (H) if they have higher coordination; ice is identified using CHILL+ (44). Fig. 5B presents the populations of H, L, and ice for a simulation cell with 216,000 ML-BOP molecules instantaneously decompressed from 160 K and 400 to 215 MPa, in the two-phase region above pc. ML-BOP captures the stages of structural evolution of water in the experiment, including the fast partial conversion of HDL to LDL, the coexistence of the two liquids, and the formation of ice (Fig. 5 A and B). The isoenthalpic simulation with ML-BOP captures all stages of the ultrafast HDL decompression experiment.
The time scales to reach the HDL-LDL plateau and to crystallize 2.5% of the liquid are ~200 times shorter in ML-BOP than in water. The speedup is consistent with the faster dynamics of the high-density liquid of the monatomic model, which at 0.1 MPa has a diffusion coefficient ~20 and ~200 times larger than water at 227 K and 210 K, respectively (26, 45). The less pronounced temperature dependence of the diffusion coefficient of ML-BOP (26) leads to a larger increase in mobility with respect to water at lower temperatures (36).
SI Appendix, Fig. S15 shows that the isoenthalpic decompression of HDL to 215 MPa reproduces the rise and fall of the integrated small angle region of the structure factor reported in the HDL decompression experiments of Kim et al. (9). The simulations indicate that the decrease in integrated SAXS signal from 0.1 to 0.3 Å−1 originates in the growth of ice crystals, and not in further coarsening of the liquid domains. The S(q) peak around 2.15 Å−1 characteristic of HDL continuously moves toward the 1.7 Å−1 position of LDA (36) along the decompression simulation (Movie S2). The same was observed in simulations of isothermal decompression of TIP4P/Ice and ST2 models across their LLT (42, 43). In contrast to the simulations, the experimental S(q) was shown to change mostly in the intensity of the peaks assigned to HDL and LDL, with minor alterations in their positions (9). However, it is worth noting that the HDL in that study was prepared by heating e-HDA, which also exhibits a “two-phase” evolution of S(q) when heated at 0.1 MPa (46), despite the absence of a first-order LLT in water at ambient pressure (45).
Movie S1 offers a molecularly resolved perspective on the structural changes occurring during the decompression of HDL to produce LDL and ice at 215 MPa. Initially, the decompression of HDL generates patterns of H and L domains characteristic of spinodal decomposition (Fig. 5C and Movie S1), consistent with results from isothermal decompression ramps (42, 43). The exothermic transition from HDL to LDL (Fig. 3B) rises the temperature to a plateau (Fig. 5D) where the two liquids coexist (Fig. 5B). That coexistence temperature is TLL.
TLL(p) computed from the plateau of decompression simulations with p = 170 to 250 MPa (SI Appendix, Fig. S16) is consistently 3 K above the ones obtained from the liquid–liquid oscillations of the cell containing 192 molecules (SI Appendix, Table S2 and Fig. 4). This small discrepancy could stem from a bias in the weighting of HDL and LDL populations used to compute the free energies, given that ice tends to crystallize more readily from LDL, or it might indicate a finite-size effect. However, our investigations reveal no discernible difference in the TLL(p) values obtained by decompressing HDL from 400 to 215 MPa using cells containing 216,000, 8,000, 4,000, or 2,000 molecules (SI Appendix, Fig. S17 A and B). Remarkably, even simulations comprising as few as 1,000 molecules exhibit a temperature plateau, albeit with larger fluctuations, and crystallization time comparable to those observed in the largest cells (SI Appendix, Fig. S17C).
The relative insensitivity of the decompression results to cell size seems to originate in the formation of ice at the liquid–liquid line before the coarsening of the LDL and HDL domains extends beyond a few nanometers (Fig. 5 and Movie S1). In the next section, we show that the LLT is the locus of maximum crystallization rate, at which the crystallization times τx(p) are predicted to be independent of the sample size (30, 47), provided that the properties are not limited by finite-size effects. Our simulations suggest that isoenthalpic decompression utilizing cells as small as 1,000 to 4,000 molecules may offer a promising avenue to explore the interplay between LLT and crystallization in microseconds-long simulations with all-atom models.
Is the response to decompression different at the critical pressure? Movie S3 shows the evolution of H, L, and ice for a 216,000 ML-BOP simulation cell of HDL at 160 K and 255 MPa decompressed to 170 MPa, which is at or close to the critical pressure pc =170 ± 10 MPa. Movie S4 shows only the ice along the same simulation, and SI Appendix, Fig. S16 the temperature evolution. The impossibility to grow long-range density correlations before crystallization heats the system away from the LLCP results in a response at the critical point indistinguishable from that on the liquid–liquid line.
We find that the proportion of molecules identified as ice increases steadily along the liquid–liquid coexistence plateau (Fig. 5C and SI Appendix, Fig. S18). While some of these “ice” molecules may be intrinsic to the structure of LDL, their continuous increase implies that LDL of ML-BOP cannot be fully equilibrated before the onset of crystallization. Furthermore, because ice clusters do not become apparent in the structure factor S(q) (Movie S2) until they contain a few hundred molecules, they could potentially remain undetected in the S(q) used to calculate populations in the experiments.
The response of HDL to decompression to the region of stability of the LDL is the same in the two-phase, critical, and supercritical liquid–liquid pressures. SI Appendix, Figs. S16 and S18–S20 show that HDL decompressed to p < pc results in structural and thermal response indistinguishable from that to pressures along the LLT. The temperature first increases due to the exothermic conversion of high- to low-coordination environments, heating the system to the locus of high heat capacity along the supercritical continuation of the LLT. We approximate that the T(t) plateau corresponds to the temperature of maximum heat capacity, TCpmax(p); a more accurate mapping of Cp(T) = (dH/dTplateau)p could be obtained from decompression of HDL with different initial enthalpies. We conclude that rapid crystallization preceding the coarsening of high- and low-coordination domains blurs the distinction between the highly metastable short-lived liquid–liquid equilibrium and pronounced structural fluctuations along the Widom line.
Ice Crystallization Is Fastest at the LLT and Its Supercritical Continuation
While the experiments of decompression of HDL (9) or compression of LDL (8) produce signatures consistent with a LLT, they have not yet been able to determine TLL(p). It has long been conjectured that the LLT is close to the line of homogeneous nucleation observed in isobaric cooling experiments. However, the relationship between crystallization rates and liquid–liquid coexistence has remained elusive.
The minimum cooling rate required to vitrify water microdroplets in experiments at 0.1 MPa is ~107 K s−1 (10−2 K ns−1) (39). Even at these high rates, ice formation cannot be fully avoided, resulting in ~5% of ice in crystallites large enough to be detected by X-ray diffraction (39). Xu et al. demonstrated that the nucleation rate must reach ~1030 m−3 s−1 to account for 3% ice formation in hyperquenching experiments at 107 K s−1 (0.01 K ns−1), consistent with the ~200 ns minimum time to crystallize water films in experiments (48). ML-BOP cooled at ambient pressure at a rate of 0.5 K ns−1 crystallizes ~5% of the sample, while further reduction of the cooling rate to 0.2 K ns−1 results in significant crystallization (35). The comparison of the critical rates for crystallization of ~5% of the sample in the experiments and simulations at 0.1 MPa indicates that the crystallization of deeply supercooled ML-BOP at ambient pressure is ~50 times faster than in water, comparable to the ~20 and ~200 ratios we estimated for the diffusion coefficients of ML-BOP and water at 227 and 210 K, respectively (26, 45).
SI Appendix, Table S3 lists the fastest cooling rate qc(p) that crystallizes at least 10% of the sample in isobaric cooling simulations at pressures from 0.1 to 300 MPa using simulation cells with 8,000 and 216,000 molecules (SI Appendix, Figs. S21 and S22, respectively). We find qc(p) to be quite insensitive to pressure up to ~200 MPa, despite the decrease in crystallization temperature with pressure. We anticipate that the strongest temperature dependence of the mobility of water will result in most pronounced decrease in qc(p) in experiments. The crystallization times derived from the inverse of qc in the cooling simulations are comparable to the ones obtained from the decompression simulations (Fig. 5 and SI Appendix, Figs. S16 and S19).
We define the temperature of maximum crystallization rate Tx(p) as the ice nucleation temperature at qc(p) (SI Appendix, Tables S2 and S3; magenta circles in Fig. 4). Tx(p) is the nose of the time–temperature–transformation curve for ice crystallization (30). It demarcates the boundary between nucleation-limited crystallization above Tx(p) and growth-limited crystallization below Tx(p) (30). Tx(p) is insensitive to the size of the simulation cell because the minimum crystallization time τx(p) that originates from the cross-over of nucleation and growth times depends on the diffusional time and thermodynamic properties but is independent of the volume of the sample (30, 47).
Previous analyses using classical nucleation theory with experimental data for water and molecular simulations with the mW model predicted that Tx at ambient pressure coincides with the temperature of maximum heat capacity TCpmax (30). These predictions were later confirmed by experiments at ambient pressure that locate a maximum in crystallization rate at ~227 K for ~10 μm-sized droplets (49) and ~226 K for water films (50), in good agreement with TCpmax = 229 K for water (51), and confirmed a pioneering conjecture by Speedy and Angell on a causal relationship between the nucleation of ice and the maximum in heat capacity of liquid water (52).
Fig. 4 reveals that the coincidence between the temperature of maximum crystallization rate Tx(p) and the locus of structural transformation of supercooled water extends through the line of maximum heat capacity to the first-order LLT line. The tiny value of the liquid–liquid surface tension, γHDL-LDL < 1 mJ m−2, supports that there is little barrier to transform HDL to LDL within ~1 K of the LLT. We conclude that the coexistence of the HDL and LDL, or pronounced LDL-like fluctuations in the high-density liquid leads to low ice-LDL surface tension, results in small ice nucleation barriers. together with significant mobility due to the presence of HDL that facilitates growth of ice, result in maximum ice crystallization rate as the liquid transitions from high to low density.
The alignment of Tx(p) with TLL(p) suggests a close relationship between the LLT of water and the homogeneous nucleation line Thom(p) established by Angell and coworkers by cooling emulsified water droplets at a rate of 0.05 Ks−1 (53). Thom of ref. 53 at 0.1 MPa stands 7 K above both the temperatures of maximum crystallization (49, 50) and maximum heat capacity (51) of water. A recent estimation of water's LLCP, derived from calculations involving TIP4P/Ice and comparison with experimental liquid EOS, suggested the LLCP to be where the ice nucleation rate would be ~1024 m−3s−1, at 195 K and 125 MPa, (17) about 18 K below Thom of ref. 53.
We find that when the temperatures of maximum κT and Cp separate at p ≪ pc, Tx aligns with the latter. SI Appendix, Fig. S14 shows that κT of ML-BOP at 0.1 MPa reaches its peak at 227 ± 1.0 K, close to the 229 K reported for water (54), while Cp continues to increase until at least 215 K. From the change in enthalpy in fast cooling simulations, we anticipate that Cp will peak around Tx = 207 ± 1.0 K at 0.1 MPa. Within the two-state thermodynamics framework of water, the implication is that ice crystallization occurs most rapidly when the structural changes in the liquid are most pronounced, rather than when long-range fluctuations are at their peak.
LLCP Does Not Enhance the Rate of Ice Crystallization
The experimental ice nucleation temperature Thom(p) (53) does not display any anomaly within the pressure range where the LLCP of water is anticipated, nor does Tx(p) in our simulations (Fig. 4 and SI Appendix, Table S2). qc and the times to crystallize 2.5% of the system from isoenthalpic decompression of HDL also evolve monotonously around the LLCP (SI Appendix, Fig. S16 and Table S3). Our findings are aligned with studies of the impact of a metastable fluid–fluid liquid critical point on the rate of crystallization of model systems, which found that the rate of crystallization was not exceptional at the LLCP (55, 56). In agreement with the analyses of those studies, our simulations support that the insensitivity originates on the local nature of the crystallization process, that seems to be controlled by the coexistence of LDL and HDL domains, and not the length scale of the fluctuations. We conclude that crystallization data alone is insufficient to locate the liquid–liquid critical pressure.
Debenedetti et al. proposed to experimentally access the location of the critical pressure through the analysis of long-range correlations S(0) in water glasses prepared by hyperquenching at distinct pressures, identifying pc as the one of the glass with maximal long-range structural correlations (38). The success of the approach hinges in accessing a cooling rate for which the glass transition temperature Tg(p) passes close to the LLCP and arrests the growing fluctuations. That is the case for TIP4P/2005 at cooling rate 0.1 K ns−1, which is just one order of magnitude higher than the one used for vitrification of water in experiments. The maximum correlations in hyperquenched glasses of ML-BOP, on the other hand, occur at 250 to 300 MPa, well above pc (Figs. 1 and 4), because its HDL retains mobility to significantly lower temperatures (see Discussion in SI Appendix, section F). We anticipate that the interplay between glass transition and liquid–liquid transformation in water resembles the one of TIP4P/2005, supporting the determination of pc from the S(0) of glasses prepared over a wide range of accessible cooling rates.
Conclusions and Outlook
The existence of a LLT has been the focus of the debate over the origin of water anomalies since it was proposed from pioneering molecular simulations with the ST2 model (1). Intense research in the last years has established that the most accurate all-atom models of water have a LLT (18, 20–23). However, a LLT had not been found in CG water models. In the present study, we demonstrate that the monatomic machine-learned model ML-BOP has a LLT that ends in a critical point at pc = 170 ± 10 MPa and Tc = 181 ± 3 K. Significantly, the LLT line and critical point of ML-BOP closely align with predictions made for the all-atom TIP4P/2005 water model (20, 37), bolstering the likeness of the EOS of these models (35, 36).
The expense of all-atom models has limited the modeling of the competition between LLT and crystallization observed in experiments (8, 9). The 100-fold increase in computational efficiency due to the CG nature of ML-BOP (26), together with the ~100-fold increase in the dynamics in the deeply supercooled region, endows it with ~104 increase in efficiency of the sampling of the free energy landscape compared to all-atom water models that accurately reproduce the dynamics of water, such as TIP4P/2005 (57, 58). These combined efficiencies uniquely position ML-BOP for the investigation of the interplay between LLT and crystallization in deeply supercooled water.
Cooling simulations with ML-BOP reveal that the temperature of maximum crystallization rate, Tx(p) at which the crystallization rate transitions from nucleation-limited to growth-limited, coincides with the LLT line and its supercritical continuation of maximum heat capacity. The simulations suggest that ice crystallization occurs most rapidly when both low- and high-density coordination domains are present during the conversion of water from high- to LDL phases, and not necessarily when the magnitude of the long-range fluctuations are maximal. Consistent with the latter, we find that the LLCP does not produce a discernible signature in the rates or temperatures of ice crystallization.
Large-scale nonequilibrium simulations of isoenthalpic decompression of the high-density liquid of ML-BOP replicate the experimental signatures of ultrafast HDL decompression experiments (9). We find that the conversion of HDL to LDL heats the system to the liquid–liquid coexistence line, where both phases coexist until the heat produced by ice crystallization drives the system away from the metastable LLT. The fraction of molecules identified as ice gradually increases throughout the liquid–liquid coexistence region of ML-BOP, indicating that the LDL fails to equilibrate before undergoing crystallization. It is an open question whether the instability of the LDL is a feature that originates from the monatomic nature of the model or it is shared with water. However, we note that the relatively small size of the crystallites formed during the LDL-HDL plateau would challenge their identification in the structure factor utilized to compute the ice fraction in the experiment.
The simulations reveal qualitatively similar responses to the decompression of HDL to an unstable pressure in the region of two-liquid phase coexistence, the critical point, or the Widom line. This similarity originates in the slow coarsening of the LDL and HDL fluctuations before ice formation heats the system toward the melting line. The agreement in the evolution of the low-q region of the experiments (9) and ML-BOP simulations supports that slow coarsening before crystallization is also the case for water. We conclude that the short-lived highly metastable LLT is effectively indistinguishable from structural fluctuations along its supercritical continuation of high heat capacity.
Methods
Molecular dynamics simulations are performed with the ML-BOP water model (26) using LAMMPS (59) in the NpT ensemble with a time step of 5 fs using periodic cubic simulation cells with periodic boundary conditions in the three Cartesian directions. The temperature and pressure are controlled with the Nosé–Hoover thermostat and barostat with time constants of 0.5 and 5 ps, respectively. The initial configurations for all liquid simulation boxes are generated using Packmol (60).
We calculate the zero wave number structure factor S(0) of liquid and vitrified ML-BOP along isobaric cooling simulations at 10 K ns−1 from 298 K to 78 K at p = −100, 0.1, 100, 170, 180, 200, 250, 300, 400, 600, and 1,000 MPa following the procedure of ref. 38 (SI Appendix, section A). S(0) at each T and p is averaged over 10 independent cooling simulations. We report the SD among these 10 simulations as the error bar. We use the CHILL+ algorithm (44) to compute the amount of ice in the glasses.
To determine the LLT line TLL(p) from free energy calculations, we perform NpT simulations with cells containing 192 ML-BOP molecules at the T and p listed in SI Appendix, Table S4. We evolve 15 independent 500 ns long simulations at each thermodynamic condition (T, p), each initialized with different sets of random velocities consistent with the selected temperature. The small size of the cell enables heterophasic oscillations as a function of time (61) between HDL and LDL, before crystallization takes over. SI Appendix, Fig. S7 shows that fluctuation in density between LDL and HDL correlates with the fraction of 4-coordinated water molecules in the liquid. We collect density ρ and potential energy E of the system until 12 water molecules (6% of the total) are classified as ice I using CHILL+. Smaller ice crystallites are subcritical and do not lead to ice formation in the whole cell.
We build probability histograms of observing a particular density and energy from this collection of trajectories, from which we compute the free energies: , where β = (kbT)−1. We calculate one-dimensional probability and corresponding free energy profiles as a function of density by integrating out energy (E) from the two-dimensional free energy surfaces, . The regions with two minima in the free energy are further analyzed to identify the T and p of equilibrium between the two liquids as the loci for which the basins of LDL and HDL have approximately the same populations. We estimate the liquid–liquid surface free energy as the barrier between the HDL and LDL states in Fig. 3A, divided by twice the area of the cell to account for the two LDL-HDL interfaces in the periodic cell (SI Appendix, Fig. S8).
We also estimate TLL(p) and its supercritical continuation of maximum heat capacity Cpmax(p) from simulations that decompress previously equilibrated HDL into the region of stability of LDL and evolve the dynamics at constant pressure and enthalpy. The simulations are performed with simulation cells containing 216,000 or 8,000 ML-BOP molecules preequilibrated in the HDL phase for 5 ns at a pressure peq and temperature Teq (SI Appendix, Table S5) and then instantaneously depressurized to a target pressure p = 50, 100, 150, 170, 200, 215, or 250 MPa and evolved in the NpH ensemble for 22 to 100 ns with a time step of 1 fs and a 20 ps constant for the barostat.
We determine the fastest cooling rate that results in crystallization, qc(p) as the one that produces at least 10% of ice (cubic or hexagonal, identified with CHILL+) before the rest of the sample vitrifies. The cutoff is selected to account for the 5% ice detected in hyperquenched glassy water in experiments (10, 39). qc = 0.2 K ns−1 at 0.1 MPa was determined in ref. 35 with a simulation cell containing 8,000 molecules scanning q = 10, 4, 1, 0.5, 0.2, 0.1, 0.05 K ns−1. Here, we follow the same protocol to compute qc(p) at p = 150, 160, 170, 200, 250, and 300 scanning subsets of the same cooling rates (SI Appendix, Fig. S20). We do not scan for p < 150 MPa because we find that qc at 150 MPa is the same than at 0.1 MPa. We determine qc for cells containing 216,000 molecules at 170 and 200 MPa (SI Appendix, Fig. S21). We compute the temperature of maximum crystallization rate Tx(p) as the temperature of ice nucleation when the simulation cell is cooled at qc. We report in SI Appendix, Tables S2 and S3 Tx(p) as an average over five independent cooling simulations at the corresponding qc(p), listed individually in SI Appendix, Table S3. We calculate the glass transition temperature as a function of pressure Tg(p) as the temperature at which the mean displacement of the particles becomes less than 0.8 Å in cooling simulations with a rate 10 K ns−1 at pressures from −100 to 1,000 MPa (SI Appendix, Fig. S24).
Supplementary Material
Appendix 01 (PDF)
Dataset S01 (ZIP)
Evolution of a simulation cell with 216000 water molecules along an isobaric isoenthalpic (NpH) simulation that instantaneously decompresses HDL from 160 K and 400 MPa to 215 MPa. Ice is shown with cyan sticks, 4-coordinated molecules L with blue sticks, and higher-coordination molecules with red sticks. The movie shows the evolution over the first 21 ns, with configurations every 20 ps.
Evolution of the structure factor S(q) for a system of 216000 water molecules along an isobaric isoenthalpic (NpH)decompression simulation from 160 K and 400 MPa to 215 MPa. The dotted lines in pink and green indicate the reference peaks in S(q) for HDL and LDL, respectively. The pink region denotes the S(q) corresponding to our initial HDL configuration of the simulation and blue region presents its evolution along the simulation.
Evolution of a simulation cell with 216000 water molecules along an isobaric isoenthalpic (NpH) simulation that instantaneously decompresses HDL from 160 K and 255 MPa to 170 MPa. Ice is shown with cyan sticks, 4-coordinated molecules L with blue sticks, and higher-coordination molecules with red sticks. The movie shows the evolution over the first 21 ns, with configurations every 20 ps.
Formation of ice (cyan) in a system of 216000 water molecules along isoenthalpic decompression simulations from 255 MPa, 160 K to 170 MPa for 21 ns. Each frame of the movie represents 10 ps of the simulation trajectory. Ice comprises cubic and hexagonal ice identified with CHILL+.(41)
Acknowledgments
This work was supported by the U.S. Air Force Office of Scientific Research through a Multidisciplinary University Research Initiatives (MURI) Award FA9550-20-1-0351. We gratefully acknowledge discussions with Ingrid de Almeida Ribeiro, Francesco Sciortino, and Michael P. Hoepfner. We thank Pablo Debenedetti and Carlos Vega for insightful comments and questions during the review and the Center of High-Performance Computing at The University of Utah for technical support and an award of computing time.
Author contributions
V.M. designed research; D.D. and R.K. performed research; D.D., R.K., and V.M. analyzed data; and D.D., R.K., and V.M. wrote the paper.
Competing interests
The authors declare no competing interest.
Footnotes
Reviewers: P.G.D., Princeton University; and C.V., Universidad Complutense de Madrid.
Data, Materials, and Software Availability
All data of this study are included in the article and/or supporting information.
Supporting Information
References
- 1.Poole P. H., Sciortino F., Essmann U., Stanley H. E., Phase behaviour of metastable water. Nature 360, 324–328 (1992). [Google Scholar]
- 2.Palmer J. C., Poole P. H., Sciortino F., Debenedetti P. G., Advances in computational studies of the liquid-liquid transition in water and water-like models. Chem. Rev. 118, 9129–9151 (2018). [DOI] [PubMed] [Google Scholar]
- 3.Mishima O., Stanley H. E., The relationship between liquid, supercooled and glassy water. Nature 396, 329–335 (1998). [Google Scholar]
- 4.Debenedetti P. G., Stillinger F. H., Supercooled liquids and the glass transition. Nature 410, 259–267 (2001). [DOI] [PubMed] [Google Scholar]
- 5.Gallo P., et al. , Water: A tale of two liquids. Chem. Rev. 116, 7463–7500 (2016). [DOI] [PMC free article] [PubMed] [Google Scholar]
- 6.Limmer D. T., Chandler D., Theory of amorphous ices. Proc. Natl. Acad. Sci. U.S.A. 111, 9413–9418 (2014). [DOI] [PMC free article] [PubMed] [Google Scholar]
- 7.Debenedetti P. G., Stanley H. E., Supercooled and glassy water. Phys. Today 56, 40–46 (2003). [Google Scholar]
- 8.Amann-Winkel K., et al. , Liquid-liquid phase separation in supercooled water from ultrafast heating of low-density amorphous ice. Nat. Commun. 14, 442 (2023). [DOI] [PMC free article] [PubMed] [Google Scholar]
- 9.Kim K. H., et al. , Experimental observation of the liquid-liquid transition in bulk supercooled water under pressure. Science 370, 978–982 (2020). [DOI] [PubMed] [Google Scholar]
- 10.Bachler J., Giebelmann J., Loerting T., Experimental evidence for glass polymorphism in vitrified water droplets. Proc. Natl. Acad. Sci. U.S.A. 118, e2108194118 (2021). [DOI] [PMC free article] [PubMed] [Google Scholar]
- 11.Hestand N. J., Skinner J., Perspective: Crossing the Widom line in no man’s land: Experiments, simulations, and the location of the liquid-liquid critical point in supercooled water. J. Chem. Phys. 149, 140901 (2018). [DOI] [PubMed] [Google Scholar]
- 12.Holten V., Bertrand C. E., Anisimov M. A., Sengers J. V., Thermodynamics of supercooled water. J. Chem. Phys. 136, 094507 (2012). [DOI] [PubMed] [Google Scholar]
- 13.Mishima O., Sumita T., Equation of state of liquid water written by simple experimental polynomials and the liquid-liquid critical point. J. Phys. Chem. B 127, 1414–1421 (2023). [DOI] [PubMed] [Google Scholar]
- 14.Mishima O., Volume of supercooled water under pressure and the liquid-liquid critical point. J. Chem. Phys. 133, 144503 (2010). [DOI] [PubMed] [Google Scholar]
- 15.Holten V., Sengers J. V., Anisimov M. A., Equation of state for supercooled water at pressures up to 400 MPa. J. Phys. Chem. Ref. Data 43, 043101 (2014). [Google Scholar]
- 16.Moynihan C. T., Two species/nonideal solution model for amorphous/amorphous phase transitions. MRS Online Proc. Libr. 455, 411–425 (1996). [Google Scholar]
- 17.Espinosa J. R., Abascal J. L. F., Sedano L. F., Sanz E., Vega C., On the possible locus of the liquid–liquid critical point in real water from studies of supercooled water using the TIP4P/Ice model. J. Chem. Phys. 158, 204505 (2023). [DOI] [PubMed] [Google Scholar]
- 18.Liu Y., Panagiotopoulos A. Z., Debenedetti P. G., Low-temperature fluid-phase behavior of ST2 water. J. Chem. Phys. 131, 104508 (2009). [Google Scholar]
- 19.Palmer J. C., et al. , Metastable liquid–liquid transition in a molecular model of water. Nature 510, 385–388 (2014). [DOI] [PubMed] [Google Scholar]
- 20.Debenedetti P. G., Sciortino F., Zerze G. H., Second critical point in two realistic models of water. Science 369, 289–292 (2020). [DOI] [PubMed] [Google Scholar]
- 21.Eltareb A., Lopez G. E., Giovambattista N., Evidence of a liquid–liquid phase transition in H2O and D2O from path-integral molecular dynamics simulations. Sci. Rep. 12, 6004 (2022). [DOI] [PMC free article] [PubMed] [Google Scholar]
- 22.Ni Y., Skinner J. L., Evidence for a liquid-liquid critical point in supercooled water within the E3B3 model and a possible interpretation of the kink in the homogeneous nucleation line. J. Chem. Phys. 144, 214501 (2016). [DOI] [PubMed] [Google Scholar]
- 23.Weis J., Sciortino F., Panagiotopoulos A. Z., Debenedetti P. G., Liquid–liquid criticality in the WAIL water model. J. Chem. Phys. 157, 024502 (2022). [DOI] [PubMed] [Google Scholar]
- 24.Gartner T. E., Piaggi P. M., Car R., Panagiotopoulos A. Z., Debenedetti P. G., Liquid-liquid transition in water from first principles. Phys. Rev. Lett. 129, 255702 (2022). [DOI] [PubMed] [Google Scholar]
- 25.Molinero V., Moore E. B., Water modeled as an intermediate element between carbon and silicon. J. Phys. Chem. B 113, 4008–4016 (2009). [DOI] [PubMed] [Google Scholar]
- 26.Chan H., et al. , Machine learning coarse grained models for water. Nat. Commun. 10, 379 (2019). [DOI] [PMC free article] [PubMed] [Google Scholar]
- 27.Stillinger F. H., Weber T. A., Computer simulation of local order in condensed phases of silicon. Phys. Rev. B 31, 5262–5271 (1984). [DOI] [PubMed] [Google Scholar]
- 28.Johnston J. C., Molinero V., Crystallization, melting, and structure of water nanoparticles at atmospherically relevant temperatures. J. Am. Chem. Soc. 134, 6650–6659 (2012). [DOI] [PubMed] [Google Scholar]
- 29.Moore E. B., Molinero V., Ice crystallization in water’s “no-man’s land”. J. Chem. Phys. 132, 244504 (2010). [DOI] [PubMed] [Google Scholar]
- 30.Moore E. B., Molinero V., Structural transformation in supercooled water controls the crystallization rate of ice. Nature 479, 506–508 (2011). [DOI] [PubMed] [Google Scholar]
- 31.Moore E. B., Molinero V., Is it cubic? Ice crystallization from deeply supercooled water. Phys. Chem. Chem. Phys. 13, 20008–20016 (2011). [DOI] [PubMed] [Google Scholar]
- 32.Holten V., Limmer D. T., Molinero V., Anisimov M. A., Nature of the anomalies in the supercooled liquid state of the mW model of water. J. Chem. Phys. 138, 174501 (2013). [DOI] [PubMed] [Google Scholar]
- 33.Limmer D. T., Chandler D., The putative liquid-liquid transition is a liquid-solid transition in atomistic models of water. J. Chem. Phys. 135, 134503 (2011). [DOI] [PubMed] [Google Scholar]
- 34.Tersoff J., New empirical model for the structural properties of silicon. Phys. Rev. Lett. 56, 632–635 (1986). [DOI] [PubMed] [Google Scholar]
- 35.Dhabal D., Sankaranarayanan S. K. R. S., Molinero V., Stability and metastability of liquid water in a machine-learned coarse-grained model with short-range interactions. J. Phys. Chem. B 126, 9881–9892 (2022). [DOI] [PubMed] [Google Scholar]
- 36.Dhabal D., Molinero V., Kinetics and mechanisms of pressure-induced ice amorphization and polyamorphic transitions in a machine-learned coarse-grained water model. J. Phys. Chem. B 127, 2847–2862 (2023). [DOI] [PubMed] [Google Scholar]
- 37.Singh R. S., Biddle J. W., Debenedetti P. G., Anisimov M. A., Two-state thermodynamics and the possibility of a liquid-liquid phase transition in supercooled TIP4P/2005 water. J. Chem. Phys. 144, 144504 (2016). [DOI] [PubMed] [Google Scholar]
- 38.Gartner T. E., Torquato S., Car R., Debenedetti P. G., Manifestations of metastable criticality in the long-range structure of model water glasses. Nat. Commun. 12, 3398 (2021). [DOI] [PMC free article] [PubMed] [Google Scholar]
- 39.Kohl I., Mayer E., Hallbrucker A., The glassy water–cubic ice system: A comparative study by X-ray diffraction and differential scanning calorimetry. Phys. Chem. Chem. Phys. 2, 1579–1586 (2000). [Google Scholar]
- 40.Neophytou A., Sciortino F., Potential energy landscape of a coarse grained model for water: ML-BOP. J. Chem. Phys. 160, 114502 (2024). [DOI] [PubMed] [Google Scholar]
- 41.Gartner T. E., et al. , Signatures of a liquid–liquid transition in an ab initio deep neural network model for water. Proc. Natl. Acad. Sci. U.S.A. 117, 26040–26046 (2020). [DOI] [PMC free article] [PubMed] [Google Scholar]
- 42.Mollica E. M., Russo J., Stanley H. E., Sciortino F., Decompression dynamics of high density amorphous ice above and below the liquid-liquid critical point. J. Non-Cryst. Solids: X 13, 100081 (2022). [Google Scholar]
- 43.Giovambattista N., Poole P. H., Liquid–liquid phase transition in simulations of ultrafast heating and decompression of amorphous ice. J. Non-Cryst. Solids: X 11, 100067 (2021). [Google Scholar]
- 44.Nguyen A. H., Molinero V., Identification of clathrate hydrates, hexagonal ice, cubic ice, and liquid water in simulations: The CHILL+ algorithm. J. Phys. Chem. B 119, 9369–9376 (2015). [DOI] [PubMed] [Google Scholar]
- 45.Xu Y., Petrik N. G., Smith R. S., Kay B. D., Kimmel G. A., Growth rate of crystalline ice and the diffusivity of supercooled water from 126 to 262 K. Proc. Natl Acad. Sci. U.S.A. 113, 14921–14925 (2016). [DOI] [PMC free article] [PubMed] [Google Scholar]
- 46.Mariedahl D., et al. , X-ray studies of the transformation from high-to low-density amorphous water. Philos. Trans. R. Soc. A 377, 20180164 (2019). [DOI] [PMC free article] [PubMed] [Google Scholar]
- 47.Tanaka H., Possible resolution of the Kauzmann paradox in supercooled liquids. Phys. Rev. E 68, 011505 (2003). [DOI] [PubMed] [Google Scholar]
- 48.Xu Y., Petrik N. G., Smith R. S., Kay B. D., Kimmel G. A., Homogeneous nucleation of ice in transiently-heated, supercooled liquid water films. J. Phys. Chem. Lett. 8, 5736–5743 (2017). [DOI] [PubMed] [Google Scholar]
- 49.Laksmono H., et al. , Anomalous behavior of the homogeneous ice nucleation rate in “no-man’s land”. J. Phys. Chem. Lett. 6, 2826–2832 (2015). [DOI] [PMC free article] [PubMed] [Google Scholar]
- 50.Kimmel G. A., et al. , Homogeneous ice nucleation rates and crystallization kinetics in transiently-heated, supercooled water films from 188 K to 230 K. J. Chem. Phys. 150, 204509 (2019). [DOI] [PubMed] [Google Scholar]
- 51.Pathak H., et al. , Enhancement and maximum in the isobaric specific-heat capacity measurements of deeply supercooled water using ultrafast calorimetry. Proc. Natl. Acad. Sci. U.S.A. 118, e2018379118 (2021). [DOI] [PMC free article] [PubMed] [Google Scholar]
- 52.Speedy R., Angell C., Isothermal compressibility of supercooled water and evidence for a thermodynamic singularity at −45 °C. J. Chem. Phys. 65, 851–858 (1976). [Google Scholar]
- 53.Kanno H., Speedy R., Angell C., Supercooling of water to −92 °C under pressure. Science 189, 880–881 (1975). [DOI] [PubMed] [Google Scholar]
- 54.Kim K. H., et al. , Maxima in the thermodynamic response and correlation functions of deeply supercooled water. Science 358, 1589–1593 (2017). [DOI] [PubMed] [Google Scholar]
- 55.Wedekind J., et al. , Optimization of crystal nucleation close to a metastable fluid-fluid phase transition. Sci. Rep. 5, 11260 (2015). [DOI] [PMC free article] [PubMed] [Google Scholar]
- 56.Xu L., Buldyrev S. V., Stanley H. E., Franzese G., Homogeneous crystal nucleation near a metastable fluid-fluid phase transition. Phys. Rev. Lett. 109, 095702 (2012). [DOI] [PubMed] [Google Scholar]
- 57.Rozmanov D., Kusalik P. G., Transport coefficients of the TIP4P-2005 water model. J. Chem. Phys. 136, 044507 (2012). [DOI] [PubMed] [Google Scholar]
- 58.Abascal J. L. F., Vega C., A general purpose model for the condensed phases of water: TIP4P/2005. J. Chem. Phys. 123, 234505 (2005). [DOI] [PubMed] [Google Scholar]
- 59.Plimpton S., Fast parallel algorithms for short-range molecular dynamics. J. Comput. Phys. 117, 1–19 (1995). [Google Scholar]
- 60.Martínez J. M., Martínez L., Packing optimization for automated generation of complex system’s initial configurations for molecular dynamics and docking. J. Comput. Chem. 24, 819–825 (2003). [DOI] [PubMed] [Google Scholar]
- 61.Kastelowitz N., Molinero V., Ice-liquid oscillations in nanoconfined water. ACS Nano 12, 8234–8239 (2018). [DOI] [PubMed] [Google Scholar]
Associated Data
This section collects any data citations, data availability statements, or supplementary materials included in this article.
Supplementary Materials
Appendix 01 (PDF)
Dataset S01 (ZIP)
Evolution of a simulation cell with 216000 water molecules along an isobaric isoenthalpic (NpH) simulation that instantaneously decompresses HDL from 160 K and 400 MPa to 215 MPa. Ice is shown with cyan sticks, 4-coordinated molecules L with blue sticks, and higher-coordination molecules with red sticks. The movie shows the evolution over the first 21 ns, with configurations every 20 ps.
Evolution of the structure factor S(q) for a system of 216000 water molecules along an isobaric isoenthalpic (NpH)decompression simulation from 160 K and 400 MPa to 215 MPa. The dotted lines in pink and green indicate the reference peaks in S(q) for HDL and LDL, respectively. The pink region denotes the S(q) corresponding to our initial HDL configuration of the simulation and blue region presents its evolution along the simulation.
Evolution of a simulation cell with 216000 water molecules along an isobaric isoenthalpic (NpH) simulation that instantaneously decompresses HDL from 160 K and 255 MPa to 170 MPa. Ice is shown with cyan sticks, 4-coordinated molecules L with blue sticks, and higher-coordination molecules with red sticks. The movie shows the evolution over the first 21 ns, with configurations every 20 ps.
Formation of ice (cyan) in a system of 216000 water molecules along isoenthalpic decompression simulations from 255 MPa, 160 K to 170 MPa for 21 ns. Each frame of the movie represents 10 ps of the simulation trajectory. Ice comprises cubic and hexagonal ice identified with CHILL+.(41)
Data Availability Statement
All data of this study are included in the article and/or supporting information.