Abstract
Objective
The objective of this study was to evaluate the relationship between the platelet-to-lymphocyte ratio (PLR) and systemic lupus erythematosus (SLE). Additionally, the study aimed to establish an association between PLR and SLE disease activity, specifically lupus nephritis (LN).
Methods
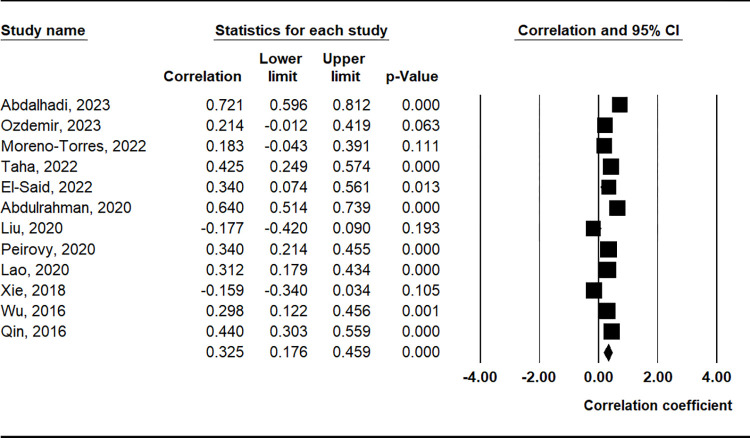
We conducted a comprehensive search across Medline, Embase, and Cochrane databases to identify relevant articles. Subsequently, we performed meta-analyses to compare PLR between SLE patients and controls, as well as active and inactive SLE cases, along with LN and non-LN groups. Furthermore, a meta-analysis was conducted on correlation coefficients between PLR and various parameters in SLE patients, including the SLE Disease Activity Index (SLEDAI), C3, C4, anti-dsDNA, erythrocyte sedimentation rate (ESR), and C-reactive protein (CRP).
Results
In total, fifteen studies comprising 1,522 SLE patients and 1,424 controls were eligible for inclusion. The meta-analysis demonstrated a significant elevation of PLR in the SLE group compared to the control group (Standardized Mean Difference [SMD] = 0.604, 95% Confidence Interval [CI] = 0.299–0.909, p < 0.001). Upon stratification by ethnicity, an elevated PLR was observed in the SLE group among both Asian and Arab populations. Subgroup analysis based on sample size revealed consistently higher PLR in both small (n < 200) and large sample (n ≥ 200) SLE groups. Moreover, when considering disease activity, there was a noteworthy trend of increased PLR in the active disease group compared to the inactive group (SMD = 0.553, 95% CI = 0.000–1.106, p = 0.050). However, the meta-analysis did not demonstrate a significant distinction in PLR between the LN and non-LN groups. Notably, a positive association was established between PLR and SLEDAI (correlation coefficient = 0.325, 95% CI = 0.176–0.459, p < 0.001). Furthermore, PLR exhibited positive correlations with ESR, CRP, proteinuria, C3, and anti-dsDNA antibody levels.
Conclusions
The outcomes of this meta-analysis underscored the elevated PLR in SLE patients, suggesting its potential as a biomarker for gauging systemic inflammation in SLE. Additionally, PLR exhibited correlations with SLEDAI, as well as with key indicators such as ESR, CRP, proteinuria, C3, and anti-dsDNA antibody levels.
Introduction
Systemic Lupus Erythematosus (SLE) is a chronic autoimmune disorder characterized by a dysregulated immune response that leads to the production of autoantibodies and subsequent inflammation, affecting multiple organ systems [1]. The pathogenesis of SLE involves complex interactions among genetic predisposition, environmental triggers, and immune dysregulation, resulting in a wide range of clinical manifestations and disease severity [2]. Despite significant advances in understanding the underlying mechanisms of SLE, its etiology remains elusive, and the quest for reliable biomarkers for monitoring disease activity and predicting outcomes remains ongoing.
In recent years, there has been a growing interest in the role of hematological indices as potential indicators of systemic inflammation and disease severity in various inflammatory conditions, including SLE. Among these, platelet-to-lymphocyte ratio (PLR) has emerged as a promising candidate owing to its simplicity, cost-effectiveness, and potential association with immune-inflammatory processes [3]. The PLR reflects the balance between two essential components of the immune system: platelets, which are crucial in initiating and propagating inflammation, and lymphocytes, the primary mediators of immune responses [4]. Understanding the relationship between the PLR and SLE may have significant clinical implications. If PLR is a reliable indicator of disease activity, it could aid in risk stratification, guide treatment decisions, and monitor therapeutic responses. Additionally, identifying potential ethnic differences in PLR and their correlation with laboratory findings could enhance our understanding of the heterogeneity of the disease and potentially facilitate personalized management strategies for patients with SLE.
Several studies have investigated the relationship between the PLR and SLE; however, the findings are inconsistent and sometimes contradictory [5–19]. Some studies have reported elevated PLR in patients with SLE compared to healthy controls, whereas others have failed to show a significant difference. Moreover, the association between the PLR and disease activity or laboratory findings in patients with SLE remains incompletely understood. In light of these uncertainties, we conducted a comprehensive meta-analysis to evaluate the association between the PLR and SLE. By pooling data from multiple studies, this meta-analysis aimed to provide a more precise estimation of the relationship between the PLR and SLE, determine whether the PLR can serve as a potential biomarker for assessing disease activity and severity, and explore its correlation with commonly used laboratory parameters.
Materials and methods
Choosing appropriate studies and gathering data
We searched the literature for studies that examined the PLR in patients with SLE and healthy controls. The MEDLINE, Embase, and Cochrane databases (up to July 2023) were searched to identify all accessible papers. The search was conducted using the phrases "platelet to lymphocyte ratio" and "systemic lupus erythematosus" as keywords and topic terms. To identify other studies not included in the aforementioned electronic databases, all references listed in the identified publications were also examined. Studies were deemed eligible if they met one or more of the following criteria: (1) case-control, cross-sectional, or cohort studies; (2) studies providing information on the PLR in patients with SLE and controls; or (3) studies providing information on the correlation coefficient between the PLR and SLE activity as measured by the SLEDAI, ESR, and C3, C4, anti-dsDNA, or CRP levels. There were no language- or race-based limitations in this study. Studies were disregarded if they were reviews or case reports or if they had overlapping or inadequate data. Two independent reviewers collected data on the procedures and outcomes of the original trials. Any disagreements in the conclusions were resolved by consensus. The PRISMA recommendations were followed in conducting the meta-analysis [20]. The main author, publication year, country, participant count, mean and standard deviation (SD) of the PLR, and correlation coefficients between the PLR and disease activity were extracted. The mean and SD values were calculated using the previously published methods when the provided data were median, interquartile range, or ranges [21,22]. The quality of each component of the meta-analysis was scored using the Newcastle-Ottawa Scale [23].
Examination of statistical relationships
We carried out a meta-analysis to ascertain the platelet-to-lymphocyte ratio (PLR) among patients with SLE in comparison to healthy controls, individuals with active and inactive SLE, and those with or without lupus nephritis (LN). The outcomes are expressed as standardized mean differences (SMDs) accompanied by 95% confidence intervals (CIs) to uphold data uniformity. Additionally, we conducted a meta-analysis examining the correlations between PLR and parameters such as SLEDAI, as well as levels of C3, C4, anti-dsDNA, ESR, and CRP within the SLE patient cohort. We assessed heterogeneity and variability within and across trials using Cochran’s Q test [24]. A heterogeneity test was used to investigate the null hypothesis that all the studies evaluated the same effect. A random-effects model was used in the meta-analysis when a substantial Q value (p < 0.10) showed study heterogeneity [25]. When a substantial Q statistic (p < 0.10) failed to detect study heterogeneity, the fixed-effects model was used. The model assumed that all studies assessed the same underlying effect and solely considered study heterogeneity. To determine the impact of heterogeneity, we used the following formula: I2 = 100% × (Q − df)/Q [26]. I2 was used to evaluate trial-to-trial consistency and determine whether heterogeneity, rather than chance, was primarily responsible for the majority of the total variation between studies. I2 levels of 25%, 50%, and 75% were considered low, moderate, and high, respectively. I2 ranged from 0% to 100% [26]. Statistical adjustments were made using Comprehensive Meta-Analysis computer software (Biostat, Inc., Englewood, NJ).
Sensitivity test, heterogeneity assessment, and publication bias
Ethnicity, research quality, sample size, and data type were used as variables in meta-regression analyses to examine the probable origins of the heterogeneity observed in the meta-analysis. By excluding each study separately, a sensitivity test was conducted to determine the impact of each study on the pooled odds ratio. Although funnel plots are often used to identify publication bias, their interpretation requires judgment and various research types with different sample sizes. Therefore, we assessed publication bias using Egger’s linear regression test,[27] which was used to determine funnel plot asymmetry using a natural logarithm scale of SMDs.
Results
Studies included in the meta-analysis
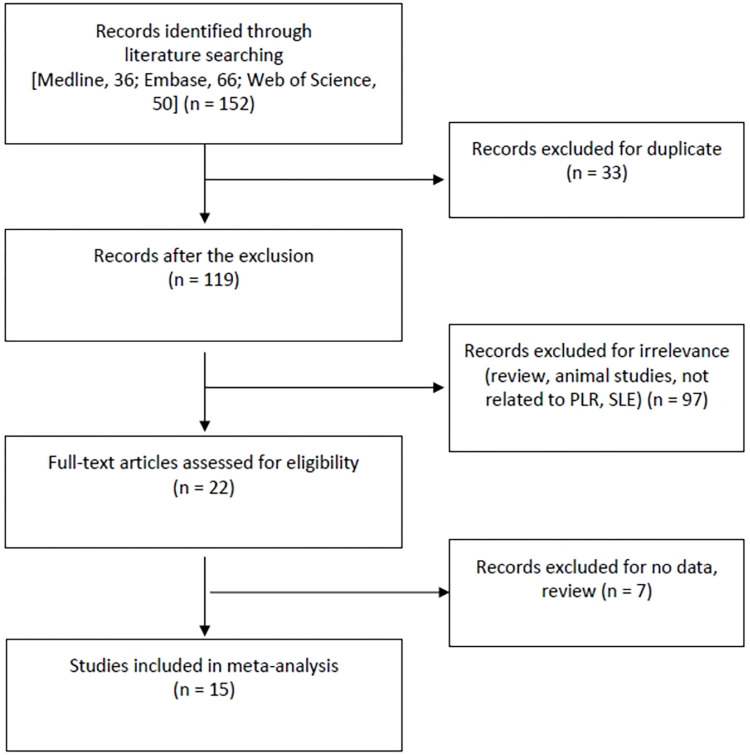
A comprehensive search utilizing both computerized and manual techniques initially yielded a total of 152 studies. Upon scrutiny of titles and abstracts, 21 papers were selected for in-depth analysis. Among these, seven were excluded due to either a lack of PLR data or their nature as review articles. Consequently, a total of 15 studies, encompassing 1,522 patients diagnosed with SLE and 1,424 control subjects, fulfilled the predefined inclusion criteria [5–19] (Table 1 and Fig 1). Each study was evaluated on a scale of 1 to 10, resulting in quality ratings ranging from 6 to 8. The distinctive attributes of the included studies are concisely summarized in Table 1.
Table 1. Characteristics of the individual studies included in the meta-analysis.
| Authors | Country | Ethnicity | Groups | Number | SLEDAI, coefficient |
Results | Study quality |
|||
|---|---|---|---|---|---|---|---|---|---|---|
| Case | Control | SMD* | Magnitude* | p Value | ||||||
| Abdalhadi, 2023[5] | Syria | Arab | PLR | 80 | 80 | 0.721 | 0.511 | Medium | 0.001 | 6 |
| Ozdemir, 2023[6] | Turkey | European | PLR | 76 | 76 | 0.214 | -0.216 | Small | 0.183 | 6 |
| Moreno-Torres, 2022[7] | Spain | European | PLR | 77 | 80 | 0.183 | 1.202 | Large | 0.000 | 6 |
| Taha, 2022[8] | Egypt | Arab | PLR | 100 | 100 | 0.425 | -0.590 | Medium | 0.000 | 7 |
| El-Said, 2022[18] | Egypt | Arab | PLR | 52 | 50 | 0.340 | 0.953 | Large | 0.000 | 6 |
| Abdulrahman, 2020[17] | Egypt | Arab | PLR | 110 | 50 | 0.640 | 2.309 | Large | 0.000 | 6 |
| Liu, 2020[9] | China | Asian | PLR | 56 | 57 | -0.177 | 0.552 | Medium | 0.004 | 6 |
| Peirovy, 2020[10] | Iran | Arab | PLR | 208 | 205 | 0.340 | 1.180 | Large | 0.000 | 8 |
| Lao, 2020[11] | China | Asian | PLR | 195 | 183 | 0.312 | 0.465 | Small | 0.000 | 7 |
| Soliman, 2020[12] | Egypt | Arab | PLR | 120 | 30 | NA | 0.358 | Small | 0.081 | 6 |
| Gao, 2019[19] | China | Asian | PLR | 22 | 66 | NA | -0.035 | Small | 0.885 | 6 |
| Xie, 2018[13] | China | Asian | PLR | 105 | 105 | -0.159 | 0.666 | Medium | 0.000 | 7 |
| Wu, 2016[14] | China | Asian | PLR | 116 | 136 | 0.298 | 0.749 | Medium | 0.000 | 7 |
| Qin, 2016[15] | China | Asian | PLR | 154 | 151 | 0.440 | 0.461 | Small | 0.000 | 7 |
| Yolbas, 2016[16] | Turkey | European | PLR | 51 | 55 | NA | 0.533 | Medium | 0.007 | 6 |
SMD: Standardized mean difference, NLR: Neutrophil-to-lymphocyte ratio, PLR: Platelet-to-lymphocyte ratio, SLEDAI: Systemic lupus erythematosus disease activity Index, *Magnitude of Cohen’s d effect size: 0.2–0.5, small effect; 0.5–0.8, medium effect; ≥0.8, large effect; NA: Not available.
Fig 1. A diagram on choosing the relevant studies.
Comparing PLR between SLE patients and controls
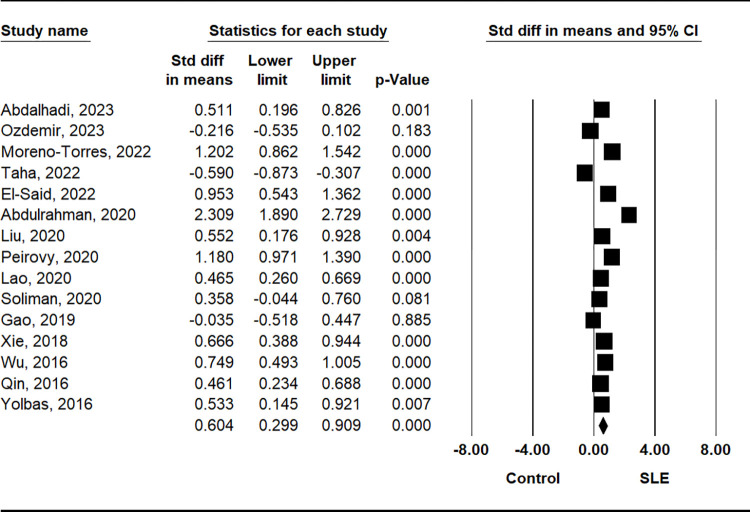
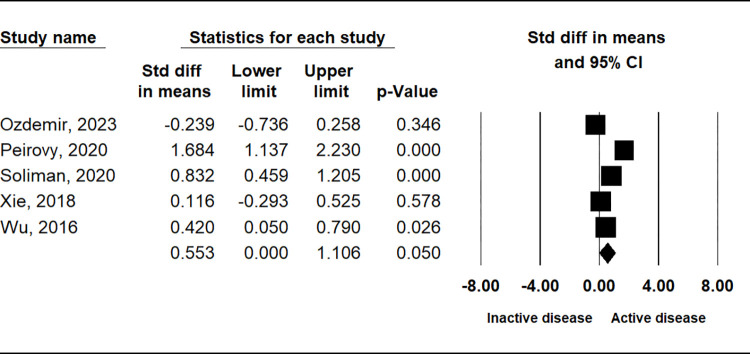
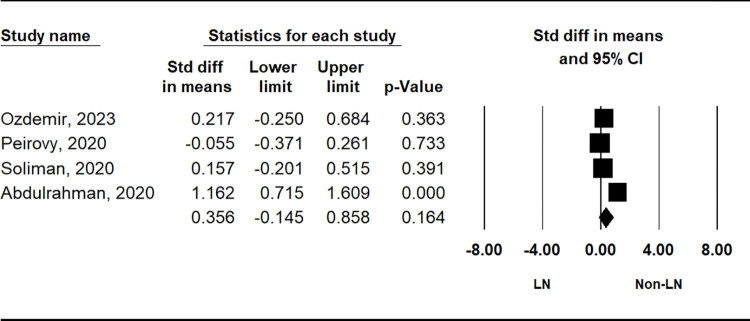
The comparison of PLR between patients with SLE and control subjects demonstrated a significant elevation in the SLE group (SMD = 0.604, 95% CI = 0.299–0.909, p = 0.001) (Table 2 and Fig 2). Stratification by ethnicity indicated notably higher PLR values in the SLE group among Asian and Arab populations, with no such trend observed in European populations (Table 2). Subgroup analysis based on sample size consistently revealed higher PLR in both small (n < 200) and large (n ≥ 200) sample size SLE groups (Table 2). Additionally, considering disease activity, the active disease group exhibited significantly higher PLR compared to the inactive disease group (SMD = 0.553, 95% CI = 0.000–1.106; p = 0.050) (Table 2 and Fig 3). However, no significant disparity in PLR was observed between the lupus nephritis (LN) and non-LN groups (Table 2 and Fig 4).
Table 2. Meta-analysis of PLR levels in SLE patients compared to that in controls.
| Groups | Population | No. of studies | Test of association | Test of heterogeneity | |||||
|---|---|---|---|---|---|---|---|---|---|
| SMD* | 95% CI | p-value | Model | p-value | I 2 | ||||
| All | Overall | 15 | 0.604 | 0.299–0.909 | < 0.001 | R | < 0.001 | 93.4 | |
| Ethnicity | Asian | 6 | 0.520 | 0.359–0.681 | < 0.001 | R | 0.082 | 48.7 | |
| Arab | 6 | 0.782 | 0.039–1.525 | 0.039 | R | < 0.001 | 96.9 | ||
| European | 3 | 0.505 | 0.344–1.353 | 0.244 | R | < 0.001 | 94.2 | ||
| Sample size | Small (< 200) | 9 | 0.684 | 0.215–1.153 | 0.004 | R | < 0.001 | 92.8 | |
| Large (≥ 200) | 6 | 0.492 | 0.053–0.932 | 0.028 | R | < 0.001 | 95.0 | ||
| SLE activity | Active vs. Inactive | 5 | 0.553 | 0.000–1.106 | 0.050 | R | < 0.001 | 87.9 | |
| LN | LN (+) vs. LN (-) | 4 | 0.356 | -0.145–0.858 | 0.164 | R | < 0.001 | 84.8 | |
PLR: Platelet to lymphocyte ratio, SLE: Systemic lupus erythematosus, LN: Lupus nephritis, CI: Confidence interval, F: Fixed effects model, R: Random effects model, NA: Not applicable.
*: Magnitude of Cohen’s d effect size (SMD): 0.2–0.5, small effect; 0.5–0.8, medium effect; ≥ 0.8, large effect.
Fig 2. A meta-analysis of PLR in patients with SLE and controls.
Fig 3. A meta-analysis of the correlation between PLR in groups with and without active disease.
Fig 4. A meta-analysis of the correlation of PLR between LN and non-LN groups.
Correlation between PLR and clinical findings
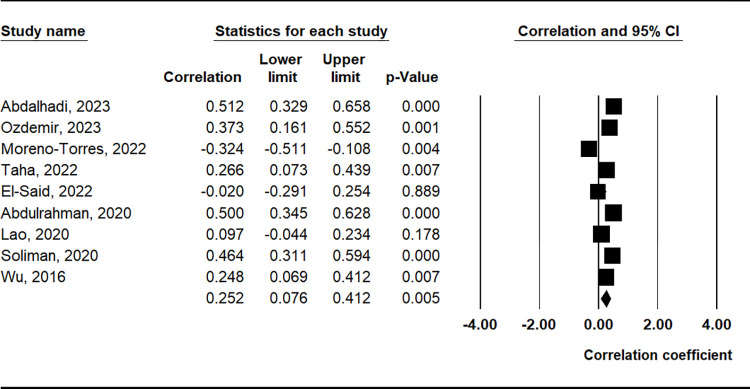
The meta-analysis revealed a positive correlation between PLR and the SLEDAI (correlation coefficient = 0.325, 95% CI = 0.176–0.459, p < 0.001) (Table 3 and Fig 5). Furthermore, PLR demonstrated positive correlations with markers such as erythrocyte sedimentation rate (ESR), proteinuria, C-reactive protein (CRP), complement component C3, and anti-double-stranded DNA (anti-dsDNA) antibody levels (Table 3 and Fig 6).
Table 3. Meta-analysis of the correlation coefficient between PLR level and SLIDAI, C3, C4, ESR, CRP, proteinuria, and anti-dsDNA in SLE.
| Parameters | No. of studies | Test of association | Test of heterogeneity | ||||
|---|---|---|---|---|---|---|---|
| Correlation coefficient | 95% CI | p-value | Model | p-value | I2 | ||
| SLEDAI | 12 | 0.325 | 0.176–0.459 | < 0.001 | R | < 0.001 | 87.8 |
| ESR | 9 | 0.252 | 0.076–0.412 | 0.005 | R | < 0.001 | 86.5 |
| CRP | 8 | 0.215 | 0.119–0.307 | < 0.001 | R | 0.040 | 52.2 |
| C3 | 5 | -0.280 | -0.356- -0.200 | < 0.001 | F | 0.405 | 0.260 |
| C4 | 5 | -0.181 | -0.352–0.002 | 0.052 | R | 0.001 | 77.4 |
| Proteinuria | 4 | 0.298 | 0.088–0.483 | 0.006 | R | 0.005 | 75.8 |
| Anti-dsDNA | 1 | 0.325 | 0.137–0.490 | 0.001 | NA | NA | NA |
PLR: Platelet to lymphocyte ratio, SLEDAI: Systemic lupus erythematosus disease activity index, ESR: Erythrocyte sedimentation rate, CRP: C-reactive protein, CI: Confidence interval, R: Random effects model, NA: Not available.
Fig 5. A meta-analysis of the correlation coefficient between the PLR and SLEDAI.
Fig 6. A meta-analysis of the correlation coefficient between the PLR and ESR.
Sensitivity, heterogeneity, and publication bias
An assessment of PLR variations among SLE studies highlighted heterogeneity between studies (Tables 2 and 3). However, the major source of heterogeneity in the PLR meta-analysis stemmed from variations in the effect size. Notably, heterogeneity in the PLR meta-analysis was significantly influenced by data type (p = 0.001), whereas factors such as ethnicity, sample size, or research quality did not significantly impact it. The sensitivity analysis indicated that no individual study disproportionately affected the overall effect size, reinforcing the robustness of the meta-analysis findings. The funnel plot demonstrated symmetry, and the application of Egger’s regression test provided no indication of publication bias (p > 0.1).
Discussion
The present meta-analysis showed significantly elevated PLR in the SLE group among the Asian and Arab populations but not among European populations, suggesting that there may be ethnicity-specific differences in the PLR-SLE relationship. However, it is essential to consider that the observed differences in the PLR among ethnic groups could be influenced by the number of studies available for each subgroup. As noted, there were only three European studies, compared to six studies in Asian and Arab populations. The limited number of European studies may have affected the precision and reliability of the estimates in this subgroup. Additionally, differences in study characteristics, patient demographics, and methodologies among the included studies may have contributed to the observed variations. Stratification of the PLR by ethnicity revealed further insights. Specifically, significantly elevated PLR was observed in the SLE group among Asian and Arab populations but not in the European populations. This finding suggests that ethnicity-specific differences may exist in the association between PLR and SLE. Genetic and environmental factors could contribute to these differences, warranting further investigation into the underlying mechanisms driving these disparities. Ethnicity-based variations in immune responses and inflammatory pathways may account for these differences, warranting further investigations into the underlying mechanisms driving these associations. Moreover, subgroup analysis based on sample size indicated that both small and large sample sizes in the SLE group showed significantly higher PLR than controls. This suggests consistency in the relationship between the PLR and SLE across different sample sizes, thereby enhancing the robustness of our findings. An important aspect of this study was the evaluation of the association between PLR and SLE disease activity. The results showed a trend of increased PLR in the active disease group compared with that in the inactive disease group, although the difference was not statistically significant. This trend suggests that the PLR may reflect disease activity to some extent; however, further research with larger cohorts is required to establish a definitive association.
We observed a positive association between PLR and SLEDAI, an established tool for assessing SLE disease activity. This correlation suggests that the PLR could serve as a complementary marker for disease activity assessment, particularly when SLEDAI scores are not readily available or feasible to obtain. Furthermore, the PLR was positively associated with ESR, proteinuria, and CRP, C3, and anti-dsDNA antibody levels. These findings indicate that the PLR may reflect not only systemic inflammation but also specific aspects of the pathogenesis of SLE, such as complement activation and renal involvement. These associations with laboratory parameters support the notion that PLR may reflect the overall inflammatory burden and disease severity in SLE. Interestingly, the meta-analysis did not find a significant difference in PLR between the LN and non-LN groups. Although this result may appear surprising, it underscores the complexity of SLE pathophysiology, as LN represents a distinct and severe manifestation of the disease. While PLR may exhibit a relationship with SLEDAI, this association does not necessarily imply a consistent link between LN and non-LN groups. SLE is a heterogeneous autoimmune disease with a wide array of clinical manifestations. LN represents a subset of patients with renal involvement, while others may predominantly exhibit extra-renal manifestations. The multifaceted nature of SLE implies that distinct immunopathogenic processes may be at play in different organ systems. PLR is generally associated with inflammatory processes. It is not specific to renal inflammation alone and may reflect systemic immune activation. Therefore, an association with SLEDAI may indicate an overall heightened immune response in SLE, irrespective of renal involvement. Future studies with larger LN cohorts could shed light on the role of the PLR in LN and its potential prognostic significance. There was a rationale for prioritizing the PLR marker above the neutrophil to lymphocyte ratio (NLR). The rationale for the choice was that a recent meta-analysis on the relationship between the NLR and Systemic Lupus Erythematosus (SLE) had previously been published [28].
Although this meta-analysis provides valuable insights into the association between the PLR and SLE, it had some limitations. First, the number of eligible studies was relatively small, which potentially limits the generalizability of the findings. Second, the included studies exhibited heterogeneity in terms of study design, patient characteristics, and PLR measurement methods, which may have influenced the results. Third, PLR is a non-specific marker for a number of diseases, including as autoimmune and inflammatory conditions. Since autoimmune disorders are heterogeneous, we concentrated on only SLE, a prototype of autoimmune disease, because its heterogeneity was low compared to autoimmune diseases. Nevertheless, one strength of this study was the rigorous and comprehensive nature of its meta-analysis. The study included a systematic literature search that identified nine relevant studies. This extensive data collection approach ensured that the findings were based on a large pool of data, thus enhancing the statistical power and generalizability of the results. By pooling data from multiple studies, the meta-analysis provides a more precise estimation of the relationship between the PLR and SLE. Meta-analyses are known for their ability to draw more robust conclusions than individual studies, especially when the effect size varies across different study populations and methodologies [29,30]. Thus, this meta-analysis strengthens the evidence of an association between the PLR and SLE, thereby increasing the credibility of the findings.
In conclusion, this meta-analysis demonstrated that PLR was higher in patients with SLE, with a significant positive correlation between PLR and SLEDAI, ESR, CRP, proteinuria, C3, and anti-dsDNA antibody levels. These findings support the potential of the PLR as a valuable biomarker for assessing systemic inflammation in SLE. However, further prospective studies with larger and more diverse cohorts are needed to validate these results and to determine the clinical utility of the PLR as a diagnostic and prognostic tool in SLE.
Supporting information
(DOCX)
Data Availability
All data are in the manuscript.
Funding Statement
The author(s) received no specific funding for this work.
References
- 1.Lee SJ, Nam EJ, Han MH, Kim YJ. Interstitial Inflammation in the ISN/RPS 2018 Classification of Lupus Nephritis Predicts Renal Outcomes and is Associated With Bcl-2 Expression. J Rheum Dis. 2022;29(4):232–42. doi: 10.4078/jrd.22.0011 . [DOI] [PMC free article] [PubMed] [Google Scholar]
- 2.Park DJ, Joo YB, Bang SY, Lee J, Lee HS, Bae SC. Predictive Factors for Renal Response in Lupus Nephritis: A Single-center Prospective Cohort Study. J Rheum Dis. 2022;29(4):223–31. doi: 10.4078/jrd.22.0006 . [DOI] [PMC free article] [PubMed] [Google Scholar]
- 3.Gasparyan AY, Ayvazyan L, Mukanova U, Yessirkepov M, Kitas GD. The Platelet-to-Lymphocyte Ratio as an Inflammatory Marker in Rheumatic Diseases. Ann Lab Med. 2019;39(4):345–57. doi: 10.3343/alm.2019.39.4.345 . [DOI] [PMC free article] [PubMed] [Google Scholar]
- 4.Ali RA, Wuescher LM, Worth RG. Platelets: essential components of the immune system. Curr Trends Immunol. 2015;16:65–78 . [PMC free article] [PubMed] [Google Scholar]
- 5.Abdalhadi S, Khalayli N, Al-Ghotani B, Kudsi M. Systemic lupus erythematosus disease activity and neutrophil-to-lymphocyte ratio and platelet-to-lymphocyte ratio: a cross-sectional case-control study. Ann Med Surg (Lond). 2023;85(5):1448–53. doi: 10.1097/MS9.0000000000000477 . [DOI] [PMC free article] [PubMed] [Google Scholar]
- 6.Ozdemir A, Baran E, Kutu M, Celik S, Yılmaz M. Could systemic immune inflammation index be a new parameter for diagnosis and disease activity assessment in systemic lupus erythematosus? Int Urol Nephrol. 2023;55(1):211–6. doi: 10.1007/s11255-022-03320-3 . [DOI] [PubMed] [Google Scholar]
- 7.Moreno-Torres V, Castejón R, Mellor-Pita S, Tutor-Ureta P, Durán-Del Campo P, Martínez-Urbistondo M, et al. Usefulness of the hemogram as a measure of clinical and serological activity in systemic lupus erythematosus. J Transl Autoimmun. 2022;5:100157. doi: 10.1016/j.jtauto.2022.100157 . [DOI] [PMC free article] [PubMed] [Google Scholar]
- 8.Taha SI, Samaan SF, Ibrahim RA, Moustafa NM, El-Sehsah EM, Youssef MK. Can Complete Blood Count Picture Tell Us More About the Activity of Rheumatological Diseases? Clin Med Insights Arthritis Musculoskelet Disord. 2022;15:11795441221089182. doi: 10.1177/11795441221089182 . [DOI] [PMC free article] [PubMed] [Google Scholar]
- 9.Liu P, Li P, Peng Z, Xiang Y, Xia C, Wu J, et al. Predictive value of the neutrophil-to-lymphocyte ratio, monocyte-to-lymphocyte ratio, platelet-to-neutrophil ratio, and neutrophil-to-monocyte ratio in lupus nephritis. Lupus. 2020;29(9):1031–9. doi: 10.1177/0961203320929753 . [DOI] [PubMed] [Google Scholar]
- 10.Peirovy A, Malek Mahdavi A, Khabbazi A, Hajialilo M, Sakhinia E, Rashtchizadeh N. Clinical Usefulness of Hematologic Indices as Predictive Parameters for Systemic Lupus Erythematosus. Lab Med. 2020;51(5):519–28. doi: 10.1093/labmed/lmaa002 . [DOI] [PubMed] [Google Scholar]
- 11.Lao X, Ma L, Ma Q, Ma Q, Yang Z, Guo L, et al. Hematological factors associated with immunity, inflammation, and metabolism in patients with systemic lupus erythematosus: Data from a Zhuang cohort in Southwest China. J Clin Lab Anal. 2020;34(6):e23211. doi: 10.1002/jcla.23211 . [DOI] [PMC free article] [PubMed] [Google Scholar]
- 12.Soliman WM, Sherif NM, Ghanima IM, El-Badawy MA. Neutrophil to lymphocyte and platelet to lymphocyte ratios in systemic lupus erythematosus: Relation with disease activity and lupus nephritis. Reumatol Clin (Engl Ed). 2020;16(4):255–61. doi: 10.1016/j.reuma.2018.07.008 . [DOI] [PubMed] [Google Scholar]
- 13.Xie S, Chen X. Red blood cell distribution width-to-platelet ratio as a disease activity-associated factor in systemic lupus erythematosus. Medicine (Baltimore). 2018;97(39):e12342. doi: 10.1097/MD.0000000000012342 . [DOI] [PMC free article] [PubMed] [Google Scholar]
- 14.Wu Y, Chen Y, Yang X, Chen L, Yang Y. Neutrophil-to-lymphocyte ratio (NLR) and platelet-to-lymphocyte ratio (PLR) were associated with disease activity in patients with systemic lupus erythematosus. Int Immunopharmacol. 2016;36:94–9. doi: 10.1016/j.intimp.2016.04.006 . [DOI] [PubMed] [Google Scholar]
- 15.Qin B, Ma N, Tang Q, Wei T, Yang M, Fu H, et al. Neutrophil to lymphocyte ratio (NLR) and platelet to lymphocyte ratio (PLR) were useful markers in assessment of inflammatory response and disease activity in SLE patients. Mod Rheumatol. 2016;26(3):372–6. doi: 10.3109/14397595.2015.1091136 . [DOI] [PubMed] [Google Scholar]
- 16.Yolbas S, Yildirim A, Gozel N, Uz B, Koca SS. Hematological Indices May Be Useful in the Diagnosis of Systemic Lupus Erythematosus and in Determining Disease Activity in Behçet’s Disease. Med Princ Pract. 2016;25(6):510–6. doi: 10.1159/000447948 . [DOI] [PMC free article] [PubMed] [Google Scholar]
- 17.Abdulrahman MA, Afifi N, El-Ashry M. Neutrophil/lymphocyte and platelet/lymphocyte ratios are useful predictors comparable to serum IL6 for disease activity and damage in naive and relapsing patients with lupus nephritis. Egypt Rheumatol. 2020;42(2):107–12. 10.1016/j.ejr.2019.08.002 WOS:000529331800005. [DOI] [Google Scholar]
- 18.El-Said NY, El Adle S, Fathi HM. Clinical significance of platelet-lymphocyte ratio in systemic lupus erythematosus patients: Relation to disease activity and damage. Egypt Rheumatol. 2022;44(3):225–9. 10.1016/j.ejr.2021.12.005 WOS:000754792600009. [DOI] [Google Scholar]
- 19.Gao X, Yin J, Wang X, Petersen F, Yu X. A comprehensive comparison of hematological parameters among 39 common diseases. Scand J Clin Lab Invest. 2019;79(4):251–9. doi: 10.1080/00365513.2019.1591636 . [DOI] [PubMed] [Google Scholar]
- 20.Moher D, Liberati A, Tetzlaff J, Altman DG. Preferred reporting items for systematic reviews and meta-analyses: the PRISMA statement. PLoS Med. 2009;6(7):e1000097. doi: 10.1371/journal.pmed.1000097 . [DOI] [PMC free article] [PubMed] [Google Scholar]
- 21.Hozo SP, Djulbegovic B, Hozo I. Estimating the mean and variance from the median, range, and the size of a sample. BMC Med Res Methodol. 2005;5:13. doi: 10.1186/1471-2288-5-13 . [DOI] [PMC free article] [PubMed] [Google Scholar]
- 22.Ridout KK, Ridout SJ, Price LH, Sen S, Tyrka AR. Depression and telomere length: A meta-analysis. J Affect Disord. 2016;191:237–47. doi: 10.1016/j.jad.2015.11.052 . [DOI] [PMC free article] [PubMed] [Google Scholar]
- 23.Wells G, Shea B, O’Connell D, Peterson J, Welch V, Losos M, et al. The Newcastle-Ottawa Scale (NOS) for assessing the quality of nonrandomised studies in meta-analyses. Ottawa, Ontario: Ottawa Hospital Research Institute; 2000. [Google Scholar]
- 24.Egger M, Smith GD, Phillips AN. Meta-analysis: principles and procedures. BMJ. 1997;315(7121):1533–7. doi: 10.1136/bmj.315.7121.1533 . [DOI] [PMC free article] [PubMed] [Google Scholar]
- 25.DerSimonian R, Laird N. Meta-analysis in clinical trials. Control Clin Trials. 1986;7(3):177–88. doi: 10.1016/0197-2456(86)90046-2 . [DOI] [PubMed] [Google Scholar]
- 26.Higgins JP, Thompson SG. Quantifying heterogeneity in a meta-analysis. Stat Med. 2002;21(11):1539–58. doi: 10.1002/sim.1186 . [DOI] [PubMed] [Google Scholar]
- 27.Egger M, Davey Smith G, Schneider M, Minder C. Bias in meta-analysis detected by a simple, graphical test. BMJ. 1997;315(7109):629–34. doi: 10.1136/bmj.315.7109.629 . [DOI] [PMC free article] [PubMed] [Google Scholar]
- 28.Wang L, Wang C, Jia X, Yang M, Yu J. Relationship between Neutrophil-to-Lymphocyte Ratio and Systemic Lupus Erythematosus: A Meta-analysis. Clinics (Sao Paulo). 2020;75:e1450. doi: 10.6061/clinics/2020/e1450 . [DOI] [PMC free article] [PubMed] [Google Scholar]
- 29.Lee YH, Song GG. Mendelian Randomization Research on the Relationship Between Rheumatoid Arthritis and Systemic Lupus Erythematosus and the Risk of Autistic Spectrum Disorder. J Rheum Dis. 2022;29(1):46–51. doi: 10.4078/jrd.2022.29.1.46 . [DOI] [PMC free article] [PubMed] [Google Scholar]
- 30.Lee YH, Song GG. Association Between Signal Transducers and Activators of Transcription 4 rs7574865 Polymorphism and Systemic Lupus Erythematosus: A Meta-analysis. J Rheum Dis. 2020;27(4):277–84. 10.4078/jrd.2020.27.4.277 WOS:000576437400008. [DOI] [Google Scholar]
Associated Data
This section collects any data citations, data availability statements, or supplementary materials included in this article.
Supplementary Materials
(DOCX)
Data Availability Statement
All data are in the manuscript.


