

Summary
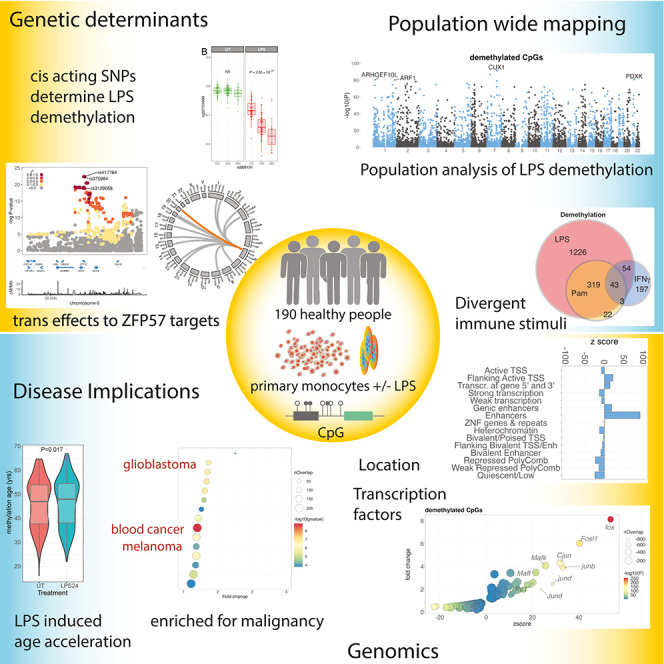
To better understand inter-individual variation in sensitivity of DNA methylation (DNAm) to immune activity, we characterized effects of inflammatory stimuli on primary monocyte DNAm (n = 190). We find that monocyte DNAm is site-dependently sensitive to lipopolysaccharide (LPS), with LPS-induced demethylation occurring following hydroxymethylation. We identify 7,359 high-confidence immune-modulated CpGs (imCpGs) that differ in genomic localization and transcription factor usage according to whether they represent a gain or loss in DNAm. Demethylated imCpGs are profoundly enriched for enhancers and colocalize to genes enriched for disease associations, especially cancer. DNAm is age associated, and we find that 24-h LPS exposure triggers approximately 6 months of gain in epigenetic age, directly linking epigenetic aging with innate immune activity. By integrating LPS-induced changes in DNAm with genetic variation, we identify 234 imCpGs under local genetic control. Exploring shared causal loci between LPS-induced DNAm responses and human disease traits highlights examples of disease-associated loci that modulate imCpG formation.
Keywords: DNA methylation, monocytes, LPS, innate immune activation, genetics, mQTL, epigenetic aging, cancer
Graphical abstract
Highlights
-
•
LPS stimulation causes widespread DNA methylation changes in primary monocytes
-
•
Loci demethylated by LPS are enriched for enhancers and genes implicated in cancer
-
•
Innate immune activation in monocytes induces epigenetic aging
-
•
Shaping of DNA methylation by LPS is under genetic control
To explore the relationship between immune activity, genetic variation, and DNA methylation (DNAm), Gilchrist et al. characterized consequences of inflammatory stimuli on monocyte DNAm (n = 190 paired samples). They find that monocyte DNAm shows stimulus-specific focal sensitivity at sites enriched for enhancers, is influenced by genotype, and predominantly involves cancer mutated genes.
Introduction
Persistent innate immune activity leads to chronic inflammation, a characteristic of multiple non-communicable disease states, including metabolic syndrome, cardiovascular disease, and cancer.1 Monocytes are key mediators of innate immune responses. They make up 10% of circulating leukocytes in peripheral blood, acting as a source of tissue macrophages and dendritic cells as well as directly contributing to innate immune surveillance and effector functions.2 Monocyte-expressed receptors ligate microbial pathogen-associated molecular patterns (PAMPs) that, in concert with cytokine signals, direct activation, trafficking, and differentiation. We3 and others4,5 have previously demonstrated that stimulation of monocytes with PAMPs (e.g., lipopolysaccharide [LPS]), or cytokines (e.g., interferon γ [IFNγ]), induces large-scale transcriptional changes, which vary between individuals and are under genetic control.
DNA methylation (DNAm), the formation of 5-methylcytosine (5mC) at CpG dinucleotides, is a heritable epigenetic modification with profound effects on transcription factor usage and gene expression.6 Similar to gene expression, DNAm is influenced by both local7 and trans-acting8 genetic variation, forming methyl quantitative trait loci (mQTLs). Blood cell DNAm is additionally modulated by cellular differentiation, including memory B cell formation9 and T cell diversification,10 as well as environmental exposures, most notably smoking.11 Changes in DNAm accrue with age, an observation that has led to the development of epigenetic clocks, which accurately estimate chronological age.12 Moreover, age acceleration, as defined by epigenetic aging in excess of chronological age, is associated with health outcomes, including longevity,13 cognitive function,14 cancer,15 and all-cause mortality.16 Infection and inflammatory stimuli interact with DNAm, with Leishmania17 and mycobacterial18 infections shown to induce DNAm changes. LPS stimulation of myeloid cells,19 monocyte-to-macrophage/dendritic cell differentiation,20,21 and, to a lesser extent, macrophage polarization22 have similarly been shown to perturb DNAm. However, the consistency of LPS-induced changes in monocyte DNAm across individuals and the influence of genome-wide genetic variation are unexplored. Here, we have addressed how divergent innate immune stimuli modulate DNAm in primary monocytes, assessing variance between individuals and the effect of genetic variation.
In a pilot study we characterized the effect of innate immune stimulation on monocyte DNAm with three key innate immune stimuli: Pam3CysK4, LPS, and IFNγ. Pam3CysK4 is a synthetic agonist of Toll-like receptor (TLR)-1/2, which detects bacterial lipoprotein.23 LPS forms a key component of gram-negative bacterial outer membranes and ligates TLR-4.23 IFNγ is a type II IFN that upregulates monocyte antigen presentation, induces cytokine release, and promotes pro-inflammatory polarization.24We found that Pam3CysK4, LPS, and IFNγ have shared and distinct effects on monocyte DNAm, with LPS inducing the most marked changes in DNAm. We thus explored the effects of LPS stimulation on DNAm at the population level in paired untreated and LPS-treated monocytes from 190 healthy European adults. Using this large cohort, we comprehensively define sites of LPS-induced differential methylation. We describe the kinetics of LPS-induced DNAm changes and demonstrate that LPS-induced CpG demethylation is an active process, mediated by ten-eleven translocation (TET) methylcytosine dioxygenases. We show that LPS stimulation induces changes in the epigenetic clock, with 24-h LPS stimulation leading to age acceleration equivalent to 6 months. We describe how LPS-induced changes in DNAm vary with respect to genomic location and function and how baseline DNAm predicts LPS response. Finally, we map genetic determinants of LPS-induced DNAm changes, identifying genetic variation that underlies inter-individual differences in LPS-induced DNAm responses. These genetic predictors of LPS-induced DNAm response colocalize with a range of disease traits, identifying a role for inflammation-induced DNAm changes in human health.
Results
TLR agonists and IFNγ trigger divergent changes in DNAm
To characterize how different immune stimuli affect DNAm, primary monocytes were exposed to either the TLR ligands Pam3CysK4 or LPS or the type II IFNγ. Pairwise comparison of methylation was analyzed in limma25 alongside incubator controls (24-h exposure; n = 27 LPS, n = 11 Pam3CysK4, n = 22 IFNγ). While most CpGs remained stable, 2,371 of 407,951 (0.6%) CpGs demonstrated immune sensitivity in methylation to at least one stimulus (Table S1). Principal-component analysis of these immune-modulated CpGs (hereafter referred to as imCpGs) demonstrated that treatments elicited shared and divergent effects (Figures 1A and 1B). Restricting analysis to samples with stimuli across all conditions (n = 11) demonstrated that LPS elicited the most detectable changes in methylation, with substantial overlap with PAM3CysK4 responses (Figure 1C).
Figure 1.

Monocyte DNAm is influenced at distinct sites by divergent immune stimuli, with LPS-induced changes involving hydroxymethylation formation
(A) Principal-component analysis of 2,371 differentially methylated CpGs across any treatment (FDR ) shows that samples cluster according to treatment.
(B) Examples of CpGs showing significant differential methylation with divergent treatments, including cg01882871 6.2 kb upstream of CCL2 (PAM3CysK4-specific demethylation), cg12762413 within the gene body of RHOU (IFNγ-specific demethylation), cg15912732 within the gene body of AKT1 (PAM3CysK4 and LPS methylation), and cg27409514 intronic to SBNO2 (pan-treatment demethylation).
(C) Differentially methylated CpGs seen for each treatment (n = 11 individuals) summarized in Venn diagrams.
(D) Density plot of median UT beta of CpGs from pilot samples (n = 27) comparing CpGs that are stable (n = 405,580) versus those that are either methylated (n = 384) or demethylated (n = 1,987) across any condition.
(E) Variance of beta values for a CpG in UT samples according to the number of treatments under which it is observed to be modulated. CpGs not observed to change with treatment (n = 405,580) have reduced variance across the cohort compared to those modulated in one condition (n = 1,726, , Wilcoxon rank-sum test), 1 vs. 2 (n = 570) conditions (), and 2 vs. 3 (n = 75) conditions ().
(F and G) Boxplots of all CpGs (F) significantly methylated with either 6- or 24-h LPS or (G) significantly demethylated at either 6 or 24 h of LPS. ∗∗, ∗∗∗ (Wilcoxon signed-rank tests of either UT vs. 6 h LPS or 6 h LPS versus 24 h LPS).
(H) Baseline percentage 5hmC methylation at demethylated immune-modulated CpGs, methylated immune-modulated CpGs, and across all sequenced CpGs (background), as assayed with paired bisulfite (BS) and oxidative BS (OxBS) sequencing. ∗∗∗; ns, not significant (Wilcoxon rank-sum tests).
(I) Percentage total (left), 5mC (middle), and 5hmC (right) methylation at LPS-demethylated immune-modulated CpGs in the UT state and following 6 and 24 h of LPS stimulation, as assayed with paired BS and OxBS sequencing. ∗, ∗∗∗ (Wilcoxon signed-rank tests).
In box-and-whisker plots, boxes depict the upper and lower quartiles of the data, and whiskers depict the range of the data excluding outliers (outliers are defined as data points the interquartile range from the upper or lower quartiles).
Similar to CpGs that vary between cell types,26 imCpGs had comparatively more intermediate methylation compared to stable CpGs in the untreated state (, Kolmogorov-Smirnov test; Figure 1D) and demonstrated elevated baseline variance in methylation between individuals. This increased with the number of conditions to which the CpG was sensitive (Figure 1E) and suggests that a subset of monocyte CpGs are primed to innate immune stimuli. We hypothesize that this may reflect that CpGs responsive to LPS are already variable at baseline due to heterogeneity in activation or differentiation state among circulating monocytes, sites that are thus more likely to exhibit changes in DNAm with ex vivo stimulation. There are many more stable CpGs (n = 405,580) than there are CpGs methylated/demethylated (n = 384, n = 1,987 respectively) following innate immune stimulation. To confirm that the association between baseline methylation and imCpGs is not an artifact of discrepant sample size, we repeated our analysis, down-sampling stable CpG numbers to those of the methylated/demethylated comparator group. The differences in baseline methylation distribution are robust to differences in sample size, with methylated and demethylated CpGs having more intermediate baseline methylation values than their stable counterparts across 1,000 permutations (demethylation maximum Kolmogorov-Smirnov test, ; methylation maximum Kolmogorov-Smirnov test, ; Figure S1).
To explore the effect of time on LPS-modulated DNAm, we treated monocytes with LPS for 6 or 24 h (n = 18). We found LPS-induced gain in methylation was an early phenomenon, with 126 and 135 imCpGs showing an increased methylation signal at 6 h and 24 h, respectively (Table S2). On average, CpGs with an increased methylation signal at 24 h showed more marked methylation induction at 6 h, indicating that maximal gain in methylation occurs early with subsequent demethylation at these sites (Figures 1F and S2). Notably, 11 imCpGs showed increased beta values at 6 h, with a net loss in beta values detected by 24 h (Figure S2). Conversely, 99.4% (1,281 of 1,289) demethylated imCpGs at 6 h demonstrated further demethylation by 24 h, indicating that demethylation is more continuous and prolonged (Figures 1G and S2; Table S2).
LPS-induced demethylation involves the formation of 5hmC
Cell division could lead to passive loss of DNAm through DNA replication. To test whether LPS stimulation induced monocyte cell division in our experimental system we used carboxyfluorescein succinimidyl ester (CFSE) cell proliferation assays to monitor monocyte proliferation over the time-course of the experiment. These assays demonstrated that LPS stimulation does not induce cell division in monocytes in our system (data not shown), indicating that the observed LPS induced DNA demethylation is independent of cell division. Active demethylation involves TET enzymes that catalyze the oxidation of 5mC to form 5-hydroxymethylcytosine (5hmC),27,28 with successive oxidation culminating in base excision repair and replacement with non-methylated cytosine. To ascertain whether LPS-induced demethylation involved 5hmC formation in monocytes, we used pairwise bisulfite (BS) and oxidative BS (OxBS) sequencing29 of target-captured methylome DNA from 4 individual monocyte samples at baseline and 6 and 24 h of LPS treatment. Across pooled reads from all samples, we identified 107 imCpGs identified in the array time course experiment, where we had sufficient coverage to monitor methylation in the sequencing data. ImCpGs have significantly higher baseline 5hmC levels compared with background CpGs similarly covered in arrays (demethylated ImCpGs, 6%; methylated ImCpGs, 8%; vs. 0.5% background, ) (Figure 1H). We note a fall in both total and 5mC signals at array-determined LPS-demethylated imCpGs at 6 and 24 h (Figure 1I), whereas the 5hmC signal at these sites increases at both 6 and 24 h, demonstrating that LPS-induced demethylation involves the formation of this intermediary (Figure 1I).
Differential methylation in response to LPS across a population
To explore variation in observed changes in methylation across a population of individuals, we focused on the 24-h LPS response. We increased the total sample size to 192 healthy adults of European ancestry (Figure S3), aged 31–66 years (median 50 years), 125 female (65%), with a body mass index 17.4–43.0 kg/m2 (median, 24.2 kg/m2). After quality control, we generated paired untreated vs. LPS methylation data for a total of 190 individuals. Inspection of methylation array quality control SNPs did not identify sample mismatches. LPS stimulation modulated DNAm at 46,891 imCpGs (11.6% of tested, false discovery rate ), with 28,298 (7.0%) showing gain in methylation and 18,593 (4.6%) demethylation (Table S3). There was high concordance in responses from the original 27 samples and the further 163 samples (; Figure S4). The LPS-induced methylation changes that we observe are pronounced. Given the large size of our cohort and the pairwise design of the experiment and analysis, it is unlikely that these findings represent unassayed confounding variations or experimental artifacts. In keeping with this, pairwise analysis of untreated and metformin-treated monocytes (n = 6) in the same experimental system results in no discernible experiment-wide inflation of test statistics, in contrast to LPS-treated samples (Figure S5), strongly suggesting that the observed association between LPS treatment and DNAm is specific and is likely to represent the true scale of the effect of LPS exposure on DNAm in monocytes. Nevertheless, we further sought to identify a set of high-confidence LPS imCpGs for use in downstream analysis. To do so, we used the R package BACON30 to define an empirical null distribution of LPS-induced differential DNAm in our experiment and to further correct for any identified inflation or bias (Figure S6). BACON estimates inflation in our uncorrected test statistics to be 1.47 and bias to be 0.27. Following correction, LPS stimulation modulated () DNAm at 7,359 imCpGS (1.8%), with 1,471 (0.4%) imCpGs demonstrating gain in DNAm and 5,887 (1.5%) showing demethylation (Figure 2A; Table S4).
Figure 2.

Characterization of pan-cohort LPS-induced changes in monocyte DNAm denotes genomic enrichment, disease associations, and epigenetic age-acceleration
(A) Manhattan plots of differentially methylated CpGs in response to LPS stimulation; shown are all CpGs (top), demethylated CpGs (blue, middle), and CpGs with gains of methylation (red, bottom). The p values represent moderated t tests of pairwise linear models.
(B) Enrichment of significantly demethylated imCpGs (blue, top) and CpGs with significant gains of methylation in response to LPS stimulation (red, bottom) with ENCODE chromatin state segmentations.
(C) Enrichment of demethylated imCpGs within promoter-captured enhancer DNA regions across 17 cell types.
(D) Enrichment of imCpGs within TFBSs in K562 cells.
(E and F) Reactome Immune System (E) and Disease Ontology (F) pathway analyses of genes proximal (within 5 kb) to LPS-demethylated CpGs in monocytes. All depicted pathways are significantly enriched (adjusted ), with the most signficantly enriched pathways from each ontology plotted. Reactome Immune System, 15 of 57; Disease Ontology, 15 of 67. nOverlap, number of overlapping genes from a pathway. Enrichment is calculated using Fisher’s exact tests.
(G) Correlation of methylation age vs. chronological age for monocytes (UT) from 92 individuals (male, red; female, blue). The p value represents Pearson’s product moment correlation.
(H) Effect of LPS stimulation on methylation age (left). Shown are the relationship between baseline methylation age vs. chronological age (individuals dichotomized as methylation increased or reduced with respect to chronological age) and change in methylation age on LPS stimulation (right). The p values are calculated with Wilcoxon signed-rank tests.
In box-and-whisker plots, boxes depict the upper and lower quartiles of the data, and whiskers depict the range of the data excluding outliers (outliers are defined as data points the interquartile range from the upper or lower quartiles). Violin plots are trimmed to the range of the data.
We further identified differentially methylated regions (DMRs) induced by LPS with DMRcate,31 observing 6,473 regions where two or more contiguous CpGs showed differential methylation (50.8% demethylated, median length 5 CpGs, range 2–94 CpGs; 49.2% methylated, median length 4 CpGs, range 2–82 CpGs; Kolmogorov-Smirnov test, ; Table S5). Highly demethylated regions were observed across the genes DAXX, CUX1, and ARID5B, with the most significant DMR in DAXX, while the most demethylated CpGs were observed in the eighth intron of the gene CUX1 (maximally at cg15755348), encoding a protein with transcriptional repressor and activator properties (CUX1 [cut-like homeobox 1])32 frequently haploinsufficient or mutated across hematological malignancies and solid tumors.33,34 Notably, this region was the most demethylated using BS and OxBS sequencing (Figure S7). We also noted demethylation across multiple interleukin-encoding genes and receptors, including IL36RG, IL1RN, IL1A, and IL7R, which we have previously shown to be strongly induced in monocytes by LPS.35 Examples of regions gaining methylation signal include CHID1, AKT1, and ITGAE, with the largest induction being noted at cg15912732 in the third intron of AKT1. AKT1 encodes protein kinase B, which is a sentinel for cell growth and division. Interestingly, deletion of CUX1, which is antagonistic to the phosphatidylinositol 3-kinase 1 pathway, results in hyperactivation of AKT1,34 suggesting synergistic effects in the changes observed. Given that the number of DMRs defined over the cohort varies according to the parameters provided to the model, and the relative sparsity in coverage from the array, we focused downstream analysis on single CpGs.
Genomic organization of differential methylation
We assessed the distribution of imCpGs among chromatin state annotations in primary monocytes36 (Figure 2B). We found that imCpGs show enrichment across divergent genomic locations according to their behavior, with profound enrichment for demethylated imCpGs in enhancer (), transcription start site flanking (), genic enhancer (), and transcription flanking () regions. The majority of other regions were depleted for demethylated imCpGs, most notably repressed polycomb regions () and heterochromatin (). While imCpGs showing gain in methylation were also enriched for enhancers () and genic enhancers (), the fold change of that enrichment was markedly reduced compared to demethylated imCpGs (Figure 2B). ImCpGs with gain in methylation were also significantly enriched for heterochromatin (), in contrast to the pattern observed for demethylated imCpGs. To ascertain whether imCpGs involved genomic regions with evidence of physical interaction with promoters consistent with enhancer activity, we interrogated promoter capture HiC data for 17 different cell types. 37 This demonstrated that demethylated imCpGs are highly enriched within promoter-captured enhancer DNA from monocytes (2.4-fold change; ; Figure 2C). We found no enrichment with methylated imCpGs. In keeping with enhancer usage being influenced by cell type, the degree of enrichment of demethylated imCpGs to promoter-captured DNA across monocytes was markedly greater than the other 16 cell types (Figure 2C). Finally, we explored the relationship between imCpGs and CpGs that are differentially methylated during monocyte-to-macrophage differentiation. Using post-quality-control probe data for 5,503 of 5,780 CpGs previously associated with macrophage differentiation,22 we observed that 1,301 of 7,359 imCpGs are additionally implicated in differentiation, demonstrating strong enrichment for these CpGs and indicating shared genomic regions between these processes (odds ratio [OR] = 20.3; Fisher’s exact test, ). However, examination of the direction of effect of LPS versus differentiation on the methylation state of these overlapping CpGs demonstrated that LPS was more likely to have opposing effects on methylation state to those observed with macrophage differentiation (830 of 1,301 discordant direction of effect of LPS and differentiation, 471 of 1,301 concordant direction). This is in keeping with a shared subset of CpGs within monocytes that demonstrate distinct and frequently divergent responses to both innate immune activation as well as mediators of differentiation.
Transcription factor usage
Among transcription factor binding sites (TFBSs) in K562 cells, demethylated imCpGs were highly enriched in TFBSs of 88 different transcription factors (Figure 2D; Table S6), with AP-1 subunits showing the most prominent enrichment (FOSL1: 8.1 increase, ; JUND: 2.5 increase, ). Conversely, there was comparatively limited enrichment for methylated imCpGs overlapping TFBSs (Table S7), with subtle enrichment noted for C/EBP, EGR-1, and PU.1, in keeping with preferential heterochromatin location of methylated imCpGs. The K562 chromatin immunoprecipitation sequencing data do not contain information regarding a number of transcription factors, notably nuclear factor B (NF-B), which is a key mediator of the LPS response. We therefore also looked at data from the lymphoblastoid cell line GM12878 and observed marked enrichment of demethylated imCpGs (Tables S8 and S9; Figure S8) for JUN (JUND: 11.6 enrichment, ), ATF (BATF: 5.7 enrichment, ), and NF-B (2.4 enrichment, ). Consistent with our findings, AP-1 TFBSs have been shown previously to be preferentially demethylated during monocyte-to-macrophage differentiation, with C/EBP and PU.1 binding sites shown to gain methylation.22 This commonality of transcription factor (TF) usage indicates a continuum between early LPS-induced monocyte activation and subsequent monocyte-to-macrophage differentiation.
LPS-modulated CpGs are informative of human disease
To understand the biological significance of imCpGs, we performed enrichment analysis of the most proximal gene (within a 5-kb window) to an imCpG, using Reactome Immune System38 (R-HSA-168256) and Disease Ontology39 gene annotations in XGR.40 Among methylated imCpGs, of which 790 were within 5 kb of a gene, there was no evidence for biological pathway or human disease enrichment. By contrast, among genes proximal to demethylated imCpGs (n = 3,174), we observed striking enrichment (Figure 2E; Table S10) for immune-related biological pathways (n = 57, ), including phagocytosis (n = 2 pathways), TLR signaling (n = 15), and cytokine signaling (n = 16). We further observed marked enrichment of genes proximal to demethylated imCpGs (Figure 2F; Table S11) among pathways implicated in the pathogenesis of cancer (n = 34 pathways), in particular hematological malignancy (n = 7), autoimmune disease (n = 9), and viral infection (n = 4).
Treatment with LPS causes epigenetic age acceleration
We examined the relationship between LPS-induced differential DNAm and age, sex, and smoking status by testing for interactions with LPS treatment but did not observe any CpG where the degree of differential methylation significantly interacted with these variables, suggesting that the effect of LPS was independent of key demographic factors. While the association between DNAm and chronological age is well characterized,41,42,43 and disease states have been associated with epigenetic age,13,14,15,16 the extent to which age-associated CpG methylation is plastic in the short term is unclear. Interestingly, while CpGs associated with age acceleration are implicated in TLR and IFN responses,44 the majority of epigenetic clocks are derived from whole-blood DNAm measurements, and LPS-activated monocytes assayed here are likely distinct from cells circulating in the periphery in healthy donors. To explore whether treatment with LPS influenced the epigenetic age of samples, we used the epigenetic clock as described by Horvath, a multi-tissue estimator of epigenetic age, to determine whether exposure to LPS caused age acceleration in monocytes.45 We explored age-related changes in methylation across untreated (UT) and LPS-treated samples, observing 29,134 (Table S12) and 24,389 (Table S13) CpGs associated with age, respectively. There was a high concordance between significant results (, ; Figure S9). Similar to others,46 we observed the clock to significantly underestimate the age of older individuals (Wilcoxon rank-sum test, ; median difference, 3.1 years; n = 92; Figure 2G). Irrespective, this observation should not impact a pairwise comparison of UT and LPS-treated monocytes. This demonstrated that LPS exposure elicited a small but significant increase in epigenetic age across the group (median difference, +0.6 years; Wilcoxon rank-sum test, ; Figure 2H). Further analysis of this LPS-induced age acceleration showed that the effect was confined to those without baseline epigenetic age acceleration, with the effect of LPS on these individuals leading to a pronounced age acceleration (median difference = +1.1, ; Figure 2H). Younger individuals are more likely to have baseline epigenetic age acceleration, and we therefore tested whether this result could be confounded by age. This is not the case, with LPS-induced epigenetic age acceleration being restricted to individuals with reduced baseline epigenetic age in both younger and older individuals (Figure S10). To test whether these observations were robust to the choice of epigenetic clock, we recapitulated this analysis using the Hannum,47 PhenoAge,44 and PCGrimAge48 clocks (Figure S11). In keeping with our findings using the Horvath clock, LPS stimulation significantly increased epigenetic age in the Hannum (), PhenoAge (), and PCGrimAge clocks (). Again, consistent with our findings using the Horvath clock, we observed that the effect of LPS on epigenetic age was greatest among individuals with lower baseline age acceleration in all clocks tested (Figure S11). Epigenetic age estimated in whole blood is associated with variation in the circulating proportions of naive and activated T and natural killer cells.49 Our data extend and expand these observations, demonstrating, for the first time, rapid plasticity of the DNAm epigenetic clock, with short-term activation of the TLR4 pathway inducing age acceleration. The restriction of this effect to those without baseline epigenetic age acceleration rules out non-specific sequelae of LPS, which would apply to all, and suggests that individuals with epigenetic age equal to or greater than chronological age have already accrued modifications at these LPS-sensitive sites through life events.
Baseline determinants of change in methylation
In our pilot experiment, we demonstrated that imCpGs have a distinct pattern of baseline methylation compared to CpGs not responsive to innate immune stimulation (Figures 1D and 1E). We sought to expand on these findings within the population-scale LPS experiment, exploring the relationship between LPS-induced methylation change at a given imCpG and baseline methylation. For the majority of LPS-modulated imCpGs (6,685 of 7,359, 91%) we find magnitude of response to be correlated with baseline methylation (Figures 3A and 3B). That is, LPS responsiveness at an imCpG in an individual is dependent on the degree of CpG methylation in that individual at baseline. For most baseline-correlated (BC) methylated imCpGs, baseline methylation is inversely correlated with the magnitude of methylation change in response to LPS (n = 6,614 of 6,685). Thus, for demethylated BC imCpGs, high baseline methylation was associated with greater demethylation, while for methylated BC imCpGs, low baseline methylation was associated with increased gain in methylation.
Figure 3.

Identification of correlates of differential CpG methylation in response to LPS
(A) Relationship between baseline methylation and change in methylation induced by LPS for all imCpGs. ImCpGs are colored according to evidence of correlation between baseline methylation and LPS-induced methylation change: baseline-correlated (BC) imCpGs, blue; baseline-independent (BI) imCpGs, red.
(B) Examples of BC and BI imCpGs for LPS-methylated and LPS-demethylated loci.
(C) BC and BI imCpGS have distinct baseline methylation distributions (left) and distinct methylation responses to LPS stimulation (right). Distributions are compared with Kolmogorov-Smirnov tests.
(D) Enrichment for overlap with TFBSs in K562 cells at BC and BI methylated and demethylated imCpGs. Significantly enriched TFBSs () are colored according to enrichment p-value (two-tailed binomial test). TFs not significantly associated with an imCpG group are colored gray. The top three enriched TFs for each imCpG group are labeled.
(E) Enrichment for overlap with ENCODE chromatin state segmentations for BI and BC imCpGs. The p values are calculated by two-tailed binomial tests. Significantly enriched () chromatin states for each imCpG group are colored: BI, red; BC, blue.
For 568 of 5,585 (10.2%) demethylated imCpGs and 97 of 1,465 (6.6%) methylated imCpGs, we observe no correlation () between baseline methylation and response to LPS (Figures 3A and 3B). Baseline-independent (BI) imCpGs demonstrated a significant difference (demethylated imCpGs, ; methylated imCpGs, ) in the distribution of UT DNAm beta values, with more intermediate baseline methylation values, indicating heterogeneity at these positions among cells (Figure 3C) and suggesting that these represent a different subset of LPS-responsive CpGs. We find that BI demethylated imCpGs tend to be more responsive to LPS than BC demethylated imCpGs (), whereas the effect of LPS on BI methylated imCpGs is less than at BC methylated imCpGs (; Figure 3C). BI and BC imCpGs diverge in their TF usage (Figure 3D; Table S14). As for demethylated imCpGs overall, BI and BC demethylated imCpGs are both highly enriched for AP-1 subunits, whereas BC methylated imCpGs are enriched for a distinct set of TFBSs, including EGR1, a pattern not observed for BI methylated imCpGs (Figure 3D). EGR1 has been shown to recruit the TET enzyme TET1.50 This is complementary to our observation that imCpgs are enriched for 5hmC at baseline (Figure 1H), suggesting a model in which BC imCpGs are primed for LPS-induced methylation changes, in part through EGR1-mediated TET enzyme recruitment and formation of 5hmC. In keeping with the absence of enrichment for TFBSs among BI methylated imCpGs, these imCpGs are specifically enriched for transcriptionally inactive DNA: heterochromatin and polycomb repressed regions (Figure 3E).
Genetic determinants of LPS-induced methylation changes
Genetic variation is a significant determinant of CpG methylation.7,8 In keeping with this, we were able to identify () 69,370 and 69,503 mQTLs in UT monocytes and LPS-stimulated monocytes, respectively (Tables S15 and S16). Given the marked alterations in DNAm observed following LPS stimulation, however, we were interested to define whether genetic variation influenced the effect of LPS on DNAm and associated imCpG formation. In a paired analysis (n = 188 individuals), we correlated the magnitude of change in methylation on LPS stimulation (delta: methylation beta LPS-treated monocytes minus methylation beta UT monocytes) at the 7,359 imCpGs with genotype at common, well-imputed SNPs within 100 kb of the CpG. Mapping immune-modulated mQTLs (im-mQTLs) in this way reveals 234 CpGs (3.2%) for which changes in methylation in response to LPS stimulation are influenced by germline genetic variation (Figure 4A; Table S17). We find that im-mQTL are more frequent among demethylated imCpGs as compared to methylated imCpGs (217 vs. 17, , , Fisher’s exact test). To better define how identified im-mQTLs relate to genetic determinants of CpG methylation at baseline, we used Coloc to compare LPS-induced im-mQTL signals with mQTL signals in unstimulated monocytes. We defined an im-mQTL as de novo where Coloc best supports a model in which the im-mQTL signal was unique or distinct to that seen in the unstimulated state. Of 234 im-mQTL, 96 are de novo (Table S18), an example of which is an im-mQTL for cg02724909 methylation (Figures 4B and 4C), where genetic variation at rs869191 controls the degree of LPS-induced demethylation despite having no effect on methylation at baseline. For the remaining 138 im-mQTLs, Coloc best supports a model in which shared genetic variation affects both baseline DNAm and DNAm changes in response to LPS. In these cases, LPS stimulation may augment the effect of a baseline mQTL on DNAm; i.e., a baseline enhanced im-mQTL (n = 108), an example of which is an im-mQTL for cg17462560 methylation (Figures 4D and 4E). Alternatively, LPS stimulation can reduce the effect of a baseline mQTL on DNAm; i.e., a baseline diminished im-mQTL (n = 30). We further assessed whether detection of an im-mQTL at a CpG simply reflects absent or lower methylation at that CpG in the state in which we do not observe a genetic effect. In fact, the converse appears to be the case, with 217 of 234 im-mQTLs demonstrating decreased methylation in the state in which the im-mQTL is present or enhanced (Table S18).
Figure 4.

Integration of genetic variation reveals local regulatory determinants of LPS-induced imCpGs
(A) Manhattan plot of immune-modulated methylation quantitative trait loci (im-mQTLs) in LPS-stimulated monocytes (n = 234).
Shown is QTL mapping of normalized differential methylation following LPS stimulation (delta, methylation beta LPS-treated monocytes minus methylation beta UT monocytes) in cis (within 100 kb of the CpG) at 7,359 imCpGs. im-mQTLs are colored according to the effect of LPS on CpG methylation (demethylation, n = 217, blue; increased methylation, n = 17, red).
(B) De novo im-mQTL at cg02724909; correlation of rs869191 genotype with untreated (UT, green), LPS-stimulated (LPS, red), and LPS-induced differential (delta, purple) methylation at cg02724909.
(C) Regional association plot of cg02724909 im-mQTL. Protein-coding genes are highlighted (blue). Bottom: recombination rate.
(D) Baseline enhanced im-mQTL at cg17462560; correlation of rs6875879 genotype with UT (green), LPS-stimulated (LPS, red), and LPS-induced differential (delta, purple) methylation at cg17462560.
(E) Regional association plot of cg17462560 im-mQTL. The p values are calculated by linear regression. For regional association and colocalization plots, SNPs are colored according to strength of linkage disequilibrium (LD) (Utah residents with ancestry from northern and western Europe [CEU] population) to the peak im-mQTL SNP.
In box-and-whisker plots, boxes depict the upper and lower quartiles of the data, and whiskers depict the range of the data excluding outliers (outliers are defined as data points the interquartile range from the upper or lower quartiles). The p values are calculated by linear regression.
We explored the relationship between im-mQTL and genetic determinants of human phenotypic variation, observing 24 of 234 im-mQTL to colocalize with a genetic determinant of at least one genome-wide association study (GWAS) trait (Table S19). An illustrative example of a baseline enhanced im-mQTL informative of human phenotypic variation is rs6446553 at cg19906672. Cg19906672 is demethylated in response to LPS, the magnitude of which is influenced by allelic variation at rs6446553, 24 kb downstream of the CpG (; Figures 5A and 5B), with carriers of the T allele showing increased LPS-induced demethylation. This polymorphism colocalizes with genetic loci determining several hematological parameters (Figures 5C and 5D), including white cell count (posterior probability of colocalization [PP4] = 0.97), neutrophil count (PP4 = 0.97), neutrophil percentage (PP4 = 0.97), lymphocyte percentage (PP4 = 0.98), mean corpuscular volume (PP4 = 0.93), and mean sphered corpuscular volume (PP4 = 0.96).
Figure 5.

LPS-induced im-mQTLs colocalize with hematological trait-associated loci
(A) Baseline enhanced im-mQTL at cg19906672; correlation of rs6446553 genotype with UT (green) and LPS-stimulated (LPS, red) and LPS-induced differential (delta, purple) cg19906672 methylation.
(B) Regional association plot of cg19906672 im-mQTL. Protein-coding genes are highlighted (blue). Bottom: recombination rate.
(C) Colocalization plots of the cg19906672 im-mQTL with white blood cell count (WBCC), neutrophil count (Neut), neutrophil percentage (Neut%), lymphocyte percentage (Lymph%), mean corpuscular volume (MCV), and mean sphered corpuscular volume (MSCV) GWAS. PP4, posterior probability of a shared causal locus as calculated with Coloc.
(D) Forest plot depicting effect estimates and 95% confidence intervals of rs6446553:G carriage WBCC, neutrophil count and Neut%, Lymph%, MCV, and MSCV.
(E) Correlation of rs6446553 genotype with TBC1D14 expression in unstimulated monocytes (UT, green) and 24 h of LPS stimulation (LPS, 24 h, red).
The p values are calculated by linear regression.
For regional association and colocalization plots, SNPs are colored according to strength of LD (CEU population) to the peak im-mQTL SNP. In box-and-whisker plots, boxes depict the upper and lower quartiles of the data, and whiskers depict the range of the data excluding outliers (outliers are defined as data points the interquartile range from the upper or lower quartiles).
Given the variable effects of DNAm on gene expression,51 we sought to identify examples of colocalization between im-mQTLs and expression quantitative trait loci (eQTL) in LPS-stimulated monocytes in previously published data.3 We extracted cis-eQTL mapping data for genes within 1 Mb of each im-mQTL in unstimulated monocytes and in monocytes following 24 h of LPS stimulation. We then used Moloc52 to assess evidence for shared causal loci between each im-mQTL and local eQTL in naive and stimulated monocytes. That analysis supports sharing () of a causal locus between 61 im-mQTL (26%) and at least one cis eQTL in monocytes, with evidence of colocalization at 87 im-mQTL:genic eQTL pairs (Table S20). We identified 12 instances where the genetic determinants of differential methylation on LPS stimulation are shared with regulatory variation controlling gene expression in the UT state alone and 45 instances where sharing is only evident following LPS stimulation (Table S20). The im-mQTL at cg19906672 (rs6446553), as described above, is an example of the latter, with the im-mQTL colocalizing with a cis-eQTL for TBC1D14 expression only after 24 h of LPS stimulation. We find that, in addition to being associated with increased demethylation, the rs6446553:T allele is associated with increased TBC1D14 expression post LPS (Figure 5E). TBC1D14 encodes a TBC (Tre-Bub-CDC16) domain-containing GTPase-activating protein that functions as a negative regulator of autophagy.53 Autophagy is critical to the maintenance of hematopoietic stem cell function, and in keeping with a role for TBC1D14 expression in myeloid and lymphoid hematological parameters, changes in autophagy are associated with perturbed myeloid:lymphoid ratios.54
A further example of an im-mQTL informative of human disease is the regulation of cg16885113 LPS-induced methylation by rs3129058 (Figures 6A and 6B), which colocalizes with a GWAS risk locus for lung cancer55 (PP4 = 0.94; Figure 6C). This im-mQTL also colocalizes with an eQTL for expression of ZFP57, but only at baseline; i.e., in UT monocytes (Figure 6D). We have previously identified an eQTL for ZFP57 RNA expression in peripheral blood mononuclear cells at rs375984, and eQTL mapping of regulatory determinants of ZFP57 RNA expression in naive monocytes (Figure 6E) demonstrates that rs375984, rs3129058 (the lead im-mQTL variant) and rs417764 (the lead ZFP57 eSNP in monocytes) are all highly associated with ZFP57 expression and are in linkage dysequilibrium (, 1000 Genomes Project, British in England and Scotland population) with one another. ZFP57 encodes a Kruppel-associated box-containing zinc-finger protein that is required to maintain DNAm at imprinting control regions.56,57,58 We therefore hypothesized that rs417764, as a regulator of ZFP57 expression, could have genome-wide effects on CpG methylation in monocytes. Of 407,951 CpGs tested, methylation at 151, clustered in 20 genomic regions, is significantly associated () with the rs417764 genotype (Table S21). In keeping with the established biology of ZFP57, these CpGs are highly enriched (, OR 75.75) for known imprinted regions59,60,61,62,63 (Table S22), which cluster in two genomic regions: chr6:29,648,344–29,649,133 and chr20:57,426,997–57,427,972 (Figure 6F). Average levels of methylation at each CpG significantly modulated by rs417764 genotype are negatively correlated with the effect of rs417764:A allele carriage on CpG methylation (, ; Figure 6G). This effect is largely driven by genotype-dependent demethylation of highly methylated CpGs, which is associated with increased ZFP57 expression (Figures 6G and 6H). Given that the baseline methylation state is an important predictor of differential methylation in response to LPS stimulation, and that imCpGs are more likely to have intermediate methylation levels at baseline, we further hypothesized that the ZFP57 eQTL would modify the LPS responsiveness at CpGs where rs417764 was a predictor of baseline methylation. Of 151 ZFP57-modified CpGs, 7 have a significant effect () of rs417764 genotype on differential methylation in response to LPS stimulation (Figure 6I; Table S23). In keeping with the effect of rs417764 genotype on baseline methylation, where the rs417764:A allele is associated with more intermediate methylation levels at baseline, at 6 of these 7 CpGs, the effect of rs417764:A allele carriage is to increase the magnitude of change in methylation in response to LPS stimulation (Figure 6I).
Figure 6.

Identification of trans influences on LPS-induced imCpGs putatively mediated by expression of the insulator protein ZFP57
(A) Baseline enhanced im-mQTL at cg16885113; correlation of rs3129058 genotype with UT (green) and LPS-stimulated (LPS, red) and LPS-induced differential (delta, purple) cg16885113 methylation.
(B) Regional association plot of cg16885113 im-mQTL. Protein-coding genes are highlighted (blue). Bottom: recombination rate.
(C) Colocalization plot of the cg16885113 im-mQTL with lung cancer.
(D) Correlation of rs6446553 genotype with ZFP57 expression in unstimulated monocytes (UT, green) and following 24 h of LPS stimulation (LPS, 24 h, red).
(E) Regional association plot of ZFP57 eQTL in UT monocytes (n = 414). Protein-coding genes are highlighted (blue). Bottom: recombination rate.
(F) Circos plot depicting CpGs with methylation levels significantly modified by ZFP57 eQTL genotype. Known imprinted regions are highlighted (orange).
(G) Correlation of baseline CpG methylation levels and the effect of ZFP57 eQTL genotype (rs417764) on methylation at CpGs significantly affected by rs417764 genotype (Pearson’s product moment correlation, n = 151, , ).
(H) Distribution of methylation levels in UT monocytes at ZFP57 eQTL-associated CpGs according to genotype at rs417764 (n = 151).
(I) Correlation of ZFP57 eQTL genotype (rs417764) with change in methylation at significantly rs417764-associated CpGs (n = 7).
The p values are calculated by linear regression.
For regional association and colocalization plots, SNPs are colored according to strength of LD (CEU population) to the peak im-mQTL/eQTL SNP. In box-and-whisker plots, boxes depict the upper and lower quartiles of the data, and whiskers depict the range of the data excluding outliers (outliers are defined as data points the inter quartile range from the upper or lower quartiles).
Discussion
In this study, we explored the dynamics of DNAm in primary human monocytes following innate immune stimulation. Of the innate immune stimuli we tested, LPS induced the most marked changes in DNAm. This is in contrast to the effects of LPS and IFNγ on gene expression, where either stimulus induces changes of equivalent magnitude in the monocyte transcriptome.3 We explored the DNAm response to LPS in a large cohort of healthy European-ancestry adults, finding that imCpGs were both methylated and demethylated in response to LPS and that LPS-induced demethylation was an active process, involving the formation of 5hmC. The sites at which LPS-induced methylation and demethylation occurred were distinct; demethylated imCpGs demonstrating striking enrichment for enhancers and transcriptionally active DNA, whereas methylated imCpGs were found largely in transcriptionally silent regions. This observation lends itself to a hypothesis whereby LPS-induced demethylation in monocytes acts to further upregulate inflammatory pathways already active at baseline, whereas LPS-induced methylation further represses quiescent transcriptional programs. In keeping with this, demethylated imCpGs are highly enriched for AP-1 subunit binding sites in myeloid cells and are proximal to genes directing innate immune activity, including TLR signaling. By contrast, TF usage at methylated imCpGs is modest and is dominated by under-representation at TFBSs, and consistent with this, genes proximal to these sites are not enriched for immunological signaling pathways. That is, transcriptional programs modified by LPS-induced demethylation are specific, whereas those modified by LPS-induced methylation are more diverse and not representative of a cohesive set of biological processes.
We found that epigenetic age, as estimated by the Horvath DNAm clock,45 is accelerated by LPS stimulation in monocytes, and that this effect is only seen among individuals without baseline epigenetic age acceleration. This demonstrates that the epigenetic age of cells can be rapidly modified by short-term exposure to innate immune stimuli and suggests a model in which infectious and inflammatory exposures across the life course contribute to epigenetic aging. Importantly, epigenetic age acceleration is associated with a variety of health outcomes, including cancer.15 Complementary to this, LPS-demethylated imCpGs were found to be proximal to genes involved in human disease pathogenesis, in particular carcinogenesis. Moreover, the most markedly LPS-demethylated region is at CUX1, a gene recurrently mutated in leukemias.33,34 The association between LPS stimulation, accelerated epigenetic age, and human disease speaks to the established association of chronic inflammation and age-related disease traits.1 Cellular senescence contributes to the accumulation of systemic chronic inflammation with age,64 but chronic antigenic stimulation, in particular chronic viral infection, is also a key driver of immunosenescence65 as well as acceleration of epigenetic age.66,67 However, the specific enrichment we observed for cancer risk suggests the possibility that LPS-induced demethylation plays a direct role in carcinogenesis. CpG dinucleotides accumulate mutation at rates greater than non-CpG DNA,68 and this interacts with methylation status.69 It is plausible, therefore, that inflammation-induced methylation changes affect cancer risk through modified transcriptional programs and cellular differentiation but may also be directly mutagenic, potentially through occasional fallibility of demethylation-associated base excision repair.
Finally, we used eQTL mapping to define local genetic variation determining LPS-induced changes in DNAm at imCpGs. We were able to identify 234 instances of cis-im-mQTLs. In keeping with the observed enrichment of disease-relevant genes among genes proximal to imCpGs, im-mQTLs colocalize with genetic determinants of human phenotypic variation and disease traits, again including cancer-associated loci. We further identified an im-mQTL that is also a determinant of ZFP57 RNA expression in UT monocytes. ZFP57 controls bistability at imprinted loci,56,57,58 and in keeping with this, we were able to observe effects of the ZFP57 eQTL on baseline methylation at 151 CpG dinucleotides genome-wide, which were highly enriched for known imprinted loci. Consistent with the importance of baseline methylation in determining the DNAm LPS response, the ZFP57 eQTL also predicts DNAm LPS response at a subset of these loci, demonstrating the intricate genome-wide relationship between genotype, gene expression, DNAm, and environment.
Limitations of the study
Our study has potential limitations. We used positive selection to isolate monocytes, and while positive selection strategies optimize cellular purity,70 there remains the potential for phenotypic alterations of isolated monocytes; e.g., reduced CD14 expression,71 which are dependent on the selection strategy employed. These concerns are not obviated by the use of negative selection strategies, which result in increased contamination of isolated monocytes but also more marked transcriptional changes than are seen with positive selection.70 Overall, while there is no single optimal approach to the isolation of purified cell populations, the strategy we adopt here optimized cellular purity against some potential for CD14-mediated pre-activation. Importantly, this allows the integration of these results with previously published population-scale assessments of monocyte transcriptional responses to innate immune stimulation,3,4 which also employed positive selection for monocyte isolation. In complementary experiments using small numbers of donors (maximum n = 4), both monocyte-to-macrophage differentiation20,21 and subsequent macrophage polarization22 with LPS stimulations have been demonstrated to result in DNAm changes, with changes being most pronounced for monocyte-to-macrophage differentiation. Our experiments expand on these studies, leveraging a large donor cohort to allow exploration of inter-individual variation in DNAm response to LPS treatment, including exploring the role of genetics in that variation. While the DNAm changes that we observe in our study are a direct consequence of LPS stimulation, we note partial overlap with changes common to monocyte-to-macrophage differentiation. These are only a small subset of imCpGs, however, and, given that the direction of the effect of LPS on methylation at these sites is typically divergent from that seen in macrophage differentiation, is in keeping with a conserved set of monocyte CpGs being highly responsive to extrinsic environmental cues, including innate immune stimuli and triggers for differentiation, with the process induced by LPS stimulation at these sites being distinct from monocyte-to-macrophage differentiation changes.
In summary, we have described how the landscape of DNAm in primary human monocytes is acutely modified by innate immune stimulation, demonstrating for the first time that these responses are in part genetically determined. In so doing, we have highlighted that monocyte DNAm and associated epigenetic age are modifiable in the short term by acute inflammation, with changes being informative to the pathogenesis of a range of human disease states, most notably cancer.
STAR★Methods
Key resources table
| REAGENT or RESOURCE | SOURCE | IDENTIFIER |
|---|---|---|
| Antibodies | ||
| AF700 anti-human CD3 | BioLegend | Clone UCHT1; RRID: AB_493740 |
| PE anti-human CD14 | Miltenyi | Clone TUK4; RRID: AB_2725975 |
| Biological samples | ||
| PBMCs isolated from healthy donors | Oxford Biobank | http://www.oxfordbiobank.org.uk |
| Chemicals, peptides, and recombinant proteins | ||
| Ultrapure LPS | Invivogen | Cat #tlrl-pelps |
| Critical commercial assays | ||
| MACS CD14+ isolation kits | Miltenyi | |
| Gentra Puregene Blood Kit | Qiagen | Cat #158389 |
| EZ DNA Methylation Lightening kits | Zymo Research | Cat# D5030 |
| Infinium HumanMethylation450 BeadChips | Illumina | Cat #WG-314-1001 |
| UK Biobank Axiom arrays | Affymetrix | Cat# 902502 |
| Deposited data | ||
| Haplotype reference consortium r1.1 | McCarthy et al.72 | https://imputationserver.readthedocs.io/en/latest/reference-panels/ |
| MRC IEU OpenGWAS project | Elsworth et al.73 | https://gwas.mrcieu.ac.uk |
| UK Biobank GWAS summary statistics r2 | Neale Lab | http://www.nealelab.is/uk-biobank |
| Primary monocyte chromatin state annotations, Roadmap Epigenomics Consortium | Kindaje et al.36 | https://egg2.wustl.edu/roadmap/web_portal/index.html |
| ENCODE transcription factor binding sites K562 and GM12878 cell lines | Luo et al.74 | https://www.encodeproject.org |
| Promoter capture Hi-C data – 17 primary cell types | Javierre et al.37 | https://osf.io/u8tzp/ |
| Genome-wide genotyping data – 188 individuals | This study | EGAS00001007111 |
| Genome-wide array methylation data – 190 individuals | This study | EGAS00001007111 |
| Software and algorithms | ||
| Michigan Imputation Server | Das et al.75 | https://imputationserver.sph.umich.edu/index.html#! |
| dnaMethyAge v0.1.0 | Wang et al.76 | https://github.com/yiluyucheng/dnaMethyAge |
| BACON v1.26.0 | Van Iterson et al.30 | https://bioconductor.org/packages/release/bioc/html/bacon.html |
| QTLtools v1.3.1 | Delaneau et al.77 | https://qtltools.github.io/qtltools/ |
| XGR v1.1.7 | Fang et al.40 | https://xgr.r-forge.r-project.org |
| Coloc v5.1.0.1 | Giambartolomei et al.78 | https://chr1swallace.github.io/coloc/ |
| Moloc v0.1.0 | Giambartolomei et al.52 | https://github.com/clagiamba/moloc |
Resource availability
Lead contact
Further information and requests for resources and reagents should be directed to and will be fulfilled by the lead contact, Benjamin P. Fairfax (benjamin.fairfax@oncology.ox.ac.uk).
Materials availability
This study did not generate new unique reagents.
Data and code availability
Individual level genotype, methylation and demographic/anthropometric data are available at European Genome-Phenome Archive (EGA) with accession ID EGAS00001007111. Scripts and source data used to reproduce figures and analysis are available at https://zenodo.org/records/10775177.
Method details
Cell purification & stimulation
Peripheral blood mononuclear cells (PBMCs) were separated from freshly drawn blood using Ficoll gradient purification, with monocytes subsequently positively selected using magnetic CD14+ isolation kits (miltenyi) according to manufacturer’s protocols. Purity of the monocytes was assessed from methylation values using the Houseman79 method within the minfi80 R package and was found to be at a median of for all treatments (Figure S12). In a subset of randomly chosen samples (n = 13), we also assessed purity of isolated monocytes with flow cytometry, staining paired PBMC samples from the same isolation treated in an identical manner with AF700-conjugated CD3 (clone UCHT1, BioLegend) and PE-conjugated CD14 (clone TUK4, Miltenyi), with acquisition on a BD Fortessa and analyzed using FlowJo (Treestar). We used the gates from the PBMC sample to define the proportional contamination of CD14 samples with CD3 cells (by far the largest population in PBMC and the most frequently contaminating according to methylation analysis; Figure S13A). We found the percentage monocyte purity inferred by DNA methylation was highly anti-correlated with measured CD3 contamination (Pearson analysis: r = −0.79, p = 0.0014; Figure S13B), whereas inferred CD3 count was significantly correlated with measured count (Pearson analysis: r = 0.81, p = 0.000084; Figure S13C). Monocytes were cultured at 500,000 cells per mL in 400μL RPMI supplemented with L-Glutamine, Penicillin/Streptomycin and 20% FCS in BD Falcon 5mL polypropylene culture tubes, with each sample typically being purified from 800,000 cells. Post purification samples were rested overnight at 37C, 5% CO2 prior to stimulation under the same conditions with the following reagents and concentrations - 20 ng/ml Pam3Csk4 (Invivogen), 20 ng/ml LPS (Ultrapure LPS, Invivogen) and 20 ng/ml IFNγ (R&D Systems). To determine whether stimulation elicited cell division, we used the CFSE cell proliferation assays (CellTrace kit, Thermofisher) and subsequent flow cytometry according to manufacturer’s instructions in cells from four individuals.
Array methylation analysis
DNA was purified from monocytes using Gentra Puregene Blood Kits (Qiagen kit) according to manufacturers instructions. DNA was bisulfite converted with EZ DNA Methylation-Lightning Kits (Zymo Research) according to manufacturers instructions, prior to hybridization to Illumina 450K arrays which carries 485,000 probes. For the LPS analysis, all but 6 treated samples were hybridized with their untreated control to an array on the same beadchip, thus mitigating chip and batch effects as far as possible. The Illumina 450K array carries a subset of SNPs and these were used to detect sample mix-ups. Samples were normalized using quantile normalization using the EWAS pipeline described by Lehne, Drong et al.. 81 CpGs with detection in any sample were excluded from analysis, as were samples with a call-rate . In addition, we excluded probes previously found to blat to more than one genomic location or overlapping SNPs with minor allele frequencies (MAF) 82. This resulted in 407,951 probes, which were taken forward for differential methylation analysis. To identify individual CpGs differentially methylated by innate immune stimulation, in both the pilot experiments and the large-scale LPS experiment, we fitted pairwise linear models and calculated moderated t-tests on normalized data using the lmFit and eBayes function in limma.25 Following correction of p-values for multiple testing (Benjamini-Hochberg), we considered to be significant. We further identified differentially methylated regions using DMRcate31 using default settings. In the large-scale LPS experiment, in which sought to assess the effect of 24 h of LPS stimulation on DNA methylation across a population, following differential methylation analysis using limma as above, we sought to identify a set of high-confidence LPS imCpGs, using BACON30 to correct for any residual confounding or bias in our experiment.
Epigenetic age calculations & analysis
We calculated epigenetic age in untreated and LPS-treated monocytes using the Horvath,45 Hannum,47 PhenoAge44 and PCGrimAge48 clocks with the dnaMethyAge76 package in R. Age acceleration was calculated as the difference between epigenetic and chronological age for each model. Age and DNAm estimates of epigenetic age were not normally distibuted. We therefore correlated age acceleration with chronological age using Spearman’s rank correlation, and compared estimates of epigenetic age between untreated and LPS-treated samples using Wilcoxon signed rank tests. For the stratfied analyses, we dichotomised individuals according to chronological age (dichotomising those above or below the median age of the cohort) and by age acceleration. In the case of the Horvath epigenetic age estimates, we dichotomised individuals according to whether their epigenetic age was greater or less than their chronological age (e.g., epigenetic age acceleration or deceleration). For the other epigenetic age estimators, most notably Hannum and PhenoAge, this resulted in small numbers with epigenetic age deceleration (Hannum, n = 9; PhenoAge, n = 4), and we instead dichotomised individuals with age acceleration greater or less than the cohort median.
Bisulfite sequencing and hydroxymethylation analysis
For four individuals, monocytes were treated for 0,6 or 24h of LPS prior to DNA purification ( per sample) with subsequent paired bisulfite and oxidative bisulfite conversion using the TrueMethyl oxBS-Seq kits (Cambridge Epigenetix). Converted DNA was then subjected to capture enrichment for 80.5Mb across regions known to be informative as to methylation status (SeqCap Epi Enrichment, Nimblegen). Multiplexed samples were subsequently sequenced at 100bp paired end reads using the Illumina HiSeq2500 platform using the rapid mode.
Genotyping and imputation
Genome-wide genotypes were generated at in study participants using the UK Biobank Axiom array (Affymetrix). Samples were excluded from downstream analysis if participants were related (relatedness coefficient ) or with outlying heterozygosity and call rate. SNPs with low call rates (), evidence for departure from Hardy-Weinberg equilibrium () and MAF were excluded from further processing. Following sample and SNP quality control (QC), genotypes at 623,652 autosomal SNPs in 188 individuals were taken forward for genome-wide imputation. Imputation was performed using minimac4,83 following phasing with Eagle2,84 as implemented by the Michigan Imputation Server,75 using the Haplotype Reference Consortium r1.172 as a reference panel. Genome-wide imputation resulted in high confidence (, HWE ) genotypes at 5,411,481 common (MAF ), autosomal SNPs, which were used in downstream association analysis.
QTL mapping
We used QTLtools77 to map genetic determinants of methylation. We mapped correlation between CpG methylation and genotype in an additive linear model, including genetic variants in cis (within 100kb) to each CpG tested. QTLtools controls FDR at the level of each phenotype (CpG) by approximating a permutation test, and we used 10,000 permutations in our cis QTL mapping. We applied a second level of FDR control across all phenotypes tested with qvalue in R. We considered to be significant. We sought to map genetic determinants of changes in methylation on LPS stimulation, which we term immune-modulated methylation quantitative trait loci (im-mQTL), correlating genotype with normalised change in CpG methylation, i.e., delta beta methylation, at each CpG for which there was evidence of differential methylation on LPS stimulation (n = 7,359). In addition, we mapped the cis genetic determinants of CpG methylation in untreated and LPS-stimulated monocytes separately, mapping QTL at 407,951 CpGs passing QC across all samples. To minimise the effect of confounding variation, we included principal components (PC) of the phenotype matrix as covariates in the linear model, with the number of PC used in each analysis chosen to maximise QTL discovery. Inclusion of 29 PCs optimised im-mQTL discovery (Figure S14), while 23 and 28 PCs optimised mQTL discovery in untreated and LPS-stimulated monocytes respectively (Figure S15). PC analysis of genotyping data was not suggestive of confounding population structure, and comparison of study sample genetic PCs with those of 1000G project reference samples confirmed European ancestry (Figure S16). We did not therefore include genetic PCs as covariates for eQTL mapping.
Enrichment analyses
To assess the distribution of imCpGs with respect to genomic features of interest, we used Roadmap Epigenomics Consortium36 chromatin state annotations in primary moncytes defined by the ChromHMM85 15 state model, ENCODE Chip-seq data74 defining transcription factor binding sites in myeloid lineage cells (K562) and lymphoblastoid cell lines (LCLs - GM12878), and promoter capture HiC data across 17 cell types37 defining enhancer activity. We assessed enrichment of imCpGs against a background of all CpGs tested (passing QC) for each feature of interest in XGR,40 using a two-tailed binomial test. Following QTL mapping, we tested for enrichment of im-mQTL in K562 transcription factor binding sites using a permutation-based approach implemented in QTLtools,77 calculating the frequency of observed overlap between a given transcription factor binding site and an im-mQTL peak SNP, comparing this to the the number of overlaps expected by chance (permuting phenotypes across all imCpGs tested).
We assessed enrichment of genes proximal to imCpGs ( 5kb, taking the single most proximal protein-coding gene) and genes correlated with principal components of LPS-induced differential methylation at imCpGs within biological pathways using the following ontologies; Reactome Immune System, Disease Ontology and Gene Ontology Biological Processes. We tested enrichment in XGR40 using Fisher’s exact tests.
Correlation of baseline methylation with LPS responsiveness
To compare imCpGs whose LPS-induced methylation/demethylation was correlated with baseline methylation (BC) or independent of baseline methylation state (BI), we calculated Pearson’s correlations between LPS-induced change in methylation and baseline methylation (beta), and dichotomised imCpGs according to evidence of correlation (BC, ; BI, ). As above, we assessed for evidence of enrichment for K562 transcription factor binding sites and ENCODE chromatin state annotations among imCpG groups using two-tailed binomial tests in XGR,40 using all CpGs tested (n = 407,951) as background. We compared distributions of baseline methylation (beta) and LPS-induced methylation change (t statistics) with Kolmogorov-Smirnov tests.
Colocalisation analysis
To test if im-mQTL are associated with phenotypic traits or risk of human disease we used a Bayesian approach implemented in Coloc v5.1.0.178 to assess the probability of a shared causal variant between the im-mQTL and trait-associated variation identified by GWAS. We downloaded case-control GWAS summary statistics (n = 45, Table S24) from the MRC IEU OpenGWAS project73 and UK Biobank GWAS summary statistics (http://www.nealelab.is/uk-biobank/) of peripheral blood traits (n = 27, Table S24). We tested for evidence of colocalisation between each identified im-mQTL (n = 234) and each GWAS trait within a 250kb window centered on the peak im-mQTL eSNP. To test for evidence of sharing between baseline determinants of methylation (mQTL in untreated monocytes) and im-mQTL, we used Coloc. In cases where sharing of the baseline mQTL and the im-mQTL represented the most likely model, we designated those im-mQTL as “baseline modified”. If the best supported a model in which the im-mQTL is distinct from the baseline mQTL, we designated that a “de novo” im-mQTL. To assess evidence for shared causal loci between im-mQTL and regulatory determinants of gene expression in untreated and LPS-stimulated monocytes, we used the multi-trait extension of Coloc, moloc v0.1.0.52 We used previously-published summary statistics describing eQTL mapping of RNA expression in untreated monocytes (n = 414) and in monocytes following 24 h of LPS stimulation (n = 322).3 We tested for evidence of colocalisation between each identified im-mQTL and the two monocyte eQTL datasets within a 250kb window centered on the peak im-mQTL eSNP. We used default priors in all colocalisation analyses, and we considered a posterior probability supporting a shared causal locus to be significant.
Acknowledgments
The study was funded by a Wellcome Trust Intermediate Clinical Fellowship (201488/Z/16/Z to B.P.F.). J.C.K. is supported by a Wellcome Trust Investigator Award (204969/Z/16/Z), the National Institute for Health Research (NIHR) Oxford Biomedical Research Centre and the Chinese Academy of Medical Sciences (CAMS) Innovation Fund for Medical Science (grant 2018-I2M-2-002), Wellcome Trust grants 090532/Z/09/Z and 203141/Z/16/Z to the core facilities of the Wellcome Centre for Human Genetics, the Oxford Biomedical Research Computing (BMRC) facility, and a joint development between the Wellcome Centre for Human Genetics and the Big Data Institute supported by Health Data Research UK and the NIHR Oxford Biomedical Research Centre. J.J.G. is funded by an NIHR Clinical Lectureship. The views expressed are those of the author(s) and not necessarily those of the NHS, the NIHR, or the Department of Health and Social Care. This research was funded in part by the Wellcome Trust (grants 201488/Z/16/Z, 204969/Z/16/Z, 090532/Z/09/Z, and 203141/Z/16/Z). For the purposes of open access, the authors have applied a CC BY copyright license to any author accepted manuscript arising from this submission.
Author contributions
The study was conceived by B.P.F. and J.C.K., who jointly oversaw the project. Samples were collected by S.D., E.L., B.P.F., and H.A.M., with access to the biobank provided by M.N. Primary analysis was performed by J.J.G., B.P.F., M.T., B.S.-B., H.F., I.N., C.T., O.T., D.M., and L.R.Z.C. The manuscript was drafted by B.P.F. and J.J.G. with input and revisions from all other authors.
Declaration of interests
The authors declare no competing interests.
Published: April 24, 2024
Footnotes
Supplemental information can be found online at https://doi.org/10.1016/j.xgen.2024.100541.
Supplemental information
References
- 1.Furman D., Campisi J., Verdin E., Carrera-Bastos P., Targ S., Franceschi C., Ferrucci L., Gilroy D.W., Fasano A., Miller G.W., et al. Chronic inflammation in the etiology of disease across the life span. Nat. Med. 2019;25:1822–1832. doi: 10.1038/s41591-019-0675-0. [DOI] [PMC free article] [PubMed] [Google Scholar]
- 2.Auffray C., Sieweke M.H., Geissmann F. Blood monocytes: Development, heterogeneity, and relationship with dendritic cells. Annu. Rev. Immunol. 2009;27:669–692. doi: 10.1146/annurev.immunol.021908.132557. [DOI] [PubMed] [Google Scholar]
- 3.Fairfax B.P., Humburg P., Makino S., Naranbhai V., Wong D., Lau E., Jostins L., Plant K., Andrews R., McGee C., Knight J.C. Innate immune activity conditions the effect of regulatory variants upon monocyte gene expression. Science. 2014;343 doi: 10.1126/science.1246949. [DOI] [PMC free article] [PubMed] [Google Scholar]
- 4.Kim-Hellmuth S., Bechheim M., Pütz B., Mohammadi P., Nédélec Y., Giangreco N., Becker J., Kaiser V., Fricker N., Beier E., et al. Genetic regulatory effects modified by immune activation contribute to autoimmune disease associations. Nat. Commun. 2017;8:266. doi: 10.1038/s41467-017-00366-1. [DOI] [PMC free article] [PubMed] [Google Scholar]
- 5.Quach H., Rotival M., Pothlichet J., Loh Y.-H.E., Dannemann M., Zidane N., Laval G., Patin E., Harmant C., Lopez M., et al. Genetic adaptation and neandertal admixture shaped the immune system of human populations. Cell. 2016;167:643–656.e17. doi: 10.1016/j.cell.2016.09.024. [DOI] [PMC free article] [PubMed] [Google Scholar]
- 6.Schübeler D. Function and information content of dna methylation. Nature. 2015;517:321–326. doi: 10.1038/nature14192. [DOI] [PubMed] [Google Scholar]
- 7.Grundberg E., Meduri E., Sandling J.K., Hedman A.K., Keildson S., Buil A., Busche S., Yuan W., Nisbet J., Sekowska M., et al. Global analysis of dna methylation variation in adipose tissue from twins reveals links to disease-associated variants in distal regulatory elements. Am. J. Hum. Genet. 2013;93:876–890. doi: 10.1016/j.ajhg.2013.10.004. [DOI] [PMC free article] [PubMed] [Google Scholar]
- 8.Bonder M.J., Luijk R., Zhernakova D.V., Moed M., Deelen P., Vermaat M., van Iterson M., van Dijk F., van Galen M., Bot J., et al. Disease variants alter transcription factor levels and methylation of their binding sites. Nat. Genet. 2017;49:131–138. doi: 10.1038/ng.3721. [DOI] [PubMed] [Google Scholar]
- 9.Kulis M., Merkel A., Heath S., Queirós A.C., Schuyler R.P., Castellano G., Beekman R., Raineri E., Esteve A., Clot G., et al. Whole-genome fingerprint of the dna methylome during human b cell differentiation. Nat. Genet. 2015;47:746–756. doi: 10.1038/ng.3291. [DOI] [PMC free article] [PubMed] [Google Scholar]
- 10.Ladle B.H., Li K.-P., Phillips M.J., Pucsek A.B., Haile A., Powell J.D., Jaffee E.M., Hildeman D.A., Gamper C.J. De novo dna methylation by dna methyltransferase 3a controls early effector cd8+ t-cell fate decisions following activation. Proc. Natl. Acad. Sci. USA. 2016;113:10631–10636. doi: 10.1073/pnas.1524490113. [DOI] [PMC free article] [PubMed] [Google Scholar]
- 11.Breitling L.P., Yang R., Korn B., Burwinkel B., Brenner H. Tobacco-smoking-related differential dna methylation: 27k discovery and replication. Am. J. Hum. Genet. 2011;88:450–457. doi: 10.1016/j.ajhg.2011.03.003. [DOI] [PMC free article] [PubMed] [Google Scholar]
- 12.Horvath S., Raj K. Dna methylation-based biomarkers and the epigenetic clock theory of ageing. Nat. Rev. Genet. 2018;19:371–384. doi: 10.1038/s41576-018-0004-3. [DOI] [PubMed] [Google Scholar]
- 13.Horvath S., Pirazzini C., Bacalini M.G., Gentilini D., Di Blasio A.M., Delledonne M., Mari D., Arosio B., Monti D., Passarino G., et al. Decreased epigenetic age of pbmcs from italian semi-supercentenarians and their offspring. Aging (Albany NY) 2015;7:1159–1170. doi: 10.18632/aging.100861. [DOI] [PMC free article] [PubMed] [Google Scholar]
- 14.Marioni R.E., Shah S., McRae A.F., Ritchie S.J., Muniz-Terrera G., Harris S.E., Gibson J., Redmond P., Cox S.R., Pattie A., et al. The epigenetic clock is correlated with physical and cognitive fitness in the lothian birth cohort 1936. Int. J. Epidemiol. 2015;44:1388–1396. doi: 10.1093/ije/dyu277. [DOI] [PMC free article] [PubMed] [Google Scholar]
- 15.Zheng Y., Joyce B.T., Colicino E., Liu L., Zhang W., Dai Q., Shrubsole M.J., Kibbe W.A., Gao T., Zhang Z., et al. Blood epigenetic age may predict cancer incidence and mortality. EBioMedicine. 2016;5:68–73. doi: 10.1016/j.ebiom.2016.02.008. [DOI] [PMC free article] [PubMed] [Google Scholar]
- 16.Marioni R.E., Shah S., McRae A.F., Chen B.H., Colicino E., Harris S.E., Gibson J., Henders A.K., Redmond P., Cox S.R., et al. Dna methylation age of blood predicts all-cause mortality in later life. Genome Biol. 2015;16:25. doi: 10.1186/s13059-015-0584-6. [DOI] [PMC free article] [PubMed] [Google Scholar]
- 17.Marr A.K., MacIsaac J.L., Jiang R., Airo A.M., Kobor M.S., McMaster W.R. Leishmania donovani infection causes distinct epigenetic dna methylation changes in host macrophages. PLoS Pathog. 2014;10 doi: 10.1371/journal.ppat.1004419. [DOI] [PMC free article] [PubMed] [Google Scholar]
- 18.Pacis A., Tailleux L., Morin A.M., Lambourne J., MacIsaac J.L., Yotova V., Dumaine A., Danckaert A., Luca F., Grenier J.-C., et al. Bacterial infection remodels the dna methylation landscape of human dendritic cells. Genome Res. 2015;25:1801–1811. doi: 10.1101/gr.192005.115. [DOI] [PMC free article] [PubMed] [Google Scholar]
- 19.Novakovic B., Habibi E., Wang S.-Y., Arts R.J.W., Davar R., Megchelenbrink W., Kim B., Kuznetsova T., Kox M., Zwaag J., et al. beta-glucan reverses the epigenetic state of lps-induced immunological tolerance. Cell. 2016;167:1354–1368.e14. doi: 10.1016/j.cell.2016.09.034. [DOI] [PMC free article] [PubMed] [Google Scholar]
- 20.Vento-Tormo R., Company C., Rodríguez-Ubreva J., de la Rica L., Urquiza J.M., Javierre B.M., Sabarinathan R., Luque A., Esteller M., Aran J.M., et al. Il-4 orchestrates stat6-mediated dna demethylation leading to dendritic cell differentiation. Genome Biol. 2016;17:4. doi: 10.1186/s13059-015-0863-2. [DOI] [PMC free article] [PubMed] [Google Scholar]
- 21.Wallner S., Schröder C., Leitão E., Berulava T., Haak C., Beißer D., Rahmann S., Richter A.S., Manke T., Bönisch U., et al. Epigenetic dynamics of monocyte-to-macrophage differentiation. Epigenet. Chromatin. 2016;9:33. doi: 10.1186/s13072-016-0079-z. [DOI] [PMC free article] [PubMed] [Google Scholar]
- 22.Dekkers K.F., Neele A.E., Jukema J.W., Heijmans B.T., de Winther M.P.J. Human monocyte-to-macrophage differentiation involves highly localized gain and loss of dna methylation at transcription factor binding sites. Epigenet. Chromatin. 2019;12:34. doi: 10.1186/s13072-019-0279-4. [DOI] [PMC free article] [PubMed] [Google Scholar]
- 23.Akira S., Takeda K. Toll-like receptor signalling. Nat. Rev. Immunol. 2004;4:499–511. doi: 10.1038/nri1391. [DOI] [PubMed] [Google Scholar]
- 24.Sica A., Mantovani A. Macrophage plasticity and polarization: in vivo veritas. J. Clin. Invest. 2012;122:787–795. doi: 10.1172/JCI59643. [DOI] [PMC free article] [PubMed] [Google Scholar]
- 25.Ritchie M.E., Phipson B., Wu D., Hu Y., Law C.W., Shi W., Smyth G.K. limma powers differential expression analyses for rna-sequencing and microarray studies. Nucleic Acids Res. 2015;43:e47. doi: 10.1093/nar/gkv007. [DOI] [PMC free article] [PubMed] [Google Scholar]
- 26.Ecker S., Chen L., Pancaldi V., Bagger F.O., Fernández J.M., Carrillo de Santa Pau E., Juan D., Mann A.L., Watt S., Casale F.P., et al. Genome-wide analysis of differential transcriptional and epigenetic variability across human immune cell types. Genome Biol. 2017;18:18. doi: 10.1186/s13059-017-1156-8. URL: [DOI] [PMC free article] [PubMed] [Google Scholar]
- 27.Kohli R.M., Zhang Y. Tet enzymes, tdg and the dynamics of dna demethylation. Nature. 2013;502:472–479. doi: 10.1038/nature12750. [DOI] [PMC free article] [PubMed] [Google Scholar]
- 28.Tahiliani M., Koh K.P., Shen Y., Pastor W.A., Bandukwala H., Brudno Y., Agarwal S., Iyer L.M., Liu D.R., Aravind L., Rao A. Conversion of 5-methylcytosine to 5-hydroxymethylcytosine in mammalian dna by mll partner tet1. Science. 2009;324:930–935. doi: 10.1126/science.1170116. [DOI] [PMC free article] [PubMed] [Google Scholar]
- 29.Booth M.J., Ost T.W.B., Beraldi D., Bell N.M., Branco M.R., Reik W., Balasubramanian S. Oxidative bisulfite sequencing of 5-methylcytosine and 5-hydroxymethylcytosine. Nat. Protoc. 2013;8:1841–1851. doi: 10.1038/nprot.2013.115. [DOI] [PMC free article] [PubMed] [Google Scholar]
- 30.van Iterson M., van Zwet E.W., BIOS Consortium. Heijmans B.T. Controlling bias and inflation in epigenome- and transcriptome-wide association studies using the empirical null distribution. Genome Biol. 2017;18:19. doi: 10.1186/s13059-016-1131-9. [DOI] [PMC free article] [PubMed] [Google Scholar]
- 31.Peters T.J., Buckley M.J., Statham A.L., Pidsley R., Samaras K., V Lord R., Clark S.J., Molloy P.L. De novo identification of differentially methylated regions in the human genome. Epigenet. Chromatin. 2015;8:6. doi: 10.1186/1756-8935-8-6. [DOI] [PMC free article] [PubMed] [Google Scholar]
- 32.Vadnais C., Awan A.A., Harada R., Clermont P.-L., Leduy L., Bérubé G., Nepveu A. Long-range transcriptional regulation by the p110 cux1 homeodomain protein on the encode array. BMC Genom. 2013;14:258. doi: 10.1186/1471-2164-14-258. [DOI] [PMC free article] [PubMed] [Google Scholar]
- 33.McNerney M.E., Brown C.D., Wang X., Bartom E.T., Karmakar S., Bandlamudi C., Yu S., Ko J., Sandall B.P., Stricker T., et al. Cux1 is a haploinsufficient tumor suppressor gene on chromosome 7 frequently inactivated in acute myeloid leukemia. Blood. 2013;121:975–983. doi: 10.1182/blood-2012-04-426965. [DOI] [PMC free article] [PubMed] [Google Scholar]
- 34.Wong C.C., Martincorena I., Rust A.G., Rashid M., Alifrangis C., Alexandrov L.B., Tiffen J.C., Kober C., Chronic Myeloid Disorders Working Group of the International Cancer Genome Consortium. Green A.R., et al. Inactivating cux1 mutations promote tumorigenesis. Nat. Genet. 2014;46:33–38. doi: 10.1038/ng.2846. [DOI] [PMC free article] [PubMed] [Google Scholar]
- 35.Al-Mossawi H., Yager N., Taylor C.A., Lau E., Danielli S., de Wit J., Gilchrist J., Nassiri I., Mahe E.A., Lee W., et al. Context-specific regulation of surface and soluble il7r expression by an autoimmune risk allele. Nat. Commun. 2019;10:4575. doi: 10.1038/s41467-019-12393-1. [DOI] [PMC free article] [PubMed] [Google Scholar]
- 36.Roadmap Epigenomics Consortium. Kundaje A., Meuleman W., Ernst J., Bilenky M., Yen A., Heravi-Moussavi A., Kheradpour P., Zhang Z., Wang J., et al. Integrative analysis of 111 reference human epigenomes. Nature. 2015;518:317–330. doi: 10.1038/nature14248. [DOI] [PMC free article] [PubMed] [Google Scholar]
- 37.Javierre B.M., Burren O.S., Wilder S.P., Kreuzhuber R., Hill S.M., Sewitz S., Cairns J., Wingett S.W., Várnai C., Thiecke M.J., et al. Lineage-specific genome architecture links enhancers and non-coding disease variants to target gene promoters. Cell. 2016;167:1369–1384.e19. doi: 10.1016/j.cell.2016.09.037. [DOI] [PMC free article] [PubMed] [Google Scholar]
- 38.Gillespie M., Jassal B., Stephan R., Milacic M., Rothfels K., Senff-Ribeiro A., Griss J., Sevilla C., Matthews L., Gong C., et al. The reactome pathway knowledgebase 2022. Nucleic Acids Res. 2022;50:D687–D692. doi: 10.1093/nar/gkab1028. [DOI] [PMC free article] [PubMed] [Google Scholar]
- 39.Schriml L.M., Mitraka E., Munro J., Tauber B., Schor M., Nickle L., Felix V., Jeng L., Bearer C., Lichenstein R., et al. Human disease ontology 2018 update: classification, content and workflow expansion. Nucleic Acids Res. 2019;47:D955–D962. doi: 10.1093/nar/gky1032. [DOI] [PMC free article] [PubMed] [Google Scholar]
- 40.Fang H., Knezevic B., Burnham K.L., Knight J.C. Xgr software for enhanced interpretation of genomic summary data, illustrated by application to immunological traits. Genome Med. 2016;8:129. doi: 10.1186/s13073-016-0384-y. [DOI] [PMC free article] [PubMed] [Google Scholar]
- 41.Fraga M.F., Ballestar E., Paz M.F., Ropero S., Setien F., Ballestar M.L., Heine-Suñer D., Cigudosa J.C., Urioste M., Benitez J., et al. Epigenetic differences arise during the lifetime of monozygotic twins. Proc. Natl. Acad. Sci. USA. 2005;102:10604–10609. doi: 10.1073/pnas.0500398102. [DOI] [PMC free article] [PubMed] [Google Scholar]
- 42.Rakyan V.K., Down T.A., Maslau S., Andrew T., Yang T.-P., Beyan H., Whittaker P., McCann O.T., Finer S., Valdes A.M., et al. Human aging-associated dna hypermethylation occurs preferentially at bivalent chromatin domains. Genome Res. 2010;20:434–439. doi: 10.1101/gr.103101.109. [DOI] [PMC free article] [PubMed] [Google Scholar]
- 43.Teschendorff A.E., Menon U., Gentry-Maharaj A., Ramus S.J., Weisenberger D.J., Shen H., Campan M., Noushmehr H., Bell C.G., Maxwell A.P., et al. Age-dependent dna methylation of genes that are suppressed in stem cells is a hallmark of cancer. Genome Res. 2010;20:440–446. doi: 10.1101/gr.103606.109. [DOI] [PMC free article] [PubMed] [Google Scholar]
- 44.Levine M.E., Lu A.T., Quach A., Chen B.H., Assimes T.L., Bandinelli S., Hou L., Baccarelli A.A., Stewart J.D., Li Y., et al. An epigenetic biomarker of aging for lifespan and healthspan. Aging (Albany NY) 2018;10:573–591. doi: 10.18632/aging.101414. [DOI] [PMC free article] [PubMed] [Google Scholar]
- 45.Horvath S. Dna methylation age of human tissues and cell types. Genome Biol. 2013;14:R115. doi: 10.1186/gb-2013-14-10-r115. [DOI] [PMC free article] [PubMed] [Google Scholar]
- 46.Gopalan S., Carja O., Fagny M., Patin E., Myrick J.W., McEwen L.M., Mah S.M., Kobor M.S., Froment A., Feldman M.W., et al. Trends in dna methylation with age replicate across diverse human populations. Genetics. 2017;206:1659–1674. doi: 10.1534/genetics.116.195594. [DOI] [PMC free article] [PubMed] [Google Scholar]
- 47.Hannum G., Guinney J., Zhao L., Zhang L., Hughes G., Sadda S., Klotzle B., Bibikova M., Fan J.-B., Gao Y., et al. Genome-wide methylation profiles reveal quantitative views of human aging rates. Mol. Cell. 2013;49:359–367. doi: 10.1016/j.molcel.2012.10.016. [DOI] [PMC free article] [PubMed] [Google Scholar]
- 48.Higgins-Chen A.T., Thrush K.L., Wang Y., Minteer C.J., Kuo P.-L., Wang M., Niimi P., Sturm G., Lin J., Moore A.Z., et al. A computational solution for bolstering reliability of epigenetic clocks: Implications for clinical trials and longitudinal tracking. Nat. Aging. 2022;2:644–661. doi: 10.1038/s43587-022-00248-2. [DOI] [PMC free article] [PubMed] [Google Scholar]
- 49.Jonkman T.H., Dekkers K.F., Slieker R.C., Grant C.D., Ikram M.A., van Greevenbroek M.M.J., Franke L., Veldink J.H., Boomsma D.I., Slagboom P.E., et al. Functional genomics analysis identifies t and nk cell activation as a driver of epigenetic clock progression. Genome Biol. 2022;23:24. doi: 10.1186/s13059-021-02585-8. [DOI] [PMC free article] [PubMed] [Google Scholar]
- 50.Sun Z., Xu X., He J., Murray A., Sun M.-A., Wei X., Wang X., McCoig E., Xie E., Jiang X., et al. Egr1 recruits tet1 to shape the brain methylome during development and upon neuronal activity. Nat. Commun. 2019;10:3892. doi: 10.1038/s41467-019-11905-3. [DOI] [PMC free article] [PubMed] [Google Scholar]
- 51.Gutierrez-Arcelus M., Lappalainen T., Montgomery S.B., Buil A., Ongen H., Yurovsky A., Bryois J., Giger T., Romano L., Planchon A., et al. Passive and active dna methylation and the interplay with genetic variation in gene regulation. Elife. 2013;2 doi: 10.7554/eLife.00523. [DOI] [PMC free article] [PubMed] [Google Scholar]
- 52.Giambartolomei C., Zhenli Liu J., Zhang W., Hauberg M., Shi H., Boocock J., Pickrell J., Jaffe A.E., CommonMind Consortium. Pasaniuc B., Roussos P. A bayesian framework for multiple trait colocalization from summary association statistics. Bioinformatics. 2018;34:2538–2545. doi: 10.1093/bioinformatics/bty147. [DOI] [PMC free article] [PubMed] [Google Scholar]
- 53.Longatti A., Lamb C.A., Razi M., Yoshimura S.-i., Barr F.A., Tooze S.A. Tbc1d14 regulates autophagosome formation via rab11- and ulk1-positive recycling endosomes. J. Cell Biol. 2012;197:659–675. doi: 10.1083/jcb.201111079. [DOI] [PMC free article] [PubMed] [Google Scholar]
- 54.Ho T.T., Warr M.R., Adelman E.R., Lansinger O.M., Flach J., Verovskaya E.V., Figueroa M.E., Passegué E. Autophagy maintains the metabolism and function of young and old stem cells. Nature. 2017;543:205–210. doi: 10.1038/nature21388. [DOI] [PMC free article] [PubMed] [Google Scholar]
- 55.Wang Y., McKay J.D., Rafnar T., Wang Z., Timofeeva M.N., Broderick P., Zong X., Laplana M., Wei Y., Han Y., et al. Rare variants of large effect in brca2 and chek2 affect risk of lung cancer. Nat. Genet. 2014;46:736–741. doi: 10.1038/ng.3002. [DOI] [PMC free article] [PubMed] [Google Scholar]
- 56.Butz S., Schmolka N., Karemaker I.D., Villaseñor R., Schwarz I., Domcke S., Uijttewaal E.C.H., Jude J., Lienert F., Krebs A.R., et al. Dna sequence and chromatin modifiers cooperate to confer epigenetic bistability at imprinting control regions. Nat. Genet. 2022;54:1702–1710. doi: 10.1038/s41588-022-01210-z. [DOI] [PMC free article] [PubMed] [Google Scholar]
- 57.Mackay D.J.G., Callaway J.L.A., Marks S.M., White H.E., Acerini C.L., Boonen S.E., Dayanikli P., Firth H.V., Goodship J.A., Haemers A.P., et al. Hypomethylation of multiple imprinted loci in individuals with transient neonatal diabetes is associated with mutations in zfp57. Nat. Genet. 2008;40:949–951. doi: 10.1038/ng.187. [DOI] [PubMed] [Google Scholar]
- 58.Zuo X., Sheng J., Lau H.-T., McDonald C.M., Andrade M., Cullen D.E., Bell F.T., Iacovino M., Kyba M., Xu G., Li X. Zinc finger protein zfp57 requires its co-factor to recruit dna methyltransferases and maintains dna methylation imprint in embryonic stem cells via its transcriptional repression domain. J. Biol. Chem. 2012;287:2107–2118. doi: 10.1074/jbc.M111.322644. [DOI] [PMC free article] [PubMed] [Google Scholar]
- 59.Akbari V., Garant J.-M., O’Neill K., Pandoh P., Moore R., Marra M.A., Hirst M., Jones S.J.M. Genome-wide detection of imprinted differentially methylated regions using nanopore sequencing. Elife. 2022;11 doi: 10.7554/eLife.77898. [DOI] [PMC free article] [PubMed] [Google Scholar]
- 60.Court F., Tayama C., Romanelli V., Martin-Trujillo A., Iglesias-Platas I., Okamura K., Sugahara N., Simón C., Moore H., Harness J.V., et al. Genome-wide parent-of-origin dna methylation analysis reveals the intricacies of human imprinting and suggests a germline methylation-independent mechanism of establishment. Genome Res. 2014;24:554–569. doi: 10.1101/gr.164913.113. [DOI] [PMC free article] [PubMed] [Google Scholar]
- 61.Hernandez Mora J.R., Tayama C., Sánchez-Delgado M., Monteagudo-Sánchez A., Hata K., Ogata T., Medrano J., Poo-Llanillo M.E., Simón C., Moran S., et al. Characterization of parent-of-origin methylation using the illumina infinium methylationepic array platform. Epigenomics. 2018;10:941–954. doi: 10.2217/epi-2017-0172. [DOI] [PubMed] [Google Scholar]
- 62.Joshi R.S., Garg P., Zaitlen N., Lappalainen T., Watson C.T., Azam N., Ho D., Li X., Antonarakis S.E., Brunner H.G., et al. Dna methylation profiling of uniparental disomy subjects provides a map of parental epigenetic bias in the human genome. Am. J. Hum. Genet. 2016;99:555–566. doi: 10.1016/j.ajhg.2016.06.032. [DOI] [PMC free article] [PubMed] [Google Scholar]
- 63.Zink F., Magnusdottir D.N., Magnusson O.T., Walker N.J., Morris T.J., Sigurdsson A., Halldorsson G.H., Gudjonsson S.A., Melsted P., Ingimundardottir H., et al. Insights into imprinting from parent-of-origin phased methylomes and transcriptomes. Nat. Genet. 2018;50:1542–1552. doi: 10.1038/s41588-018-0232-7. [DOI] [PubMed] [Google Scholar]
- 64.Xu M., Pirtskhalava T., Farr J.N., Weigand B.M., Palmer A.K., Weivoda M.M., Inman C.L., Ogrodnik M.B., Hachfeld C.M., Fraser D.G., et al. Senolytics improve physical function and increase lifespan in old age. Nat. Med. 2018;24:1246–1256. doi: 10.1038/s41591-018-0092-9. [DOI] [PMC free article] [PubMed] [Google Scholar]
- 65.Koch S., Larbi A., Ozcelik D., Solana R., Gouttefangeas C., Attig S., Wikby A., Strindhall J., Franceschi C., Pawelec G. Cytomegalovirus infection: a driving force in human t cell immunosenescence. Ann. N. Y. Acad. Sci. 2007;1114:23–35. doi: 10.1196/annals.1396.043. [DOI] [PubMed] [Google Scholar]
- 66.Horvath S., Levine A.J. Hiv-1 infection accelerates age according to the epigenetic clock. J. Infect. Dis. 2015;212:1563–1573. doi: 10.1093/infdis/jiv277. [DOI] [PMC free article] [PubMed] [Google Scholar]
- 67.Oltmanns C., Liu Z., Mischke J., Tauwaldt J., Mekonnen Y.A., Urbanek-Quaing M., Debarry J., Maasoumy B., Wedemeyer H., Kraft A.R.M., et al. Reverse inflammaging: Long-term effects of hcv cure on biological age. J. Hepatol. 2023;78:90–98. doi: 10.1016/j.jhep.2022.08.042. [DOI] [PubMed] [Google Scholar]
- 68.Duncan B.K., Miller J.H. Mutagenic deamination of cytosine residues in dna. Nature. 1980;287:560–561. doi: 10.1038/287560a0. [DOI] [PubMed] [Google Scholar]
- 69.Coulondre C., Miller J.H., Farabaugh P.J., Gilbert W. Molecular basis of base substitution hotspots in escherichia coli. Nature. 1978;274:775–780. doi: 10.1038/274775a0. [DOI] [PubMed] [Google Scholar]
- 70.Lyons P.A., Koukoulaki M., Hatton A., Doggett K., Woffendin H.B., Chaudhry A.N., Smith K.G.C. Microarray analysis of human leucocyte subsets: the advantages of positive selection and rapid purification. BMC Genom. 2007;8:64. doi: 10.1186/1471-2164-8-64. [DOI] [PMC free article] [PubMed] [Google Scholar]
- 71.Nielsen M.C., Andersen M.N., Møller H.J. Monocyte isolation techniques significantly impact the phenotype of both isolated monocytes and derived macrophages in vitro. Immunology. 2020;159:63–74. doi: 10.1111/imm.13125. [DOI] [PMC free article] [PubMed] [Google Scholar]
- 72.McCarthy S., Das S., Kretzschmar W., Delaneau O., Wood A.R., Teumer A., Kang H.M., Fuchsberger C., Danecek P., Sharp K., et al. A reference panel of 64,976 haplotypes for genotype imputation. Nat. Genet. 2016;48:1279–1283. doi: 10.1038/ng.3643. [DOI] [PMC free article] [PubMed] [Google Scholar]
- 73.Elsworth B., Lyon M., Alexander T., Liu Y., Matthews P., Hallett J., Bates P., Palmer T., Haberland V., Smith G.D., et al. The mrc ieu opengwas data infrastructure. bioRxiv. 2020 doi: 10.1101/2020.08.10.244293. https://www.biorxiv.org/content/early/2020/08/10/2020.08.10.244293 https://www.biorxiv.org/content/early/2020/08/10/2020.08.10.244293.full.pdf arXiv. [DOI] [Google Scholar]
- 74.Luo Y., Hitz B.C., Gabdank I., Hilton J.A., Kagda M.S., Lam B., Myers Z., Sud P., Jou J., Lin K., et al. New developments on the encyclopedia of dna elements (encode) data portal. Nucleic Acids Res. 2020;48:D882–D889. doi: 10.1093/nar/gkz1062. [DOI] [PMC free article] [PubMed] [Google Scholar]
- 75.Das S., Forer L., Schönherr S., Sidore C., Locke A.E., Kwong A., Vrieze S.I., Chew E.Y., Levy S., McGue M., et al. Next-generation genotype imputation service and methods. Nat. Genet. 2016;48:1284–1287. doi: 10.1038/ng.3656. [DOI] [PMC free article] [PubMed] [Google Scholar]
- 76.Wang Y., Grant O.A., Zhai X., Mcdonald-Maier K.D., Schalkwyk L.C. Insights into ageing rates comparison across tissues from recalibrating cerebellum dna methylation clock. Geroscience. 2024;46:39–56. doi: 10.1007/s11357-023-00871-w. [DOI] [PMC free article] [PubMed] [Google Scholar]
- 77.Delaneau O., Ongen H., Brown A.A., Fort A., Panousis N.I., Dermitzakis E.T. A complete tool set for molecular qtl discovery and analysis. Nat. Commun. 2017;8 doi: 10.1038/ncomms15452. [DOI] [PMC free article] [PubMed] [Google Scholar]
- 78.Giambartolomei C., Vukcevic D., Schadt E.E., Franke L., Hingorani A.D., Wallace C., Plagnol V. Bayesian test for colocalisation between pairs of genetic association studies using summary statistics. PLoS Genet. 2014;10 doi: 10.1371/journal.pgen.1004383. [DOI] [PMC free article] [PubMed] [Google Scholar]
- 79.Houseman E.A., Accomando W.P., Koestler D.C., Christensen B.C., Marsit C.J., Nelson H.H., Wiencke J.K., Kelsey K.T. Dna methylation arrays as surrogate measures of cell mixture distribution. BMC Bioinf. 2012;13:86. doi: 10.1186/1471-2105-13-86. [DOI] [PMC free article] [PubMed] [Google Scholar]
- 80.Aryee M.J., Jaffe A.E., Corrada-Bravo H., Ladd-Acosta C., Feinberg A.P., Hansen K.D., Irizarry R.A. Minfi: a flexible and comprehensive bioconductor package for the analysis of infinium dna methylation microarrays. Bioinformatics. 2014;30:1363–1369. doi: 10.1093/bioinformatics/btu049. [DOI] [PMC free article] [PubMed] [Google Scholar]
- 81.Lehne B., Drong A.W., Loh M., Zhang W., Scott W.R., Tan S.-T., Afzal U., Scott J., Jarvelin M.-R., Elliott P., et al. A coherent approach for analysis of the illumina humanmethylation450 beadchip improves data quality and performance in epigenome-wide association studies. Genome Biol. 2015;16:37. doi: 10.1186/s13059-015-0600-x. [DOI] [PMC free article] [PubMed] [Google Scholar]
- 82.Benton M.C., Johnstone A., Eccles D., Harmon B., Hayes M.T., Lea R.A., Griffiths L., Hoffman E.P., Stubbs R.S., Macartney-Coxson D. An analysis of dna methylation in human adipose tissue reveals differential modification of obesity genes before and after gastric bypass and weight loss. Genome Biol. 2015;16:8. doi: 10.1186/s13059-014-0569-x. [DOI] [PMC free article] [PubMed] [Google Scholar]
- 83.Fuchsberger C., Abecasis G.R., Hinds D.A. minimac2: faster genotype imputation. Bioinformatics. 2015;31:782–784. doi: 10.1093/bioinformatics/btu704. [DOI] [PMC free article] [PubMed] [Google Scholar]
- 84.Loh P.-R., Danecek P., Palamara P.F., Fuchsberger C., A Reshef Y., K Finucane H., Schoenherr S., Forer L., McCarthy S., Abecasis G.R., et al. Reference-based phasing using the haplotype reference consortium panel. Nat. Genet. 2016;48:1443–1448. doi: 10.1038/ng.3679. [DOI] [PMC free article] [PubMed] [Google Scholar]
- 85.Ernst J., Kellis M. Chromhmm: automating chromatin-state discovery and characterization. Nat. Methods. 2012;9:215–216. doi: 10.1038/nmeth.1906. [DOI] [PMC free article] [PubMed] [Google Scholar]
Associated Data
This section collects any data citations, data availability statements, or supplementary materials included in this article.
Supplementary Materials
Data Availability Statement
Individual level genotype, methylation and demographic/anthropometric data are available at European Genome-Phenome Archive (EGA) with accession ID EGAS00001007111. Scripts and source data used to reproduce figures and analysis are available at https://zenodo.org/records/10775177.