

SUMMARY
Drugs of abuse can persistently change the reward circuit in ways that contribute to relapse behavior, partly via mechanisms that regulate chromatin structure and function. Nuclear orphan receptor subfamily4 groupA member2 (NR4A2, also known as NURR1) is an important effector of histone deacetylase 3 (HDAC3)-dependent mechanisms in persistent memory processes and is highly expressed in the medial habenula (MHb), a region that regulates nicotine-associated behaviors. Here, expressing the Nr4a2 dominant negative (Nurr2c) in the MHb blocks reinstatement of cocaine seeking in mice. We use single-nucleus transcriptomics to characterize the molecular cascade following Nr4a2 manipulation, revealing changes in transcriptional networks related to addiction, neuroplasticity, and GABAergic and glutamatergic signaling. The network controlled by NR4A2 is characterized using a transcription factor regulatory network inference algorithm. These results identify the MHb as a pivotal regulator of relapse behavior and demonstrate the importance of NR4A2 as a key mechanism driving the MHb component of relapse.
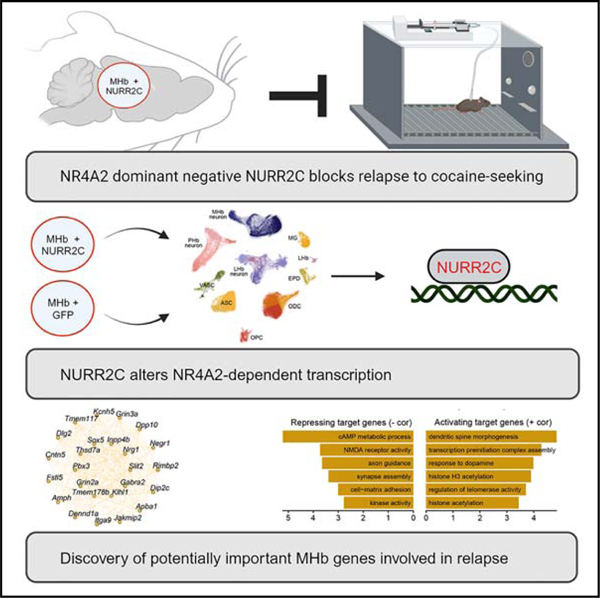
Graphical abstract
In brief
Childs et al. show that expressing the Nr4a2/Nurr1 dominant negative (Nurr2c) in the medial habenula reduces reinstatement of operant cocaine seeking. Single-nucleus RNA sequencing is used to characterize NR4A2 transcription factor regulatory networks and to identify gene networks related to substance use disorders that are affected by Nr4a2 manipulations.
INTRODUCTION
Substance use disorder pathology includes an enduring risk of relapse, encoded partly during drug taking when the activity of drugs of abuse facilitates abnormally strong context/reward memories. These memories underlie the triggering properties of drug-associated cues and environments, and vulnerability to these triggers can last decades. This persistence is partly attributed to the effects of drug-associated behaviors on epigenetically driven mechanisms which can cause long-lasting changes in cell function and subsequent behavior. In the context of neuronal function, epigenetics is defined as changes in gene expression that are not attributable to alterations in the sequence of DNA.
Histone deacetylase 3 (HDAC3; a powerful epigenetic regulator) manipulations can both transform subthreshold learning into long-term memory and generate abnormally persistent forms of long-term memory,1 including cocaine-context-associated long-term memory.2 HDAC3 regulation of memory formation depends largely on nuclear orphan receptor subfamily4 groupA member2 (NR4A2), classifying Nr4a2 as a major epigenetic effector gene.1,3 Nr4a2 is an immediate-early gene and transcription factor (TF),4 important for developing5 and maintaining6 dopaminergic neurons, expressing genes involved in dopamine signaling,6–9 and medial habenula (MHb) development.10 Normally, HDAC3 binds to Nr4a2 promoters and suppresses expression, and in the nucleus accumbens Nr4a2 expression is increased in cocaine-exposed HDAC3flox/flox mice.2 In wild-type mice, acquisition of cocaine-conditioned place preference reduces HDAC3 occupancy at Nr4a2 promoters, enabling a more permissive state for Nr4a2 expression and linking Nr4a2 to cocaine-associated behaviors.2 Both Hdac3 and Nr4a2 are highly expressed in a region important for nicotine seeking and withdrawal, the MHb.11–13 Previous work in our lab found that expressing the endogenously occurring dominant negative form of Nr4a2, Nurr2c,14 in the cholinergic neurons of the MHb reduced reinstatement of cocaine-conditioned place preference, identifying a role for MHb NR4A2 in cocaine-induced associative memory processes. Here, we used the same approach to reduce NR4A2 function in MHb cholinergic neurons (and other secondary cell types) and studied volitional cocaine seeking and relapse using cocaine self-administration followed by a 30-day withdrawal. Animals were then extinguished and reinstated. This approach allowed us to assess the motivational aspect of drug seeking, which we could not ascertain in our previous studies using conditioned place preference.15,16 Using this gold-standard model for addiction, we observed a near complete block of cued reinstatement of cocaine seeking (but no differences in acquisition or extinction) after functionally suppressing MHb NR4A2, demonstrating that MHb Nr4a2 regulates operant cocaine seeking in addition to cocaine-associative memory.
To study the molecular changes associated with this prominent behavioral shift and better understand the downstream effects of manipulating the TF NR4A2, we used single-nucleus RNA sequencing (snRNA-seq) to perform an unbiased analysis of the transcriptome, which revealed transcriptomic networks regulated by NR4A2 that were related to addiction and neuroplasticity and were altered in specific subsets of MHb neurons. Broadly, we identify MHb NR4A2 as a cocaine-sensitive relapse regulator. Further, because nuclear orphan receptors such as NR4A2 have druggable ligand-binding sites, NR4A2 is currently a therapeutic target for multiple disorders including cancer, Alzheimer’s disease, Parkinson’s disease, and substance use disorders.17,18 Here we provide the first sequencing dataset showing how changes in NR4A2 function affect the expression of its downstream targets, with important implications in addiction, memory, and pharmacology research.
RESULTS
Expression of Nr4a2 dominant negative Nurr2c in medial habenula cholinergic neurons reduces reinstatement of cocaine self-administration
To examine the MHb contribution to volitional cocaine seeking, we used an intravenous cocaine self-administration model of relapse to drug seeking19 (Figure 1A and STAR Methods) to obtain the most translationally relevant measure of MHb NR4A2 function in relapse. Considering that NR4A2 is druggable,17,18 responsive to cocaine,20,21 and densely expressed in the MHb, we chose to study the role of MHb NR4A2 in reinstatement of cocaine seeking by using the Nr4a2 dominant negative Nurr2c22 to reduce MHb NR4A2 function. The MHb is anatomically small, and the ventral portion is densely cholinergic. We used a transgenic mouse expressing Cre in cells with choline acetyltransferase (ChAT) to constrain expression of a Cre-dependent adeno-associated virus containing Nurr2c (or GFP control) to the MHb (Figures 1B and 1C; STAR Methods). These mice were then trained to self-administer cocaine, which was followed by a 30-day withdrawal used to drive craving and reinstatement of cocaine seeking. During cocaine self-administration, presses on the active lever exceeded presses on the inactive lever in both groups (behaviorally experienced GFP: F(1,20) = 76.11, p < 0.0001; behaviorally experienced NURR2C: F(1,26) = 40.08, p < 0.0001; Figure 1D). During self-administration there were no differences between groups in responses to the active lever (F(1,22) = 0.093, p = 0.763, Figure 1D) or in the amount of cocaine consumed (behaviorally experienced GFP average = 23.46 rewards per session, behaviorally experienced NURR2C average = 25.30 rewards per session, F(1,22) = 0.555, p = 0.464). After 30 days of homecage withdrawal there were no differences between groups in extinction (F(1,18) = 0.161, p = 0.693, Figure 1E). At the end of extinction (E5), all animals received 10 min of cue priming to induce reinstatement, which was followed by a 1-h cued reinstatement session. Behaviorally experienced GFP mice showed high reinstatement compared to behaviorally experienced NURR2C mice (t(22) = 3.814, p = 0.0009, Figure 1F), demonstrating that NR4A2 in MHb ChAT neurons contributes to relapse-like behavior and suggesting a role for the MHb in drug-associated behaviors.
Figure 1. Expression of Nr4a2 dominant negative Nurr2c in cholinergic medial habenula neurons reduces reinstatement of cocaine seeking.
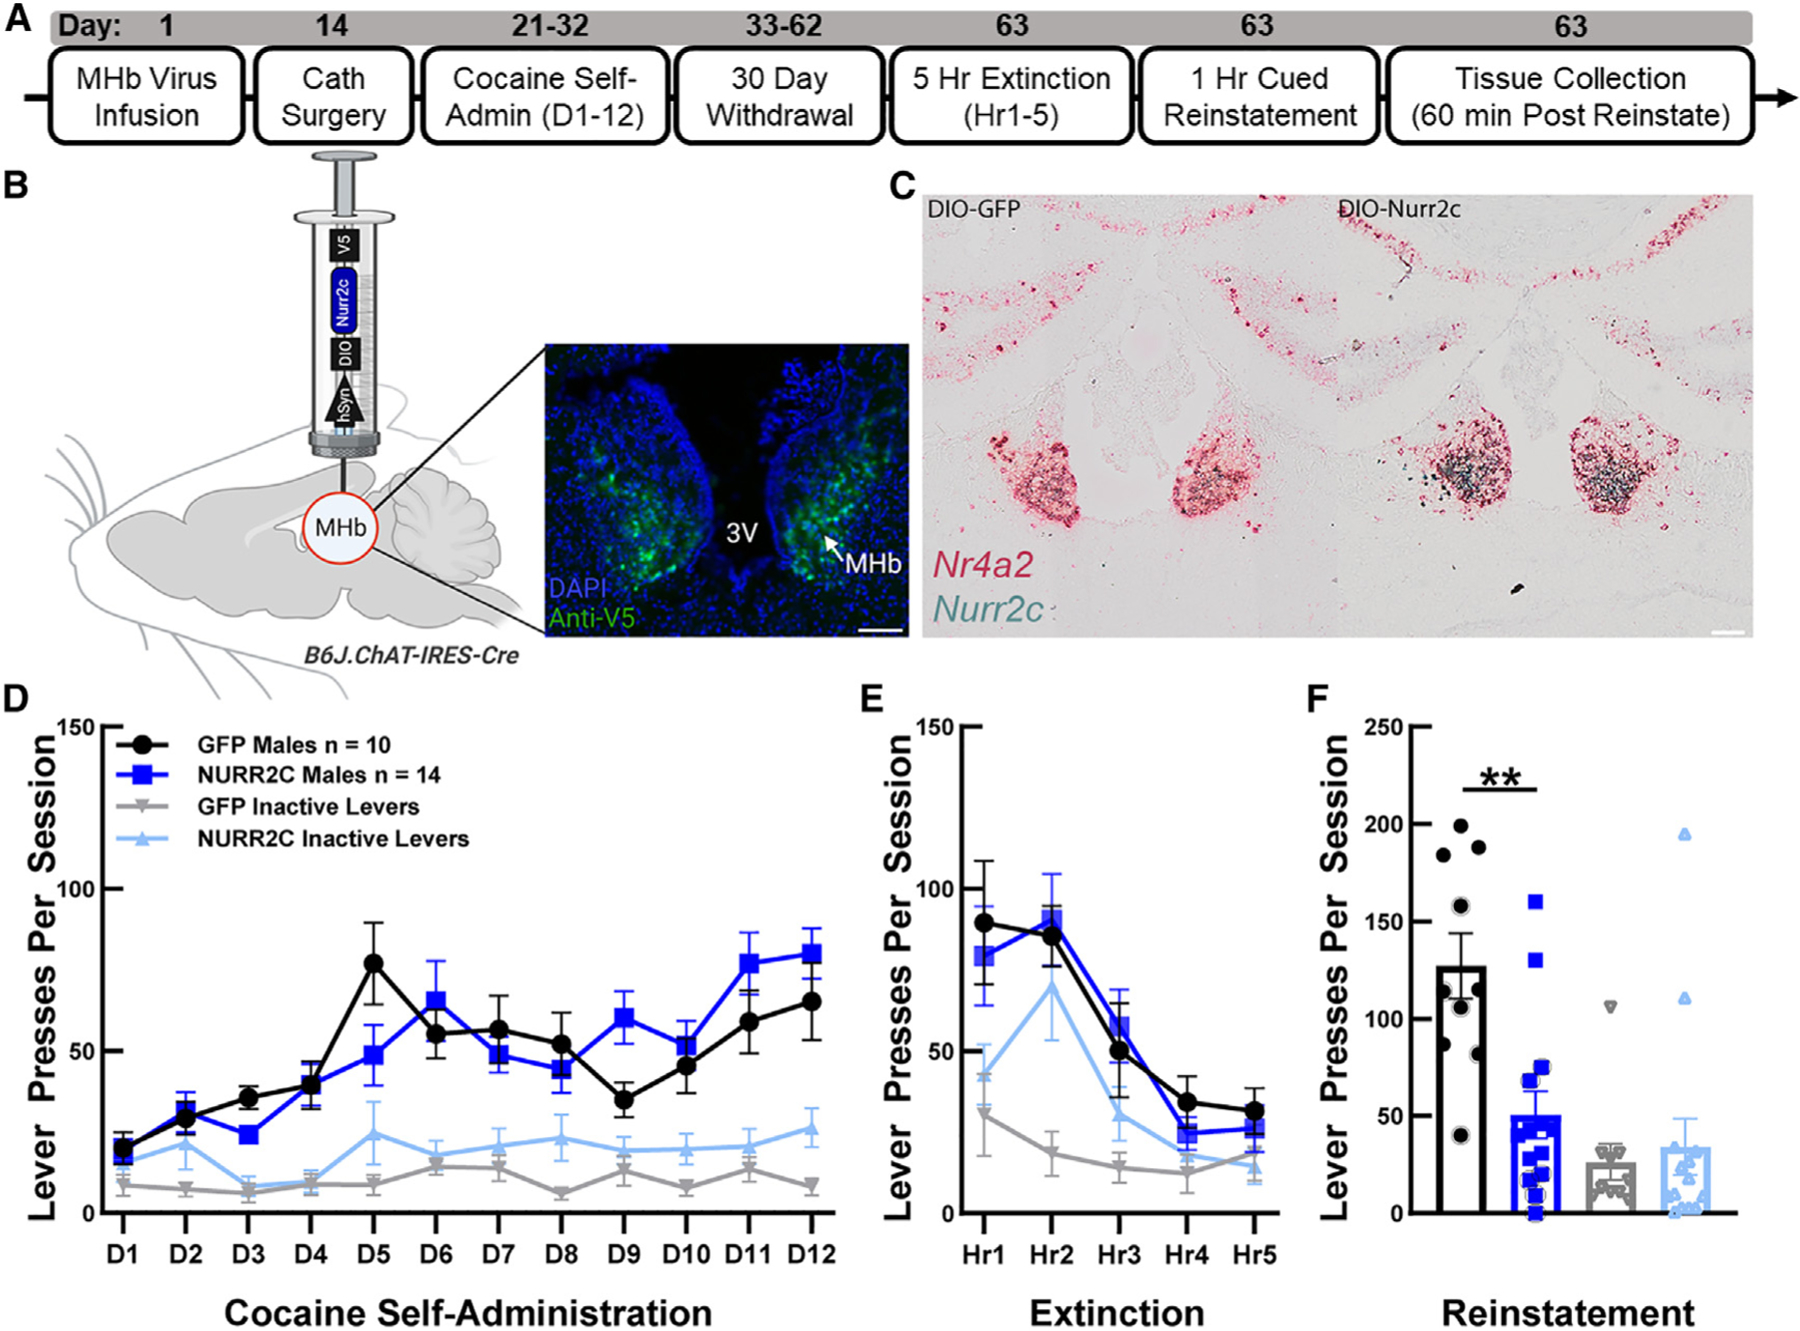
(A) Experimental timeline. After receiving infusion and catheter surgeries, mice self-administered cocaine for 12 days in operant conditioning chambers (D1-12). During self-administration, active lever presses resulted in a cocaine reward (8.5 μg/kg/infusion) plus a tone/light cue presentation. After 12 days of self-administration, mice experienced a 30-day homecage withdrawal period. Mice were then extinguished in a single 5-h extinction session, in which lever presses were inconsequential. Reinstatement was then induced by exposing mice to the drug-paired cues for 10 min preceding a 1-h cued reinstatement session, during which lever presses elicited cues but no cocaine rewards. Animals were sacrificed, and tissue was collected 1 h after reinstatement.
(B) Schematic of Nurr2c viral delivery to MHb and expression. Protein expression, fused V5 tag (green) compared to DAPI (blue). Scale bar, 100 μm.
(C) Transcript expression, BaseScope of MHb showing Nr4a2 (red) and Nurr2c (green) transcripts in GFP mice (left) and Nurr2c mice (right).
(D) Cocaine self-administration followed by 30-day homecage withdrawal. Data analyzed using two-way repeated-measures ANOVA. Error bars denote SEM. GFP males n = 10, NURR2C males n = 14.
(E) Five-hour extinction session. Data analyzed using two-way repeated-measures ANOVA. Error bars denote SEM. GFP males n = 10, NURR2C males n = 14.
(F) Cued reinstatement. Gray circles indicate included in snRNA-seq analysis. Data analyzed using one-way ANOVA. Error bars denote SEM. **p < 0.01.
Single-nucleus RNA-seq of the mouse habenula to study the role of Nr4a2 in reinstatement of cocaine seeking
As NR4A2 has easily druggable ligand-binding sites, delineating the downstream transcriptomic changes that occur after manipulations of Nr4a2 has high value to a broad range of scientific and medical fields of study. To examine NR4A2-dependent changes in the transcriptome of the MHb after reinstatement, we performed snRNA-seq (10× Genomics v3, STAR Methods) on habenula tissue samples from mice that experienced cued reinstatement of cocaine seeking. Tissue for snRNA-seq was taken from mice that overexpressed Nurr2c (n = 6 behaviorally experienced NURR2C) in the MHb and from control mice (n = 5 behaviorally experienced GFP). We also included two additional groups to control for the cocaine self-administration and reinstatement experience, behaviorally naive NURR2C mice (n = 4) and behaviorally naive GFP mice (n = 4). Following stringent quality control filtering based on sequencing metrics (STAR Methods), we retained 109,881 nuclei for downstream analysis, making this the largest snRNA-seq dataset of the mouse habenula to date23,24 (median unique molecular identifiers/cell: 3,110; median genes/cell: 2,032; Figure S1). Using unsupervised dimensionality reduction and Leiden clustering25 on a transcriptomic cell neighborhood graph, we identified 26 cell clusters belonging to 11 major cell classes (STAR Methods), and we visualized these clustering results using uniform manifold approximation and projection26 (UMAP, Figure 2A). We annotated Leiden clusters based on the results of an unbiased cluster marker gene analysis (Figure 2B, STAR Methods, and Table S1) and by inspecting the expression of canonical habenula cell-type markers (a list of several genes defined each cluster, see STAR Methods and Figure S2). In sum, our clustering analysis revealed five MHb neuron populations (19,310 nuclei; MHb1-5), six lateral habenula (LHb) neuron populations (19,882 nuclei; LHb1-6), and four perihabenular (PHb) neuron populations (18,082 nuclei; PHb1-4), as well as glial and neurovascular cell populations including astrocytes (15,986 nuclei; ASC1-2), microglia (3,672 nuclei; MG), oligodendrocytes (21,624 nuclei, ODC1-3), oligodendrocyte progenitors (3,882 nuclei; OPC), pericytes (1,748 nuclei; PER), endothelial cells (2,237 nuclei; END), fibroblasts (403 nuclei; FBR), and ependymal cells (3,055 nuclei, EPD). Integration and comparison of our dataset with a published habenula snRNA-seq dataset supports our cell clustering and annotation being consistent with the previous literature23 (Figure S3).
Figure 2. Single-nucleus RNA-seq of the mouse habenula to study the role of Nr4a2 in reinstatement of cocaine seeking.
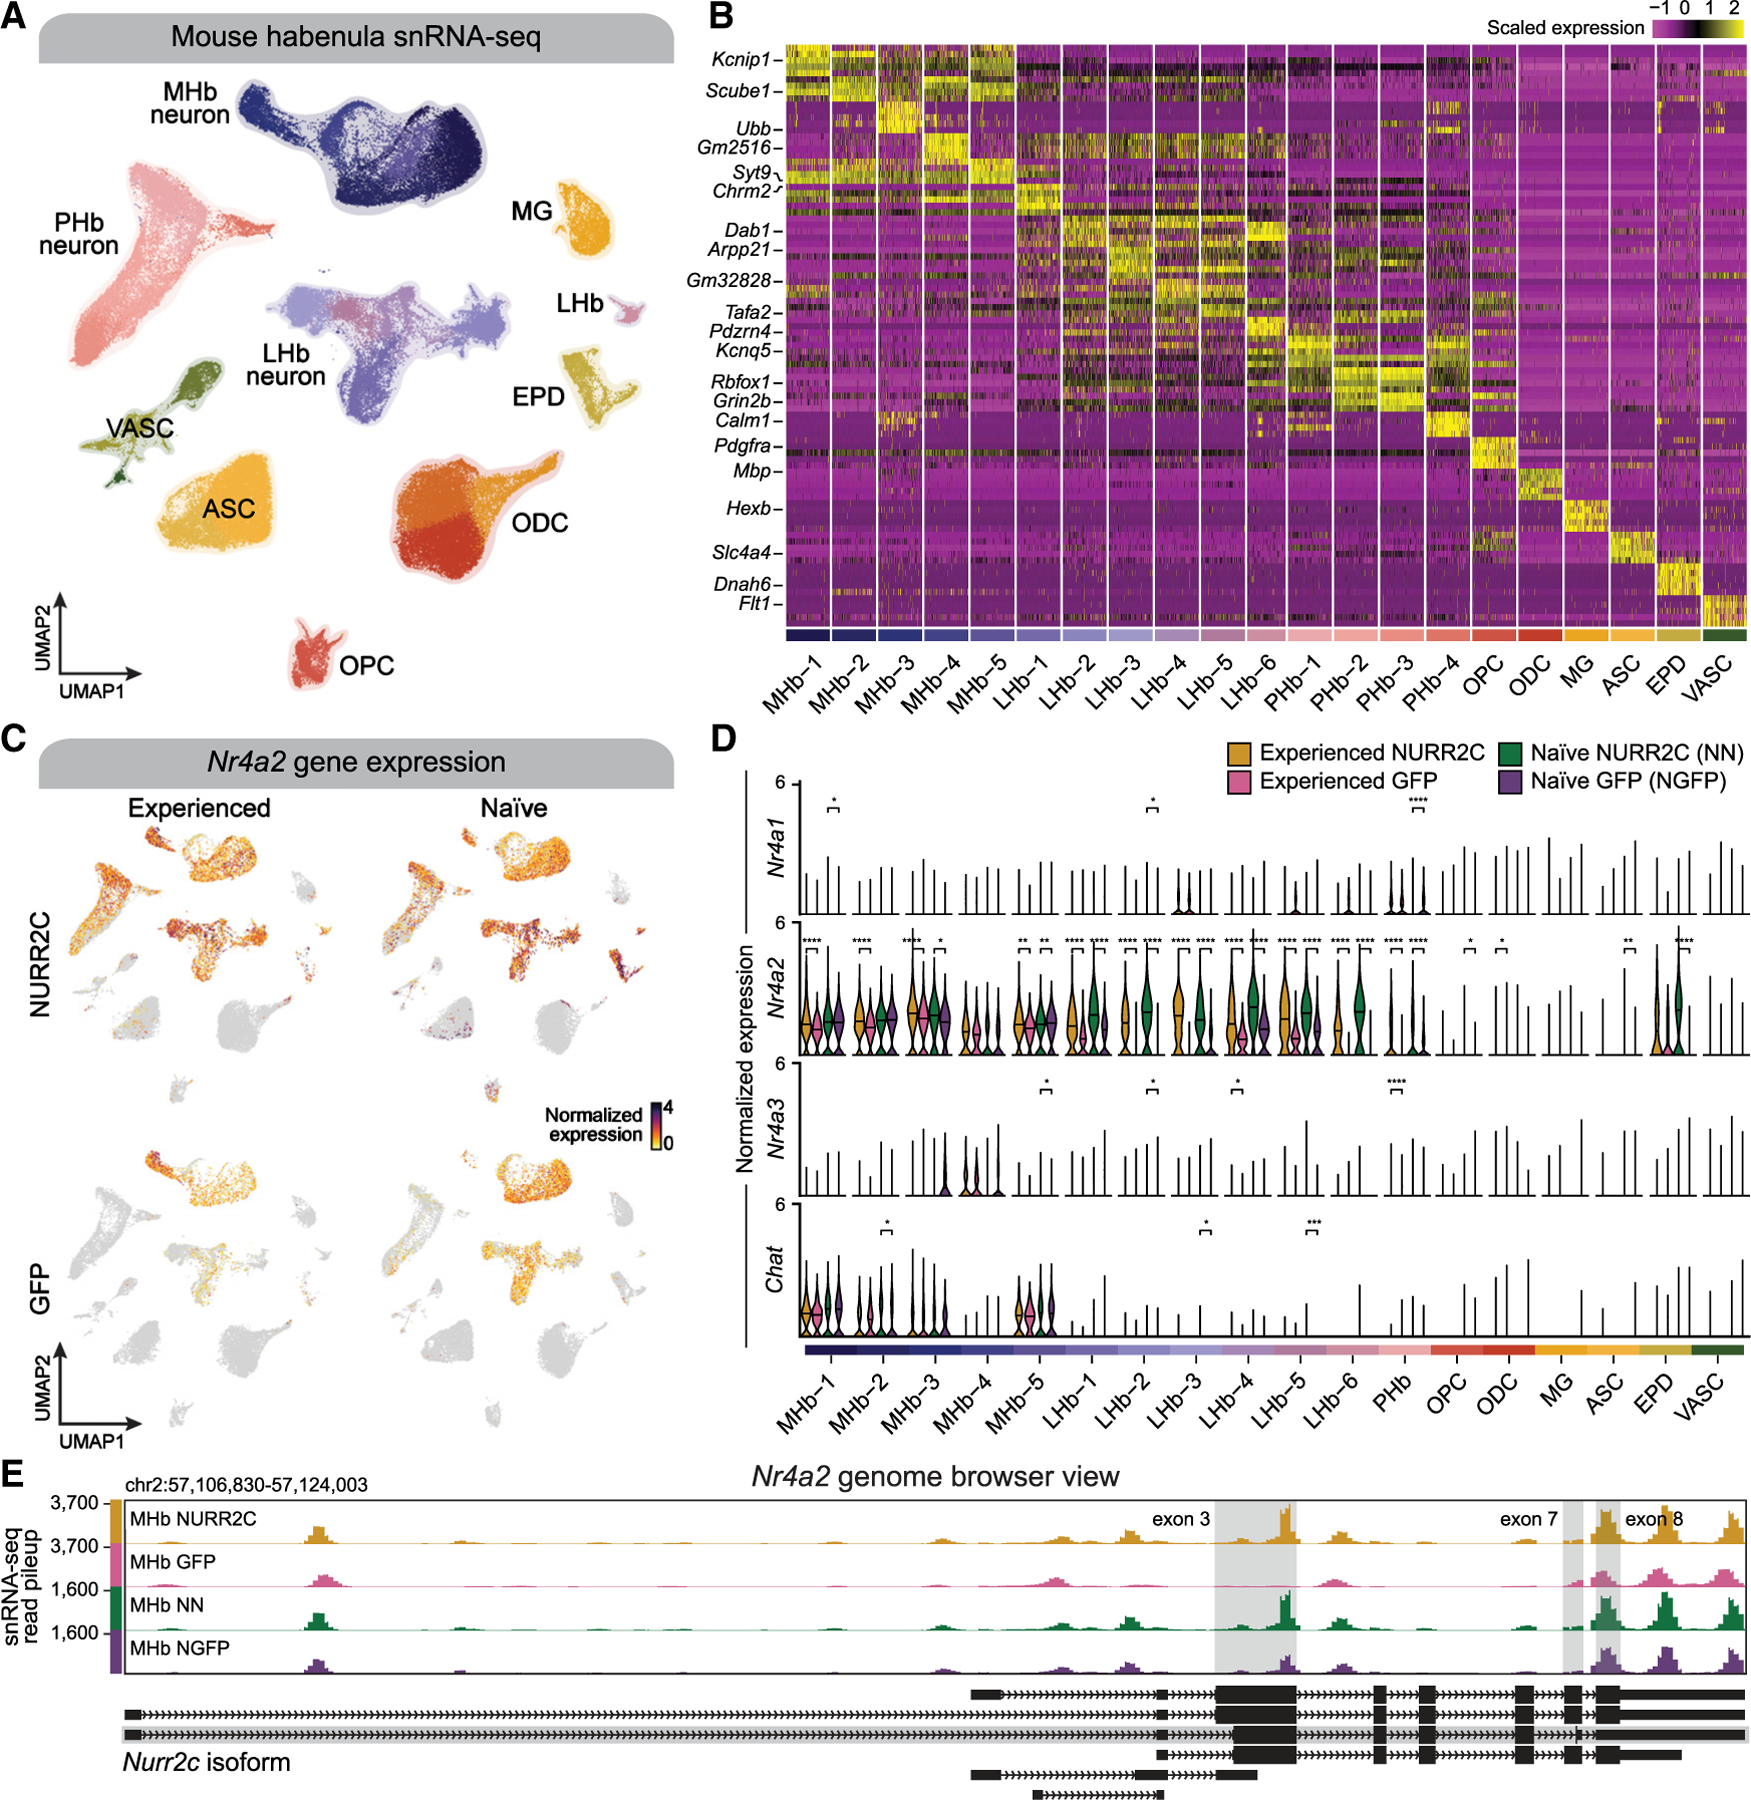
(A) Uniform manifold approximation and projection (UMAP) plot where points correspond to individual nuclei for 109,881 nuclei profiled with snRNA-seq in the mouse habenula. Points are colored by Leiden cluster assignment, and major cell types are annotated.
(B) Heatmap showing the scaled gene expression of the top five marker genes by average log2(fold change) from each of the 21 snRNA-seq clusters, based on a one-versus-all iterative marker gene test for each cluster using a hurdle model (MAST).
(C) UMAP plot as in (A) colored by normalized expression of Nr4a2, split by nuclei from the behavior (left) and naive (right) groups and by NURR2C (top) and GFP (bottom) treatment.
(D) Violin plots showing distributions of normalized gene expression for Nr4a1, Nr4a2, Nr4a3, and Chat, stratified by experimental groups. Two-sided Wilcoxon test was used to compare NURR2C with GFP samples within the behaviorally experienced and naive groups. Not significant, p > 0.05; *p ≤ 0.05, **p ≤ 0.01, ***p ≤ 0.001, ****p ≤ 0.0001.
(E) UCSC Genome Browser snapshot of the Nr4a2 locus. Normalized snRNA-seq read pileup is shown for medial habenula (MHb) neurons, stratified by the four mouse groups. Gene models from the GENCODE VM23 comprehensive transcript set are shown below the coverage tracks, highlighting the Nurr2c isoform of Nr4a2 (ENSMUST00000183542.7). Exons 3, 7, and 8 are highlighted to showcase the distinct features of the Nurr2c isoform.
Targeting medial habenula Nr4a2
We next validated the general approach of restricting Nurr2c expression to MHb ChAT neurons. First, we wanted to verify expression levels of MHb Chat. Using our snRNA-seq dataset we found that Nr4a2 expression was highest in habenula neuron clusters (Figures 2C and 2D), and found higher expression of Chat in MHb neurons relative to other cell types in both groups of GFP mice and both groups of NURR2C mice (Figure 2D and Table S1), indicating that the use of ChAT-Cre mice likely restricted Nurr2c expression to MHb neurons. To verify endogenous Nr4a2, validating Nr4a2 as a viable MHb target, we next examined expression levels of MHb Nr4a2 and family members Nr4a1 and Nr4a3. In both groups of GFP mice (with no Nr4a2 manipulations), Nr4a2 was higher in MHb neurons and LHb neurons compared to other cell types, indicating an innate role for Nr4a2 in habenula neurons (Figure 2D and Table S1). In all groups, expression of family members Nr4a1 and Nr4a3 was low across all cell types (Figure 2D), indicating that targeting MHb Nr4a2 is viable and that the Nurr2c manipulation does not lead to compensatory expression of Nr4a1/3. We did find increases in Nr4a2 + Nurr2c (labeled collectively as Nr4a2 in Figure 2) expression in both groups of NURR2C mice in MHb neurons, relative to GFP controls, with minimal changes in non-neuronal cell types (Figure 2D and Table S1). Clusters MHb 1, 2, 3, and 5 have Chat expression, which correlates with increased Nr4a2 + Nurr2c expression after Nurr2c infusions. In contrast, MHb-4 cluster has very little Chat, and correspondingly there is no change in Nr4a2 + Nurr2c expression in Mhb-4 after the Nurr2c infusion compared to GFP-infused mice. Because our short-read sequencing approach that does not differentiate Nurr2c and Nr4a2 transcripts, we conducted a BaseScope study in tissue from Nurr2c-infused mice using probes for Nurr2c and Nr4a2 that can distinguish between the two. We observed dense expression of Nr4a2 in the MHb, with some sparse expression in the LHb (Figure 1C, red); however, despite restriction to the MHb by use of ChAT-Cre mice, Nurr2c transcripts were also found across the greater anatomical region (Figure 1C [right], green). We attributed this to high levels of Nurr2c transcription after viral delivery or perhaps trafficking of transcripts within the habenula complex. Most importantly, NURR2C protein is restricted to the ventral MHb cells as expected. We validated NURR2C protein expression using immunohistochemistry against the V5 tag and found that protein expression was restricted to the ventral MHb (inset in Figure 1B, which replicates what we observed in a previous study using this approach14), despite broad expression of the mRNA transcript. snRNA-seq read coverage at the Nr4a2 locus on the UCSC Genome Browser shows that the snRNA-seq reads are unable to distinguish between Nr4a2 and Nurr2c at the three possible regions in which these transcripts differ (highlighted in gray columns) but that there are more reads in the NURR2C groups (which express Nurr2c, behaviorally experienced = MHb NURR2C, behaviorally naive = MHb NN) for Nr4a2 + Nurr2c than observed in GFP controls (Figures 2E and S4). In summary, we found that both Chat and Nr4a2 are highly expressed in the MHb (as expected) and that NURR2C in the MHb does not lead to a compensatory effect in the expression of Nr4a1 or Nr4a3.
Transcription factor regulatory network analysis reveals NR4A2 as a key regulator of medial habenula neurons
NR4A2 is a TF and is thus able to modulate the expression of many genes both directly via interactions with promoters or enhancers and indirectly by regulating other TFs that modulate additional genes. Since our experiment included mice expressing a dominant negative isoform of NR4A2 and GFP controls, we had a unique opportunity to probe our snRNA-seq dataset to characterize the regulatory role of NR4A2 within the MHb. We identified putative NR4A2 target genes and mapped NR4A2 regulatory networks by employing a data-driven strategy to infer MHb neuron TF regulatory networks for each of the four mouse groups (behaviorally experienced NURR2C/GFP that have gone through cocaine self-administration and reinstatement, and behaviorally naive NURR2C/GFP; see STAR Methods). TFs may have distinct and conserved regulatory signatures across different cell types and experimental conditions,27 motivating us to analyze networks separately in our four groups, followed by a comparative analysis. Using the set of genes in our snRNA-seq dataset, we first scanned gene-promoter regions for the presence of TF-binding motifs for 660 TFs from the JASPAR TF motif database to identify a list of potential regulatory targets for each TF, including NR4A2 (Figure 3A). We next used an ensemble learning algorithm (extreme gradient boosting trees, XGBoost) to model the expression of each gene based on the expression of its potential TF regulators. This method allows us to compute TF regulatory scores, quantifying how important a particular TF was for modeling the expression of a gene, therefore allowing us to identify the most likely regulators of each gene. We assign a direction to the TF regulatory scores based on the sign of the gene co-expression of the TF and the potential target gene. After repeating this process for all potential TF-gene links from the motif scan, the most confident TF-gene regulatory links are retained to define ‘‘TF regulons,’’ the set of putative target genes for each TF (STAR Methods). Importantly, this approach can distinguish between activating and repressing target genes of each TF based on the sign of the TF regulatory score. Finally, these TF-gene regulatory links and regulons are assembled into a final TF regulatory network (Figure 3A and Table S3). Importantly, we can use this TF regulatory network to identify indirect targets of NR4A2 that are mediated through other TFs, and in our analyses we distinguish these as primary (direct) and secondary (indirect) target genes (STAR Methods). We used these MHb neuron TF regulatory networks to specifically probe the downstream regulatory targets of NR4A2 in our four mouse groups. We first computed composite gene expression scores (UCell) for NR4A2 target genes in the behaviorally experienced and naive NURR2C groups, revealing a broad regulatory impact of NR4A2 in MHb neurons (Figure 3B and STAR Methods). We next visualized the network comprising NR4A2 and its primary and secondary target genes in the behavior NURR2C and GFP groups (Figures 3C and 3D). In the NURR2C network, we found 714 primary target genes and 2,110 secondary target genes, and in the GFP network we identified 451 primary and 2,249 secondary target genes (Figure 3E). Of these genes, 26 primary and 125 secondary targets were TFs in the NURR2C network, while 14 primary and 108 secondary targets were TF genes in the GFP network.
Figure 3. Transcription factor regulatory networks in MHb neurons reveal group-specific NR4A2 target genes.
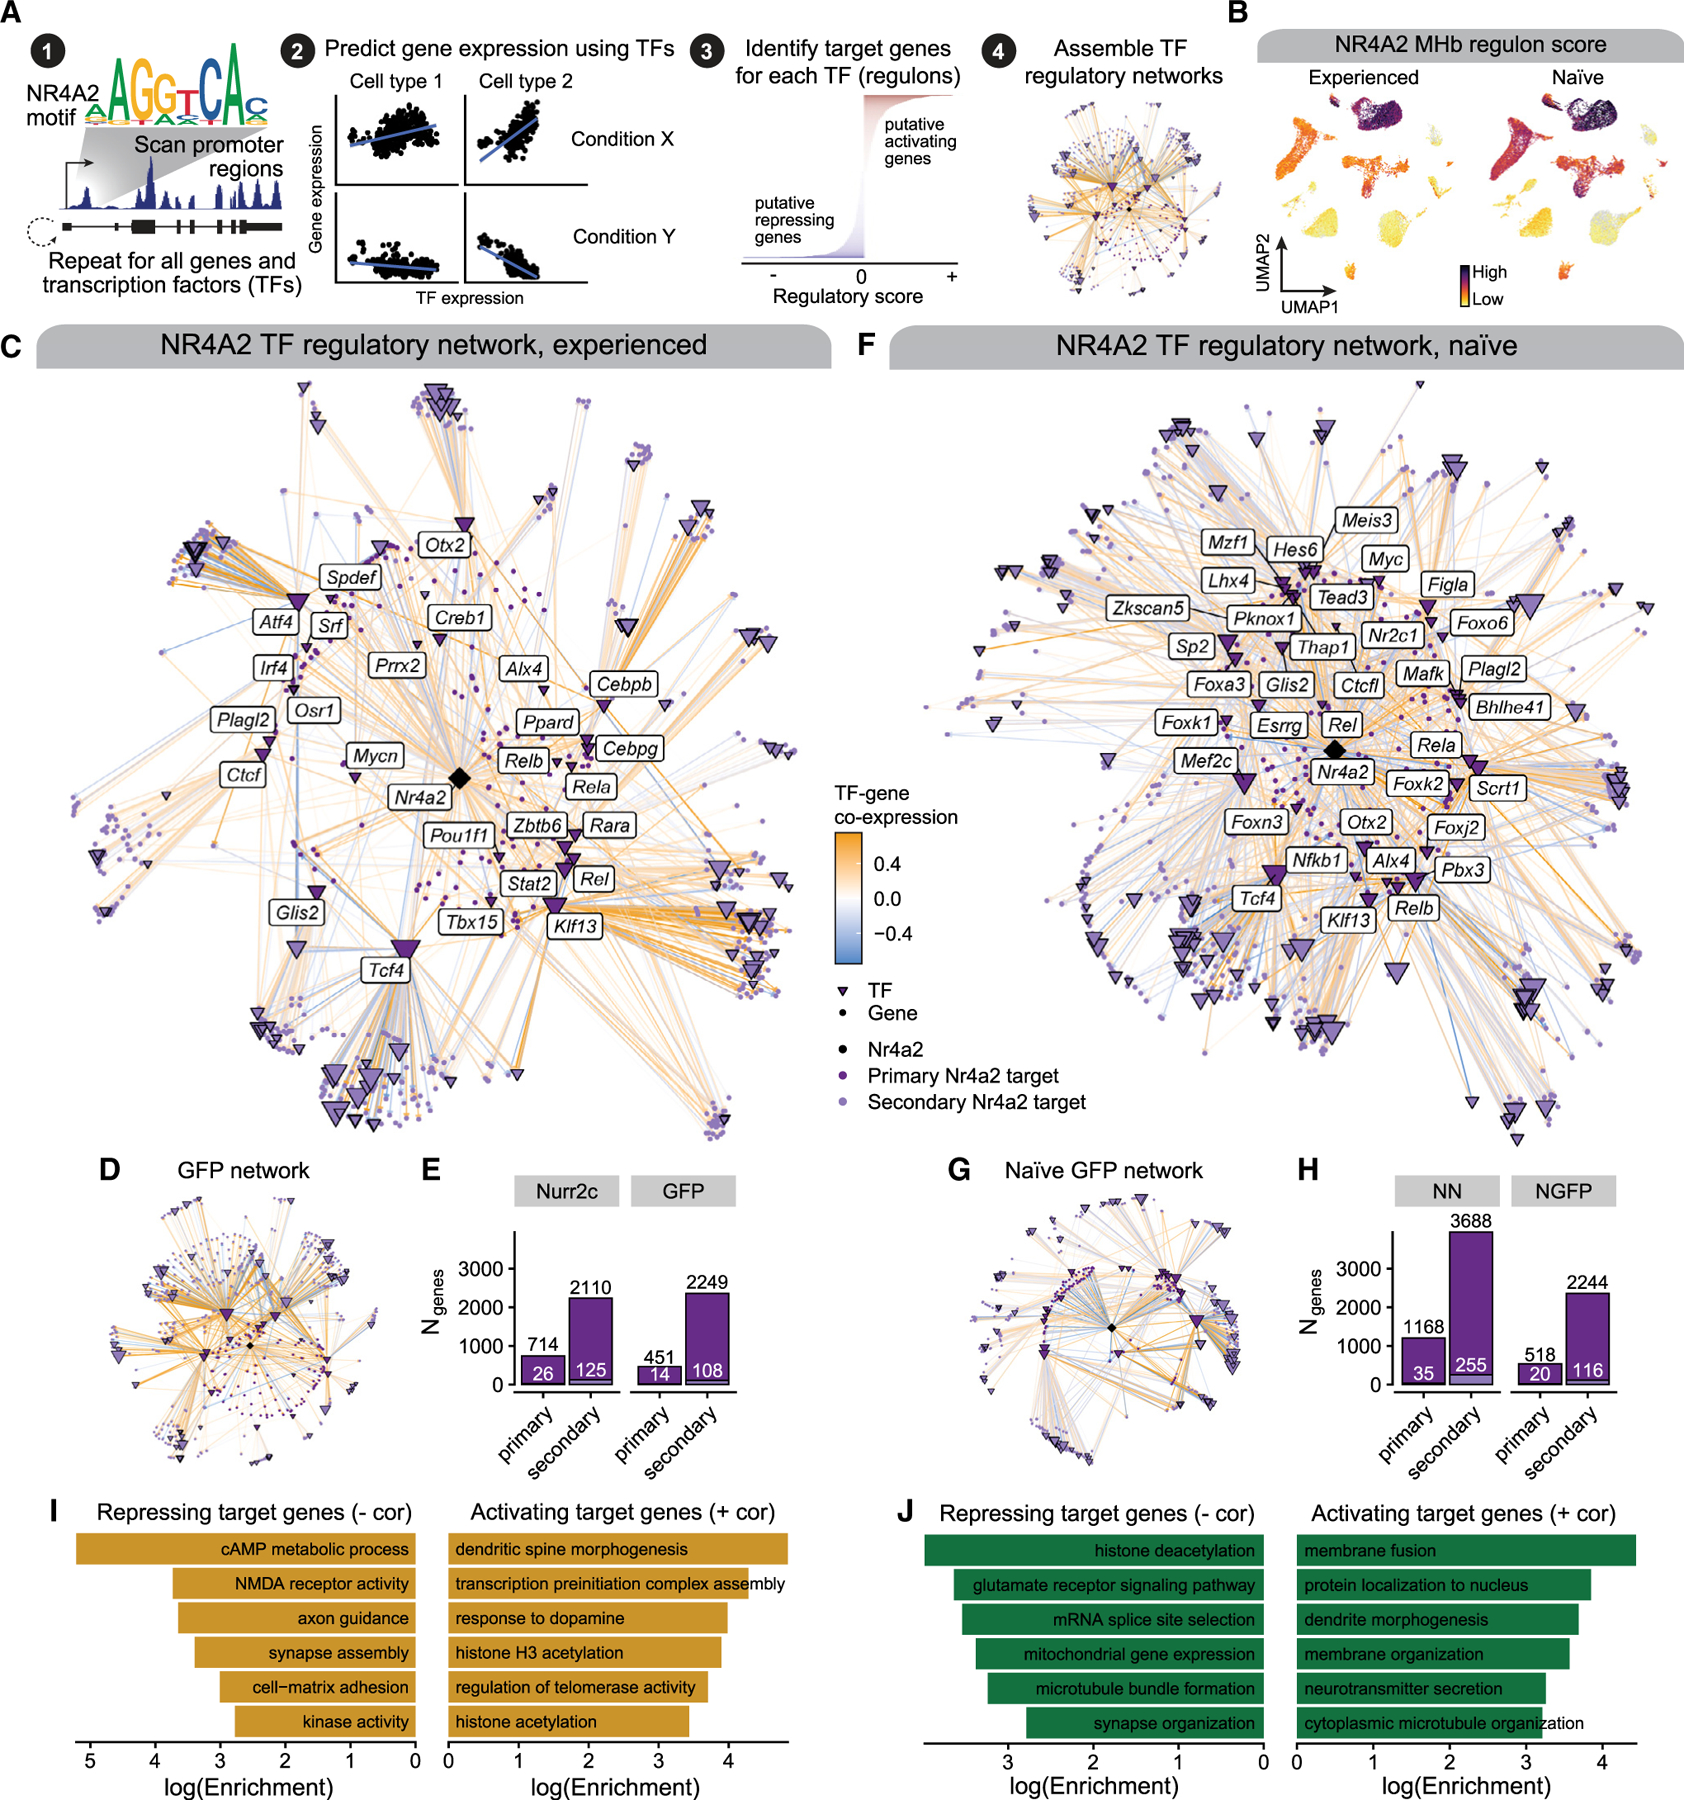
(A) Schematic of our TF regulatory network analysis strategy. We scanned gene promoters for TF motifs to define potential TF-gene relationships. We next used a regression model to predict the expression of each gene based on the expression of TFs with motifs present in that gene’s promoter. The top five most predictive TFs for each gene were retained to define the set of putative target genes for each TF (regulons), which we used to assemble TF regulatory networks.
(B) UMAP of the snRNA-seq dataset colored by UCell gene expression scores for NR4A2 target genes in MHb neurons in experienced and naive NURR2C groups.
(C) NR4A2 regulatory network in MHb neurons from the experienced NURR2C group. Nodes represent individual genes and are colored based on their relationship with NR4A2. Directed edges represent TF regulatory relationships, colored by TF-gene gene expression correlation.
(D) Network plot as in (C) for the experienced GFP group.
(E) Bar plots showing the number of primary and secondary NR4A2 target genes identified in the NURR2C and GFP groups in the experienced mice. (F and G) Network plot like that shown in (C) for the naive NURR2C (F) and naive GFP (G) groups.
(H) Bar plots as in (E) for the networks from the naive mice.
(I and J) Selected pathway enrichment results for NR4A2 target genes identified in NURR2C for the experienced (I) and naive (J) groups. Results shown for target genes with negative (left) and positive (right) gene expression correlations with Nr4a2.
One of the primary targets of NR4A2 is Ctcf, which codes for CCCTC-binding factor (CTCF), a highly conserved master regulator of 3D chromatin topology and architecture that can alter interactions between enhancer and promoter regions.28,29 NR4A2 was only predicted as a transcriptional regulator of Ctcf based on our network analysis of the behavior NURR2C group (Table S3). This regulatory relationship between NR4A2 and Ctcf in MHb neurons could mediate downstream effects on the 3D genome structures of MHb neurons, and CTCF-mediated epigenetic regulation remains understudied in the habenula in the context of addiction. Two of the other primary TF targets of NR4A2 in NURR2C mice, Tcf4 and Ppard (coding for TF 4 and peroxisome proliferator-activated receptor d, respectively), target Nr4a2 based on our network analysis, effectively forming a regulatory feedback loop. Tcf4 is a known genetic risk factor for neuropsychiatric disorders including schizophrenia and autism spectrum disorder,30,31 and neuronal expression of Tcf4 has been linked to neuronal differentiation in embryogenesis32 as well as structural and functional integrity of adult neurons.33 On the other hand, Ppard is a ligand-activated TF involved in lipid metabolism and, while its role is not well understood in habenula neurons, it has been implicated in adult neurogenesis and neuronal stem cell fate determination.34 When we investigated TF regulatory networks in the behaviorally naive NURR2C and GFP mice, we observed conserved and distinct TF-gene regulatory patterns compared to the behavior groups, including the link between Tcf4 and Nr4a2 (Figures 3F–3H). We compared the NR4A2 TF regulatory scores and the sets of NR4A2 target genes between the four experimental groups, and while many regulatory targets were conserved across groups even more targets were group specific (Figure S5). To further understand which biological processes are potentially regulated by NR4A2 in the MHb, we performed pathway enrichment analysis in the sets of NR4A2 primary target genes, stratifying by activating and repressing target genes (Figures 3I and 3J; Table S4; STAR Methods). In both the behavior and naive NURR2C networks, NR4A2 primary target genes were enriched for pathways associated with critical neuronal functions such as neurotransmission, synaptic assembly, and neuroplasticity. Nr4a2 is a known target of the epigenetic regulator HDAC3, and this analysis identified that pathways associated with epigenetic regulation, specifically histone modifications and acetylation, were enriched in these NR4A2 primary target genes. In sum, this analysis illuminates key genes, TFs, and pathways that are regulated by NR4A2 in MHb neurons. Critically, we note that these putative TF-gene relationships are based on a computational model and therefore require further study and validation to comprehensively understand the regulatory landscape of habenula neurons.
Nr4a2-dependent changes in the habenula transcriptome in behaviorally naive mice
To obtain a baseline response in changes to the transcriptome resulting from NURR2C, we first identified differentially expressed genes (DEGs) in our behaviorally naive groups (NURR2C and GFP). We performed differential gene expression tests comparing nuclei from behaviorally naive NURR2C and behaviorally naive GFP in each major cell type, and we highlighted the results for the MHb and LHb neuron populations (Figures 4A, 4B, and S6; Table S5). We stratified our DEG results within these cell populations by putative primary and secondary NR4A2 target genes and other non-target genes, and we identified significant DEGs in each of these gene groups (Figures 4A and 4B). Pairwise rank-rank hypergeometric overlap (RRHO) analysis comparing genes ranked by log2(fold change) showed broad similarities between NURR2C and GFP differential expression effect sizes for the MHb and LHb neuron DEG tests (Figure 3C). In a gene set overlap of DEGs significantly up- or downregulated (adjusted p < 0.05; log2(fold change) > 0.25 for upregulated; log2(fold change) < −0.25 for downregulated), we found that only 38 genes were significantly upregulated in both MHb and LHb neurons and just six genes were significantly downregulated in both MHb and LHb neurons. Both overlaps were statistically significant based on Fisher’s exact test compared to the background set of genes in our dataset (Figure 4D, upregulated overlap p = 7.2e-62, downregulated overlap p = 3.2e-13). Together, this overlap analysis shows that MHb and LHb neurons share some genes with changing expression levels, but also that most of the genes in habenula neurons change in ways that are specific to the type of neuron in which they are found. Many of these significant DEGs were primary or secondary target genes of NR4A2 based on our TF regulatory network analysis (Figure 4E). One of the top genes downregulated in NURR2C that was a primary target of NR4A2 in the MHb was Kcnip4, which codes for a potassium voltage-gated channel interacting protein involved in neuronal excitation, which has links to substance use disorder.35 Furthermore, one of the top genes upregulated NR4A2 targets in the MHb was H3f3b, which codes for a member of the histone H3 family. Pathway enrichment analysis of these DEGs highlighted biological processes that were altered in the NURR2C manipulation (Figures 4F–4H). Terms associated with RNA splicing and chromatin remodeling were enriched in genes upregulated in NURR2C mice in both the MHb and LHb neurons, and we found terms associated with synaptic functions enriched in genes downregulated in NURR2C mice in MHb neurons (Figures 4F–4H). Overall, this differential gene expression analysis provides a baseline understanding of transcriptional changes in our NURR2C manipulation in behaviorally naive mice and provides a basis of comparison for behaviorally experienced mice with the same MHb manipulations that have been through cocaine self-administration and reinstatement.
Figure 4. Transcriptomic changes in habenula neurons following NURR2C perturbation in behaviorally naive mice.
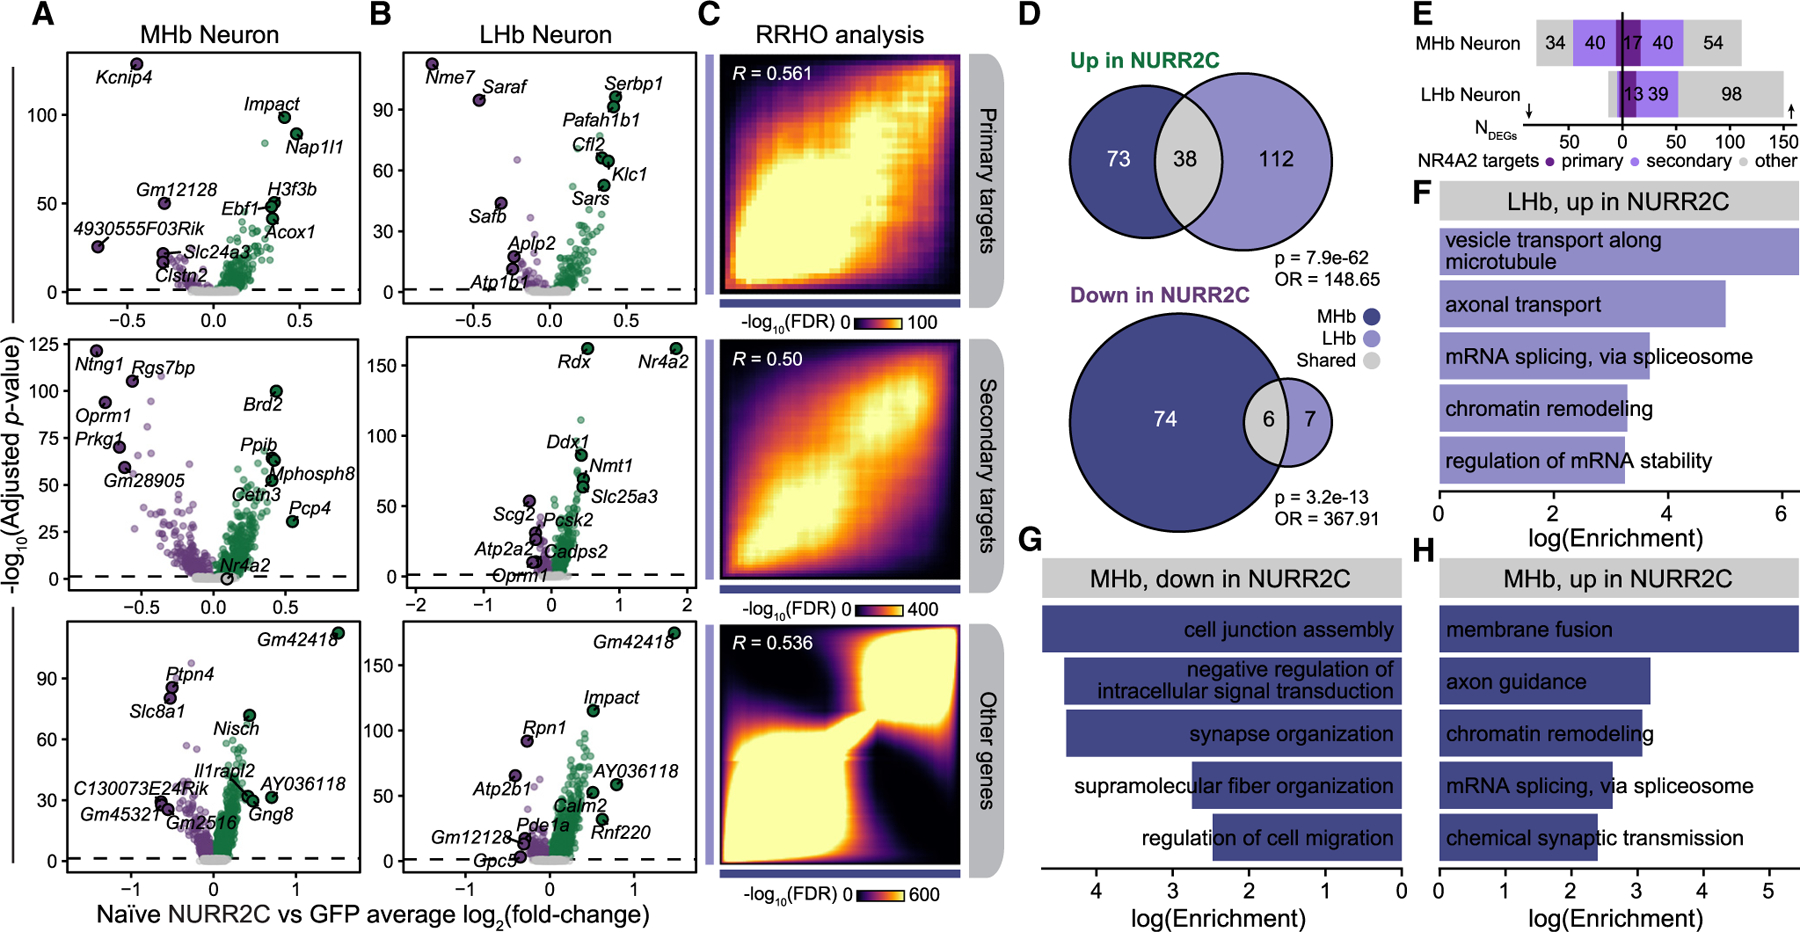
(A and B) Volcano plots showing NURR2C vs. GFP differential gene expression results in MHb (A) and LHb (B) neurons. Top five up- and downregulated DEGs by log2(fold change) are annotated. Genes are stratified by NR4A2 target gene status.
(C) Rank-rank hypergeometric overlap (RRHO) heatmaps comparing effect sizes from NURR2C vs. GFP differential expression tests between the MHb and LHb groups. Pearson correlation coefficients are shown.
(D) Euler diagrams showing overlap of DEGs up- and downregulated in NURR2C from the MHb and LHb neuron analyses. Fisher’s exact test statistics for the overlaps are shown.
(E) Bar plot showing the number of DEGs (absolute log2(fold change) > 0.25 and adjusted p < 0.05) stratified by NR4A2 target gene status.
(F–H) Selected pathway enrichment results for genes upregulated in LHb neurons (F), downregulated in MHb neurons (G), and upregulated in MHb neurons (H).
Nr4a2-dependent changes in the habenula transcriptome after reinstatement of cocaine seeking
Consideration of the MHb as a regulator of relapse behavior for non-nicotine drugs is novel enough that the governing mechanisms within the MHb are nearly completely unknown. Based on our previous work,14 we strongly suspected that Nr4a2 levels and function were directly linked to reinstatement of cocaine seeking. Because reinstatement behavior was reduced in NURR2C mice, we next examined the mechanisms by which NR4A2 may be regulating reinstatement. To quantify the effect of the transcriptome-wide perturbation in behaviorally experienced reinstated NURR2C mice, we used a graph signal-processing algorithm (MELD)36 to estimate the relative likelihood that a cell was observed in NURR2C or GFP in a low-dimensional manifold derived from cells in both conditions, thereby yielding a Nurr2c perturbation score for each cell (Figure 5A and STAR Methods). While we know the ground-truth origin of each cell (NURR2C or GFP), some cells have highly similar transcriptomes across the different conditions while other cells undergo vast transcriptional changes, and this approach attempts to bridge this gap in our understanding by modeling a continuous measure of perturbation effects in transcriptomic space with a relative likelihood estimate. The distribution of these relative likelihood scores in each snRNA-seq cluster revealed the clusters with the strongest predicted Nurr2c-induced transcriptomic perturbation, highlighting clusters LHb-2, PHb-1, MHb-1, MHb-5, and MHb-2. These data show that reducing NR4A2 function in MHb ChAT neurons strongly affected gene expression in not only MHb neuron clusters but also LHb neuron clusters, suggesting functional interplay between these adjacent and connected regions37 relevant to reinstatement of cocaine seeking. Next, we systematically identified DEGs between NURR2C and GFP in each cell type (NURR2C DEGs) for mice in the behaviorally experienced group, and we highlight the results for the neuronal populations, which we stratified by putative primary NR4A2 targets, NR4A2 secondary targets, and probable non-targets (Figures 5B, 5C, and S6; Table S5).
Figure 5. NURR2C induces transcriptomic changes in habenula neurons.
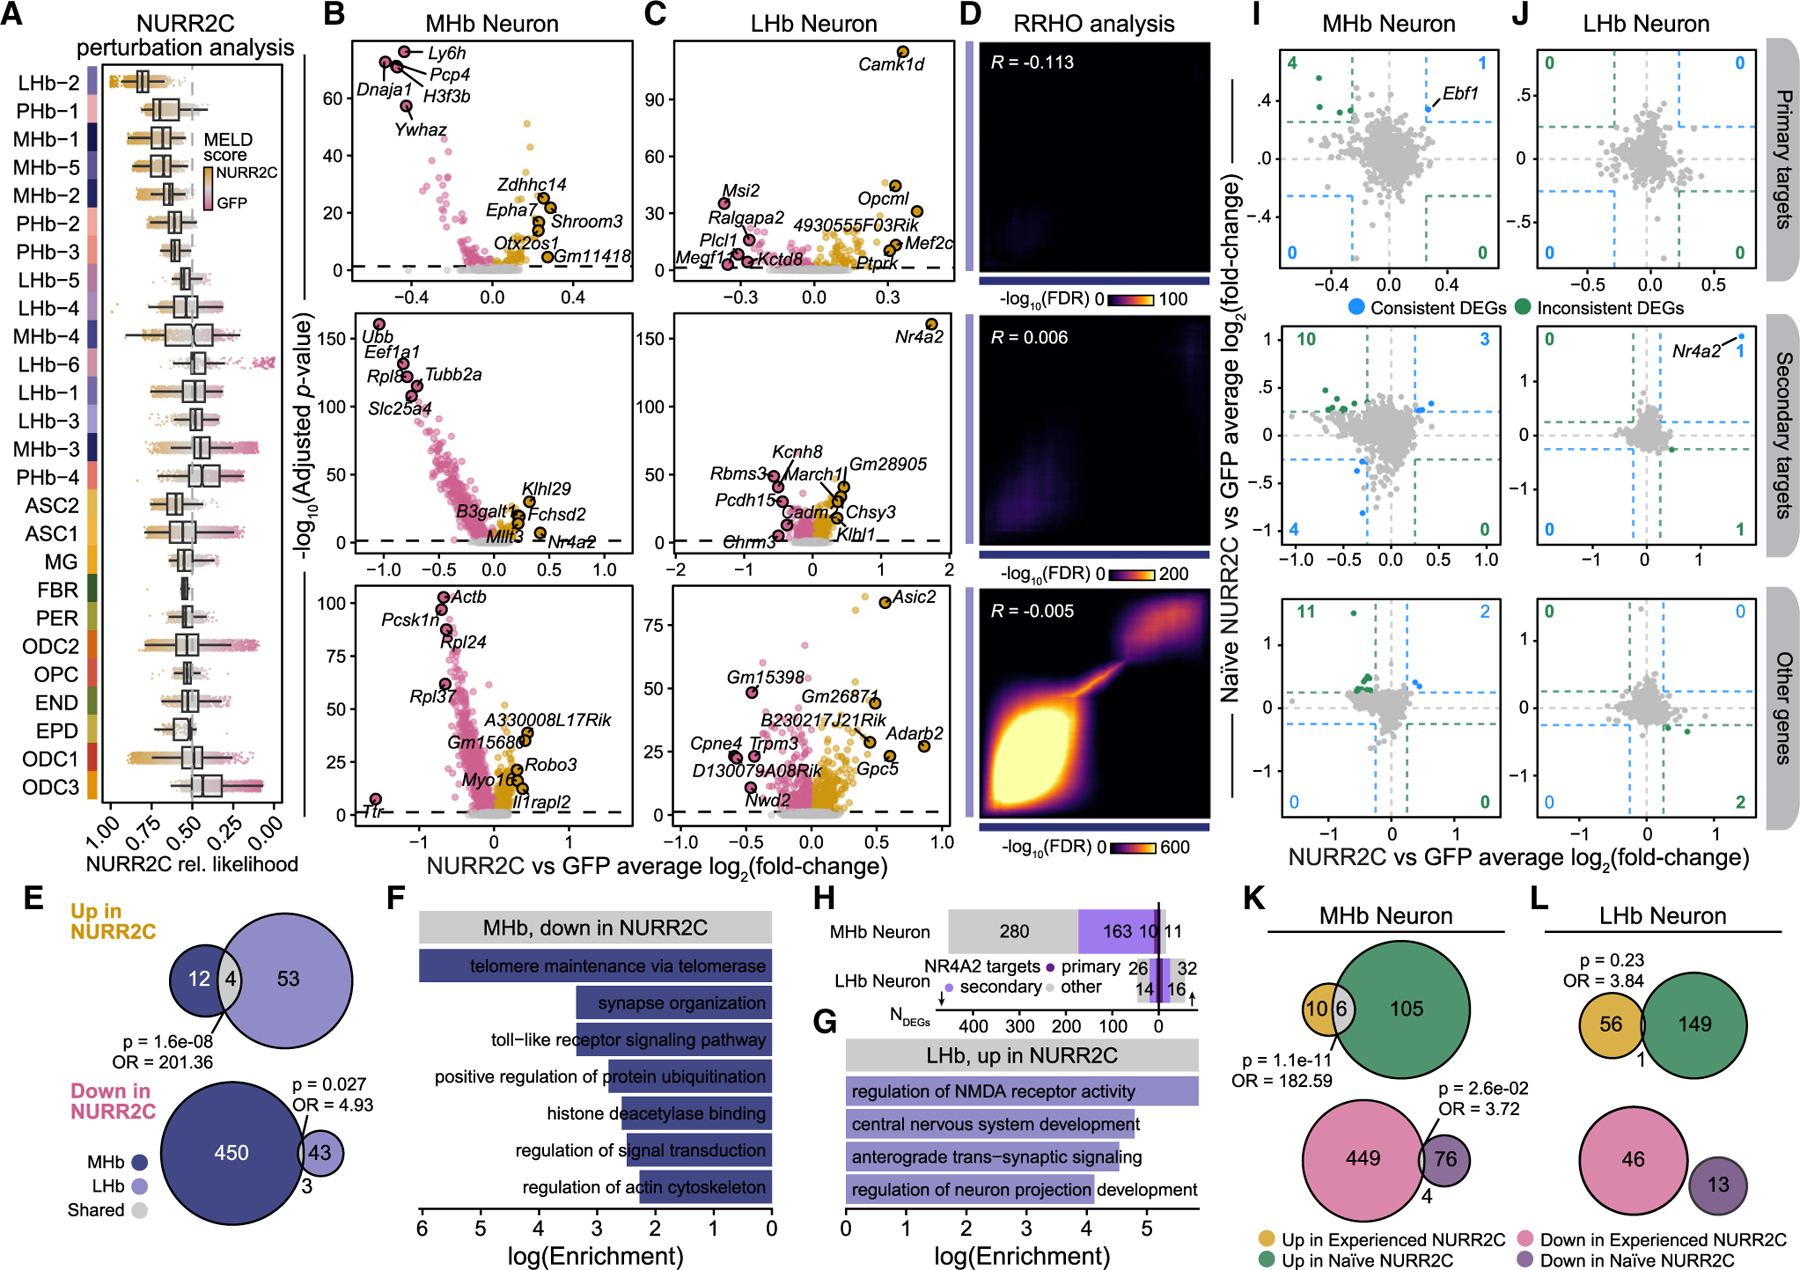
(A) MELD relative likelihood analysis to quantify the effect of the Nurr2c transcriptomic perturbation in single nuclei. Box-and-whisker plots are shown for relative likelihood scores in each cluster. Clusters are ordered by median MELD scores for neuronal and non-neuronal groups.
(B and C) Volcano plots showing NURR2C vs. GFP differential gene expression results in MHb (B) and LHb (C) neurons. Top five up- and downregulated DEGs by log2(fold change) are annotated. Genes are stratified by NR4A2 target status.
(D) Rank-rank hypergeometric overlap (RRHO) heatmaps comparing the effect sizes from NURR2C vs. GFP differential expression tests between the MHb and LHb groups. Pearson correlation coefficients are shown.
(E) Euler diagrams showing the overlap between DEGs up- and downregulated in NURR2C from the MHb and LHb neuron analyses. Fisher’s exact test statistics for the gene set overlaps are shown.
(F and G) Selected pathway enrichment results for genes downregulated (log2(fold change) < −0.25) in MHb neurons and selected for genes upregulated (log2(fold change) > 0.25) in LHb neurons.
(H) Bar plot showing the number of DEGs (absolute log2(fold change) > 0.25 and adjusted p < 0.05) stratified by NR4A2 target gene status.
(I and J) Comparison of differential expression effect sizes from NURR2C vs. GFP between the experienced and naive groups. Genes that are consistently or inconsistently up- or downregulated are colored blue or green, respectively, and the number of genes in these groups are shown in the corners of each plot. (K and L) Euler diagrams showing the overlap between DEGs up- and downregulated in NURR2C from the experienced and naive groups for MHb neurons (K) and LHb neurons (L). Fisher’s exact test statistics for overlaps are shown.
Group-dependent changes in gene expression were found in MHb and LHb neurons as well as non-neuronal cell types (Figures 5B, 5C, and S6), indicating an integrated function for Nr4a2 within the MHb. By applying RRHO analysis to the behaviorally experienced NURR2C vs. GFP differential expression analysis, we were able to rank genes by log2(fold change) and compare genes in MHb neurons to genes in LHb neurons and found little concordance of DEG effect sizes between these groups (Figure 5D). In particular, the DEGs that were primary or secondary NR4A2 target genes showed worse concordance between MHb and LHb neurons than the other genes, and in general the correlations in these effect sizes were low, indicating that MHb and LHb neurons broadly had distinct sets of DEGs (Figure 5D). We further inspected this trend through gene set overlap analysis of genes significantly upregulated (adjusted p < 0.05; log2(fold change) > 0.25) or significantly downregulated (adjusted p < 0.05; log2(fold change) < −0.25) in NURR2C in the MHb and LHb neurons, finding small yet statistically significant overlaps (Figure 5E). Out of 453 genes that were downregulated in NURR2C in MHb neurons, only three overlapped with genes downregulated in LHb neurons, and only four of the DEGs upregulated in NURR2C were shared across MHb and LHb neurons. Together, this overlap analysis comparing MHb and LHb neurons shows distinct gene expression changes in response to NURR2C, indicating a synergistic interplay of altered genes and pathways across MHb and LHb neurons, ultimately leading to an altered behavioral phenotype.
For the MHb neuron population in behaviorally experienced mice, we found that H3f3b, a primary NR4A2 target gene, was one of the top downregulated DEGs in NURR2C (Figure 5B), while it was one of the top upregulated DEGs in NURR2C in behaviorally naive mice (Figure 4A). This demonstrates a specific example of an altered TF regulatory regime in behaviorally experienced mice and further implicates the histone H3 as a critical structural and regulatory component in the context of addiction in the habenula. Gabbr1 (encodes GABAB subunit) was downregulated in MHb and LHb neurons, indicating a change in habenular GABAergic transmission in behaviorally experienced NURR2C mice compared to behaviorally experienced GFP mice. Within the MHb, GABAB receptor activation increases excitatory output from the MHb to its main projection region, the interpeduncular nucleus.38 Using pathway enrichment analysis in the genes downregulated in NURR2C MHb neurons, we found enrichment for terms associated with neuronal function such as synaptic organization, signal transduction, and actin cytoskeleton, as well as histone deacetylase binding (Figure 5F). The set of DEGs upregulated in NURR2C in the LHb neurons were enriched for terms related to neuronal activity and neurodevelopment (Figure 5H). Overall, we found that most DEGs were downregulated in NURR2C in the MHb neurons, implying that the dominant negative form of NR4A2 initiates a regulatory cascade leading to the downregulation of many genes in MHb neurons (Figure 5G). Since many of these DEGs were not primary NR4A2 regulatory targets, this analysis highlights the importance of the broader NR4A2 TF regulatory network and other epigenetic mechanisms that are contributing to the molecular and behavioral phenotypes observed in our experiment.
To determine which of the changes to the transcriptome were caused by the NURR2C manipulation and which were a result of the effect of NURR2C on reinstatement of cocaine seeking, we compared the DEGs found between behaviorally naive baseline groups (NURR2C and GFP, Figure 4) to the DEGs found between behaviorally experienced reinstated groups (NURR2C and GFP, Figure 5) and found very little concordance (Figures 5I and 5J). We directly visualized the NURR2C vs. GFP differential expression effect sizes between the behaviorally naive groups and the behaviorally experienced groups and highlighted genes that were concordant in the upper right (upregulated in both) and lower left (downregulated in both) corners of the plot, and we showed genes that were discordant between the analyses in the upper left and lower right corners. This analysis was further stratified by NR4A2 target gene status. Out of the primary NR4A2 target genes, only one gene, Ebf1, was consistently upregulated in NURR2C for both our behaviorally experienced and our behaviorally naive comparisons, and nogenes were consistently downregulated (Figure5I and Tables S5 and S6). The Ebf1 gene codes for the protein early B cell factor 1 (also known as TF COE1), a TF that is typically studied in the context of B cell differentiation,39 and has also been implicated in dopaminergic neuronal development.40 Furthermore, gene set overlap analysis comparing the upregulated and downregulated genes in the MHb and LHb neuron population revealed some small yet statistically significant overlaps, with six of the upregulated genes overlapping (p = 1.1e-11) and four of the downregulated genes overlapping (p = 0.026) in the MHb neurons (Figures 5K and 5L). Additionally, Nr4a2 was the only gene that overlapped in the LHb neuron comparison (Figure 5L), most likely a reflection of Nurr2c expression. Overall this comparative analysis revealed distinctive transcriptional responses in the habenula following NR4A2 manipulation between the behaviorally naive and behaviorally experienced groups, suggesting it is the combined effect of the NURR2C on NR4A2-dependent transcription and animals undergoing reinstatement. This is perhaps not surprising considering reinstatement induces a wave of gene expression that may be necessary for reconsolidation or extinction mechanisms following reinstatement.
Co-expression network analysis of MHb neurons reveals addiction-associated gene modules
Following our analysis of NR4A2-dependent gene expression, we sought to investigate the systems-level transcriptomic changes in MHb neurons induced by expressing Nurr2c. Therefore, we performed gene co-expression network analysis in the MHb neuron population of behaviorally experienced mice to study the cascade of transcriptional changes extending beyond the direct targets of NR4A2 using hdWGCNA (STAR Methods). We represented the network structure of genes with similar expression profiles as a signed topological overlap matrix (TOM) and hierarchically clustered genes in this network to reveal key biological systems and processes involved in MHb neurons. Using this approach, we identified nine co-expression modules (M1–M9; Table S9), and we visualized the network by projecting the TOM into a non-linear manifold using UMAP (Figure 6A). In general, co-expression modules are groups of genes that have similar gene expression profiles across different biological samples or cell populations and are typically functionally related via shared biological pathways or are co-regulated. Highly connected members of co-expression networks, termed ‘‘hub genes,’’ are the core players of critical biological processes, and we visualized the top three module hub genes on the TOM UMAP (Figures 6A and S7). We inspected module eigengenes, a metric summarizing gene expression for an entire co-expression module, in single cells to reveal cell-type patterns of network activity, allowing us to relate these networks and processes to subpopulations of MHb neurons (Figure 6B). Pathway enrichment analysis associated MHb co-expression modules with gene ontology (GO) terms related to addiction, neuroplasticity, GABAergic signaling, and other cellular processes such as ion transport, cell signaling, and lipid processing (Figure 6C and Table S10). Nr4a2 itself is a member of module M1, which contains genes associated with RNA splicing, histone modification, neurodevelopment, and neuronal plasticity (Figures 6A and 6C). Hdac3, which we have previously described as having an important regulatory role with Nr4a2, was identified as a member of module M1, further supporting this relationship. We further characterized these modules by performing differential module eigengene analysis to compare NURR2C and GFP in behaviorally experienced animals (Figures 6D and 6E; STAR Methods). As in our differential expression results of these groups, most of the significant results (adjusted p < 0.05) were for modules downregulated in NURR2C, while modules M7, M8, and M9 were upregulated in specific MHb neuron subpopulations (Figure 6E). Module M6 (nicotine addiction, synaptic function) was the only module that was not differentially expressed between NURR2C and GFP in any of the MHb neuron subpopulations. On the other hand, module M4 (addiction, neurodevelopment, synaptic function and plasticity), which contains hub genes Grin2a and Gabra2, was downregulated in NURR2C for three MHb neuron subpopulations. We next inspected the composition of each gene module for primary and secondary NR4A2 target genes, and we found a significant overlap between primary NR4A2 target genes and all co-expression modules except module M5 (Figure 6F). Together, these analyses implicate the addiction-related module M4 as a downstream regulatory target of NR4A2 that is significantly downregulated in behaviorally experienced NURR2C animals in three MHb neuron populations. Module M8 contains hub genes related to synaptic transmission, including Gabra2, Grin3a, and Grin2a, as well as neuronal support genes including Cntn5, Amph, and Kcnh5.
Figure 6. Co-expression network analysis of MHb neurons reveals addiction-associated gene modules.
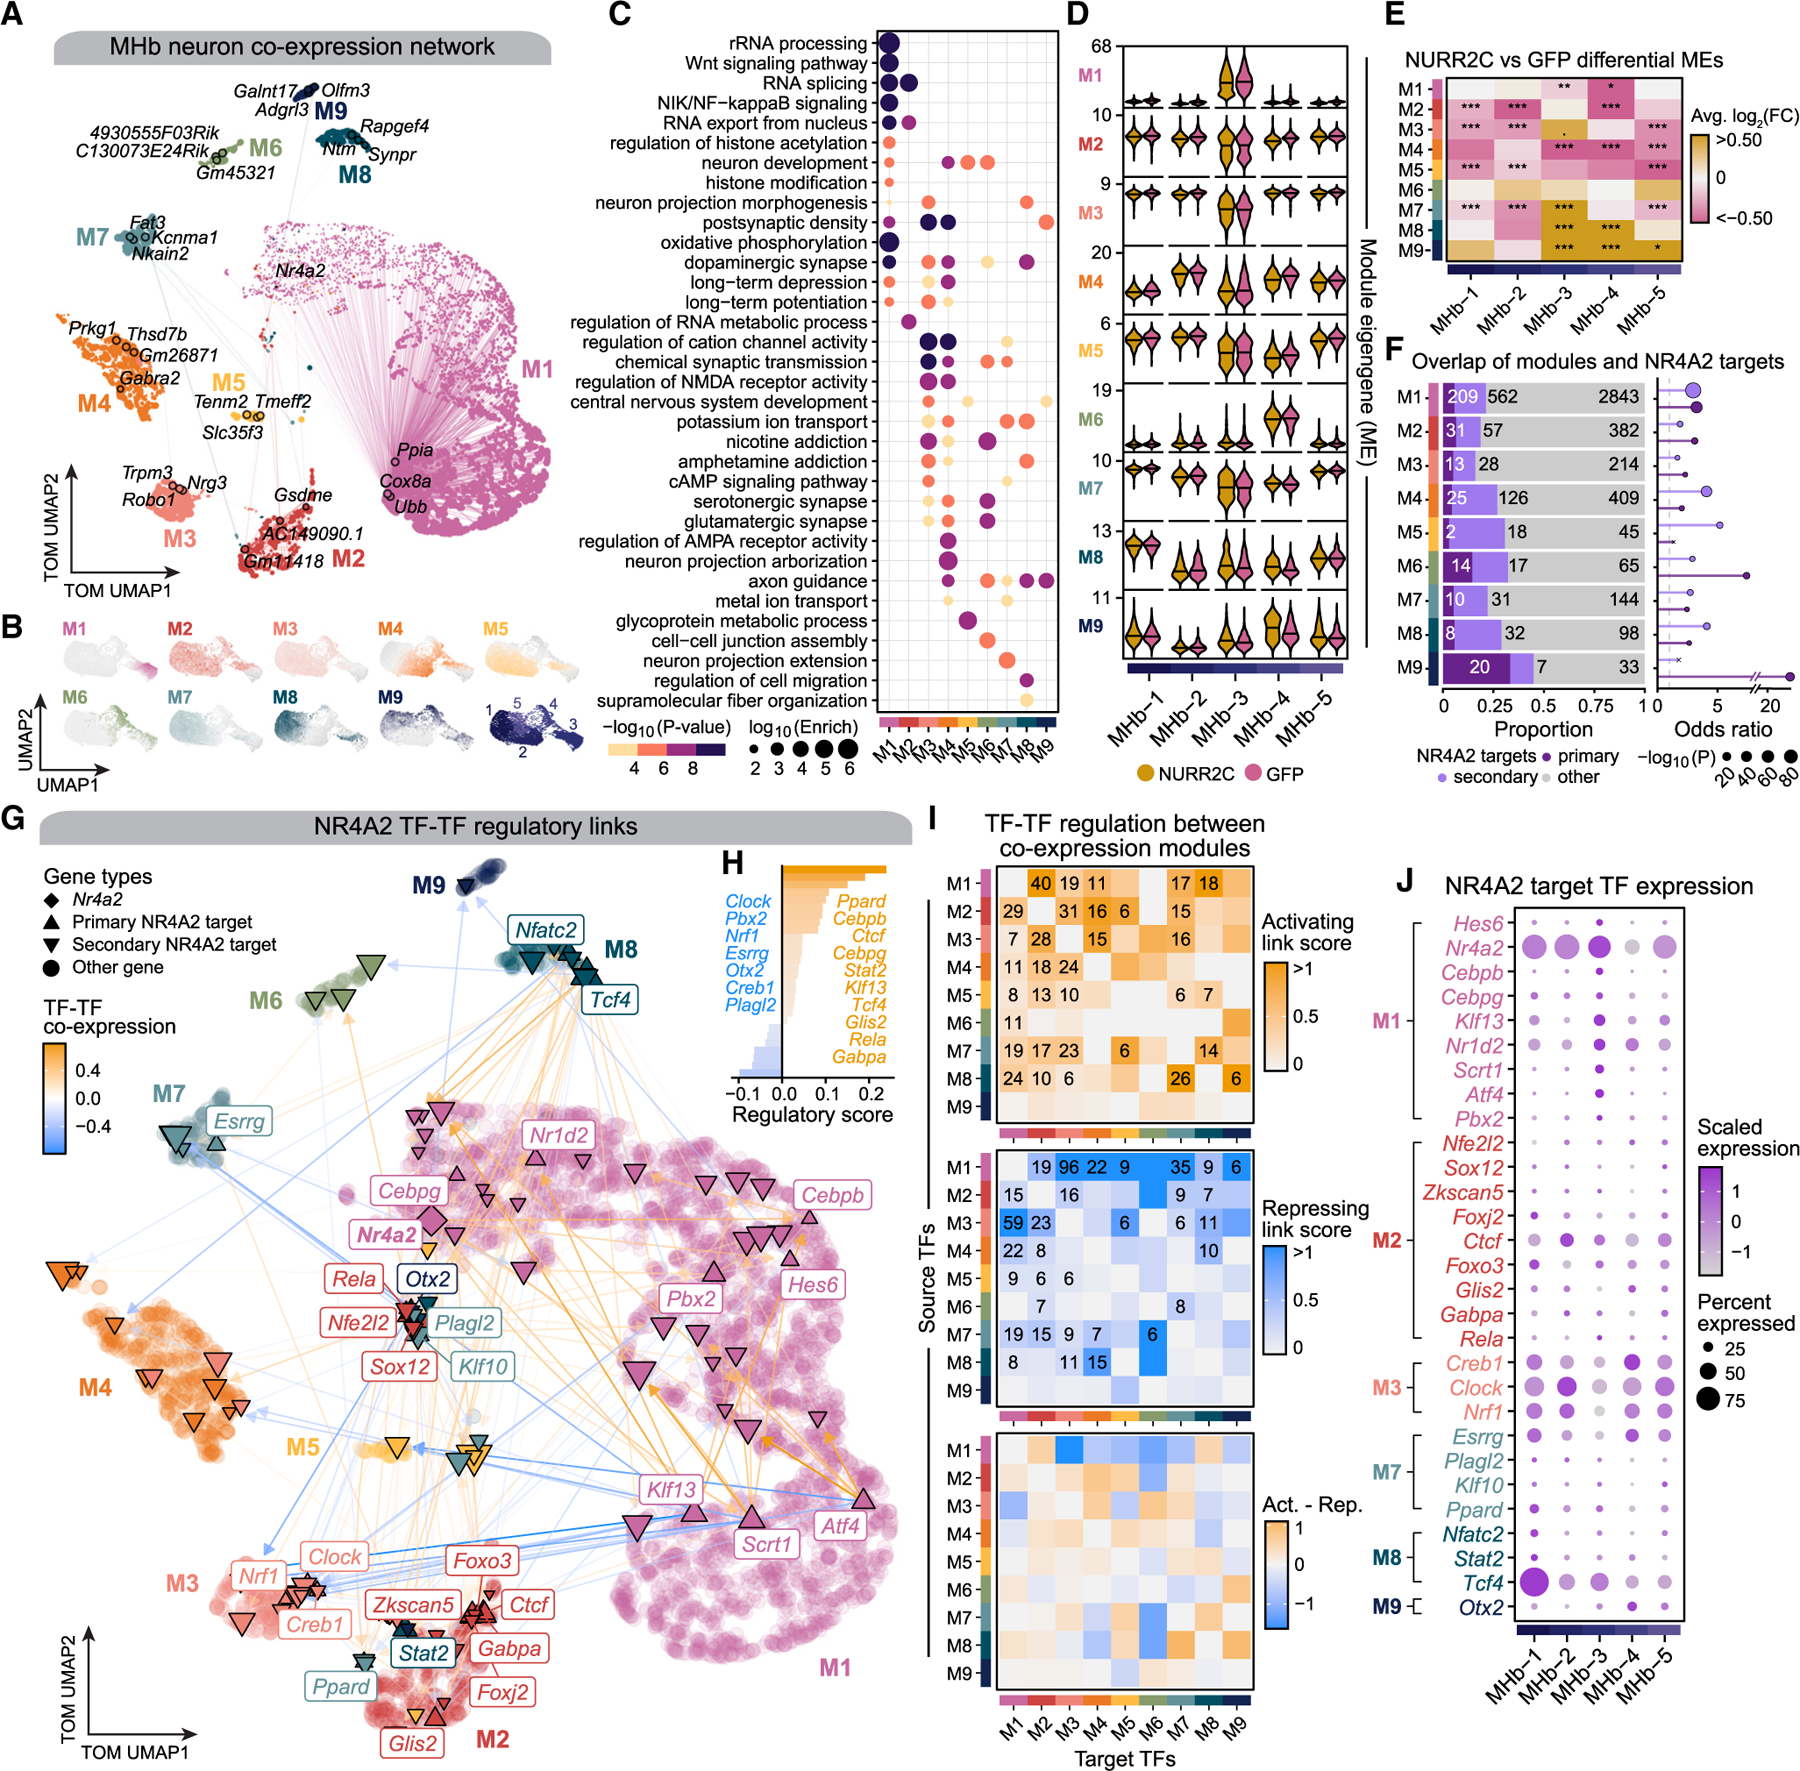
(A) UMAP of the gene co-expression network in MHb neurons from the behaviorally experienced animals. Nodes represent genes, colored by module assignment, and the top three hub genes are annotated for each module as well as other selected genes. Edges represent co-expression relationships (downsampled for visual clarity).
(B) snRNA-seq UMAP plot of the MHb neuron population colored by module eigengene (ME) for each co-expression module. Bottom right UMAP plot shows the same UMAP colored by the five MHb neuron clusters.
(C) Selected GO-term enrichment results for each co-expression module.
(D) Violin plots showing MEs in each MHb neuron cluster, with median values marked with a horizontal line.
(E) Heatmap showing differential module eigengene (DME) results comparing NURR2C vs. GFP for each module in each MHb neuron cluster. Wilcoxon rank-sum test was used for the comparison with Bonferroni p value adjustment: not significant, p > 0.05; *p ≤ 0.05, **p ≤ 0.01, ***p ≤ 0.001, ****p ≤ 0.0001.
(F) Left: bar chart showing the number and proportion of NR4A2 target genes in each module. Right: gene overlap statistics from Fisher’s exact test for modules and NR4A2 targets. 3 denotes p > 0.05.
(G) TF-TF regulatory network showing Nr4a2 and its putative primary and secondary targets in NURR2C MHb neurons, shown on the co-expression UMAP as in (A). Nodes (genes) are colored by module assignment. Edges are directed and represent directed TF-TF regulation. Primary NR4A2 targets are labeled, and outgoing edges from secondary NR4A2 targets are not shown. Non-TF genes are shown in the background.
(H) Bar plot showing the ranking of 29 TF-coding genes that were primary NR4A2 ranked by regulatory scores.
(I) Heatmaps showing TF-TF interaction strength between co-expression modules. Interactions are split between activating and repressing based on the sign of the TF-TF correlations. Bottom heatmap shows the difference between activating and repressing.
(J) Dot plot of scaled gene expression of the 29 primary NR4A2 target TF-coding genes.
We next investigated NR4A2 regulatory targets from the NURR2C MHb neurons in the context of our co-expression modules, paying specific attention to TF-TF regulatory links (STAR Methods). We visualized the genes in the co-expression module UMAP and highlighted NR4A2 and the set of TFs that are primary NR4A2 targets (Figure 6G). This network broadly shows inter- and intramodular regulatory dynamics between TFs, and it shows that some modules (M4, M6, and M9) do not contain any primary NR4A2 targets that are TFs. We ranked each of the TF target genes of NR4A2 by their regulatory importance score and highlighted the top ten TFs whose expression was positively correlated with Nr4a2 and all seven of the TFs whose expression was negatively correlated with Nr4a2 (Figure 6H). We next looked beyond the NR4A2 regulatory network toward all 143 TFs in our co-expression network to study the TF-TF regulatory relationships between different co-expression modules. We counted the number of TF-TF links where the source TF and target TF were assigned to different modules, and we stratified these links by ‘‘activating’’ and ‘‘repressing’’ based on the sign of the TF-TF co-expression. We also normalized these counts to the total number of TFs present in the source module, thereby obtaining activating and repressing link scores that quantify TF-mediated regulatory relationships between co-expression modules (Figure 6I and STAR Methods). Furthermore, we subtracted the activating and repressing regulatory scores to highlight instances where there were greater numbers of activating or repressing TF-TF interactions across modules. This analysis revealed important regulatory signatures, such as a negative feedback loop between modules M1 and M3. In general, this analysis showed that module M1 (containing Nr4a2) had an overall repressing regulatory relationship with six of the other modules (M3, M4, M5, M6, M7, and M9). Furthermore, investigating the gene expression patterns of the primary NR4A2 target TFs revealed signatures specific to MHb neuron subpopulations (Figure 6J).
We next assessed the reproducibility of these co-expression modules by projecting these modules into the Hashikawa et al. habenula snRNA-seq dataset23 and performing module preservation analysis (Figure S7), and these results generally supported the robustness and reproducibility of our analysis in an independent dataset. We also performed a similar module preservation test in MHb neurons from our behaviorally naive mice, and we found that all modules were either moderately or highly preserved (Z-summary preservation >2 and >10, respectively) except module M2. Considering that our other modules were preserved in the Hashikawa dataset and in the behaviorally naive mice, this comparative analysis implicates module M2 as specific to our behaviorally experienced mice. Module M2 was enriched for genes involved in RNA splicing and RNA processing (Figure 6C) and was significantly downregulated in NURR2C in clusters MHb-1, MHb-2, and MHb-4 (Figures 6D and 6E). A previous study of mouse cocaine self-administration identified transcriptome-wide changes in alternative splicing and found a link to enrichment of H3K36Me3 marks at differentially spliced junctions.41 This study established a causal relationship between H3K36Me3 and Srsf11, a gene coding for serine- and arginine-rich splicing factor 11 and a member gene of module M2 in our analysis, to reward behavior by demonstrating increased self-administration after Srsf11 manipulation. In our study here, Srsf11 was significantly upregulated in behaviorally experienced NURR2C animals in MHb neurons with a small effect size (adjusted p = 2.268e-02, log2(fold change) = 0.1326). We also found that nine TFs that were targets of NR4A2 were also members of module M2, including Ctcf. Our TF-TF regulation analysis showed that module M2 had numerous activating TF interactions with addiction-associated modules M3 and M4 as well as the other splicing-associated module M1 (Figures 6G–6I). It is known that alternative splicing in of itself is a regulatory mechanism for mRNA levels with particularly important consequences in neuronal contexts,42 and therefore we reason that module M2 and its constituent genes play a pivotal role in the gene-regulatory landscape of MHb neurons underlying the behavioral changes observed in our experiment. Altogether, this unbiased data-driven analysis identified networks of genes that are critical for MHb neuron identity, associated these networks with their underlying biological functions, and contextualized them in the MHb neurons of our behaviorally experienced NURR2C animals.
DISCUSSION
There is currently no Food and Drug Administration (FDA)-approved drug or treatment for substance use disorder that completely reduces the risk of relapse, encouraging basic science research investigations of the mechanisms that regulate relapse behavior. Therefore, understanding the brain regions and molecular mechanisms underlying relapse in substance use disorder is a perennial question for addiction research. Here, we add further evidence for considering the relatively understudied MHb as a key regulator of drug-seeking behavior with our finding that the MHb regulates relapse to cocaine-seeking behavior and that this regulation seems to be driven by functional NR4A2 within the MHb. Given its dense expression of nicotinic acetylcholine receptors, numerous studies have implicated the MHb in nicotine-associated behaviors.11–13 The MHb is functionally well positioned as a regulator of reward-associated behaviors,13 yet studies investigating MHb response to drugs of abuse at large are lacking. Our findings necessitate consideration of the MHb and NR4A2 as pivotal contributors to drug-seeking behavior.
To understand the molecular mechanisms driving relapse-like behavior in the MHb, we focused on NR4A2, an epigenetically regulated TF and immediate-early gene that is highly expressed in the MHb. Reducing NR4A2 function using an endogenously occurring dominant negative (NURR2C) resulted in a near complete block of cue-induced reinstatement in the gold-standard model of relapse, intravenous cocaine self-administration, used here. These results are supported by our initial finding that MHb Nr4a2 regulates the expression of cocaine-conditioned place preference.14 Our current study extends these findings to a model of volitional drug seeking, lending face validity to the hypothesis that MHb Nr4a2 has a role in relapse behavior.
Advances in sequencing technology enabled consideration of the Nr4a2-dependent transcriptomic changes in this very small region using snRNA-seq. Our snRNA-seq dataset, the largest of its kind to date, demonstrated that Nurr2c altered the expression of many genes in almost all cell types, including several MHb neuron co-expression modules enriched with putative NR4A2-target genes, suggesting that NR4A2 is a key transcriptional regulator of downstream pathways involved in reinstatement. Importantly, we found that DEG signatures had little overlap between our behaviorally naive and experienced mice, indicating a specific response of Nurr2c following their treatment. Despite manipulating Nr4a2 only in MHb ChAT neurons, there are broad changes in gene networks related to addiction, neuroplasticity, and GABAergic signaling that extend across multiple cell types in both the MHb and LHb. The highly relevant nature of the co-expression modules affected, their putative regulatory relationships with Nr4a2 in the broader MHb neuron TF regulatory landscape, and the spread of these transcriptional changes across cell types suggest that MHb Nr4a2 is positioned as an upstream master controller of relapse to cocaine seeking.
Limitations of the study
The experiments described in this paper were conducted in male mice only. This limitation was imposed by the technical difficulty and cost of the experiments. There are documented sex-specific effects in both MHb function and regulation of Nr4a2 by HDAC3 and, thus, investigating the role of MHb Nr4a2 in female relapse behavior is a high priority for our lab. When using short-read Illumina sequencing, different splicing isoforms of the same gene (in this case Nr4a2) are generally not distinguishable, and therefore all transcripts attributed to the Nr4a2 gene including Nurr2c are counted toward the expression of Nr4a2 as a whole. Thus, the increases in Nr4a2 expression (which is Nr4a2 + Nurr2c) found in NURR2C groups were interpreted as the expected Nurr2c expression rather than a paradoxical compensatory increase in Nr4a2 in response to the expression of its dominant negative. Supporting this interpretation, our analysis showed that Nr4a2 is not a putative target of NR4A2 (Table S3), and therefore we did not expect to see homeostatic responses in Nr4a2 expression. Further, we would expect that any changes in Nr4a2 expression resulting from such a homeostatic response would be relatively similar in scale to changes in other DEGs, whereas the changes in Nr4a2 expression in our snRNA-seq analysis are much larger when compared to changes in other genes (Figures 4D and 5E), which is readily explained by viral overexpression of Nurr2c. Additional sequencing experiments could provide further context and clarity for the regulatory role of NR4A2 in the habenula. Single-cell long-read RNA-seq is a promising technology that enables the transcriptome-wide detection of different RNA isoforms with single-cell resolution.43,44 Furthermore, since we found that co-expression modules related to RNA splicing were altered in our behaviorally experienced modules, long-read RNA-seq in MHb neurons could potentially identify alternative splicing events that are critical in reinstatement. Epigenomic assays such as single-cell ATAC-seq could identify additional cell-type-specific NR4A2 regulatory relationships that are mediated by non-coding cis-regulatory elements such as enhancer-promoter interactions.45
As a nuclear orphan receptor and TF, NR4A2 is a promising target for pharmacological manipulation, as there are several compounds already approved by the FDA that putatively affect NR4A family function.17 As we consider applying these compounds toward relapse mitigation, it will be important to develop specific inhibitors that cross the blood-brain barrier and have appropriate kinetics and other determinants. In summary, these results place the MHb as a pivotal regulator of relapse behavior and demonstrate the importance of MHb Nr4a2 as a key mechanism in driving relapse behavior.
STAR★METHODS
RESOURCE AVAILABILITY
Lead contact
Requests for resources, reagents, and further information should be directed to the lead contact, Dr. Marcelo Wood, mwood@uci.edu.
Materials availability
No materials were generated in this study.
Data and code availability
All data included in this paper will be shared upon request by the lead contact. The raw sequencing data and the processed Seurat object for the habenula snRNA-seq dataset have been deposited into the National Center for Biotechnology Information Gene Expression Omnibus under the accession number GSE208081, which is publically accessible.
All code used for data processing and analysis throughout the manuscript is available on GitHub (https://github.com/swaruplabUCI/NURR2C_habenula_2022, https://doi.org/10.5281/zenodo.10638040).
Any additional information required to reanalyze the data reported in this work paper is available from the lead contact upon request.
EXPERIMENTAL MODEL AND STUDY PARTICIPANT DETAILS
Male heterozygous ChAT-Cre mice (2–5 months old, Jackson Laboratories 006410) were then used to model relapse in a mouse self-administration paradigm. Animals were singly housed with free food and water access unless otherwise specified. Experiments were performed during the light cycle of a 12-h light/dark cycle. All experiments were conducted according to the National Institutes of Health guideline for animal care and use. Experiments were approved by the Institutional Animal Care and Use Committee of the University of California, Irvine. Behavior was performed in two cohorts that each included both groups. Littermates were split into both groups. Tissue for sequencing came from both cohorts. To avoid batch effects, all tissue was processed and sequencing at the same time.
METHOD DETAILS
Surgery
Medial habenula AAV infusion
Three weeks before behavior, 0.5 ml bilateral MHb infusions (M/L, ±0.35 mm; A/P, −1.5 mm; D/V; −3.0) of either AAV1-hSyn-DIO-GFP (GFP) or AAV1-hSyn-DIO-V5-NURR2C (NURR2C) were delivered stereotaxically using a 30 gauge Hamilton syringe (65459–01) and syringe pump (Harvard Apparatus Nanomite MA1 70–2217, 6ul/hr).
Jugular vein catheterization
One week before behavior, animals were implanted with an indwelling back-mounted jugular vein catheter for intravenous cocaine self-administration. Catheters were made by attaching silicone tubing (Silastic 508–001 0.30 mm ID, 0.64 mm OD) to a modified 22 gauge cannula (P1 Technologies C313G-5UP). A ‘sleeve’ of larger tubing (Silastic 508–003 0.64 mm ID, 1.19 mm OD) protected the tubing/cannula joint. The catheter base was molded around the cannula with dental cement (Teets Denture Material 223–3815, 223–4052) and mesh was added to the base while silicone glue was used to create a 1 mm ball ~1 cm from the beveled end of the tubing. Made with scissors above the right collarbone over visible pulsing, a ~0.5 cm incision gave access to the jugular vein, which was isolated using blunt dissection and ‘bookmarked’ with suture. The catheter base was implanted in a scalpel-made back incision and the tubing was guided through a subcutaneous tunnel into the neck incision site. After placing a spatula under the vein, a 25 G needle punctured the vein, which was held open with fine tipped forceps. Serrated forceps were used to insert the tubing to the point of the silicone ball, which combined with a series of sutures around the tubing and vein (below the puncture, at the puncture, above the ball) anchored the implant in the neck. Superglue was used on all internal sutures and at the puncture site. During surgery, the cannula was connected to a syringe of flushing solution (heparinized saline, 100 USP/ml in 0.9% saline and enrofloxacin) which prevented air embolism, irrigated the vein, and enabled blood draws to verify placement (dark red, draws easily and continuously). On completion, the cannula was capped, and surgical staples and sutures were used to close the back and front incision sites, respectively. During 5–7 days of recovery catheters were flushed daily to maintain catheter patency, which verified before and after the self-administration period by observing a 5–10 s sedation after infusing the fast-acting anesthetic propofol (propofol sodium, Patterson Vet). After recovery, animals were food restricted to 90% of presurgical weight over 3–4 days before the start of behavior. After a week of daily flushing, animals were extremely well handled.
Cocaine self-administration
Mice animals were allowed to self-administer cocaine in operant conditioning chambers (MedAssociates) in 12 daily 1-h sessions. Most animals acquired self-administration within the first session; otherwise, on the second day (and third if needed) levers were baited with a drop of condensed milk. Failing to acquire self-administration or having a malfunctioning catheter were exclusion criteria. Animals advanced to an FR2 schedule after four days of successful FR1 response, which was defined as at least 10 active lever presses on days three and four. During self-administration, active lever presses elicited a cocaine reward (8.5μg/kg/infusion) and a cue presentation (light/tone). There were no programmed consequences for inactive lever presses. Following self-administration, mice received a 30-day homecage withdrawal followed by a 5-h extinction session in which presses on the previously active lever were not rewarded or cued. Immediately after extinction, a 70 min cued reinstatement was induced with priming during first 10 min, (Figure 1F). During reinstatement presses on the previously active lever resulted in cue presentation but no reward. Self-administration and extinction were analyzed using a two-way repeated measures ANOVA (Prism 10, GraphPad Software Inc.). Reinstatement data were analyzed using a one-way ANOVA. p values < 0.05 were considered significant.
Protein and mRNA expression in MHb
To collect and preserve tissue, animals were euthanized via cervical dislocation (1 h after reinstatement for self-administration mice). Brains were rapidly extracted, flash frozen in dry-ice chilled isopentane, and stored at −80°C for future use.
Immunohistochemistry
To characterize the expression of NURR2C, the V5 tag was visualized using immunohistochemistry. 20 μM coronal sections were made and slide-mounted with a Leica CM 1850 cryostat. Slides were incubated in ice-cold 4% paraformaldehyde for 10 min, followed by 3 PBS rinses and 1 h in block (5% normal goat serum, 0.2% Triton X-100 in 1X PBS). Slides were incubated overnight in primary antibody solution (anti-V5 1:500 in block, Abcam), and then washed and transferred to secondary anti-rabbit (1:250 in block, Alexa Fluor goat anti-rabbit 488) for 1 h at room temperature. A 15-min DAPI (1:10,000 in PB, Invitrogen) incubation was used to provide a nuclear counterstain for slide scanner imaging. Slides were partially dried before being coverslipped (Vectashield) and sealed. Fluorescence images were taken on an Olympus slide scanner at 20× magnification.
In situ hybridization - BaseScope
We performed BaseScope to differentiate and visualize Nr4a2 and Nurr2c mRNA. 10 mM coronal sections were made and slide mounted with a Leica CM 1850 cryostat. Tissue was fixed in 4% PFA for 24 h and then cryoprotected in 10%, 20%, and 30% sucrose solution. We used the BaseScope Duplex Reagent Kit (Advanced Cell Diagnostics) and performed In Situ Hybridization using ZZ probes for Nr4a2 (ACD 1104881-C2) and Nurr2c (proprietary custom probe containing several exons specific to Nurr2c) following the manufacturer’s instructions for fresh frozen tissue. Slides were counterstained with hematoxylin and then coverslipped with VectaMount. Probes were visualized using an Olympus slide scanner.
Single-nucleus RNA-seq in the mouse habenula
Using a 0.5 mm biopsy punch and a dissecting microscope, the bilateral MHb were collected from two 400 μm slabs made on a Leica 1850 CM cryostat. From MHb biopsy punches, single nuclei were isolated on ice using nuclei EZ lysis (Millipore Sigma, Cat# NUC101-1KT) and NWR buffer (supplemented with 0.2U/ml RNase inhibitor) and counted with an automated cell counter (Countess 3 FL Automated Cell Counter). The nuclei were then loaded into the Chromium Next GEM chip G (10X Genomics Chromium Next GEM single cell 3’ Reagent kits v3.1) for GEM generation and barcoding. Following post GEM-RT cleanup and cDNA amplification, 3’ gene expression libraries were constructed, quantified, and sequenced (on the Illumina NovaSeq 6000 system) according to the manufacturer’s instruction.
QUANTIFICATION AND STATISTICAL ANALYSIS
Behavioral data are presented as mean ± SEM. p values < 0.05 were considered significant. Multi-day self-administration and multi-hour extinction data were analyzed using two-way repeated measures ANOVA. Single trial reinstatement data were analyzed using a one-way ANOVA. The details of these analyses can be found in the Figure 1 caption and corresponding results section. These analyses were completed using Prism 10, GraphPad Software Inc. n = number of mice used per group. For snRNAseq analysis, detailed descriptions of the quantification and statistical analysis (including the software, specific statistical tests, thresholds, significant p values etc.) are provided below in this subsection. Where appropriate, N values and p values are defined in the figure legends. For snRNAseq analysis, n = number of samples per group. Samples were not pooled, and therefore each sample = 1 mouse and there were no technical replicates. Error bars = SEM. Any secondary methods used to confirm that data met the assumptions of statistical approach are specified below where used.
Processing single-nucleus RNA-seq data and initial quality control
Cellranger count (v 6.0.0) was used to map snRNA-seq reads to the reference transcriptome (mm10 2020-A, downloaded from the 10X Genomics website) to quantify gene expression in single nuclei from each sample. The ‘‘include-introns’’ option was used to account for unprocessed RNA molecules present in the snRNA-seq data. Ambient RNA signal, which adds can add considerable noise to single-cell transcriptomics data, was identified and corrected using Cellbender46 remove-background (v 0.2.0), a deep generative model designed to identify empty droplets and correct for artifactual counts in single-cell data. The likelihood of a droplet containing more than one cell for all cells in each sample were then computed using Scrublet v 0.2.347 with default settings, giving us a doublet probability and a binary prediction for whether the barcode was a doublet. Each sample was individually loaded into Scanpy v 1.8.1,48 and the samples were concatenated into a single AnnData48 (v 0.7.6) object, totaling 203,729 barcodes and 32,285 genes before quality control filtering. We initially removed barcodes that were in the top 2.5% of the number of UMIs, percentage of mitochondrial counts, and doublet probability for each sample, removing 15,937 barcodes. We then applied dataset-wide filters to remove barcodes with fewer than 250 genes, greater than 5% mitochondrial counts, and greater than 25,000 UMIs, removing 15,530 more barcodes. Predicted doublets from Scrublet were filtered, thereby removing an additional 7,807 barcodes, and leaving 164,455 barcodes for our initial clustering analysis.
Dimensionality reduction, clustering, and additional filtering
The UMI counts matrix was normalized for each cell by the total UMI counts in all genes, and log transformed using the Scanpy functions sc.pp.normalize_total and sc.pp.log1p respectively. Highly variable genes (HVGs) were identified using the Scanpy function sc.pp.highly_variable_genes, and the data matrix comprising these HVGs were scaled to unit variance and centered at zero mean using the sc.pp.scale function. We performed principal component analysis (PCA) in this scaled data matrix using the sc.tl.pca function, yielding a linear dimensionality reduction of the snRNA-seq dataset. PCs were corrected for technical variation from sequencing batches using the Harmony algorithm49 in the harmonypy package (v 0.0.5). The top 30 harmonized PCs were used to construct a neighborhood graph of the nuclei using the sc.pp.neighbors function with a cosine distance metric and n_neighbors = 15. A two-dimensional representation of the data was then computed on this neighborhood graph using the uniform manifold approximation and projection26 (UMAP) algorithm with the Scanpy function sc.tl.umap. We performed an initial clustering analysis grouping nuclei into clusters in the same neighborhood graph representation using the Leiden algorithm25 with the function sc.tl.leiden and a resolution parameter of 2.0. Leiden clusters were organized hierarchically by similar expression profiles using the function sc.tl.dendrogram. We inspected the expression of canonical cell-type markers in each Leiden cluster to annotate broad cell types, and we noted that several Leiden clusters displayed conflicting marker gene expression, for example the expression of Plp1, Aqp4, and Csf1r in the same group. Further, we inspected the distributions of QC metrics in each Leiden cluster and determined that several clusters were outliers in these metrics and we removed these low-quality clusters. We re-computed the UMAP and Leiden clustering (resolution 1.25) for this filtered dataset, and annotated broad cell types using a panel of known cell-type marker genes in the habenula.23,24 We next performed a sub-clustering analysis containing only neuronal cell types (Leiden resolution 0.75) and merged these results with the non-neuronal clusters to result in the final cell type annotations. The final processed dataset consisted of 109,881 single nucleus transcriptomes grouped into 26 clusters.
Ex-vivo activation signature
We examined our dataset for gene expression hallmarks of ex vivo activation, which may indicate issues with sample preparation. For this analysis, we used the CNS ex vivo activation gene set from Marsh et al. 2022.66. (Fos, Junb, Zfp36, Jun, Hspa1a, Socs3, Rgs1, Egr1, Btg2, Fosb, Hist1h1d, Ier5, Atf3, Hist1h2ac, Dusp1, Hist1h1e, Forlr1, and Serpine1), and computed an ex vivo activation score for each cell using UCell50. Broadly, we found minimal evidence of ex vivo activation in our dataset.
Integration with the Hashikawa et al. habenula dataset
We collected the mouse habenula gene expression matrix from Hashikawa et al. 202023 using GEO (GSE137478), and we processed this dataset using the Hao et al. 2021 workflow51 (version 4.1.1). We performed PCA (RunPCA function) using the top 3500 HVGs from the Seurat function FindVariableFeatures, and the top 30 PCs were used to run UMAP (RunUMAP function). Cell-type and cluster annotations for this dataset were taken from the original study. The Hashikawa dataset was integrated with our habenula dataset using integrative non-negative matrix factorization (iNMF) implemented in the R package rliger.52 Prior to running iNMF, the gene expression matrices were scaled to unit variance, but not centered at zero since the integration algorithm relies on a non-negative matrix. We jointly reduced the dimensionality of the scaled expression matrices using 30 matrix factors with the default regularization parameter using the optimizeALS function, yielding an integrated low-dimensional representation of the cells from both datasets. We calculated the alignment of the two datasets in the integrated space using a nearest-neighbor approach to determine how frequently a given cell’s neighbors came from the same dataset with the calcAlignment function, and we report an alignment of 0.7777 on a scale from 0 to 1. Finally, we computed an integrated UMAP using the iNMF representation as input using the Seurat function RunUMAP.
Cluster marker gene analysis
We performed a one-versus-all differential gene expression test for each snRNA-seq cluster to identify cluster marker genes using the Seurat function FindAllMarkers. We used a hurdle model (MAST53) as our differential expression model, which explicitly models zero and non-zero entries separately, making it well suited to sparse single-cell data. We used sequencing batch assignment and total number of UMIs per cell as model covariates. Expression of habenula cell-type and cluster marker genes from previous publications23,24 were also inspected in our dataset.
Alternative splicing analysis at the Nr4a2 locus
While alternative splicing is a feature of many genes, conventional single-cell and single-nucleus RNA-seq on the Illumina platform are generally unable to accurately quantify the expression of individual isoforms of a given gene due to the short length of individual sequencing reads. The Nurr2c isoform of Nr4a2 is marked by alternative splicing events at exons 3 and 7, but is similar in structure to other Nr4a2 isoforms, therefore it is difficult to attribute individual UMI counts to the Nurr2c isoform using current bioinformatic approaches. Nevertheless, we sought to inspect the snRNA-seq read coverage at the Nr4a2 locus in our dataset to potentially identify patterns that were specific to the NURR2C mice. For each of our snRNA-seq clusters, we constructed pseudobulk.bam files containing all the reads from each cell from a given cluster using Sinto (version 0.9.0). SAMtools55 (version 1.1.0) was used to combine pseudobulk.bam files from each individual sample into NURR2C and GFP groups. Pseudobulk.bam files were converted to.bigWig format using the bamCoverage function from deeptools54 (version 3.1.3). Using these.bigwig files, we visualized the Nr4a2 locus in the mm10 genome using the UCSC Genome Browser for the major neuronal cell types and individual clusters. We used Swan56 to summarize the splicing complexity of Nr4a2 and to demonstrate the differences at exon 3 and exon 7 between Nurr2c and the isoform that was most similar (ENSMUST00000112629.7). We used Swan’s plot_graph function to generate the gene summary graph for Nr4a2, and Swan’s plot_transcript_path function to generate the graphs for individual isoforms.
NURR2C transcriptomic perturbation analysis
We performed an unbiased transcriptomic perturbation analysis in the habenula snRNA-seq dataset using the graph signal processing algorithm MELD36 to estimate the transcriptome-wide effect of Nurr2c on each cell. This analysis was performed only in the snRNA-seq data from animals in the behavior group. The MELD python package (version 1.0) was used for this analysis. A 3D PHATE57 representation of the dataset was computed based on the harmonized PCA matrix. We performed a grid search to optimize the MELD parameters k and b using a benchmarking test where transcriptomic perturbations were simulated in the dataset, performing 25 of these tests for each parameter settings. A random conditional density function (PDF) serves as the ground truth for the simulated perturbation, and the mean square error (MSE) computed between the estimated relative likelihood from MELD compared to the ground truth PDF. MSEs were averaged over 25 tests for each set of parameters. Based on this parameter search, we used k = 24 and β = 49 as the set of parameters which achieved the lowest MSE in the simulations. The MELD function was then used with these parameters to quantify the transcriptomic perturbation in our dataset.
Context-specific transcription factor regulatory network inference and analysis
We developed a bioinformatic method for inferring transcription factor (TF) regulatory networks in single-cell or single-nucleus RNA-seq data, and applied this method to our habenula snRNA-seq dataset. The goal of this analysis is to identify potential regulatory links between TFs and their target genes based on patterns observed in a single-cell dataset. In general, the strategy we employed here is similar to other algorithms accomplishing related tasks like the single-cell regulatory network inference and clustering (SCENIC58) algorithm, however our approach is distinguished by several important considerations. Our approach can be broken down into five key steps; 1: compute de-noised metacell expression profiles from the single-cell dataset; 2: scan gene promoters for presence of TF motifs; 3: model gene expression as a function of TF expression; 4: assemble TF regulons and regulatory networks; 5: downstream analysis of TF regulatory networks. TF regulatory regimes may differ between different cell types, cell states, experimental conditions, and other biological variables of interest. Therefore, in our analysis we repeat this network inference process separately for different contexts to facilitate downstream comparisons, as opposed to other network analysis methods that operate on all cell types and conditions grouped together. Here we provide an open source implementation of this TF regulatory network inference algorithm as an addition to the hdWGCNA R package.59
Single-cell gene expression data is inherently sparse, meaning that majority of genes have zero expression in a given cell. Since distinct cell types have unique gene expression programs, we expect that these zero expression genes have a biological origin, but there are also well known ‘‘dropout’’ events where transcripts are missed in the sequencing process ultimately leading to an additional technical origin of zero expressed genes. These problems can be further compounded in snRNA-seq where only the RNA in the nucleus is sequenced, representing only a fraction of the RNA in the whole cell. The sparsity and noise typically found in single-cell data poses significant challenges for robust network inference. Metacell aggregation approaches aim to alleviate this problem by constructing merged transcriptomic profiles of highly similar cells in a k-nearest neighbors (KNN) graph, thereby retaining the transcriptomic heterogeneity of the dataset while reducing sparsity and technical noise. For this analysis, we computed metacells using an algorithm that we previously developed as part of the hdWGCNA59 R package in the MetacellsByGroups function, but in principle other metacell algorithms could be used in its place. This metacell aggregation step is critical for our analysis and is also a strength of our pipeline compared to others.
Second, our algorithm requires a database of TF motifs and their position weight matrices (PWMs). In our analysis, we used the JASPAR motif database.60,61 2020 R package (version 0.99.10), but in principle any other database of TF motifs and PWMs could be used. For each TF in the database, we used the R package motifmatchr (version 1.12.0) to search for significantly matching motifs based on the PWM information within gene promoter regions for all genes in the single-cell dataset, yielding a mapping of TFs to their potential target genes. In principle, enhancer regions linked to target genes via multi-omic analysis could also be used for motif scanning if this additional information is available,67 enabling enhancer-mediated TF regulatory network analysis. We implemented this step in the hdWGCNA function MotifScan.
Third, we use the initial TF-gene mappings to identify highly confident TF-gene regulatory links by modeling each gene’s expression based on the expression of its potential TF regulators. For example, if a given gene called ‘‘Gene X’’ has 10 matching TF motifs in its promoter, we build a regression model of the expression of ‘‘Gene X’’ based on the expression of the 10 matching TFs as input features. To facilitate this modeling, we used a powerful ensemble machine learning approach called extreme gradient boosting (XGBoost62), and for this analysis we performed 5-fold cross validation and averaged the performance statistics across these folds. This analysis assigns a weight to each TF based on how important it was for the model for a particular gene. In this step, we build separate XGBoost models for each gene, resulting in a set of TF regulatory importance weights for each gene. Critically, this approach was done on the de-noised metacell expression representation rather than on the single-cell dataset itself, leading to more robust inference of TF-gene regulatory links. We implemented this step in the hdWGCNA function ConstructTFNetwork.
Fourth, we use the weighted TF importance scores to define ‘‘TF regulons’’, which are the set of confident putative target genes for each TF. Based on the approach from Aibar et al., for each gene we retained the top five TFs by their weights, with a minimum threshold of 0.001, to define regulons for each TF. For certain downstream analyses like pathway enrichment analysis, we used a wider set of TF regulons by retaining the top ten TFs by weight for each gene. The sets of regulons were then split based on the sign of the Pearson correlations between the metacell expression of the TF and the target gene, giving us putative activated targets (positive TF-gene correlation) and putative repressed targets (negative TF-gene correlation). This process yields weighted links between TFs and confident target genes, ultimately representing a full TF regulatory network. Since we perform this analysis separately for different contexts (cell types, experimental groups), and since these contexts can be flexibly defined by the user, this approach is able to identify TF regulatory relationships that are unique to a condition of interest or conserved across multiple groups/conditions. In our analysis, we used this approach to construct TF regulatory networks for the MHb and LHb neuron groups for the four experimental groups (NURR2C, GFP, Naive NURR2C, Naive GFP).
After performing TF regulatory network inference, we performed several downstream analyses focusing on subgraphs within these networks that were important for understanding the regulatory capacity of NR4A2. We computed NR4A2 regulon scores, summarizing the gene expression of the entire set of genes within the NR4A2 regulon, using the UCell algorithm.50 We performed pathway enrichment analysis using the R package enrichR63 (version 3.0) in the putative activating and repressing target genes in the networks from MHb neurons in the NURR2C and Naive NURR2C experimental groups, using the following gene annotation lists: GO Biological Process 2021, GO Cellular Component 2021, GO Molecular Function 2021, WikiPathways 2019 Mouse, and KEGG 2019 Mouse.
Finally, as part of our TF regulatory network analysis pipeline we developed a recursive approach to identify indirect TF targets that are part of the overall network. TFs can regulate the expression of other TFs, which can thereby impart meaningful yet indirect changes on the expression of genes outside of the TF’s primary regulon of direct targets where the TF acts through gene promoters. For a given TF of interest, in our case NR4A2, we identified the primary target genes in that TF’s regulon which are also TFs. The set of target genes of those TFs are then considered secondary targets of NR4A2. This process can be arbitrarily repeated to identify tertiary targets and so on, but in our study of NR4A2 we only used this approach to define secondary targets.
Differential gene expression comparing NURR2C and GFP. We performed differential gene expression analysis comparing cells from NURR2C and GFP animals within each cell cluster and each major cell type. We used MAST53 as our differential expression model, with sequencing batch assignment and total number of UMIs per cell as model covariates. The Seurat function FindMarkers was used to facilitate this analysis. This differential expression analysis comparing NURR2C and GFP was performed separately for the behavior and naive experimental groups. We compared the results of these DEG tests between the MHb and LHb neuronal cell types by performing rank-rank hypergeometric overlap (RRHO64) tests for each pair of neuron types, repeating the analysis for NR4A2 target genes and other DEGs. For RRHO analysis, genes were ranked by average log2(fold change), and we visualized the FDR-corrected RRHO p values as a heatmap to visualize the agreement of gene sets ranked by the DEG effect size. In the RRHO heatmaps, genes are ranked from high to low log2(fold change) from left to right on the x axis and from bottom to top on the y axis, such that the lower left quadrant shows the agreement of up-regulated genes while the upper-right quadrant shows the agreement of down-regulated genes. Similarly, we generated scatterplots comparing the DEG effect sizes for the NURR2C vs. GFP comparisons between the behavior and naive groups, and we also performed gene set overlap analysis to compare significantly up- and downregulated DEGs within these groups (adjusted p value <0.05 and absolute log2(fold change) > 0.25). We used the R package enrichR63 (version 3.0) to perform enrichment analysis for the DEGs in each cluster, using the following gene annotation lists: GO Biological Process 2021, GO Cellular Component 2021, GO Molecular Function 2021, WikiPathways 2019 Mouse, and KEGG 2019 Mouse.
Co-expression network analysis in medial habenula neurons
We performed gene co-expression network analysis in medial habenula neurons from the NURR2C and GFP experimental groups using the R package hdWGCNA68,65 (version 0.1.1, WGCNA version 1.70.3). Genes expressed in fewer than 5% of cells were excluded from this analysis, giving us a set of 10,084 genes for hdWGCNA. For each cell type and biological replicate, we performed a bootstrapped cell aggregation procedure to construct metacell gene expression profiles, pooling 50 cells together per metacell based on K-nearest-neighbors using the hdWGCNA function MetacellsByGroups. We sought to select a soft power threshold β such that the resulting network has a scale-free topology, therefore we performed a parameter sweep for β using the hdWGCNA function TestSoftPowers. We computed a topological overlap matrix (TOM) to represent the gene co-expression network and grouped genes into co-expression modules with the Dynamic Tree Cut. algorithm69 using the hdWGCNA function ConstructNetwork. The following parameters were used during network construction: networkType = “signed”, TOMType = “signed”, soft_power = 6, deepSplit = 4, detectCutHeight = 0.995, minModuleSize = 50, mergeCutHeight = 0.2. To summarize the gene expression of each co-expression network module, we computed module eigengenes (MEs) with the hdWGCNA function ModuleEigengenes, applying Harmony49 to the resulting MEs based on sequencing batch assignment. Eigengene-based connectivity (kME) was then computed for each gene and each module using the hdWGCNA function ModuleConnectivity, allowing us to identify hub genes for each module. A UMAP representation of the co-expression network was constructed with the hdWGCNA function RunModuleUMAP, with ten hub genes per module as the input features. We performed differential module eigengene (DME) testing to compare the expression signatures of each module between the NURR2C and GFP groups within each of the five MHb neuron clusters. DME testing was performed using the hdWGCNA function FindDMEs, using a Wilcoxon rank-sum test for the comparison. To assess the reproducibility of the medial habenula neuron co-expression network, we performed a comparative analysis using the Hashikawa et al.23 dataset. Co-expression modules were projected into the Hashikawa dataset using the hdWGCNA function ProjectModules, and we performed a statistical test to assess network preservation69 using the hdWGCNA function ModulePreservation. We used the R package enrichR63 (version 3.0) to perform enrichment analysis comparing our MHb neuron co-expression modules to curated gene sets, using the following gene annotation lists: GO Biological Process 2021, GO Cellular Component 2021, GO Molecular Function 2021, WikiPathways 2019 Mouse, and KEGG 2019 Mouse. We also integrated the TF regulatory network information with the co-expression network information. We counted the number of activating and repressing TF-gene links that span across different co-expression modules to quantify the regulatory relationships between co-expression modules. We also computed normalized module regulatory strength by dividing the number of TF-gene links between a source module and a target module by the total number of TFs within the source module.
Gene overlap analysis
Throughout this manuscript, we performed overlap analyses to compare different sets of genes. We used the R package GeneOverlap (version 1.26.0) for these analyses, which calculates the overlap between sets of genes, using Fisher’s exact test to determine a p value and odds ratio comparing to the genomic background set (all genes in the Seurat object).
Supplementary Material
KEY RESOURCES TABLE
| REAGENT or RESOURCE | SOURCE | IDENTIFIER |
|---|---|---|
| Antibodies | ||
|
| ||
| Anti-V5 | Abcam | ab206566; RRID:AB_2819156 |
| Goat Anti-Rabbit Alexa Fluor 488 | Abcam | ab150077; RRID:AB_2630356 |
|
| ||
| Bacterial and virus strains | ||
|
| ||
| AAV1-hSyn-DIO-GFP | a gift from Bryan Roth, unpublished | Addgene 50457-AAV1 |
| AAV1-hSyn-DIO-V5-NURR2C | UCI CNCM Viral Core | MW174 |
|
| ||
| Chemicals, peptides, and recombinant proteins | ||
|
| ||
| Cocaine-HCl | Sigma-Aldrich | C5776 |
| Antifade mounting medium | Vectashield | H-1400 |
| DAPI | Invitrogen | D1306 |
| Propofol sodium | Patterson Vet | 07-892-9787 |
|
| ||
| Critical commercial assays | ||
|
| ||
| Nuclei Isolation Kit: Nuclei EZ Prep | Millipore Sigma | NUC101-1KT |
| Chromium Next GEM single cell 3’ Reagent kits v3.1 | 10X Genomics | PN-1000127 |
| BaseScope Duplex Reagent Kit | ACD Bio-Techne | 323800 |
|
| ||
| Deposited data | ||
|
| ||
| Raw snRNAseq data and Seurat object | This study | https://www.ncbi.nlm.nih.gov/geo/query/ acc.cgi?acc=GSE208081 |
|
| ||
| Experimental models: Organisms/strains | ||
|
| ||
| Mouse: ChAT-IRES-Cre | The Jackson Laboratory | IMSR_JAX:006410 |
|
| ||
| Oligonucleuotides | ||
|
| ||
| BaseScope Probe BA-Mm-nurr2c-2zz-C1 | ACD Bio-Techne | 1104981-C1 |
| BaseScope Probe BA-Mm-Nr4a2-3zz-st-C2 | ACD Bio-Techne | 1104881-C2 |
|
| ||
| Software and algorithms | ||
|
| ||
| Cellranger count (v 6.0.0) | 10X Genomics | N/A |
| CellBender | Fleming et al.46 | https://doi.org/10.1038/s41592-023-01943-7 |
| Scrublet | Wolock et al.47 | https://doi.org/10.1016/J.CELS.2018.11.005. |
| SCANPY and Anndata | Wolf et al.48 | https://doi.org/10.1186/S13059-017-1382-0/FIGURES/1 |
| Harmony | Korsunsky et al.49 | https://doi.org/10.1038/s41592-019-0619-0 |
| UCell | Andreatta et al.50 | https://doi.org/10.1016/J.CSBJ.2021.06.043 |
| Seurat v4 | Hao et al.51 | https://doi.org/10.1016/J.CELL.2021.04.048 |
| rliger | Welch et al.52 | https://doi.org/10.1016/J.CELL.2019.05.006 |
| MAST | Finak et al.53 | https://doi.org/10.1186/S13059-015-0844-5/FIGURES/6 |
| deepTools2 | Ramírez et al.54 | https://doi.org/10.1093/NAR/GKW257 |
| Sinto | Python Preferred Installer Program | https://github.com/timoast/sinto |
| SAMtools | Li et al.55 | https://doi.org/10.1093/BIOINFORMATICS/BTP352 |
| Swan | Reese et al.56 | https://doi.org/10.1093/BIOINFORMATICS/BTAA836 |
| PHATE | Moon et al.57 | https://doi.org/10.1038/s41587-019-0336-3 |
| SCENIC | Aibar et al.58 | https://doi.org/10.1038/nmeth.4463 |
| hdWGCNA | Morabito et al.59 | https://doi.org/10.1016/J.CRMETH.2023.100498 |
| JASPAR 2020 | Fornes et al.60 | https://doi.org/10.1093/NAR/GKZ1001 |
| JASPAR | Sandelin et al.61 | https://doi.org/10.1093/NAR/GKH012 |
| XGBoost | Chen et al.62 | https://doi.org/10.1145/2939672 |
| Enrichr | Chen et al.63 | https://doi.org/10.1186/1471-2105-14-128/FIGURES/3 |
| RRHO | Plaiser et al.64 | https://doi.org/10.1093/NAR/GKQ636 |
| WGCNA | Langfelder et al.65 | https://doi.org/10.1186/1471-2105-9-559/FIGURES/4 |
| GeneOverlap | https://doi.org/10.18129/B9.bioc.GeneOverlap | RRID:SCR_018419 |
| This study |
https://doi.org/10.5281/zenodo.10638040
https://github.com/swaruplabUCI/NURR2C_habenula_2022 |
|
| R (version 4.0.0) | r-project.org | N/A |
| Prism | GrpahPad Inc. | N/A |
| MedPCV | Med-Associates | N/A |
| BioRender | BioRender | N/A |
|
| ||
| Other | ||
|
| ||
| 30 gauge Hamilton syringe | Hamilton Company | 65459-01 |
| Nanomite syringe pump | Harvard Apparatus | MA1 70-2217 |
| 22 gauge cannula | P1 Technologies | C313G-5UP |
| Silicone tubing (001 0.30 mm ID, 0.64 mm OD) | Silastic | 508-001 |
| Silicone tubing (0.64 mm ID, 1.19 mm OD) | Silastic | 508-003 |
| Dental cement | Teets Denture Material | 223-3815, 223-4052 |
| Cryostat | Leica | 1850 CM |
| Operant conditioning chambers | MedAssociates | ENV-307A-CT, ENV-022MD, PHM-100 |
| Countess™ 3 FL Automated Cell Counter | Fisher | AMQAF2000 |
| Illumina NovaSeq 6000 | Illumina | N/A |
| Olympus slide scanner | Olympus | VSBX61 |
Highlights.
Medial habenula NR4A2 regulates relapse to cocaine seeking in mice
NR4A2 is a major upstream regulator of many genes within the medial habenula
Identification of putative NR4A2 targets and regulatory networks
ACKNOWLEDGMENTS
Funding for this work was provided by UCI startup funds, NIA grant 1RF1AG071683 and Adelson Medical Research Foundation funds to V.S., NIDA grants R01DA047441, R01DA047981, and U01DA053826 to M.A.W., and NIDA fellowship F32 DA055438 and support from the George E. Hewitt Foundation to J.E.C. We would like to thank UCI’s Genomic High Throughput Facility for providing their facilities and sequencing our single-nucleus RNA-seq libraries. Graphical abstract and components of Figure 1 were generated using BioRender.
Footnotes
SUPPLEMENTAL INFORMATION
Supplemental information can be found online at https://doi.org/10.1016/j.celrep.2024.113956.
DECLARATION OF INTERESTS
The authors declare no competing interests.
REFERENCES
- 1.McQuown SC, Barrett RM, Matheos DP, Post RJ, Rogge GA, Alenghat T, Mullican SE, Jones S, Rusche JR, Lazar MA, and Wood MA (2011). HDAC3 is a critical negative regulator of long-term memory formation. J. Neurosci. 31, 764–774. 10.1523/JNEUROSCI.5052-10.2011. [DOI] [PMC free article] [PubMed] [Google Scholar]
- 2.Rogge GA, Singh H, Dang R, and Wood MA (2013). HDAC3 Is a Negative Regulator of Cocaine-Context-Associated Memory Formation. J. Neurosci. 33, 6623–6632. 10.1523/JNEUROSCI.4472-12.2013. [DOI] [PMC free article] [PubMed] [Google Scholar]
- 3.Hawk JD, and Abel T (2011). The role of NR4A transcription factors in memory formation. Brain Res. Bull. 85, 21–29. 10.1016/J.BRAINRESBULL.2011.02.001. [DOI] [PMC free article] [PubMed] [Google Scholar]
- 4.Matheos DP, and Wood MA (2020). NR4A Transcription Factor Family: Key Regulators of Memory Formation. In The Oxford Handbook of the Neurobiology of Learning and Memory., Carew TJ, ed. 10.1093/OXFORDHB/9780190069162.013.10. [DOI] [Google Scholar]
- 5.Saucedo-Cardenas O, Quintana-Hau JD, Le WD, Smidt MP, Cox JJ, De Mayo F, Burbach JP, and Conneely OM (1998). Nurr1 is essential for the induction of the dopaminergic phenotype and the survival of ventral mesencephalic late dopaminergic precursor neurons. Proc. Natl. Acad. Sci. USA 95, 4013–4018. 10.1073/PNAS.95.7.4013. [DOI] [PMC free article] [PubMed] [Google Scholar]
- 6.Galleguillos D, Fuentealba JA, Gómez LM, Saver M, Gómez A, Nash K, Burger C, Gysling K, and Andrés ME (2010). Nurr1 regulates RET expression in dopamine neurons of adult rat midbrain. J. Neurochem. 114, 1158–1167. 10.1111/J.1471-4159.2010.06841.X. [DOI] [PubMed] [Google Scholar]
- 7.Wallén Å, Castro DS, Zetterström RH, Karlén M, Olson L, Ericson J, and Perlmann T (2001). Orphan nuclear receptor Nurr1 is essential for Ret expression in midbrain dopamine neurons and in the brain stem. Mol. Cell. Neurosci. 18, 649–663. 10.1006/mcne.2001.1057. [DOI] [PubMed] [Google Scholar]
- 8.Perlmann T, and Wallén-Mackenzie A (2004). Nurr1, an orphan nuclear receptor with essential functions in developing dopamine cells. Cell Tissue Res. 318, 45–52. 10.1007/S00441-004-0974-7/FIGURES/1. [DOI] [PubMed] [Google Scholar]
- 9.Smits SM, Ponnio T, Conneely OM, Burbach JPH, and Smidt MP (2003). Involvement of Nurr1 in specifying the neurotransmitter identity of ventral midbrain dopaminergic neurons. Eur. J. Neurosci. 18, 1731–1738. 10.1046/J.1460-9568.2003.02885.X. [DOI] [PubMed] [Google Scholar]
- 10.Quina LA, Wang S, Ng L, and Turner EE (2009). Brn3a and Nurr1 mediate a gene regulatory pathway for habenula development. J. Neurosci. 29, 14309–14322. 10.1523/JNEUROSCI.2430-09.2009. [DOI] [PMC free article] [PubMed] [Google Scholar]
- 11.Fowler CD, Lu Q, Johnson PM, Marks MJ, and Kenny PJ (2011). Habenular a5 nicotinic receptor subunit signalling controls nicotine intake. Nature 471, 597–601. 10.1038/nature09797. [DOI] [PMC free article] [PubMed] [Google Scholar]
- 12.Salas R, Sturm R, Boulter J, and De Biasi M (2009). Nicotinic Receptors in the Habenulo-Interpeduncular System Are Necessary for Nicotine Withdrawal in Mice. J. Neurosci. 29, 3014–3018. 10.1523/JNEUROSCI.4934-08.2009. [DOI] [PMC free article] [PubMed] [Google Scholar]
- 13.Mathis V, and Kenny PJ (2019). From controlled to compulsive drug-taking: The role of the habenula in addiction. Neurosci. Biobehav. Rev. 106, 102–111. 10.1016/J.NEUBIOREV.2018.06.018. [DOI] [PMC free article] [PubMed] [Google Scholar]
- 14.López AJ, Hemstedt TJ, Jia Y, Hwang PH, Campbell RR, Kwapis JL, White AO, Chitnis O, Scarfone VM, Matheos DP, et al. (2019). Epigenetic regulation of immediate-early gene Nr4a2/Nurr1 in the medial habenula during reinstatement of cocaine-associated behavior. Neuropharmacology 153, 13–19. 10.1016/J.NEUROPHARM.2019.04.016. [DOI] [PMC free article] [PubMed] [Google Scholar]
- 15.O’Connor EC, Chapman K, Butler P, and Mead AN (2011). The predictive validity of the rat self-administration model for abuse liability. Neurosci. Biobehav. Rev. 35, 912–938. 10.1016/J.NEUBIOREV.2010.10.012. [DOI] [PubMed] [Google Scholar]
- 16.Green TA, and Bardo MT (2020). Opposite regulation of conditioned place preference and intravenous drug self-administration in rodent models: Motivational and non-motivational examples. Neurosci. Biobehav. Rev. 116, 89–98. 10.1016/J.NEUBIOREV.2020.06.006. [DOI] [PMC free article] [PubMed] [Google Scholar]
- 17.Komiya T, Yamamoto S, Roy A, McDonald P, and Perez RP (2017). Drug screening to target nuclear orphan receptor NR4A2 for cancer therapeutics. Transl. Lung Cancer Res. 6, 600–610. 10.21037/TLCR.2017.07.02. [DOI] [PMC free article] [PubMed] [Google Scholar]
- 18.Willems S, Zaienne D, and Merk D (2021). Targeting Nuclear Receptors in Neurodegeneration and Neuroinflammation. J. Med. Chem. 64, 9592–9638. 10.1021/ACS.JMEDCHEM.1C00186/ASSET/IMAGES/LARGE/JM1C00186_0018.JPEG. [DOI] [PubMed] [Google Scholar]
- 19.Nugent AL, Anderson EM, Larson EB, and Self DW (2017). Incubation of cue-induced reinstatement of cocaine, but not sucrose, seeking in C57BL/6J mice. Pharmacol. Biochem. Behav. 159, 12–17. 10.1016/J.PBB.2017.06.017. [DOI] [PMC free article] [PubMed] [Google Scholar]
- 20.Chandra R, Francis TC, Konkalmatt P, Amgalan A, Gancarz AM, Dietz DM, and Lobo MK (2015). Opposing Role for Egr3 in Nucleus Accumbens Cell Subtypes in Cocaine Action. J. Neurosci. 35, 7927–7937. 10.1523/JNEUROSCI.0548-15.2015. [DOI] [PMC free article] [PubMed] [Google Scholar]
- 21.Campbell RR, Kramár EA, Pham L, Beardwood JH, Augustynski AS, López AJ, Chitnis OS, Delima G, Banihani J, Matheos DP, and Wood MA (2021). HDAC3 Activity within the Nucleus Accumbens Regulates Cocaine-Induced Plasticity and Behavior in a Cell-Type-Specific Manner. J. Neurosci. 41, 2814–2827. 10.1523/JNEUROSCI.2829-20.2021. [DOI] [PMC free article] [PubMed] [Google Scholar]
- 22.Michelhaugh SK, Vaitkevicius H, Wang J, Bouhamdan M, Krieg AR, Walker JL, Mendiratta V, and Bannon MJ (2005). Dopamine neurons express multiple isoforms of the nuclear receptor nurr1 with diminished transcriptional activity. J. Neurochem. 95, 1342–1350. 10.1111/j.1471-4159.2005.03458.x. [DOI] [PubMed] [Google Scholar]
- 23.Hashikawa Y, Hashikawa K, Rossi MA, Basiri ML, Liu Y, Johnston NL, Ahmad OR, and Stuber GD (2020). Transcriptional and Spatial Resolution of Cell Types in the Mammalian Habenula. Neuron 106, 743–758.e5. 10.1016/j.neuron.2020.03.011. [DOI] [PMC free article] [PubMed] [Google Scholar]
- 24.Wallace ML, Huang KW, Hochbaum D, Hyun M, Radeljic G, and Sabatini BL (2020). Anatomical and single-cell transcriptional profiling of the murine habenular complex. Elife 9, e51271. 10.7554/eLife.51271. [DOI] [PMC free article] [PubMed] [Google Scholar]
- 25.Traag VA, Waltman L, and van Eck NJ (2019). From Louvain to Leiden: guaranteeing well-connected communities. Sci. Rep. 9, 5233–5312, 2019. 10.1038/s41598-019-41695-z. [DOI] [PMC free article] [PubMed] [Google Scholar]
- 26.McInnes L, Healy J, and Melville J (2018). UMAP: Uniform Manifold Approximation and Projection for Dimension Reduction. Preprint at arxiv. 10.48550/arXiv.1802.03426. [DOI] [Google Scholar]
- 27.Callaway EM, Dong HW, Ecker JR, Hawrylycz MJ, Huang ZJ, Lein ES, Ngai J, Osten P, Ren B, Tolias AS, et al. (2021). A multi-modal cell census and atlas of the mammalian primary motor cortex. Nat 598, 86–102. 10.1038/s41586-021-03950-0. [DOI] [PMC free article] [PubMed] [Google Scholar]
- 28.Kim S, Yu NK, and Kaang BK (2015). CTCF as a multifunctional protein in genome regulation and gene expression. Exp. Mol. Med. 47, e166. 10.1038/emm.2015.33. [DOI] [PMC free article] [PubMed] [Google Scholar]
- 29.Ong CT, and Corces VG (2014). CTCF: an architectural protein bridging genome topology and function. Nat. Rev. Genet. 15, 234–246. 10.1038/nrg3663. [DOI] [PMC free article] [PubMed] [Google Scholar]
- 30.Teixeira JR, Szeto RA, Carvalho VMA, Muotri AR, and Papes F (2021). Transcription factor 4 and its association with psychiatric disorders. Transl. Psychiatry 11, 19–12. 10.1038/s41398-020-01138-0. [DOI] [PMC free article] [PubMed] [Google Scholar]
- 31.Forrest MP, Hill MJ, Kavanagh DH, Tansey KE, Waite AJ, and Blake DJ (2018). The Psychiatric Risk Gene Transcription Factor 4 (TCF4) Regulates Neurodevelopmental Pathways Associated With Schizophrenia, Autism, and Intellectual Disability. Schizophr. Bull. 44, 1100–1110. 10.1093/SCHBUL/SBX164. [DOI] [PMC free article] [PubMed] [Google Scholar]
- 32.Mesman S, Bakker R, and Smidt MP (2020). Tcf4 is required for correct brain development during embryogenesis. Mol. Cell. Neurosci. 106, 103502. 10.1016/J.MCN.2020.103502. [DOI] [PubMed] [Google Scholar]
- 33.Sarkar D, Shariq M, Dwivedi D, Krishnan N, Naumann R, Bhalla US, and Ghosh HS (2021). Adult brain neurons require continual expression of the schizophrenia-risk gene Tcf4 for structural and functional integrity. Transl. Psychiatry 11, 494–511. 10.1038/s41398-021-01618-x. [DOI] [PMC free article] [PubMed] [Google Scholar]
- 34.Di Giacomo E, Benedetti E, Cristiano L, Antonosante A, d’Angelo M, Fidoamore A, Barone D, Moreno S, Ippoliti R, Cerù MP, et al. (2017). Roles of PPAR transcription factors in the energetic metabolic switch occurring during adult neurogenesis. Cell Cycle 16, 59–72. 10.1080/15384101.2016.1252881. [DOI] [PMC free article] [PubMed] [Google Scholar]
- 35.Johnson C, Drgon T, Walther D, and Uhl GR (2011). Genomic regions identified by overlapping clusters of nominally-positive SNPs from genome-wide studies of alcohol and illegal substance dependence. PLoS One 6, e19210. 10.1371/JOURNAL.PONE.0019210. [DOI] [PMC free article] [PubMed] [Google Scholar]
- 36.Burkhardt DB, Stanley JS, Tong A, Perdigoto AL, Gigante SA, Herold KC, Wolf G, Giraldez AJ, van Dijk D, and Krishnaswamy S (2021). Quantifying the effect of experimental perturbations at single-cell resolution. Nat. Biotechnol. 39, 619–629. 10.1038/s41587-020-00803-5. [DOI] [PMC free article] [PubMed] [Google Scholar]
- 37.Kim U, and Chang SY (2005). Dendritic morphology, local circuitry, and intrinsic electrophysiology of neurons in the rat medial and lateral habenular nuclei of the epithalamus. J. Comp. Neurol. 483, 236–250. 10.1002/CNE.20410. [DOI] [PubMed] [Google Scholar]
- 38.Zhang J, Tan L, Ren Y, Liang J, Lin R, Feng Q, Zhou J, Hu F, Ren J, Wei C, et al. (2016). Presynaptic Excitation via GABAB Receptors in Habenula Cholinergic Neurons Regulates Fear Memory Expression. Cell 166, 716–728. 10.1016/J.CELL.2016.06.026. [DOI] [PubMed] [Google Scholar]
- 39.Liang Y, Sharma D, Wang B, Wang H, Feng X, Ma R, Berkman T, Char S, Bekker A, and Tao YX (2024). Transcription factor EBF1 mitigates neuropathic pain by rescuing Kv1.2 expression in primary sensory neurons. Transl. Res. 263, 15–27. 10.1016/J.TRSL.2023.08.002. [DOI] [PMC free article] [PubMed] [Google Scholar]
- 40.Yin M, Liu S, Yin Y, Li S, Li Z, Wu X, Zhang B, Ang SL, Ding Y, and Zhou J (2009). Ventral mesencephalon-enriched genes that regulate the development of dopaminergic neurons in vivo. J. Neurosci. 29, 5170–5182. 10.1523/JNEUROSCI.5569-08.2009. [DOI] [PMC free article] [PubMed] [Google Scholar]
- 41.Xu SJ, Lombroso SI, Fischer DK, Carpenter MD, Marchione DM, Hamilton PJ, Lim CJ, Neve RL, Garcia BA, Wimmer ME, et al. (2021). Chromatin-mediated alternative splicing regulates cocaine-reward behavior. Neuron 109, 2943–2966.e8. 10.1016/J.NEURON.2021.08.008. [DOI] [PMC free article] [PubMed] [Google Scholar]
- 42.Su CH, Dhananjaya D, and Tarn WY (2018). Alternative splicing in neurogenesis and brain development. Front. Mol. Biosci. 5, 331482. 10.3389/FMOLB.2018.00012/BIBTEX. [DOI] [PMC free article] [PubMed] [Google Scholar]
- 43.Hardwick SA, Hu W, Joglekar A, Fan L, Collier PG, Foord C, Balacco J, Lanjewar S, Sampson MM, Koopmans F, et al. (2022). Single-nuclei isoform RNA sequencing unlocks barcoded exon connectivity in frozen brain tissue. Nat. Biotechnol. 40, 1082–1092. 10.1038/s41587-022-01231-3. [DOI] [PMC free article] [PubMed] [Google Scholar]
- 44.Rebboah E, Reese F, Williams K, Balderrama-Gutierrez G, McGill C, Trout D, Rodriguez I, Liang H, Wold BJ, and Mortazavi A (2021). Mapping and modeling the genomic basis of differential RNA isoform expression at single-cell resolution with LR-Split-seq. Genome Biol. 22, 286–328. 10.1186/S13059-021-02505-W/FIGURES/4. [DOI] [PMC free article] [PubMed] [Google Scholar]
- 45.Preissl S, Gaulton KJ, and Ren B (2022). Characterizing cis-regulatory elements using single-cell epigenomics. Nat. Rev. Genet. 24, 21–43. 10.1038/s41576-022-00509-1. [DOI] [PMC free article] [PubMed] [Google Scholar]
- 46.Fleming SJ, Chaffin MD, Arduini A, Akkad AD, Banks E, Marioni JC, Philippakis AA, Ellinor PT, and Babadi M (2023). Unsupervised removal of systematic background noise from droplet-based single-cell experiments using CellBender. Nat. Methods 20, 1323–1335. 10.1038/s41592-023-01943-7. [DOI] [PubMed] [Google Scholar]
- 47.Wolock SL, Lopez R, and Klein AM (2019). Scrublet: Computational Identification of Cell Doublets in Single-Cell Transcriptomic Data. Cell Syst. 8, 281–291.e9. 10.1016/J.CELS.2018.11.005. [DOI] [PMC free article] [PubMed] [Google Scholar]
- 48.Wolf FA, Angerer P, and Theis FJ (2018). SCANPY: Large-scale single-cell gene expression data analysis. Genome Biol. 19, 15–5. 10.1186/S13059-017-1382-0/FIGURES/1. [DOI] [PMC free article] [PubMed] [Google Scholar]
- 49.Korsunsky I, Millard N, Fan J, Slowikowski K, Zhang F, Wei K, Baglaenko Y, Brenner M, Loh PR, and Raychaudhuri S (2019). Fast, sensitive and accurate integration of single-cell data with Harmony. Nat. Methods 16, 1289–1296. 10.1038/s41592-019-0619-0. [DOI] [PMC free article] [PubMed] [Google Scholar]
- 50.Andreatta M, and Carmona SJ (2021). UCell: Robust and scalable single-cell gene signature scoring. Comput. Struct. Biotechnol. J. 19, 3796–3798. 10.1016/J.CSBJ.2021.06.043. [DOI] [PMC free article] [PubMed] [Google Scholar]
- 51.Hao Y, Hao S, Andersen-Nissen E, Mauck WM, Zheng S, Butler A, Lee MJ, Wilk AJ, Darby C, Zager M, et al. (2021). Integrated analysis of multimodal single-cell data. Cell 184, 3573–3587.e29. 10.1016/J.CELL.2021.04.048. [DOI] [PMC free article] [PubMed] [Google Scholar]
- 52.Welch JD, Kozareva V, Ferreira A, Vanderburg C, Martin C, and Macosko EZ (2019). Single-Cell Multi-omic Integration Compares and Contrasts Features of Brain Cell Identity. Cell 177, 1873–1887.e17. 10.1016/J.CELL.2019.05.006. [DOI] [PMC free article] [PubMed] [Google Scholar]
- 53.Finak G, McDavid A, Yajima M, Deng J, Gersuk V, Shalek AK, Slichter CK, Miller HW, McElrath MJ, Prlic M, et al. (2015). MAST: A flexible statistical framework for assessing transcriptional changes and characterizing heterogeneity in single-cell RNA sequencing data. Genome Biol. 16, 278–313. 10.1186/S13059-015-0844-5/FIGURES/6. [DOI] [PMC free article] [PubMed] [Google Scholar]
- 54.Ramírez F, Ryan DP, Grüning B, Bhardwaj V, Kilpert F, Richter AS, Heyne S, Dündar F, and Manke T (2016). deepTools2: a next generation web server for deep-sequencing data analysis. Nucleic Acids Res. 44, W160–W165. 10.1093/NAR/GKW257. [DOI] [PMC free article] [PubMed] [Google Scholar]
- 55.Li H, Handsaker B, Wysoker A, Fennell T, Ruan J, Homer N, Marth G, Abecasis G, and Durbin R; 1000 Genome Project Data Processing Subgroup (2009). The Sequence Alignment/Map format and SAMtools. Bioinformatics 25, 2078–2079. 10.1093/BIOINFORMATICS/BTP352. [DOI] [PMC free article] [PubMed] [Google Scholar]
- 56.Reese F, and Mortazavi A (2021). Swan: a library for the analysis and visualization of long-read transcriptomes. Bioinformatics 37, 1322–1323. 10.1093/BIOINFORMATICS/BTAA836. [DOI] [PMC free article] [PubMed] [Google Scholar]
- 57.Moon KR, van Dijk D, Wang Z, Gigante S, Burkhardt DB, Chen WS, Yim K, Elzen A.v.d., Hirn MJ, Coifman RR, et al. (2019). Visualizing structure and transitions in high-dimensional biological data. Nat. Biotechnol. 37, 1482–1492. 10.1038/s41587-019-0336-3. [DOI] [PMC free article] [PubMed] [Google Scholar]
- 58.Aibar S, González-Blas CB, Moerman T, Huynh-Thu VA, Imrichova H, Hulselmans G, Rambow F, Marine JC, Geurts P, Aerts J, et al. (2017). SCENIC: single-cell regulatory network inference and clustering. Nat. Methods 14, 1083–1086. 10.1038/nmeth.4463. [DOI] [PMC free article] [PubMed] [Google Scholar]
- 59.Morabito S, Reese F, Rahimzadeh N, Miyoshi E, and Swarup V (2023). hdWGCNA identifies co-expression networks in high-dimensional transcriptomics data. Cell Rep. Methods 3, 100498. 10.1016/J.CRMETH.2023.100498. [DOI] [PMC free article] [PubMed] [Google Scholar]
- 60.Fornes O, Castro-Mondragon JA, Khan A, Van Der Lee R, Zhang X, Richmond PA, Modi BP, Correard S, Gheorghe M, Baranašić D, et al. (2020). JASPAR 2020: update of the open-access database of transcription factor binding profiles. Nucleic Acids Res. 48, D87–D92. 10.1093/NAR/GKZ1001. [DOI] [PMC free article] [PubMed] [Google Scholar]
- 61.Sandelin A, Alkema W, Engström P, Wasserman WW, and Lenhard B (2004). JASPAR: an open-access database for eukaryotic transcription factor binding profiles. Nucleic Acids Res. 32, D91–D94. 10.1093/NAR/GKH012. [DOI] [PMC free article] [PubMed] [Google Scholar]
- 62.Chen T, and Guestrin C XGB.: A Scalable Tree Boosting System. Proceedings of the 22nd ACM SIGKDD International Conference on Knowledge Discovery and Data Mining 10.1145/2939672. [Google Scholar]
- 63.Chen EY, Tan CM, Kou Y, Duan Q, Wang Z, Meirelles GV, Clark NR, and Ma’ayan A (2013). Enrichr: Interactive and collaborative HTML5 gene list enrichment analysis tool. BMC Bioinf. 14, 128–214. 10.1186/1471-2105-14-128/FIGURES/3. [DOI] [PMC free article] [PubMed] [Google Scholar]
- 64.Plaisier SB, Taschereau R, Wong JA, and Graeber TG (2010). Rank–rank hypergeometric overlap: identification of statistically significant overlap between gene-expression signatures. Nucleic Acids Res. 38, e169. 10.1093/NAR/GKQ636. [DOI] [PMC free article] [PubMed] [Google Scholar]
- 65.Langfelder P, and Horvath S (2008). WGCNA: An R package for weighted correlation network analysis. BMC Bioinf. 9, 559–613. 10.1186/1471-2105-9-559/FIGURES/4. [DOI] [PMC free article] [PubMed] [Google Scholar]
- 66.Marsh SE, Walker AJ, Kamath T, Dissing-Olesen L, Hammond TR, de Soysa TY, Young AMH, Murphy S, Abdulraouf A, Nadaf N, et al. (2022). Dissection of artifactual and confounding glial signatures by single-cell sequencing of mouse and human brain. Nat Neuro 25, 306–316. 10.1038/s41593-022-01022-8. [DOI] [PMC free article] [PubMed] [Google Scholar]
- 67.Badia-i-Mompel P, Wessels L, Müller-Dott S, Trimbour R, Ramirez Flores RO, Argelaguet R, and Saez-Rodriguez J (2023). Gene regulatory network inference in the era of single-cell multi-omics. Nat. Rev. Genet. 24, 739–754. 10.1038/s41576-023-00618-5. [DOI] [PubMed] [Google Scholar]
- 68.Morabito S, Miyoshi E, Michael N, Shahin S, Martini AC, Head E, Silva J, Leavy K, Perez-Rosendahl M, and Swarup V (2021). Single-nucleus chromatin accessibility and transcriptomic characterization of Alzheimer’s disease. Nat. Genet. 53, 1143–1155. 10.1038/s41588-021-00894-z. [DOI] [PMC free article] [PubMed] [Google Scholar]
- 69.Langfelder P, Zhang B, and Horvath S (2008). Defining clusters from a hierarchical cluster tree: the Dynamic Tree Cut package for R. Bioinformatics 24, 719–720. 10.1093/BIOINFORMATICS/BTM563. [DOI] [PubMed] [Google Scholar]
Associated Data
This section collects any data citations, data availability statements, or supplementary materials included in this article.
Supplementary Materials
Data Availability Statement
All data included in this paper will be shared upon request by the lead contact. The raw sequencing data and the processed Seurat object for the habenula snRNA-seq dataset have been deposited into the National Center for Biotechnology Information Gene Expression Omnibus under the accession number GSE208081, which is publically accessible.
All code used for data processing and analysis throughout the manuscript is available on GitHub (https://github.com/swaruplabUCI/NURR2C_habenula_2022, https://doi.org/10.5281/zenodo.10638040).
Any additional information required to reanalyze the data reported in this work paper is available from the lead contact upon request.