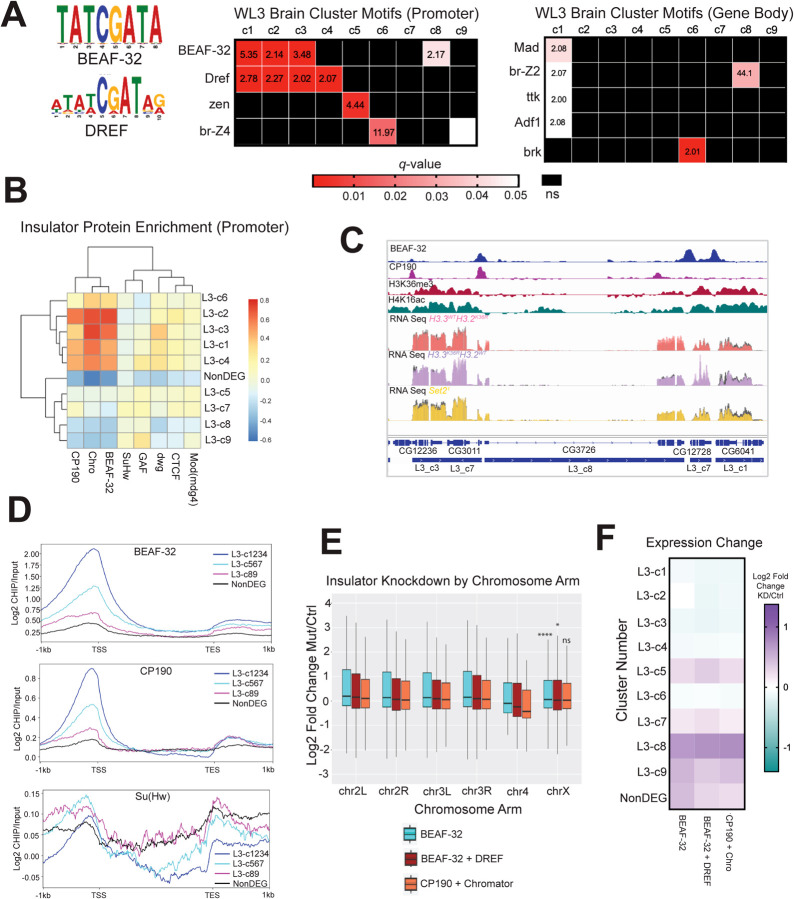
Fig. 6. Motif analysis reveals that Set2/K36 and BEAF-32 regulate common gene sets similarly.
(A) SEA (Simple Enrichment Analysis) was performed on promoters and gene bodies of gene groups from Fig. 5A using motifs from the FLYREG.v2 database (Fig 5A; Fig 6A [64, 65]). Motifs with q-value > 0.05 and enrichment value over nonDEG control sequences > 2 were displayed. Motifs not meeting either threshold were designated as ns and colored black. (B) A heatmap of insulator protein binding was generated as in Fig. 5D and 5E, with the addition of hierarchical clustering. (C) Browser shot of insulator protein binding relative to H3K36me3, H4K16ac, L3 cluster annotation, and WL3 brain male RNA-seq data. RPGC normalized RNA-seq data is colored for each mutant with control data shown in gray on the same track line. (D) Scaled gene metaplots of insulator proteins with genes grouped by similar enrichment of BEAF-32 and CP190. SuHw is included for comparison. (E) Chromosome arm plots and accompanying statistical analyses were produced as in Fig. 2B from RNA-seq data from insulator transcript knockdowns in BG3 cells generated by [66]. F) Median LFC values for BEAF-32, BEAF-32 + DREF, and CP190 + Chromator were determined for each L3 gene cluster from Fig. 5A and plotted as a heatmap.

