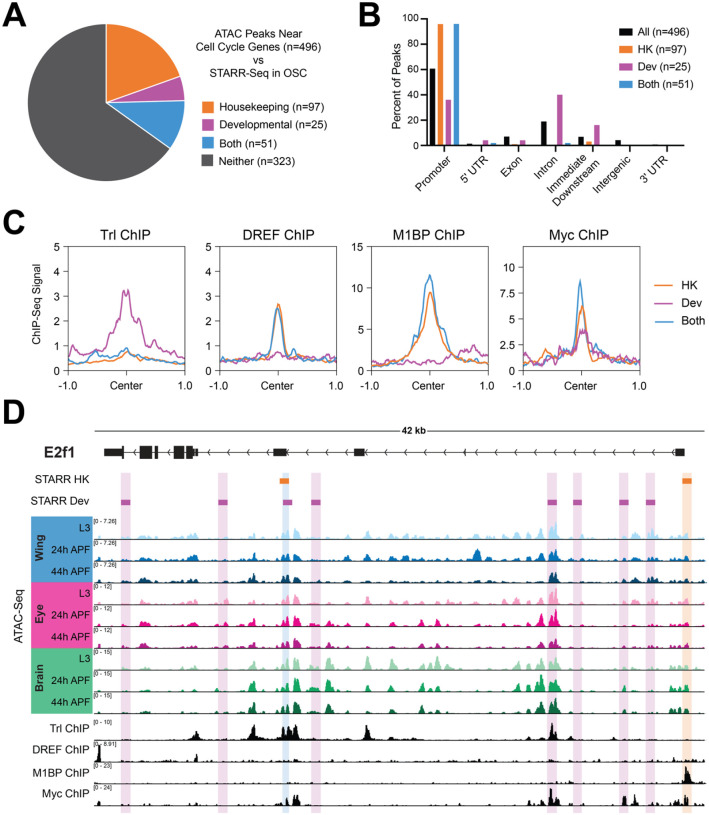
Figure 5. Cell cycle genes harbor ‘housekeeping’ and ‘developmental’ type enhancers.
(A) Pie chart depicting overlap between the union set of ATAC-Seq peaks associated with cell cycle genes across the wing, eye, and brain (n=496) and STARR-Seq identified enhancers from ovarian somatic cells (OSC). (B) Bar chart showing the genomic distributions of ATAC-Seq peaks at cell cycle genes: for all peaks (black), those overlapping with housekeeping enhancers (orange), overlapping with developmental enhancers (magenta), or overlapping with both datasets (blue). HK, housekeeping. Dev, developmental. (C) Line plots showing the average ChIP-Seq signal for Trl, DREF, M1BP, and Myc at cell cycle gene-associated ATAC-Seq peaks (+/− 1 kilobase from peak center) for those overlapping with housekeeping enhancers (orange), overlapping with developmental enhancers (magenta), or overlapping with both datasets (blue). HK, housekeeping. Dev, developmental. (D) STARR-Seq, ATAC-Seq, and ChIP-Seq data at the e2f1 locus. Orange boxes indicate STARR-Seq housekeeping enhancers and magenta boxes indicate STARR-Seq developmental enhancers. ATAC-Seq accessibility data from wing, eye, and brain at L3, 24h APF, and 44h APF. ChIP-Seq data for Trl, DREF, M1BP, and Myc. Y-axes indicate the normalized read counts per million. HK, housekeeping. Dev, developmental.

