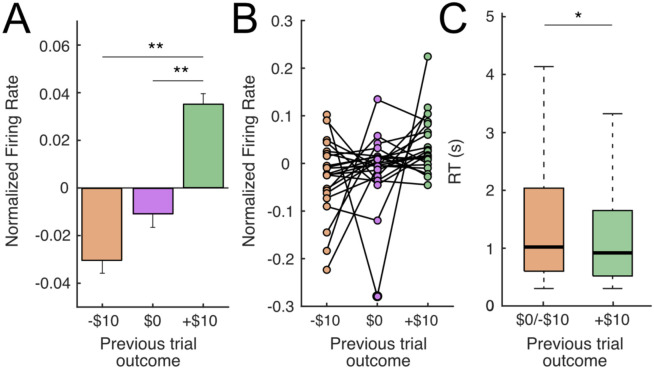
Figure 4. Putative DA neurons encode previous reward outcome during the expectation period.
(A) Average normalized firing rate across all putative DA neurons during the reward expectation period (3s post-choice, prior to reward outcome reveal), separated according to previous trial outcome: negative (−$10), neutral ($0) or positive (+$10). FR of putative DA neurons is higher for previous positive outcomes than either previous neutral (p<0.05, paired t-test) or previous negative outcomes (p<0.01, paired t-test). (B) Same data as (A) but showing individual putative DA neurons. (C) Patient reaction times (RTs) varied depending on the previous trial outcome. RTs were faster following a positive, compared to neutral or negative outcomes (+$10 median = 0.916s vs −$10/$0 median = 1.017s, p<0.05, Wilcoxon rank sum).

