

Abstract
BACKGROUND
Propagation of action potentials through the heart coordinates the heartbeat. Thus, intercalated discs, specialized cell–cell contact sites that provide electrical and mechanical coupling between cardiomyocytes, are an important target for study. Impaired propagation leads to arrhythmias in many pathologies, where intercalated disc remodeling is a common finding, hence the importance and urgency of understanding propagation dependence on intercalated disc structure. Conventional modeling approaches cannot predict changes in propagation elicited by perturbations that alter intercalated disc ultrastructure or molecular organization, because of lack of quantitative structural data at subcellular through nano scales.
OBJECTIVES
This study sought to quantify intercalated disc structure at these spatial scales in the healthy adult mouse heart and relate them to chamber-specific properties of propagation as a precursor to understanding the effects of pathological intercalated disc remodeling.
METHODS
Using super-resolution light microscopy, electron microscopy, and computational image analysis, we provide here the first ever systematic, multiscale quantification of intercalated disc ultrastructure and molecular organization.
RESULTS
By incorporating these data into a rule-based model of cardiac tissue with realistic intercalated disc structure, and comparing model predictions of electrical propagation with experimental measures of conduction velocity, we reveal that atrial intercalated discs can support faster conduction than their ventricular counterparts, which is normally masked by interchamber differences in myocyte geometry. Further, we identify key ultrastructural and molecular organization features underpinning the ability of atrial intercalated discs to support faster conduction.
CONCLUSIONS
These data provide the first stepping stone to elucidating chamber-specific effects of pathological intercalated disc remodeling, as occurs in many arrhythmic diseases.
Keywords: cardiac conduction, gap junctions, intercalated disc, ion channels, microscopy
Fast and reliable propagation of action potentials through the myocardium is a critical life process, the disruption of which can lead to life-threatening arrhythmias. Structural differences between atrial and ventricular myocardium at the organ, tissue, and cellular levels are well-established determinants of differences in action potential propagation under normal physiological conditions,1,2 as well as determining chamber-specific arrhythmia susceptibility under pathological conditions. Intercalated discs (IDs), which are cell–cell contact sites specialized to provide electrical and mechanical coupling between adjacent cardiomyocytes, are thus a key focus of research into cardiac action potential propagation with a growing body of evidence highlighting the strong influence of ion channel localization to specialized ID nanodomains.3–7 However, there is limited data on ID ultrastructural and molecular organization at subcellular through nano scales, while mounting evidence highlights their importance in determining function.3–8 Additionally, conventional modeling approaches cannot predict conduction changes in response to perturbations that alter ID ultrastructure or molecular organization. Quantifying structure-function relationships at these finer spatial scales and in a chamber-specific manner is crucial to understanding cardiac action potential propagation during normal physiological conditions and its modes of failure under pathological perturbation, and thereby, developing effective therapies for the prevention of arrhythmias. Thus, we tested the hypothesis that chamber-specific heterogeneities in conduction and its stability under perturbation are influenced by underlying heterogeneities in ID ultrastructure and molecular organization.
To this end, we applied a combined experimental and modeling approach to compare the structural basis of conduction between healthy adult murine atria and ventricles. First, we systematically quantified myocyte geometry, ID ultrastructure, and molecular organization using light and electron microscopy. Next, we incorporated these measurements into a rule-based model of cardiac tissue with realistic ID structure, and compared model predictions of electrical propagation with experimental measures of conduction velocity from optical mapping of ex vivo hearts. Consistent with previous findings, action potential propagation was faster in ventricular myocardium than in atrial myocardium. However, model predictions revealed that the conduction differences under normal physiological conditions were largely a reflection of differences in cell geometry, and not ID characteristics. Counterintuitively, after accounting for cell size differences between chambers, the ultrastructure and molecular organization of atrial IDs were found to support faster conduction compared with ventricular IDs. In other words, differences in cell size mask underlying heterogeneities in ID structure, which may be unmasked by pathological remodeling with important implications for the risk of proarrhythmic conduction defects.
METHODS
All animal procedures were approved by The Ohio State University Institutional Animal Care and Use Committee and performed in accordance with the Guide for the Care and Use of Laboratory Animals published by the U.S. National Institutes of Health (NIH Publication No. 85-23, revised 2011).
TISSUE COLLECTION AND MYOCYTE ISOLATION.
Adult, male (aged 12-34 weeks) wild-type mice (C57BL6 background), purchased from Jackson Laboratories (Cat. #000664), were anesthetized with 5% isoflurane + 100% oxygen (1 L/min). Once the mice were unconscious, anesthesia was maintained within 3% to 5% isoflurane + 100% oxygen (1 L/min). Once the animal was in a surgical plane of anesthesia, the heart was excised and submerged in cold electrolyte solution (containing in mmol/L: NaCl 140, KCl 5.4, MgCl2 0.5, dextrose 5.6, HEPES 10; pH adjusted to 7.4) to remove any remaining blood before myocyte isolation, cryopreservation (for immunofluorescence), fixation (for transmission electron microscopy [TEM]), or Langendorff perfusion (for optical mapping), as previously described.8–10
For light microscopy studies in tissue, hearts were cryopreserved in OCT compound (Fisher Health Care) using vapor phase nitrogen to ensure uniform freezing. For TEM, ~0.5-mm cubes of tissue were fixed overnight in 2.5% glutaraldehyde followed by a 5 minute wash in phosphate-buffered saline (PBS) and storage in PBS for further processing. For isolated myocyte studies, Langendorff-perfused hearts were enzymatically digested using Liberase TH (Roche) enzyme in Ca2+-free electrolyte solution. After digestion, the atria and ventricles were dissected and separately minced in electrolyte solution containing 2% bovine serum albumin (Sigma-Aldrich), dispersed by gentle agitation, and filtered through a nylon mesh. Cardiomyocytes are resuspended in low Ca2+ electrolyte solution (containing 0.1 mmol/L CaCl2). Then, cells were plated on laminin-coated glass coverslips, fixed for 5 minutes with 2% paraformaldehyde (PFA), washed in PBS (3 × 10 min), and stored in PBS at 4 °C for immunolabeling.
All structural imaging (light and electron) was performed on the left atrium and left ventricular free wall to focus on working myocardium.
FLUORESCENT IMMUNOLABELING.
Tissue was cryosectioned (5-μm thickness) and fixed with 2% PFA (5 minutes at room temperature [RT]) followed by a PBS wash (3 × 10 minutes at RT). Samples (either fixed tissues or cells) were permeabilized with 0.2% Triton X-100 in PBS (15 minutes at RT) and incubated with blocking agent (1% bovine serum albumin, 0.1% triton in PBS for 2 hours at RT). For subdiffraction confocal imaging, samples were labeled with primary antibodies (overnight at 4 °C) and washed in PBS (3 × 5 minutes at RT) before labeling with secondary antibodies (2 hours at RT). After secondaries, samples were washed in PBS (3 × 5 minutes at RT), mounted in Prolong Gold (Invitrogen by ThermoFisher Scientific), and allowed to cure for 48 hours at RT before imaging. A similar protocol was used to prepare samples for STochastic Optical Reconstruction Microscopy (STORM) with the following minor changes. A 10× diluted solution of the blocking agent (0.1% bovine serum albumin, 0.05% triton in PBS) was used for washes before and after secondary antibodies in place of PBS. Instead of being mounted on glass slides, labeled samples on 20-mm coverslips thickness #1.5 (Electron Microscopy Sciences) were postfixed in 2% PFA (5 minutes at RT) followed by PBS washes (3 x 5 minutes at RT), then optically cleared in Scale U2 buffer (4M urea + 30% glycerol + 0.1% triton in water at 4 °C) for 48 hours before imaging.
Proteins of interest were labeled with well-validated custom and commercial antibodies: Connexin43 (Cx43) (mouse monoclonal antibody, Cat. #MAB3067, EMD Millipore Corp; rabbit polyclonal antibody, Cat. #C6219, Millipore Sigma), N-cadherin (N-cad) (mouse monoclonal antibody, Cat. #610921, BD Biosciences), desmoplakin (Dsp) (rabbit polyclonal antibody, Cat. #ab71690, Abcam), inward-rectifier potassium channel 2.1 (Kir2.1) (rabbit polyclonal antibody, Cat. #APC-159, Alomone Labs), cardiac voltage-gated sodium channel 1.5 (NaV1.5) (a previously validated custom rabbit polyclonal antibody4), and sodium/potassium ATPase (NKA) (a previously validated custom monoclonal antibody11). Samples labeled for confocal microscopy were labeled with goat antimouse and goat antirabbit secondary antibodies conjugated to Alexa 488 and Alexa 568 (1:4,000; ThermoFisher Scientific). For STORM, samples were labeled with goat antimouse Alexa 647 (1:1,000) and goat antirabbit Biotium CF 568 (1:2,000) secondary antibodies (ThermoFisher Scientific). Simultaneous labeling with 2 primary antibodies from the same animal background was accomplished by completing the staining protocol with one set of primary and secondary antibodies followed by blocking with a donor secondary antibody (conjugated to fluorophore to assess degree of blocking) to block any remaining unbound first antibodies. A second round of labeling was performed with a second combination of primary and secondary antibodies.
CONFOCAL IMAGING.
Confocal imaging of tissue sections and isolated cells (Figure 1) was performed using an A1R-HD laser-scanning confocal microscope equipped with 4 solid-state lasers (405, 488, 560, and 640 nm, 30 mW each), a 63×/1.4 numerical aperture oil immersion objective, 2 GaAsP detectors, and 2 high-sensitivity photomultiplier tube detectors (Nikon). Images were collected as single plane or z-stacks with sequential spectral imaging (line-wise) to avoid spectral mixing. In addition, images were collected with Nyquist sampling (or greater) and postprocessed with 3-dimensional deconvolution, as previously described.12 Spatial analysis of images was performed to quantify signal abundance and localization (distance from fluorescent signals to another signal or a cellular landmark structure) using morphological object localization, a custom algorithm implemented in Matlab (Mathworks Inc).13
FIGURE 1. Cardiomyocyte and ID Dimensions.
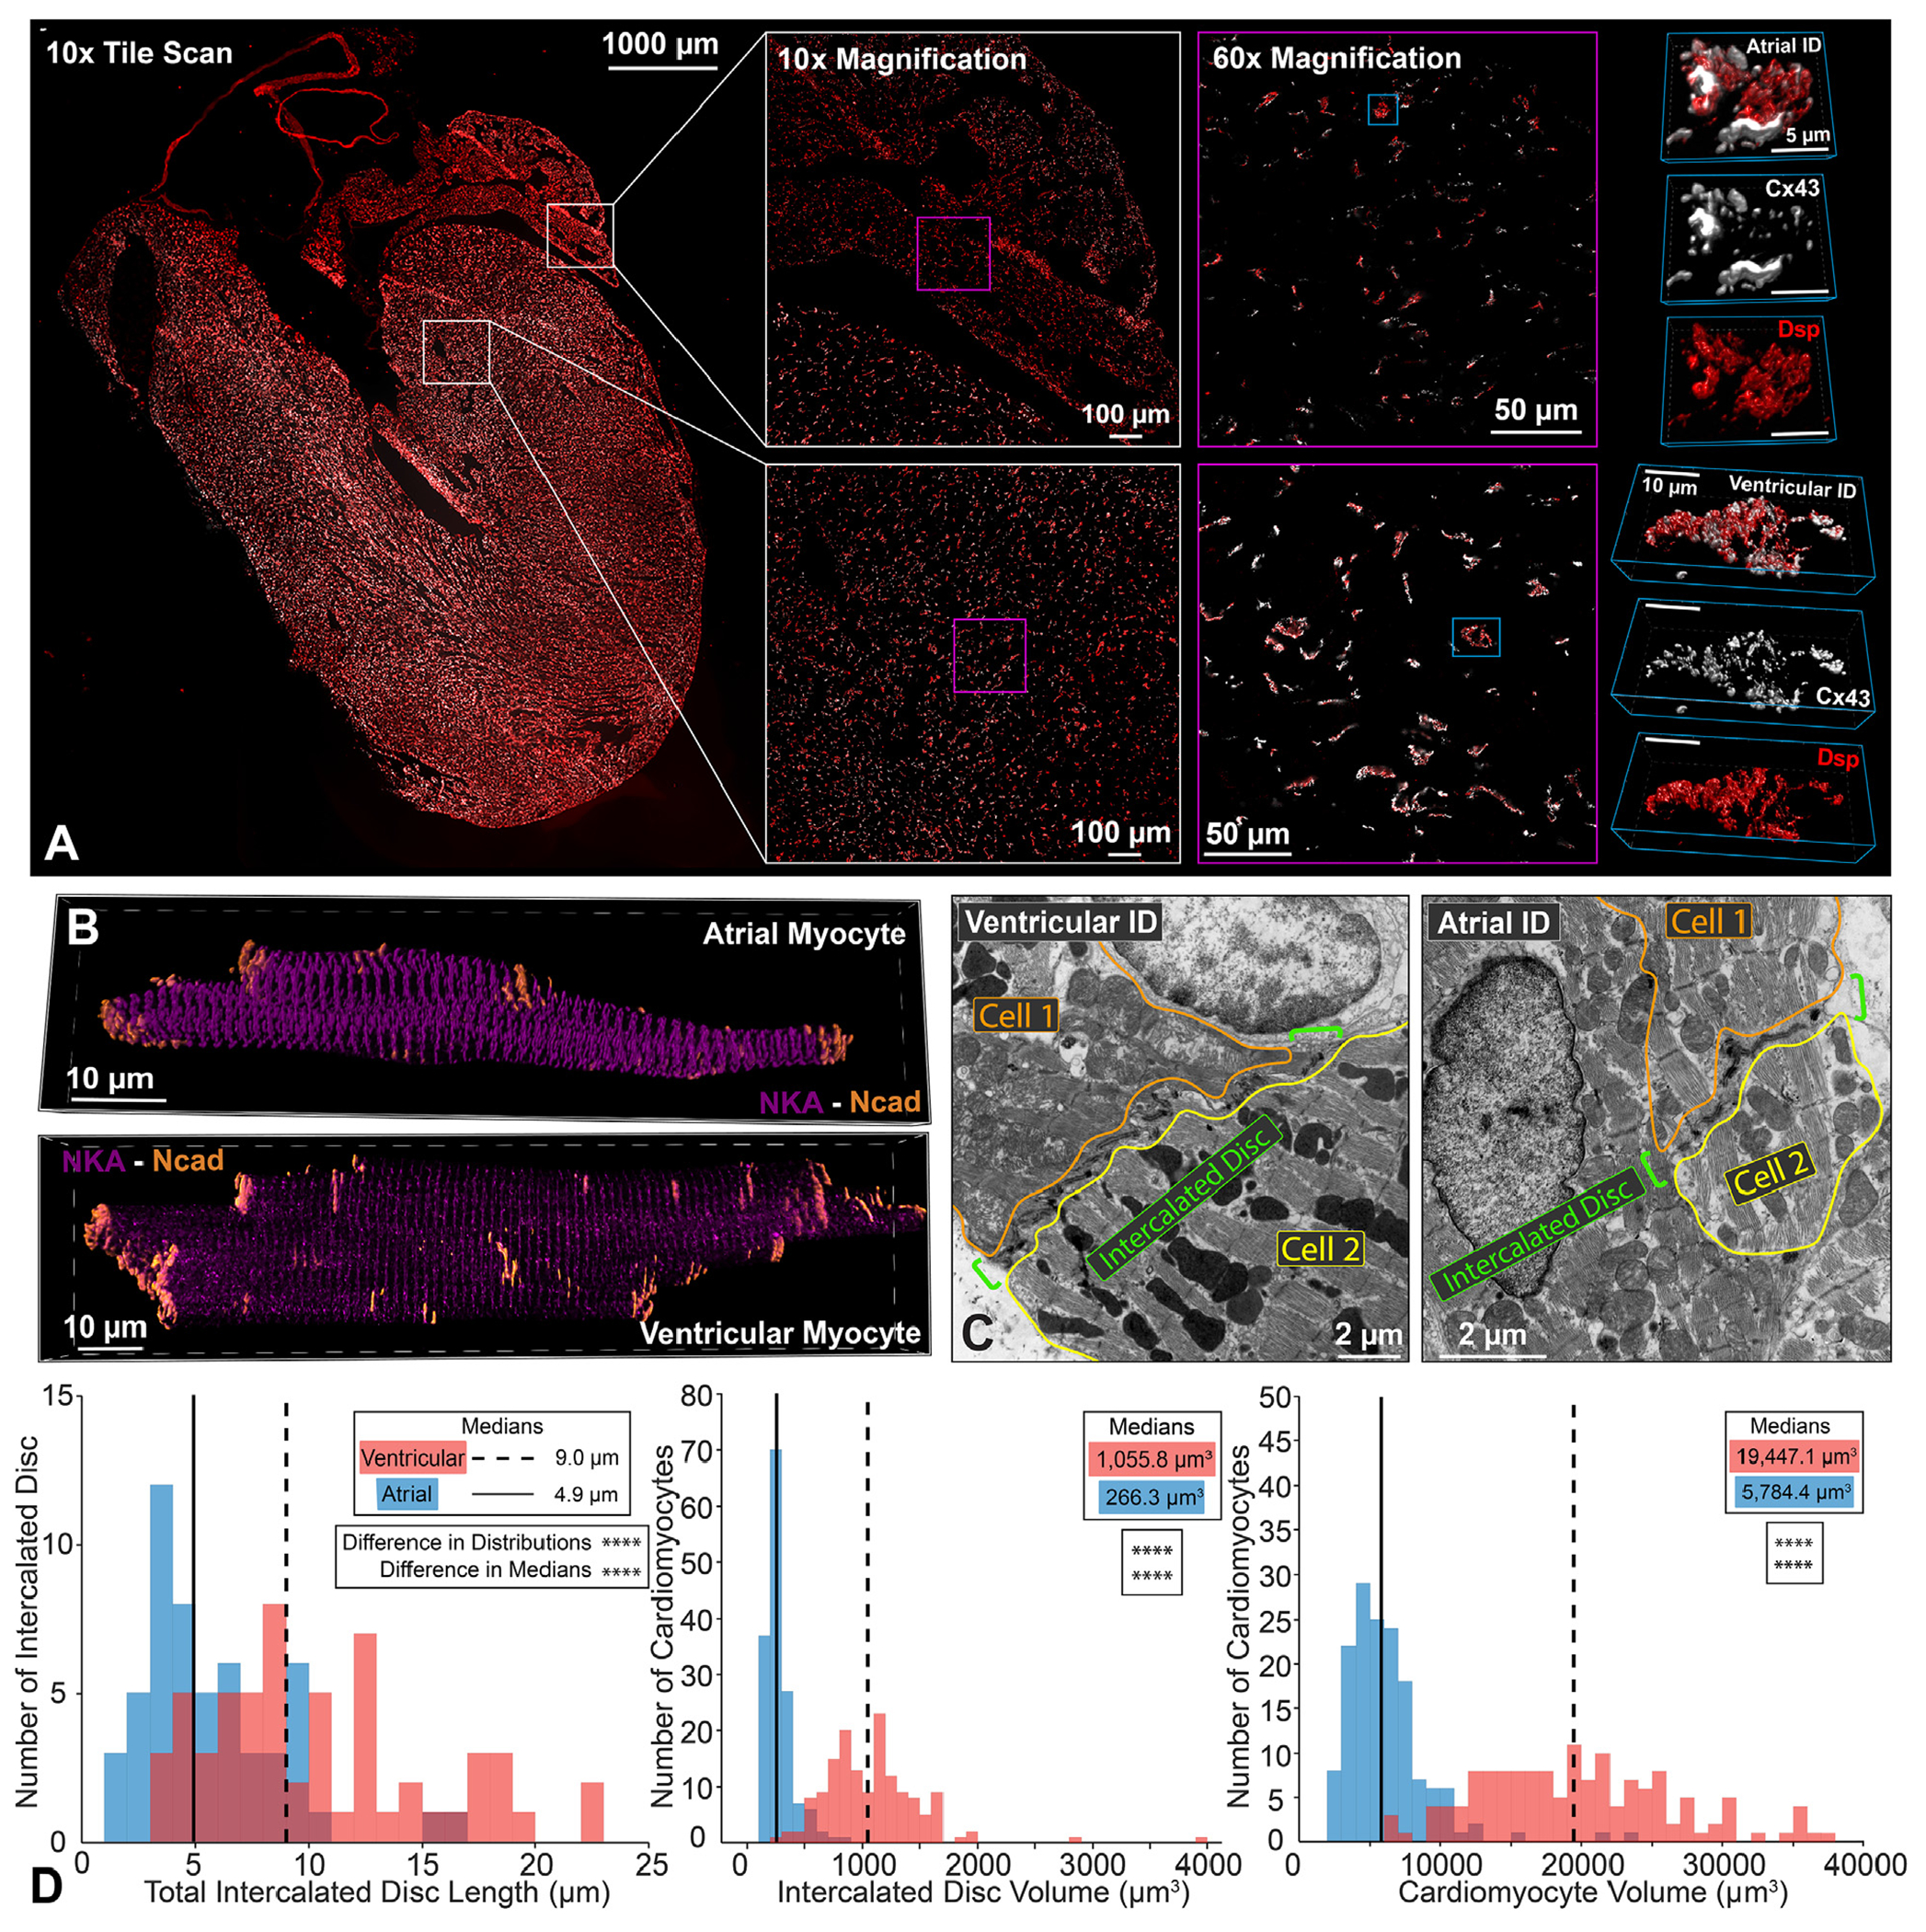
Representative confocal images of atrial and ventricular (A) intercalated discs (IDs) from a whole-heart frontal section (gap junctions [Connexin43 (Cx43); white] and desmosomes [Dsp] [red]) and (B) isolated cardiomyocytes (adherens junctions [N-cadherin (Ncad); orange] and sodium/potassium ATPase [NKA; purple]). Representative thin section (C) transmission electron microscopy images of atrial and ventricular IDs. ID size was quantified by (D) length (left; n= 54 [atrial], 58 [ventricular] measurements from 3 hearts) and volume (middle; n = 151 [atrial], 150 [ventricular] measurements from 4 hearts). Cardiomyocyte size was quantified by (D) volume (right; n = 151 [atrial], 150 [ventricular] measurements from 4 hearts). Distributions are represented in red for ventricular and blue for atrial intercalated discs. Medians are represented as dashed lines for ventricular and solid lines for atrial results. Differences in distributions and medians were statistically tested by 2-sample Kolmogorov-Smirnov test and Wilcoxon signed rank test, respectively (NS = P > 0.05; *P ≤ 0.05; **P ≤ 0.01; ***P ≤ 0.001; ****P ≤ 0.0001).
TRANSMISSION ELECTRON MICROSCOPY.
After 2.5% glutaraldehyde fixation (Sigma-Aldrich) as previously described in the tissue collection section, samples were postfixed with 1% osmium tetroxide (Ted Pella Inc) and then en bloc stained with 1% aqueous uranyl acetate (Ted Pella Inc), dehydrated in a graded series of ethanol, and embedded in Eponate 12 epoxy resin (Ted Pella Inc). Ultrathin sections (70 nm) were cut with a Leica EM UC7 ultramicrotome (Leica Microsystems Inc), collected on copper grids, and then stained with Reynold’s lead citrate and 2% uranyl acetate. Images were collected using a FEI Tecnai G2 Spirit transmission electron microscope (ThermoFisher Scientific) operating at 80kV, and a Macrofire (Optronics, Inc) digital camera and AMT image capture software.
To assess multiscale structural properties of IDs, paired images of each ID were collected at 6,000x, 10,000x, and 20,000x magnifications. Morphometric quantification was performed using ImageJ (National Institutes of Health) by manual identification manual identification and quantification of the specific measurements summarized in the results. Color-coded annotations of each ID measurement are overlaid on TEM images at each magnification in Figures 2E, 2F, 3H, 3I, 4F, and 5C to 5E. Images at 6,000× magnification were used to quantify total ID length (cross-sectional length) (Figure 2E), and length of the plicate and interplicate subdomain regions (Figure 2F). Images at 10,000× magnification were used to quantify the frequency and amplitude of plicate membrane folds (Figure 3H), and the lengths of mechanical junctions (MJs) and gap junctions (GJs) in both plicate and interplicate regions (Figures 3H and 4F). Images at 20,000× magnification were used to quantify the intermembrane distance at multiple sites within/near MJs and GJs (Figures 3I and 4F). Ratios of these measurements across provided further insight into ID structural organization (Supplemental Table 1).
FIGURE 2. Intercalated Disc Nanodomain Structures in the Interplicate Subdomain.
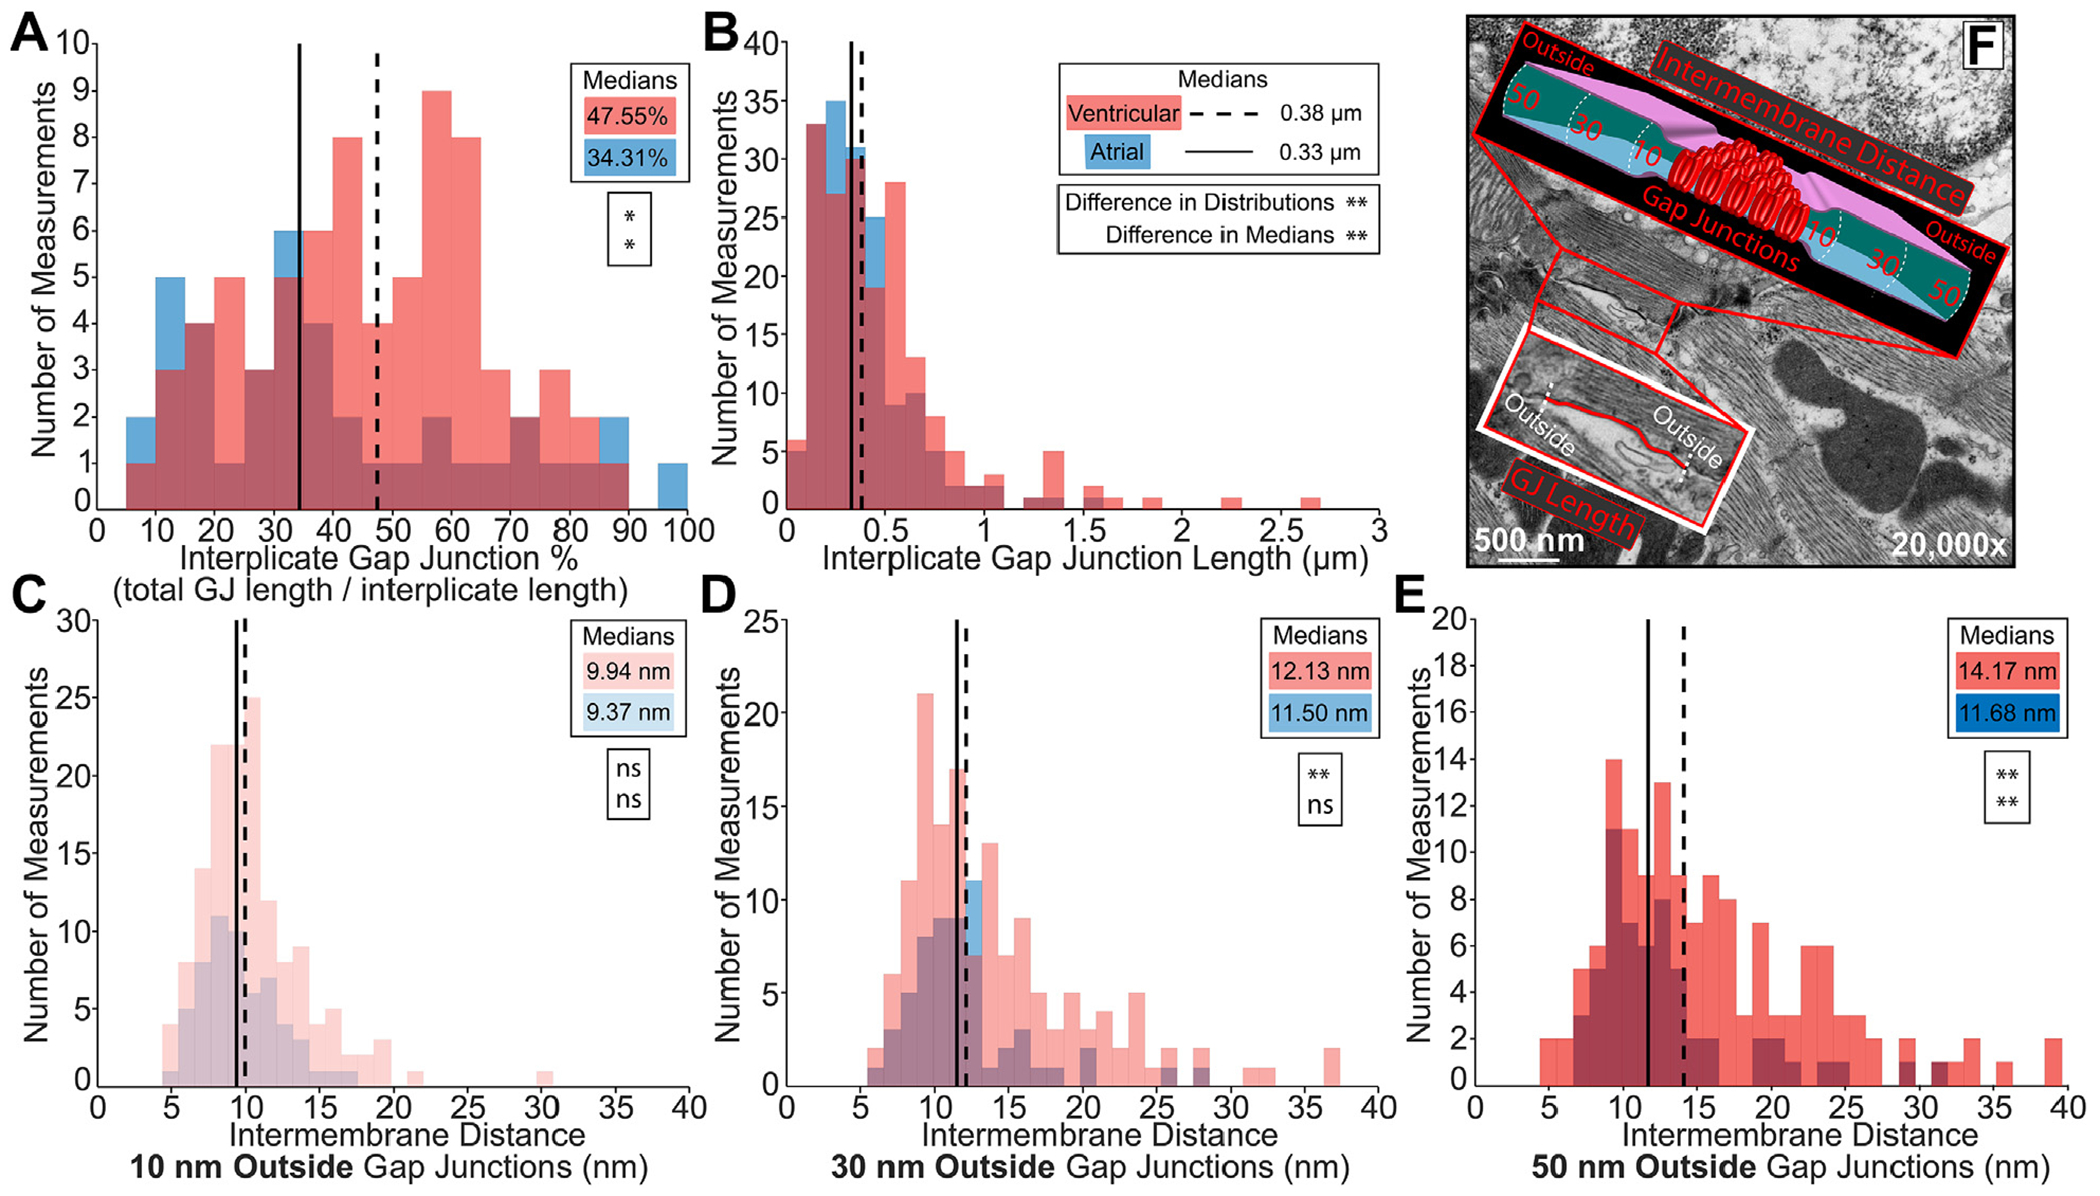
Representative transmission electron microscopy images annotated to show intercalated disc nanodomain structural measurements in the interplicate regions: (F) gap junction (GJ) length (red trace), and intermembrane distance outside (10, 30, 50 nm) GJs (cartoon). Interplicate gap junctions were characterized by A) percentage relative to the interplicate region (n= 40 [atrial], 72 [ventricular] measurements), (B) length (n = 162 [atrial], 186 [ventricular] measurements), and (C-E) intermembrane distance outside (10, 30, 50 nm) GJs (10 nm outside n = 58 [atrial], 142 [ventricular]; 30 nm outside n = 58 [atrial], 143 [ventricular]; and 50 nm outside n = 58 [atrial], 140 [ventricular] measurements). Performed on 3 hearts. Distributions were represented in red for ventricular and blue for atrial measurements. Medians were represented as dashed line for ventricular and solid line for atrial. Differences in distributions and medians were statistically proven with two-sample Kolmogorov-Smirnov test and Wilcoxon signed-rank test, respectively (NS = P > 0.05; *P ≤ 0.05; **P ≤ 0.01; ***P ≤ 0.001; ****P ≤ 0.0001).
FIGURE 3. Integration of ID Ultrastructure Into Rule-Based Finite Element Model.
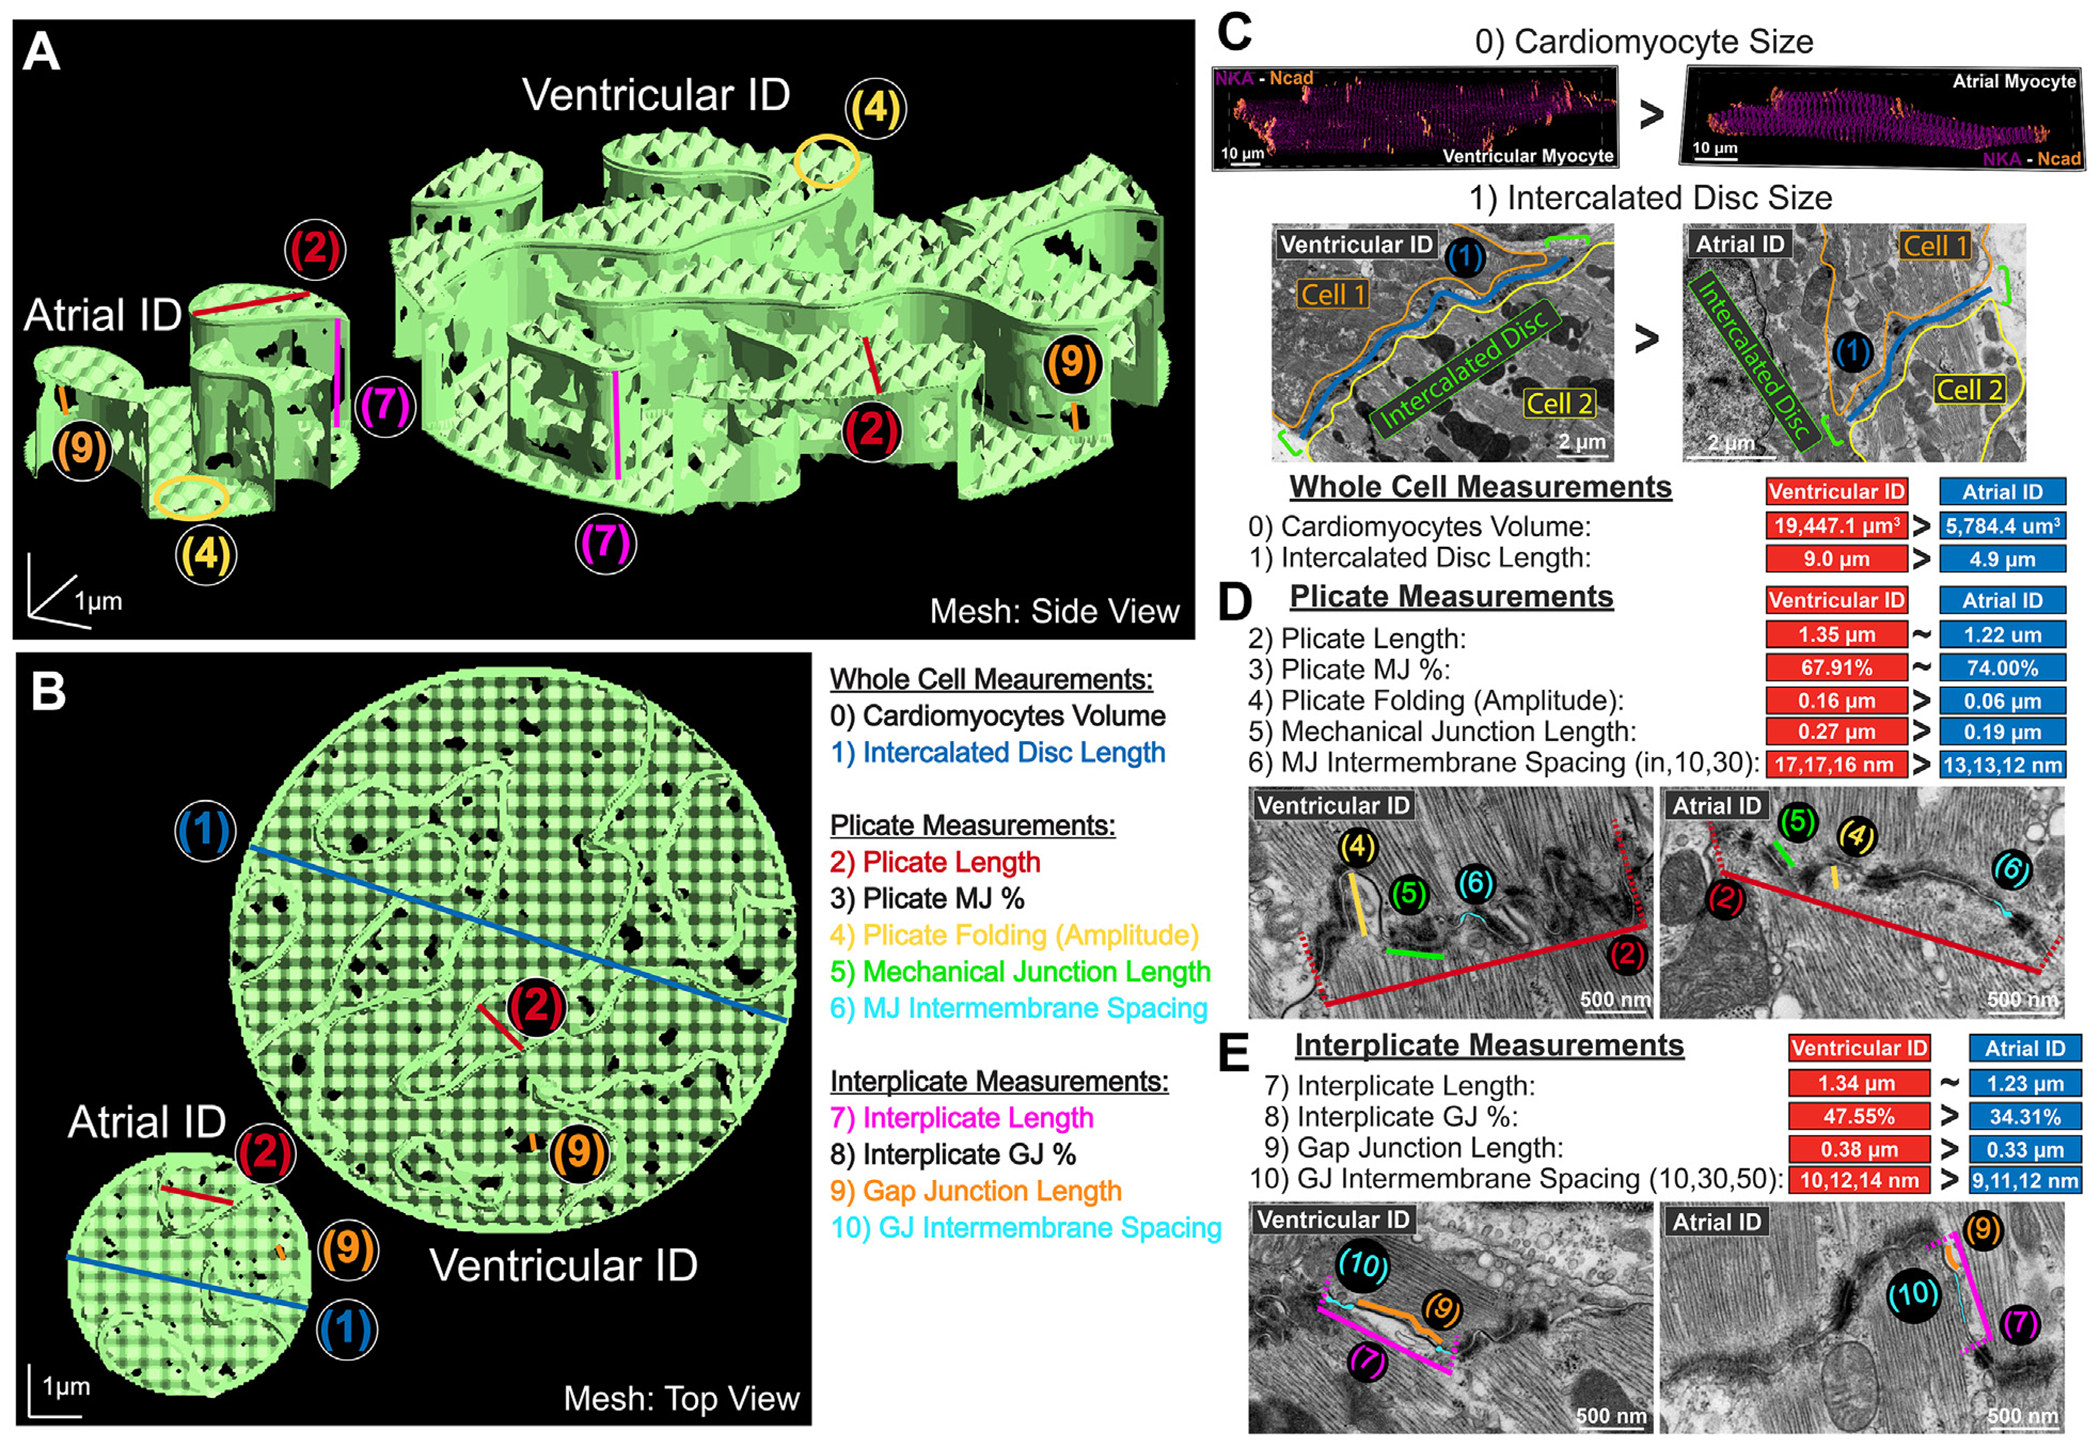
Representative finite element meshes of atrial and ventricular intercalated discs (IDs): (A) side view and (B) top view. Overlay of multiscale ID measurements used for mesh generation: (0) cardiomyocyte volume, (1) ID size (blue), (2) plicate length (red), (3) plicate MJ%, (4) plicate folding (amplitude, yellow), (5) mechanical junction (MJ) length (green), (6) MJ intermembrane spacing (teal), (7) interplicate length (pink), (8) interplicate gap junction (GJ)%, (9) GJ length (orange), (10) GJ intermembrane spacing (teal). Ultrastructural measurements are annotated in TEM images and summarized as comparison of medians for (C) whole cell, (D) plicate, and (E) interplicate measurements.
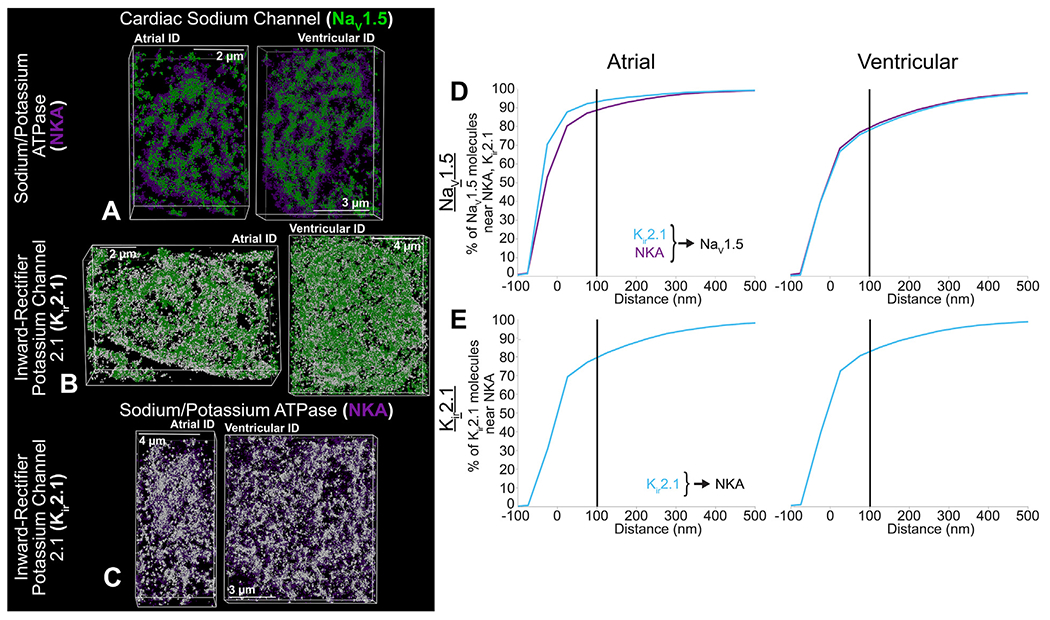
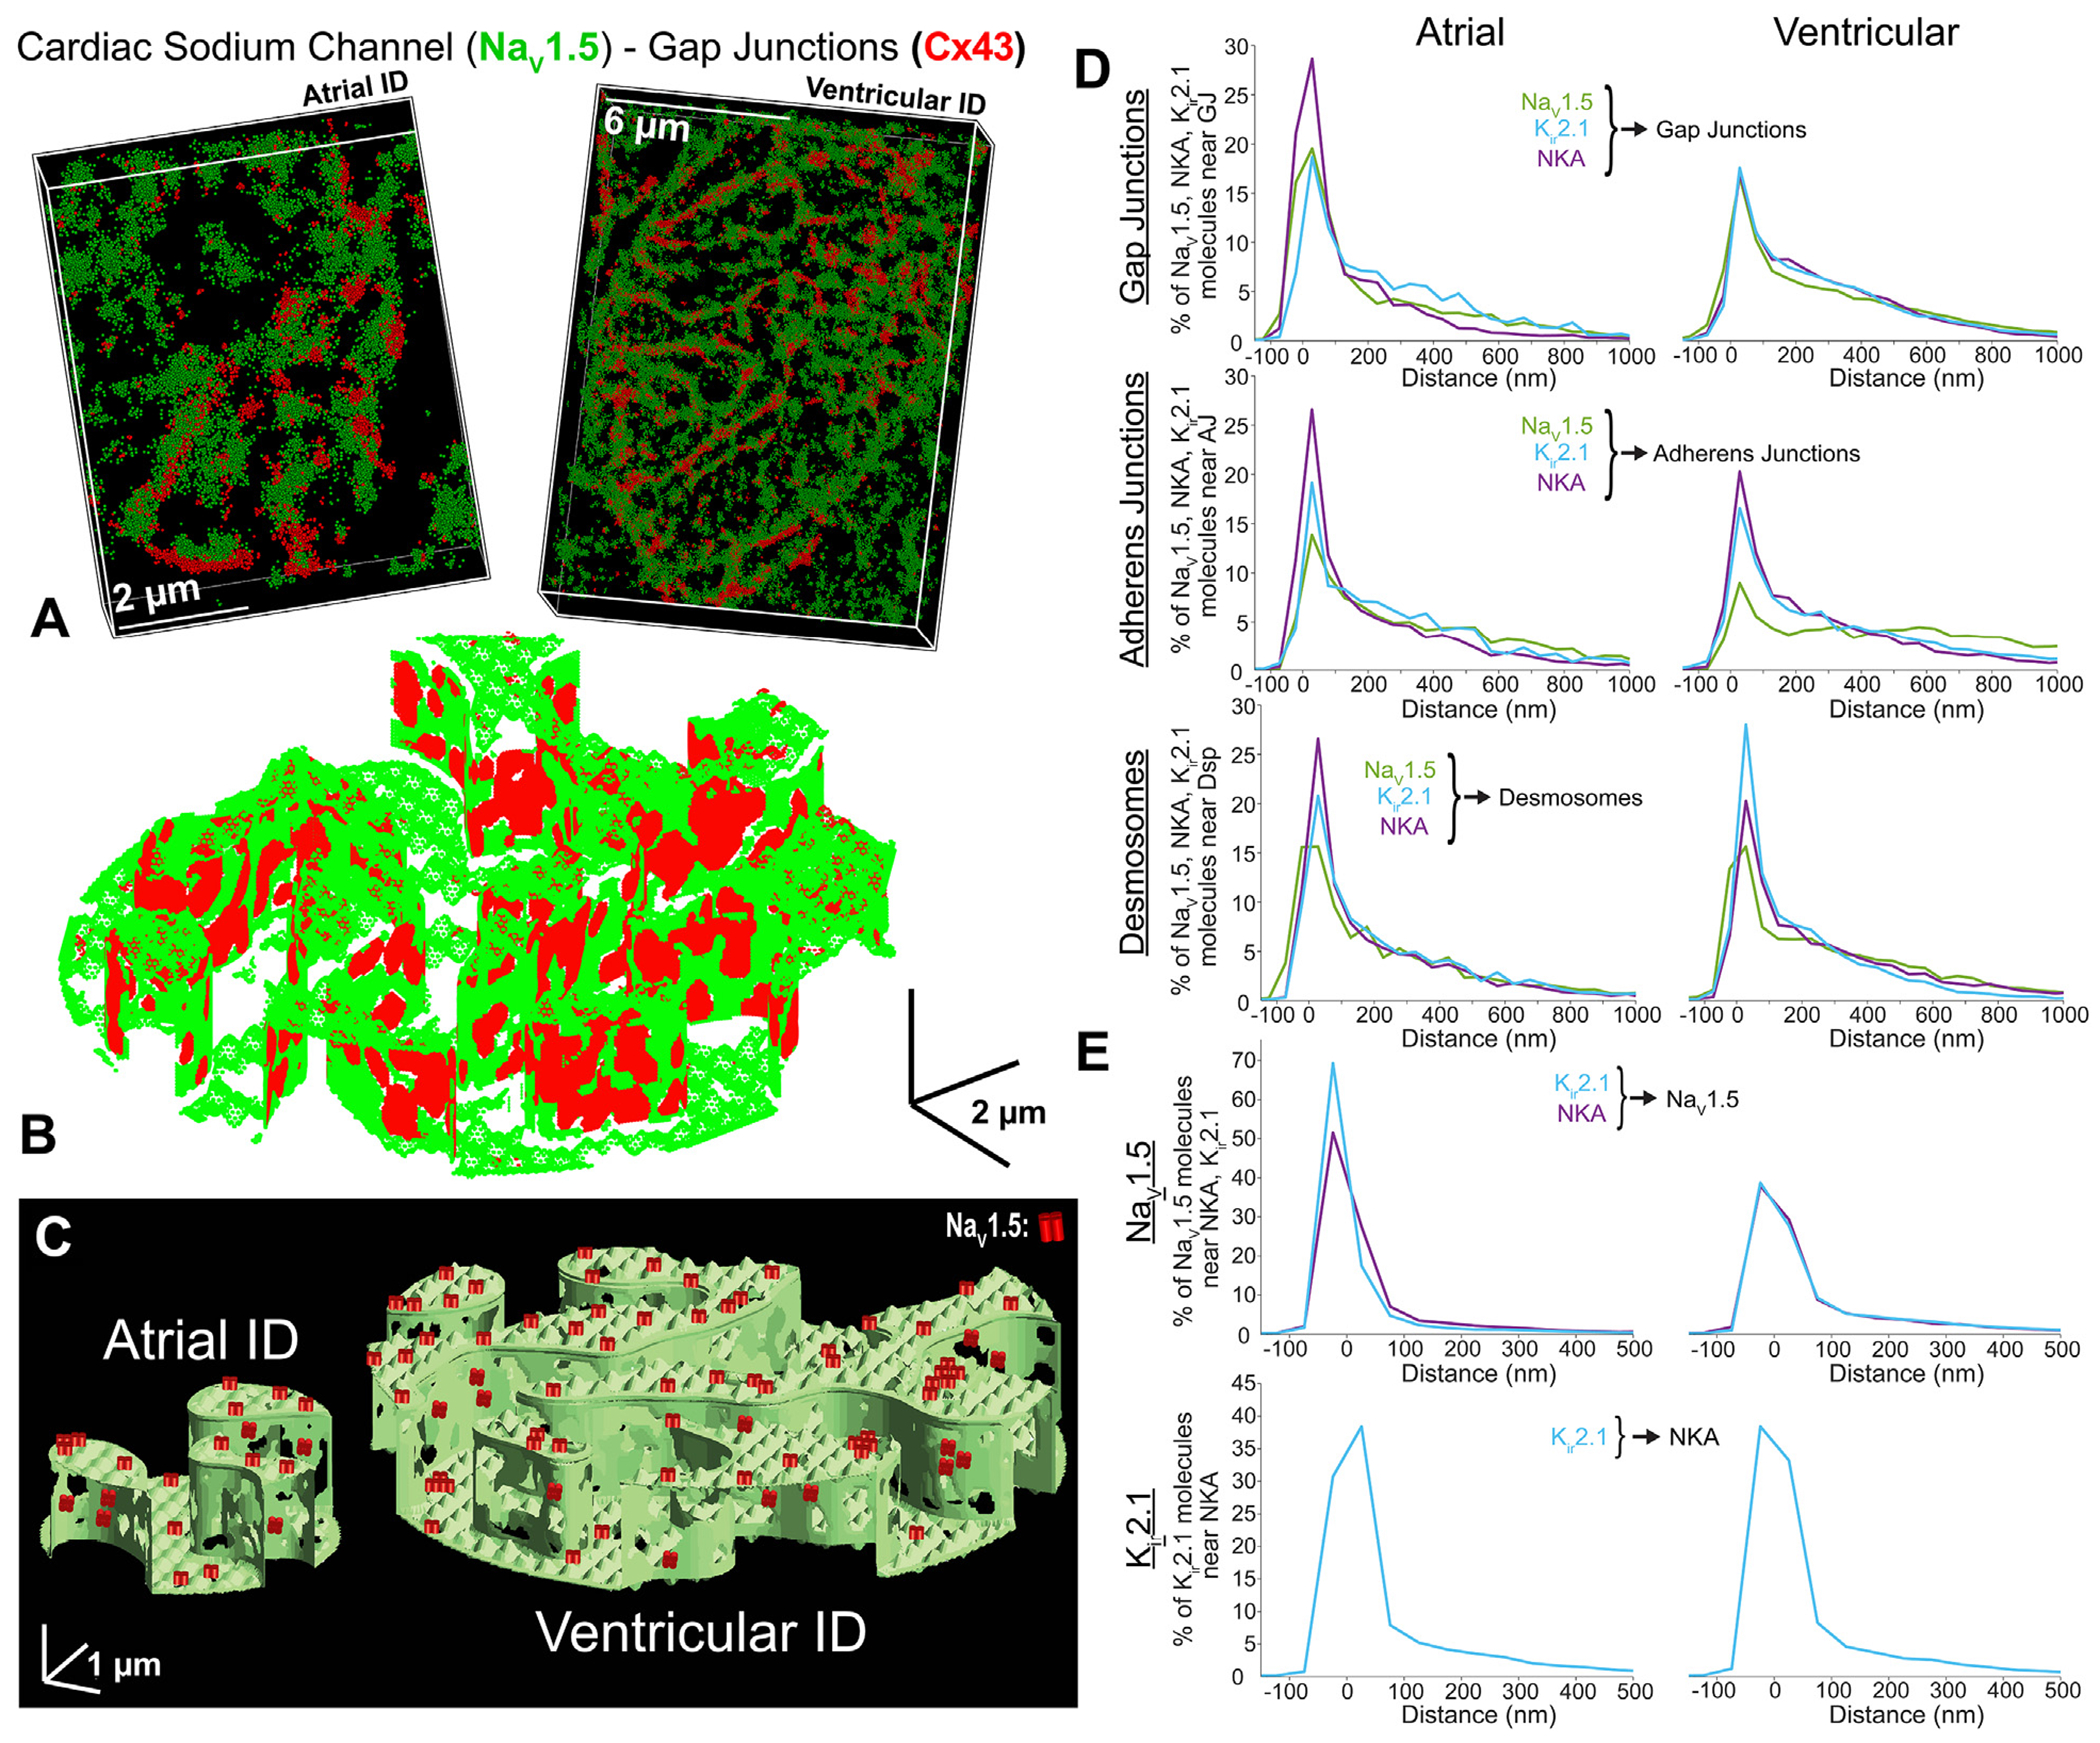
FIGURE 4. NaV1.5, Kir2.1, NKA Channel Distribution Relative to Junctional Proteins.
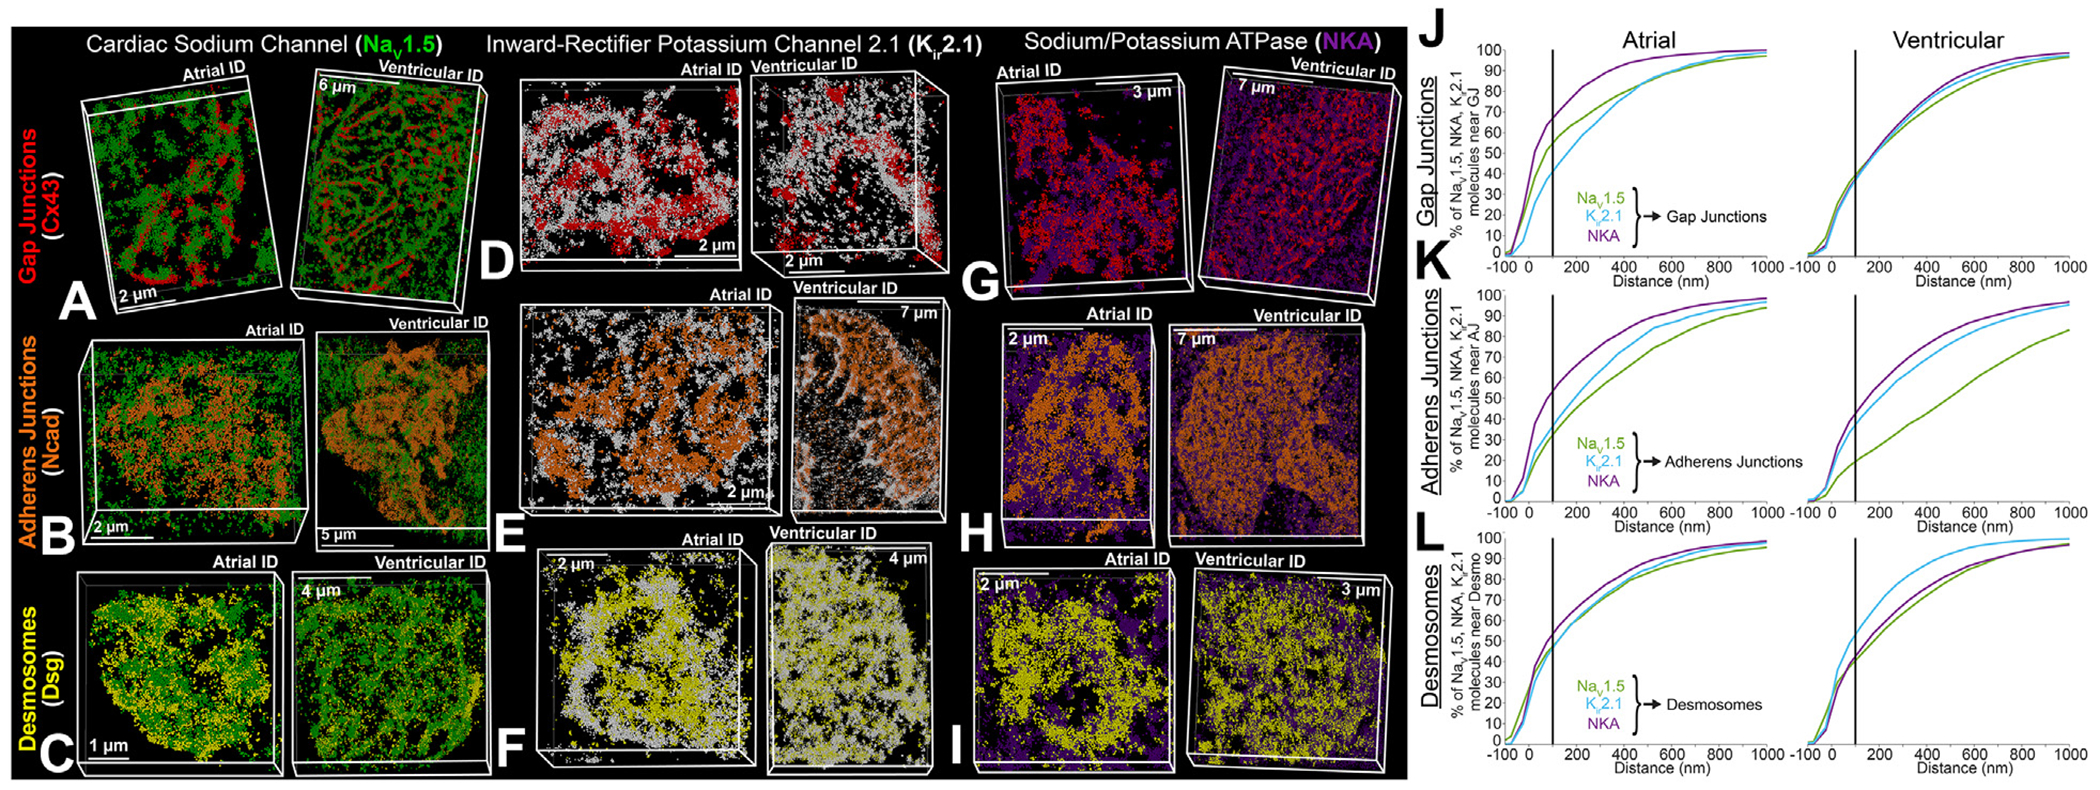
Representative stochastic optical reconstruction microscopy images of atrial and ventricular ID labeled for protein components of cardiac isoform of the voltage-gated sodium channel (NaV1.5) (green), inward-rectifier potassium channel 2.1 (Kir2.1) (white), NKA (purple), gap junctions (Cx43; red), adherens junctions (Ncad; orange), and Dsp (yellow). (A) Cardiac isoform of the voltage-gated sodium channel + gap junctions, (B) cardiac isoform of the voltage-gated sodium channel + adherens junctions, (C) cardiac isoform of the voltage-gated sodium channel + desmosomes, (D) inward-rectifier potassium channel 2.1 + gap junctions, (E) inward-rectifier potassium channel 2.1 + adherens junctions, (F) inward-rectifier potassium channel 2.1 + desmosomes, (G) sodium potassium ATPase + gap junctions, (H) sodium potassium ATPase + adherens junctions, (I) sodium potassium ATPase + desmosomes. Images were presented as whole IDs. Cumulative distributions of electrogenic proteins (NaV1.5 [green], Kir2.1 [light blue], and NKA [purple]) relative to intercalated disc junctions: (J) gap junctions, (K) adherens junctions, and (L) desmosomes. Summary plots show molecule-wise cumulative distributions (n = 5 [atrial], 5 [ventricular] images/heart from 3 hearts). Abbreviations as in Figure 1.
FIGURE 5. Distribution of Electrogenic Proteins Relative to Each Other.
Representative stochastic optical reconstruction microscopy images of atrial and ventricular intercalated disc labeled for protein components of cardiac isoform of the voltage-gated sodium channel (NaV1.5) (green), inward-rectifier potassium channel (Kir2.1; white), and sodium potassium ATPase (NKA; purple). (A) cardiac isoform of the voltage-gated sodium channel + sodium potassium ATPase, (B) cardiac isoform of the voltage-gated sodium channel + inward-rectifier potassium channel, and (C) sodium potassium ATPase + inward-rectifier potassium channel. Cumulative distributions of electrogenic proteins (Kir2.1 [light blue], and NKA [purple]) relative to each other: (D) NaV1.5 relative to Kir2.1 and NKA, (E) Kir2.1 relative to NKA. Summary plots show molecule-wise cumulative distributions (n = 5 [atrial], 5 [ventricular] images/heart from 3 hearts).
SUPER-RESOLUTION MICROSCOPY.
STORM was performed using a Vutara 352 microscope (Bruker Inc) equipped with biplane 3-dimensional detection, and fast scientific complementary metal–oxide–semiconductor (sCMOS) camera achieving 20 nm lateral and <50 nm axial resolution. Individual fluorophore molecules were localized with a precision of 10 nm. Registration of the 2 color channels was accomplished using localized positions of several TetraSpeck Fluorescent Microspheres (ThermoFisher Scientific) scattered throughout the field of view. The 3-dimensional images of en face IDs were collected at 150 frames/z-step. Machine learning-based cluster analysis of single-molecule localization data was performed using STORM-based relative localization analysis, as previously described.14
OPTICAL MAPPING.
Optical mapping of Langendorff-perfused hearts was performed as in previous studies.4,15 Briefly, murine hearts were perfused as Langendorff preparations with an electrolyte solution containing (in mmol/L): 1.8 CaCl2·2H2O, 143 NaCl, 4.2 KCl, 5.5 Dextrose, 1 MgCl2·6H2O, 1.2 NaH2PO4, and 5.5 NaOH (pH 7.42). Temperature was maintained at 36 °C and hearts were electrically stimulated with an AgCl2 pacing electrode placed septally on the anterior epicardium.
Hearts were perfused with the voltage-sensitive fluorophore, di-4-ANEPPS (7.5 μmol/L, Biotium) and positioned to center the anterior descending artery within the field of view. The anterior epicardium was mapped with a MiCAM03-N256 CMOS camera (Sci-Media: 256 × 256 pixels, field of view 11.0 × 11.0 mm, 1.8-kHz frame rate). Motion was reduced with the electromechanical uncoupler blebbistatin (10 μmol/L). For atrial maps, the atria were cut along the septum on the posterior wall and pinned to a sylgard plate for imaging.
Optical signals were recorded at a cycle length of 100 ms, and conduction velocity was calculated using BV Workbench software (version 2.7.2). Transverse conduction velocity is reported as an average of local conduction velocity vectors along the short-axis of cardiac tissue. Longitudinal conduction velocity is reported as an average of local conduction velocity vectors along the long-axis of cardiac tissue. Conduction velocities were measured from the left atrium and left ventricular free wall.
STATISTICAL ANALYSIS.
The 2-sample Kolmogorov-Smirnov test was used to compare whole distributions of measurements between 2 samples. The Wilcoxon rank sum test was used to compare median values between 2 populations for both normal and non-normal data. A P value ≤0.05 was considered statistically significant. Varying degrees of significance are denoted in figures: *P ≤ 0.05, **P ≤ 0.01, ***P ≤ 0.001, and ****P ≤ 0.0001. All measurements are reported as median, mean ± SEM, quantity of measurements (N), and the first and third quartile range. Of note, the following results section provides a brief overview of our results; a more in-depth description providing granular details of specific parameters quantified, including numbers of measurements and biological replicates for each, is included in the Supplemental Appendix (see Supplemental Results, Supplemental Tables 1, 2, and 3).
FINITE ELEMENT MODELING (ULTRASTRUCTURE INTEGRATION AND MOLECULAR INTEGRATION).
Cardiac tissue simulations incorporating the effects of atrial- or ventricular-specific ID nanoscale structure and ion channel organization were based on our recently developed computational model formulation,9 with 2 key additional features (described in the following text). In brief, we used a ‘”rule-based” approach to construct a 3-dimensional finite element mesh of the ID and the intercellular cleft space (ie, space between adjacent myocytes) that reproduce key ID measurements, specifically: ID diameter, plicate and interplicate region length, plicate and interplicate region intermembrane distance, GJ size and distribution in both regions, and plicate fold amplitude and frequency. Structural features (eg, GJ clusters) were generated using a “map” generation algorithm that reproduces the position of individual clusters within the finite element mesh, with the parameters of the algorithm fitted to match the corresponding TEM measurements (eg, GJ size and density, for each ID region). Following this rule-based approach, individual ID components were constructed into a complete mesh of the cleft space, incorporating several orders of magnitude in detail, from intermembrane separation (nanoscale), up to interplicate and plicate regions (microscale).
Although this finite element mesh model of the ID and cleft space captures high-resolution structural detail, incorporation of this mesh into a tissue scale model is not computationally feasible at present. Therefore, we calculated an equivalent electrical network for the resistance within and out of the intercellular cleft space based on the finite element mesh. We calculated this reduced network by partitioning the full mesh into a tractable number (100) of compartments and solving the full electrostatics problem (ie, Laplace’s equation) on each pair of adjacent compartments, for which the solution enables calculation of the equivalent electrical resistance that in turn define the reduced electrical network. Finally, we incorporated this cleft network into a cardiac tissue model, in which neighboring myocytes are coupled via both GJs and their shared intercellular cleft space. The full model description, equations, parameters, and numerical methods are provided in our recent work.9
In our previous simulations, we assumed that all ion channels are uniformly distributed within the ID, such that the conductance of the corresponding ionic currents in each mesh partition is defined as proportional to the partition membrane surface area. Here, we modeled the nonuniform distribution at the ID membranes for NaV1.5, Kir2.1, and NKA. The position of ion channel clusters within the mesh were generated with a similar map algorithm used to generate the mesh GJs.9 In addition to cluster size and density, an additional map parameter defines the likelihood of a cluster based on its distance relative to the nearest GJ, with all parameters defined independently for the plicate and interplicate regions. The nearest-neighbor distribution for the channel-GJ from the mesh generation was directly compared with the corresponding STORM-based distribution, and the MATLAB genetic algorithm optimization (Mathworks) was used to fit map parameters. After thus fitting each electrogenic protein’s spatial distribution separately, we defined the conductance of each ionic current in each mesh partition as proportional to the channel density in each partition, which directly represents the electrogenic protein distribution in the tissue model. Thus, each mesh partition had a fraction of the overall ID conductance for each channel modeled. The ID localization values were (as a fraction of total cell conductance) 0.7 for NaV1.5 and 0.2 for Kir2.1 and NKA. Further, the tissue GJ conductance was scaled by the total GJ area of the generated mesh, with the ventricular GJ area and conductance used as references and atrial GJ conductance was therefore proportional to the fraction between atrial and ventricular total GJ area. Additionally, in our previous simulations, we assumed that only Na+ ions varied in the extracellular cleft space. Here, all ions varied depending on local electrochemical gradients. Specifically, the 3 main cations (Na+, K+ and Ca2+) and a generic anion (A−), included to maintain electroneutrality in the bulk extracellular space, were dynamic and governed by both ID-localized ionic currents and electrodiffusion.
Chamber-specific ionic currents on both the lateral and ID membranes were governed by the ionic models for atrial16 and ventricular17 tissues, respectively. Tissue models, representing a 1-dimensional “chain” of coupled myocytes, were comprised of 50 cells, with either a chamber-specific or a constant cell length. A propagating electrical wave was initiated by stimulating the first cell at a periodic interval of 500 ms. The resulting system of equations was solved by an operator splitting method, in which voltages were solved by an implicit backward Euler method and gating variables and ionic concentrations were solved with the forward Euler method, with a variable time step. Conduction velocity was measured by calculating the propagation time across the middle 50% of the tissue.
RESULTS
Macroscopic differences in atrial and ventricular tissue structure, such as pectinate vs trabecular muscle architecture or differences in wall thickness, are readily apparent (Figure 1A), and their effects on electrophysiology are well established.1,2 However, structural differences between atrial and ventricular IDs, which may underlie conduction differences, have yet to be systematically assessed. Therefore, we set out to quantify structural heterogeneities between the atrial and ventricular IDs on cellular, ultrastructural, and molecular scales. A brief overview of our results is provided in the following text, and a more in depth description providing granular details of specific measurements is included in the Supplemental Appendix.
CARDIOMYOCYTE AND ID DIMENSIONS.
At the cellular scale, ventricular cardiomyocytes were larger than atrial myocytes18–22 with proportionally larger IDs (Figures 1B to 1D, Supplemental Figures 1A to 1C). Ventricular IDs had larger volume and cross-sectional length when compared with atrial IDs (Figure 1D). These results demonstrate that atrial and ventricular IDs are structurally disparate and prompt a more thorough investigation of differences across spatial scales.
ULTRASTRUCTURAL PROPERTIES OF ID SUBDOMAINS.
Next, we characterized ID ultrastructure from microscale through nanoscale via TEM. Within the ID, MJs (adherens junctions, desmosomes) localize predominantly within the plicate subdomain, whereas GJs localize primarily to the interplicate subdomain (Supplemental Figures 2 and 3).9,23–30 Localized to juxta-junctional ID nanodomains are electrogenic proteins crucial for cardiac conduction. Thus, we systematically assessed ID structure at different spatial scales through electron microscopy and used confocal and super-resolution light microscopy to quantify the spatial organization throughout the myocyte and within the ID of ion channels and pumps responsible for the action potential upstroke: NaV1.5 (green), Kir2.1 (white), and NKA (purple) (Supplemental Figure 2, right). In all of these studies, we utilized Cx43 as a marker for GJs at smaller spatial scales and interplicate ID regions at larger scales. Likewise, we utilized N-cad and Dsp as markers of adherens junctions and desmosomes, respectively, at smaller scales and of plicate ID regions at larger scales.
At the subdomain level, the ultrastructure of interplicate and plicate regions were characterized in terms of regional length and percent contribution to total ID length (Supplemental Figure 4). These ultrastructural features are labeled in colors matched with corresponding labels on the TEM figures. Plicate and interplicate subdomains were similar in length between chambers, and there was no substantial difference in plicate and interplicate length or percent contribution to ID length. Next, we characterized nanodomains located within the plicate and interplicate ID regions. Ventricular plicate regions had higher amplitude of membrane waves compared with atrial counterparts, whereas there was no interchamber difference in the frequency of these membrane waves (Figures 6A, 6B, and 6H).23,25,31
FIGURE 6. Intercalated Disc Nanodomain Structures in the Plicate Subdomain.
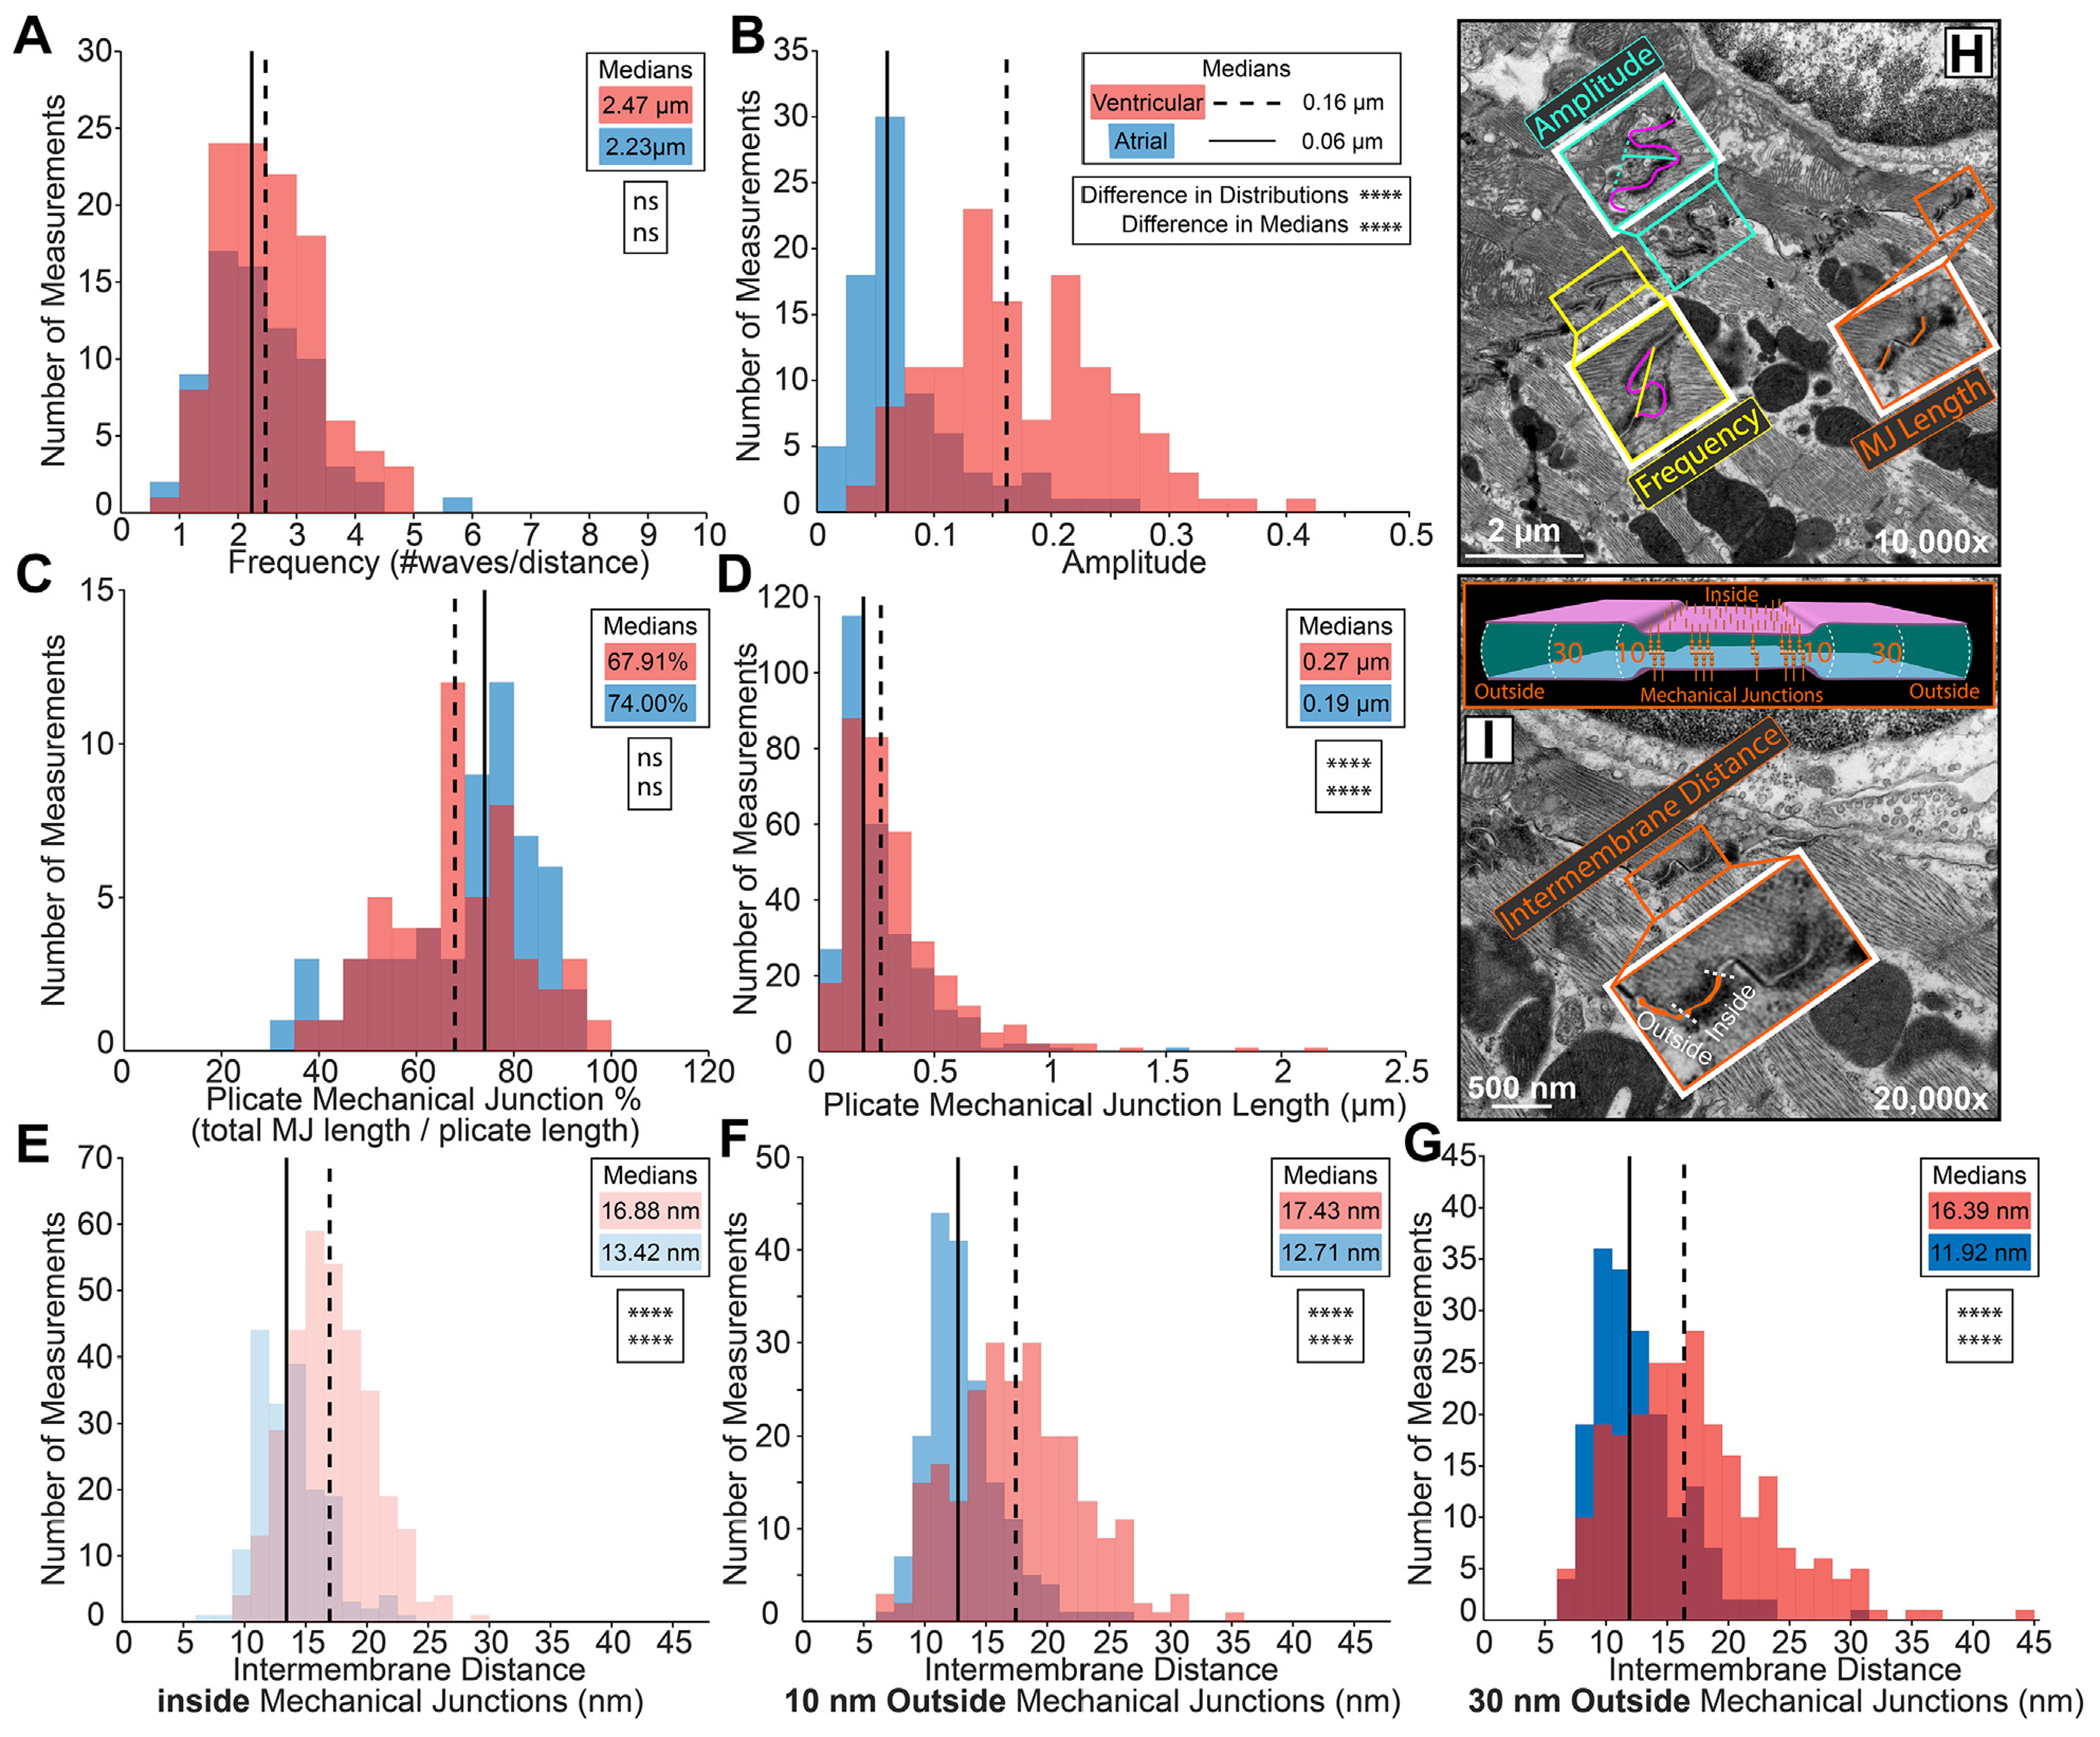
Representative transmission electron microscopy images annotated with intercalated disc nanodomain structural measurements within plicate regions: (H) membrane fold frequency (yellow trace), amplitude (teal trace), mechanical junction (MJ) length (orange trace), (I) intermembrane distance inside and outside (10, 30 nm) MJs (orange fill, cartoon). Plicate fold periodicity was characterized by (A) frequency (n= 72 [atrial], 110 [ventricular] measurements), and (B) amplitude (n= 79 [atrial], 128 [ventricular] measurements). Plicate mechanical junctions were characterized by (C) percentage relative to the plicate region (n = 57 [atrial], 52 [ventricular] measurements), D) length (n = 282 [atrial], 329 [ventricular] measurements), and (E-G) intermembrane distance inside and outside (10, 30 nm) MJs (inside n= 178 [atrial], 323 [ventricular]; 10 nm outside n= 178 [atrial], 241 [ventricular]; and 30 nm outside n= 178 [atrial], 240 [ventricular] measurements). Performed on 3 hearts. Distributions are represented in red for ventricular and blue for atrial measurements. Medians are represented as dashed lines for ventricular and solid lines for atrial measurements. Differences in distributions and medians were statistically proven with 2-sample Kolmogorov-Smirnov test and Wilcoxon signed rank test, respectively (NS = P > 0.05; *P ≤ 0.05; **P ≤ 0.01; ***P ≤ 0.001; ****P ≤ 0.0001).
Although we observed some distinct desmosomes and adherens junctions, a large proportion of area composita were also observed. Therefore, all MJs were pooled into a single category for ultrastructural measurements. Plicate MJ length was smaller in atria than in ventricles; however, MJs accounted for the same percent of ID length in both chambers (Figures 6C, 6D, and 6H). These data suggest that atrial IDs contain more numerous, smaller MJs. Although far less common than MJs, some GJs were observed in the plicate regions. These were smaller yet more numerous in the atria than in the ventricles. The intermembrane distance between the apposed cell membranes was assessed inside MJs as well as 10 and 30 nm outside (Figure 6I). Intermembrane spacing was similar at all positions relative to the MJs, with atria showing a shift toward smaller values when compared with ventricles (Figures 6E to 6G). These data indicate tighter intermembrane spacing within the plicate ID in the atria relative to the ventricles.
Next, we turned our attention to interplicate regions, where GJs were larger and more frequent than in plicate regions (Figure 2). GJs comprised a smaller fraction of interplicate regions (Figure 2A) and were smaller in size in atria than in ventricle (Figures 2B and 2F). Together, these data suggest that atrial IDs contain fewer, smaller GJs resulting in a lower perinexus availability than ventricular IDs. As with GJs in the plicate regions, MJs were rarely found in the interplicate regions. Intriguingly, interplicate MJs were smaller in the ventricles than in the atria, but these structures accounted for similar fractions of interplicate regions in both chambers (Supplemental Figures 3C and 3D). Intermembrane distance was assessed at sites 10, 30, and 50 nm outside GJs (Figure 2F). Intermembrane distances increased with increasing distance from GJs in both chambers (Figures 2C to 2E). At 10 nm, intermembrane distances were similar between the chambers (Figure 2C), whereas at 30 and 50 nm, the ventricles evidenced a larger subpopulation of sites with wider spacing compared with the atria (Figures 2D and 2E). These data suggest tighter intermembrane spacing within the interplicate ID in the atria relative to the ventricles.
Rule-based finite element modeling of multiscale ID structure.
These ultrastructural TEM data were used to generate populations of rule-based finite element models mimicking ID ultrastructure, incorporating structural features from micro to nano scales (Figures 3A and 3B). Utilization of specific ultrastructural measurements are illustrated on representative atrial and ventricular ID finite element meshes (Figures 3A and 3B, Supplemental Table 1). At the largest scale, ventricular cardiomyocytes were longer, wider, and deeper, and had greater volume compared with atrial cardiomyocytes. Thus, ventricular IDs had proportionally greater diameter and volume compared with atrial IDs (Figure 3C). Focusing on plicate subdomains, structural features (fraction of ID comprised of plicate subdomains, plicate subdomain length, fraction of plicate subdomains comprised by MJs, and plicate membrane fold frequency) were largely similar between the 2 chambers. However, plicate subdomains in ventricles displayed larger membrane fold amplitude, MJ length, and intermembrane spacing at/near MJs when compared with atria (Figure 3D). Turning to interplicate subdomains, these regions had similar interplicate domain length and comprised similar fractions of IDs in both chambers. However, GJs were larger and comprised a greater fraction of the interplicate subdomains in the ventricles relative to atria (Figure 3E). Likewise, intermembrane spacing outside interplicate GJs was also greater in the ventricles. These data suggest multiscale differences in ID ultrastructure that may underlie conduction differences between atrial and ventricular myocardium.
SPATIAL DISTRIBUTION OF JUNCTIONAL AND ELECTROGENIC PROTEINS.
The relative distribution of electrogenic proteins (NaV1.5 [green], Kir2.1 [pink], and NKA [purple]) between the ID and other myocyte regions was assessed by confocal microscopy in isolated atrial and ventricular myocytes with the MJ protein, N-cad (orange), serving as a marker for the ID (Supplemental Figure 5). Greater abundance of immunosignals for NaV1.5, Kir2.1, and NKA was observed in atrial myocytes compared with ventricular cells (Supplemental Figures 5G to 5I). NaV1.5 was enriched at the ID to similar degrees in both atrial and ventricular cardiomyocytes. In contrast, atrial cardiomyocytes had greater ID enrichment of Kir2.1 and NKA compared with ventricular cardiomyocytes.
Spatial organization of ID mechanical and electrical junction proteins was further characterized using STORM. First, we examined the distribution of junctional proteins relative to each other. Consistent with our TEM results, MJ proteins N-cad and Dsp localized to ID regions largely distinct from those containing the GJ protein, Cx43 (Supplemental Figure 6). Overall, Cx43 was further separated from Dsp (Supplemental Figures 6E, 6H, and 7) but located closer to N-cad (Supplemental Figures 6D, 6G, and 7) within atrial IDs, compared with ventricular, whereas the relative distribution of N-cad and Dsp was similar between chambers (Supplemental Figures 6F, 6I, and 7).
Next, we assessed the distribution of electrogenic proteins NaV1.5, Kir2.1, and NKA relative to junctional proteins, Cx43, N-cad, and Dsp. All 3, NaV1.5, Kir2.1 and NKA, codistributed with N-cad and Dsp in the plicate regions (Figure 4, Supplemental Figures 8 and 9), while remaining on the periphery of Cx43 clusters (consistent with GJs) in the interplicate regions (Figure 4A, Supplemental Figure 8C). NaV1.5 associated more closely with all 3 junctional proteins within atrial IDs compared with ventricular IDs, the difference being most pronounced near N-cad (Figures 4J to 4L, Supplemental Figures 8D to 8I). Kir2.1 clusters associated similarly with all 3 junctional molecules in both atrial and ventricular IDs. NKA associated more closely with N-cad and Cx43 and less closely with Dsp in atrial IDs compared with ventricular (Figures 4J to 4L, Supplemental Figures 10D to 10I). In addition, NaV1.5, Kir2.1, and NKA clusters displayed lower but more uniform density and volume within atrial IDs relative to ventricular IDs (Supplemental Figures 11A to 11C, 12A to 12C, and 13A to 13C). In both chambers, larger, denser clusters were preferentially localized near junctions.
Last, we assessed the localization of NaV1.5, Kir2.1, and NKA relative to each other. NaV1.5 clusters were mixed with clusters of both NKA and Kir2.1 with surrounding clusters predominantly composed of NKA and Kir2.1 (Figures 5A and 5B, Supplemental Figures 14A and 14B). Similarly, NKA and Kir2.1 organized into mixed clusters but with NKA extending more diffusely in space than Kir2.1 (Figure 5C, Supplemental Figure 14C). NaV1.5 was more closely associated with NKA and Kir2.1 in atrial IDs than ventricular (Figure 5D, Supplemental Figures 14D, 14E, 14G, and 14H). NaV1.5, Kir2.1, and NKA clusters displayed lower but more uniform density and volume within atrial IDs relative to ventricular IDs (Supplemental Figures 15A to 15C). In both chambers, larger, denser clusters of electrogenic proteins were preferentially localized near each other.
Rule-based finite element modeling of ID molecular organization.
Spatial distributions of electrogenic proteins (NaV1.5, Kir2.1, NKA) relative to ID junctional landmarks were next incorporated into our rule-based finite element models of atrial and ventricular IDs (Figures 7A to 7C, Supplemental Table 2). The ultrastructural landmarks (mechanical and electrical junctions) identified by TEM served as reference points to distribute the electrogenic proteins throughout the finite element meshes (Figure 7B). Overall organization of electrogenic proteins relative to junctional landmarks (Figures 4J to 4L and 7D) and each other (Figures 5D, 5E, and 7E) was captured in the form of probability density functions (Figures 7D and 7E) and cumulative distributions (Figures 4J to 4L, 5D, and 5E) of distances within the ID from both chambers.
FIGURE 7. Integration of ID Protein Organization Into Rule-Based Finite Element Model.
Pipeline for integrating protein organization: (A) stochastic optical reconstruction microscopy-based assessment of electrogenic protein distribution relative to junctional landmarks, (B) in silico mapping of electrogenic protein placement relative to landmarks previously established in ultrastructural meshes via transmission electron microscopy, (C) cartoon of electrogenic protein integration into atrial (left) and ventricular (right) ultrastructural meshes. Summary plots of distribution of electrogenic proteins (NaV1.5 [green], Kir2.1 [light blue], and NKA [purple]) (D) relative to intercalated disc junctions (gap junctions, adherens junctions, and desmosomes) and (E) relative to each other. Summary plots show molecule-wise probability distribution functions. Abbreviations as in Figure 5.
Electrogenic proteins were more closely associated with GJs and adherens junctions within atrial IDs, when compared with ventricular IDs (Figures 4J to 4L and 7D). Atrial IDs also displayed greater enrichment of electrogenic proteins near GJs with NKA being closest, followed by NaV1.5 and Kir2.1 (Figure 4J). In contrast, the electrogenic proteins displayed similar patterns of localization relative to adherens junctions and desmosomes in both chambers (Figures 4K to 4L and 7D). NKA was closest to adherens junctions, followed by Kir2.1, and NaV1.5, while all 3 were similarly distributed relative to desmosomes. NaV1.5 channels were more closely associated with NKA and Kir2.1 within atrial IDs when compared with ventricular. Atrial IDs displayed higher prevalence of NaV1.5 closer to Kir2.1 followed by NKA, while ventricular IDs maintained similar NaV1.5 distributions relative to NKA and Kir2.1 (Figures 5D and 7E). There were no discernable differences between atrial and ventricle IDs with respect to the association of Kir2.1 to NKA (Figures 5E and 7E).
FUNCTIONAL IMPLICATIONS OF ID STRUCTURAL ORGANIZATION.
To experimentally validate structure-function relationships predicted by our model, we performed whole-heart optical mapping experiments in Langendorff-perfused mouse hearts. Isochrone maps of activation (Figures 8A and 8B) and action potential traces (Figure 8C) illustrate faster conduction in the ventricles than the atria. Consistent with previous studies,32 both longitudinal and transverse conduction velocities were greater in the ventricles in comparison to the left atrium (Figures 8D and 8E, Supplemental Table 3). Simulations were performed of both atrial and ventricular tissue, integrating measures of cell geometry, ID nanoscale structure, and electrogenic protein organization. Importantly, experimentally observed longitudinal conduction velocities (Figure 8D) displayed close agreement with the computationally predicted values (Figures 8F and 8G), providing direct validation of the model.
FIGURE 8. Functional Implications of Intercalated Disc Structural Heterogeneities.
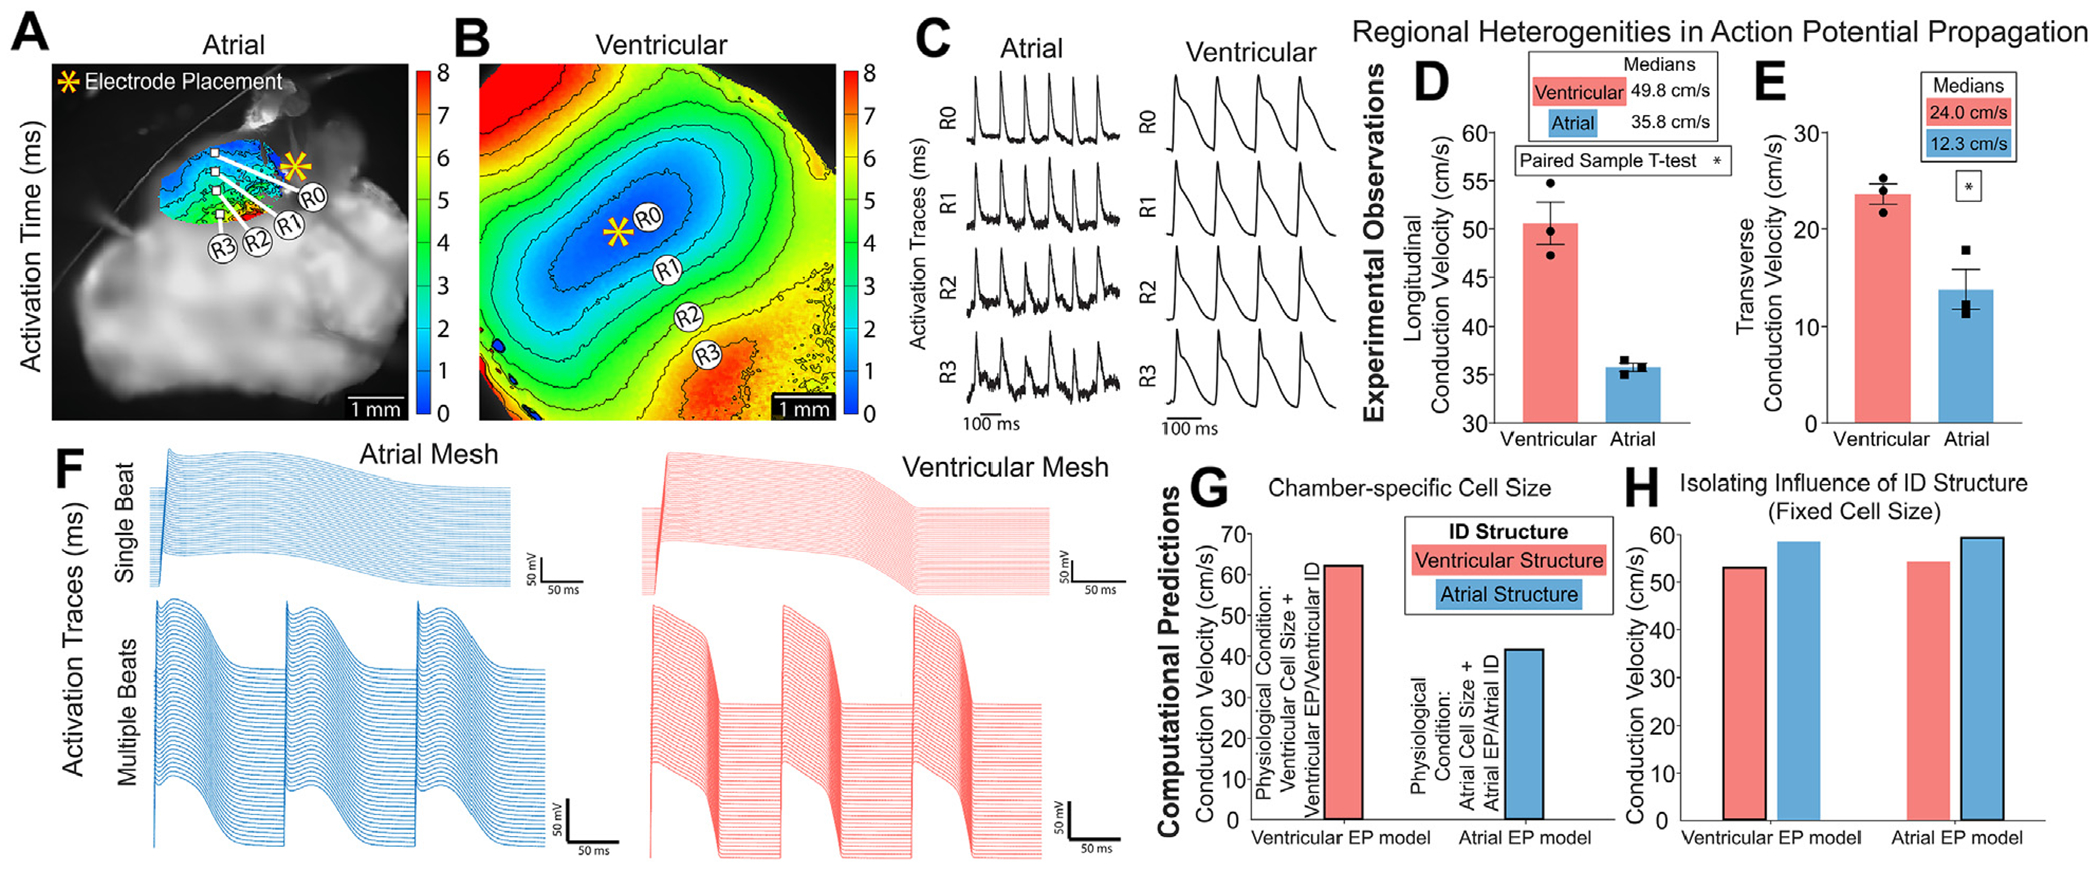
Representative isochrone maps of activation from optical mapping of (A) atrial and (B) ventricular myocardium with (C) action potential duration traces matched to sites overlaid on the image. Propagation across the tissue was captured as (D) longitudinal conduction velocity and (E) transverse conduction velocity (from 3 hearts; *P ≤ 0.5, paired-sample t-test). Functional effects of incorporating atrial and ventricular cellular and intercalated disc (ID) structure into the rule-based finite element model (F-H). Computational model generated (F) action potential traces and longitudinal conduction velocity with (G) chamber-specific cell size and (H) uniform cell length of 100 μm. Outlined bars represent chamber-specific structures integrated with corresponding EP models (ie, atrial structure with atrial EP model).
Finally, we sought to delineate the specific roles of interchamber differences in macro/cellular scale structure vs ID micro/nano structure and molecular organization in determining conduction differences between atria and ventricle. We highlight that this is not experimentally feasible, because myocyte geometry, ID structure, and ionic current properties all vary concurrently between the 2 chambers. To undertake this investigation, we performed tissue simulations with fixed myocyte geometry (ie, equal between atria and ventricles), while retaining other differences in ID structure and simulated tissues with each ID structure and with either atrial or ventricular electrophysiology models. In these simulations, we observed that atrial conduction velocity was faster, independent of the electrophysiology model governing lateral and ID membrane ionic currents (Figure 8H, Supplemental Table 3). Thus, even though on a tissue level atrial conduction is slower compared with ventricular tissue because of the effects of myocyte geometry, atrial IDs are able to support faster conduction than ventricular IDs.
DISCUSSION
Structural differences between atrial and ventricular myocardium are well established at the organ (eg, wall thickness), tissue, and cellular levels (eg, cell size18–22) and are linked to differences in action potential propagation under normal physiological conditions, as well as arrhythmia susceptibility under pathological conditions. However, there is limited data available on structural differences at subcellular scales, particularly vis-à-vis ultrastructure and protein organization at submicron scales. Previous studies have linked disruption of ID nanodomains with severe functional consequences over both acute (deadhesion, edema4,8) and chronic (arrhythmogenic cardiomyopathy, heart failure, atrial fibrillation33–38) time scales. As a key first step toward understanding how ID structure determines function in health and disease, we undertook a systematic comparative study of ID properties in healthy murine atria and ventricles with an eye toward elucidating differences in action potential propagation. By combining experimental and computational modeling approaches, we demonstrate that, once interchamber differences in myocyte geometry are accounted for, atrial IDs possess ultrastructural and molecular organization properties conducive to faster action potential propagation in comparison to their ventricular counterparts.
ID ULTRASTRUCTURE.
Although it has been known for some time that atrial and ventricular IDs differ at the ultrastructural level, previous studies have evaluated specific aspects in isolation and mostly focused on either chamber without direct comparisons between atrial and ventricular IDs. Thus, we systematically compared atrial and ventricular ID ultrastructure using electron microscopy. However, the functional implications of such differences cannot be considered without also considering differences in cardiomyocyte geometry, a key determinant of conduction velocity. Consistent with previous studies in rabbits39 and humans,27 we found murine atrial cardiomyocytes to be smaller in length, width, depth, and volume than ventricular cardiomyocytes. Next, we systematically assessed ID structural properties ranging from overall size at the microscale down to intermembrane spacing at the nanoscale (Supplemental Table 1) and compared our results with previous reports, where available. Overall, atrial IDs were smaller than ventricular IDs; however, the fractions of IDs comprised by plicate and interplicate regions were similar between chambers. Atrial IDs had smaller MJs and tighter intermembrane spaces near both mechanical and GJs compared with ventricular IDs. Within plicate subdomains, we found no significant difference between chambers in membrane fold frequency, as previously reported in humans.27 We also measured fold amplitudes similar to previous measurements in murine ventricular tissue,40–42 and MJ lengths and intermembrane distances similar to previous data from human ventricular tissue.35 Within interplicate subdomains, we measured similar GJ lengths to previous data from human ventricular tissue.35 In addition to highlighting chamber-specific differences, the close alignment between our ultrastructural measurements in mice and previous studies from other mammalian species may suggest a degree of evolutionarily conserved ID properties. It should be noted, however, that certain properties, such as the distribution of GJs within the ID, show species-specific differences, particularly between rodents and primates.43
ID MOLECULAR ORGANIZATION.
Previous studies indicate that cardiac conduction is strongly influenced by ion channel localization to specialized ID nanodomains.3–7 Therefore, we characterized the molecular organization of key electrogenic proteins directly associated with cardiac excitability, NaV1.5, Kir2.1, and NKA, at the cellular and ID levels. Consistent with previous studies in multiple mammalian species, we observed NaV1.5,6,44–47 Kir2.1,6,48–53 and NKA (α1 subunit)11,54–56 localizing to ID, lateral sarcolemma, and transverse tubules using confocal microscopy, with NaV1.5, in particular, showing marked enrichment at the ID. However, these previous reports were largely qualitative, precluding direct comparisons with our quantitative measurements. Interestingly, we observed more abundant immunosignals for NaV1.5, Kir2.1, and NKA at both ID and non-ID sites in atrial cardiomyocytes than in ventricular cardiomyocytes.
Previous studies have established the local enrichment of NaV1.5 near adherens junctions and GJs in ventricular tissue/cardiomyocytes from mice, guinea pigs, and rats.4,24,44,57,58 Furthermore, nanoscale shifts in ion channel localization within the ID and/or disruption of ion channel-rich nanodomains have been linked to proarrhythmic conduction defects in both acute8 and chronic disease states.33,34,36 Yet, little is known about the intra-ID distributions of Kir2.1 and NKA and their spatial relationship to NaV1.5. Therefore, we used super-resolution microscopy to systematically assess the localization of these electrogenic proteins to GJ- and MJ-associated ID nanodomains. NaV1.5 had closer association to GJs and MJs within atrial IDs compared with ventricular. Kir2.1 was equally enriched near GJs and MJs in both chambers. NKA associated more closely with adherens junctions and GJs within atrial IDs, whereas in ventricular IDs, NKA associated more closely with desmosomes. Next, we examined the localization of the electrogenic proteins relative to each other: NaV1.5 associated more closely with NKA and Kir2.1 in atrial IDs than in ventricular, while the localization of Kir2.1 relative to NKA was consistent between GJs and MJs in both chambers.
FUNCTIONAL IMPLICATIONS OF ID STRUCTURE.
It has long been recognized that conduction in the healthy heart is faster in ventricular than in atrial myocardium,32,59–63 an observation we recapitulate here. However, these conduction differences have been largely ascribed to differences in myocyte geometry2 with little known about the functional implications of interchamber differences in ID structure. This stems from current experimental methods lacking the spatial resolution to assess conduction at the scale of individual IDs. Although conduction -dependence on subcellular structure at such scales has been studied via computational models, most included no representation of the ID, and even recent modeling studies have grossly oversimplified ID structure.3,5,7,44,64,65 This was largely a result of available data on multiscale ID structure being sparse, fragmentary, and limited to simple measures of central tendency (thus, not capturing complex variability). We provide here the first ever comprehensive quantification of ID structure and molecular organization across multiple spatial scales. Further, we provide measurements from both left atria and left ventricular free wall tissue, laying the groundwork for future efforts to more closely sample spatial heterogeneities.
We also demonstrate here a novel approach to generate populations of IDs in silico using quantitative multiscale data from light and electron microscopy and a method to uncover key structure-function relationships by incorporating them into physiological models of propagation. This builds on our recent publication that demonstrated the first computational model to incorporate 3-dimensional ID ultrastructure derived from electron microscopy.9 Even lacking the molecular organization data included here, that model revealed previously unappreciated dependence of conduction on ID structure: the presence of larger GJs at the ID periphery increased conduction velocity, and intermembrane distance in the interplicate regions had a GJ coupling-dependent biphasic influence on conduction. Here, we present a major step forward, incorporating experimentally measured cell size, ultrastructure, and protein organization of atrial and ventricular IDs to identify chamber-specific mechanisms of conduction.
These chamber-specific models closely recapitulated optical mapping measurements of atrial and ventricular conduction velocities made under physiological conditions. As an early foray to elucidate conduction dependence on ID structure, we equalized cell size between the ventricular and atrial models. This approach revealed that atrial IDs support faster conduction than ventricular IDs, which is masked by cell size under normal physiological conditions. Identifying important directions for more indepth mechanistic modeling studies, these studies point to specific aspects of ID structure at different scales that contribute to faster conduction through atrial IDs: compared with ventricular IDs, atrial IDs maintain tighter intermembrane spaces near MJs and GJs; display greater abundance of NaV1.5, Kir2.1, and NKA; and have NaV1.5 more closely associating with GJs and MJs. Although increased NaV1.5 expression is an established contributor to faster conduction, previous studies from us and others3,5,7,66 have also identified close membrane apposition and NaV1.5 enrichment at juxtajunctional ID sites as factors that promote faster conduction. Importantly, disruption of these juxtajunctional ID nanodomains and loss of NaV1.5 from such sites have been linked with proarrhythmic conduction defects in both atria and ventricles in animal models as well as human patients.4,8,33 In addition to the aforementioned factors, atrial IDs also have NKA localized closer to adherens junctions and GJs, and NaV1.5 associated more closely with NKA and Kir2.1. Taken together, the ultrastructure and molecular organization of atrial IDs may support more robust excitability, especially at faster heart rates.
Thus, our work provides the first quantitative multiscale data set capturing ID structure and molecular organization across spatial scales, and demonstrates a pipeline for generating such data and integrating them into mechanistic models to query functional implications. Our early mechanistic studies here highlight previously unrecognized aspects of ID structure, which when remodeled in disease states, can contribute to proarrhythmic conduction defects, motivating more in-depth studies into such structure-function relationships under different conditions of health and disease. Indeed, in ongoing work, we are undertaking similar studies following acute perturbation of ID structure using peptide inhibitors of different adhesion proteins. In addition to experimental perturbations of ID structure, simulations can directly probe the mechanisms underlying the conduction differences for atrial vs ventricular ID structure. Future modeling studies will systematically investigate the role of key ID structural features on electrical conduction. Together, such studies will provide a basis for identifying the most mechanistically impactful aspects of pathological remodeling, paving the way towards novel therapies.
STUDY LIMITATIONS.
Given that the present work only utilized male mice, future work is needed to provide detailed comparisons of ID structure between male and female hearts, as well as comparisons with nonmurine mammalian species, especially human. Secondly, future work must also expand to include nonmyocyte cells, which play key roles modulating the behavior of cardiac myocytes. Our ability to precisely resolve protein localization is limited by linkage error resulting from the use of antibodies. Future work with fluorescently tagged nanobodies can help minimize this issue. Last, given that our electron microscopy was performed on thin sections, some variation in measurements such as intermembrane spacing reflects variations in the orientation of ID structures relative to the section plane. However, for the purposes of interchamber comparisons, this issue is mitigated by our use of large numbers of measurements from multiple samples. Even so, future work using high-resolution volume electron microscopy can directly address this issue, provided that approaches for high-throughput segmentation of 3-dimensional electron microscopy data are developed.
CONCLUSIONS
We provide here the first ever systematic quantification of ID ultrastructure and molecular organization from healthy adult murine atria and ventricles.Our combined experimental and computational modeling studies revealed that atrial IDs can support faster conduction than ventricular IDs, which is normally masked by inter-chamber differences in myocyte geometry (Central Illustration). Further, we identify key ultrastructural and molecular organization features underpinning the ability of atrial IDs to support faster conduction.
CENTRAL ILLUSTRATION. Multiscale Experimental and Modeling Studies Elucidate Cardiac Conduction Dependence on Intercalated Disc Structure.
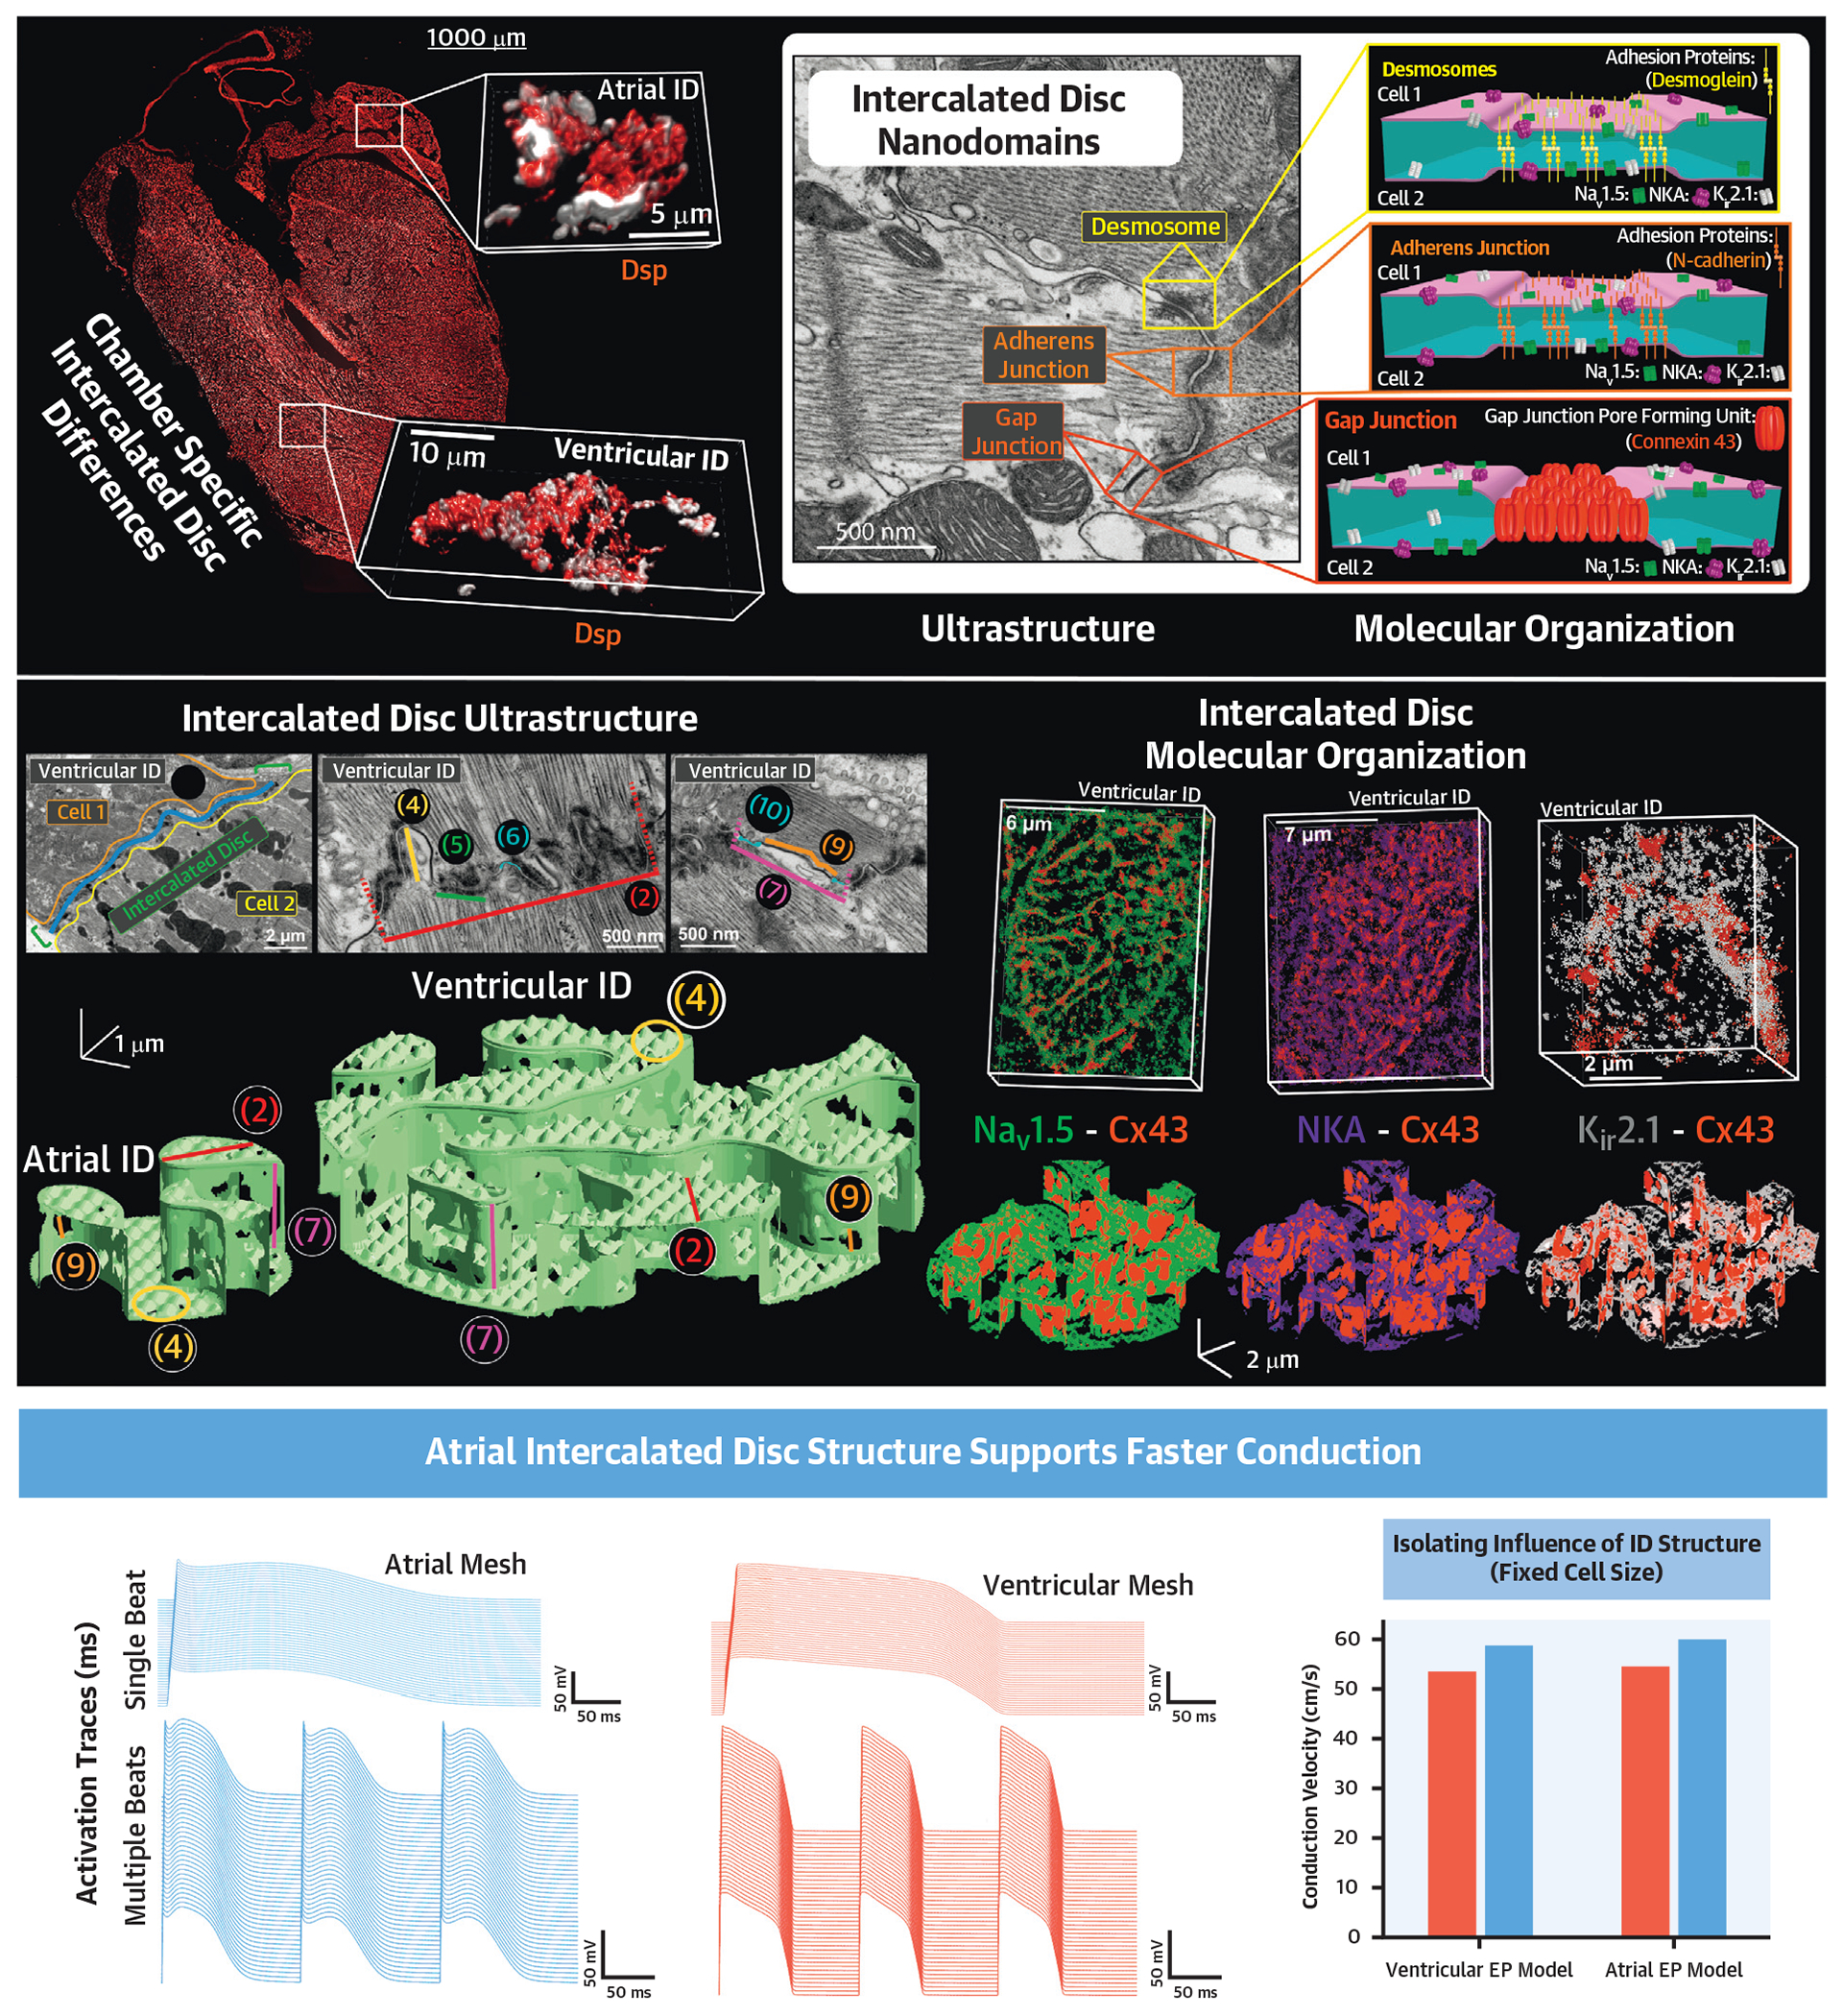
(Top) ConfocaL image of a frontal section of a mouse heart illustrating chamber-specific differences in intercalated disc (ID) size and structure. Inset: Electron micrograph and cartoons highlighting juxta-junctional nanodomains within the ID, which play key roles in action potential propagation. (Middle) Incorporation of electron microscopy-derived ultrastructural measurements and super-resolution microscopy-derived measurements of molecular organization into finite element models of atrial and ventricular IDs. (Bottom) Incorporation of finite element models of IDs into functional physiological models reveals that, once cell size differences are accounted for, atrial IDs support faster conduction. Cx43 = connexin43; Kir2.1 = inward-rectifying potassium channel; NaV1.5 = cardiac isoform of the voltage-gated sodium channel; NKA = sodium/potassium ATPase.
Supplementary Material
PERSPECTIVES.
COMPETENCY IN MEDICAL KNOWLEDGE:
Our novel results highlight a previously unappreciated role for ID ultrastructure and molecular organization in determining conduction heterogeneities in the heart.
TRANSLATIONAL OUTLOOK:
Given that various aspects of ID structure are remodeled in various arrhythmic diseases, our data serve as the first stepping stone to elucidating chamber-specific effects of such pathological remodeling and will help identify rational targets for antiarrhythmic therapy in diseases where ID remodeling occurs.
ACKNOWLEDGMENTS
The authors would like to thank Ms Sarah Mikula and Mr Jeff Tonniges from the OSU Campus Microscopy and Imaging Facility for preparing the electron microscopy samples for this study, and Drs. Sandor Györke, Thomas Hund, and Dmitry Terentyev for fruitful discussions.
FUNDING SUPPORT AND AUTHOR DISCLOSURES
This work was supported by National Institutes of Health R01 grants (HL148736 awarded to Dr Veeraraghavan, HL138003 awarded to Dr Weinberg, and R01HL155378 and R01 NS121234 awarded to Dr Radwański) as well as an American Heart Association grant (20TPA35460040) awarded to Dr Veeraraghavan, an American Heart Association Predoctoral Fellowship awarded to Dr Struckman, an American Heart Association Postdoctoral Fellowship awarded to Dr Moise, and an National Institutes of Health T32 (HL149637-02) and L40 (NS129034) awarded to Dr King. All other authors have reported that they have no relationships relevant to the contents of this paper to disclose.
ABBREVIATIONS AND ACRONYMS
- GJ
gap junction
- ID
intercalated disc
- Kir2.1
Inward-rectifying potassium channel
- MJ
mechanical junction
- NaV1.5
cardiac isoform of the voltage-gated sodium channel
- NKA
sodium/potassium ATPase
- STORM
stochastic optical reconstruction microscopy
Footnotes
APPENDIX For an expanded Results section and supplemental figures and tables, please see the online version of this paper.
REFERENCES
- 1.Veeraraghavan R, Gourdie RG, Poelzing S. Mechanisms of cardiac conduction: a history of revisions. Am J Physiol Heart Circ Physiol. 2014;306:H619–H627. [DOI] [PMC free article] [PubMed] [Google Scholar]
- 2.Kleber AG, Rudy Y. Basic mechanisms of cardiac impulse propagation and associated arrhythmias. Physiol Rev. 2004;84:431–488. [DOI] [PubMed] [Google Scholar]
- 3.Nowak MB, Veeraraghavan R, Poelzing S, Weinberg SH. Cellular size, gap junctions, and sodium channel properties govern developmental changes in cardiac conduction. Front Physiol. 2021;12:731025. [DOI] [PMC free article] [PubMed] [Google Scholar]
- 4.Veeraraghavan R, Hoeker GS, ALvarez-Laviada A, et al. The adhesion function of the sodium channel beta subunit (beta1) contributes to cardiac action potential propagation. Elife. 2018;7:e37610. 10.7554/eLife.37610 [DOI] [PMC free article] [PubMed] [Google Scholar]
- 5.Hichri E, Abriel H, Kucera JP. Distribution of cardiac sodium channels in clusters potentiates ephaptic interactions in the intercalated disc. J Physiol. 2018;596:563–589. [DOI] [PMC free article] [PubMed] [Google Scholar]
- 6.Milstein ML, Musa H, Balbuena DP, et al. Dynamic reciprocity of sodium and potassium channel expression in a macromolecular complex controls cardiac excitability and arrhythmia. Proc Natl Acad Sci U S A. 2012;109:E2134–E2143. [DOI] [PMC free article] [PubMed] [Google Scholar]
- 7.Kucera JP, Rohr S, Rudy Y. Localization of sodium channels in intercalated disks modulates cardiac conduction. Circ Res. 2002;91:1176–1182. [DOI] [PMC free article] [PubMed] [Google Scholar]
- 8.Mezache L, Struckman HL, Greer-Short A, et al. Vascular endothelial growth factor promotes atrial arrhythmias by inducing acute intercalated disk remodeling. Sci Rep. 2020;10:20463. [DOI] [PMC free article] [PubMed] [Google Scholar]
- 9.Moise N, Struckman HL, Dagher C, Veeraraghavan R, Weinberg SH. Intercalated disk nanoscale structure regulates cardiac conduction. J Gen Physiol. 2021;153(8):e202112897. [DOI] [PMC free article] [PubMed] [Google Scholar]
- 10.Struckman HL, Baine S, Thomas J, et al. Super-resolution imaging using a novel high-fidelity antibody reveals close association of the neuronal sodium channel Na(V)1.6 with ryanodine receptors in cardiac muscle. Microsc Microanal. 2020;26:157–165. [DOI] [PMC free article] [PubMed] [Google Scholar]
- 11.Chen Z, Sung YL, Chen PS, Li X, Guo J. Na(+), K(+)-Pump/Phospholemman Are Concentrated at Intercalated Discs for Conduction. Circ Res. 2022;131:283–285. [DOI] [PMC free article] [PubMed] [Google Scholar]
- 12.Lam F, Cladiere D, Guillaume C, Wassmann K, Bolte S. Super-resolution for everybody: An image processing workflow to obtain high-resolution images with a standard confocal microscope. Methods. 2017;115:17–27. [DOI] [PubMed] [Google Scholar]
- 13.Bogdanov V, Soltisz AM, Moise N, et al. Distributed synthesis of sarcolemmal and sarcoplasmic reticulum membrane proteins in cardiac myocytes. Basic Res Cardiol. 2021;116:63. [DOI] [PMC free article] [PubMed] [Google Scholar]
- 14.Veeraraghavan R, Gourdie RG. Stochastic optical reconstruction microscopy-based relative localization analysis (STORM-RLA) for quantitative nanoscale assessment of spatial protein organization. Mol Biol Cell. 2016;27:3583–3590. [DOI] [PMC free article] [PubMed] [Google Scholar]
- 15.King DR, Entz M 2nd, Blair GA, et al. The conduction velocity-potassium relationship in the heart is modulated by sodium and calcium. Pflugers Arch. 2021;473:557–571. [DOI] [PMC free article] [PubMed] [Google Scholar]
- 16.Courtemanche M, Ramirez RJ, Nattel S. Ionic mechanisms underlying human atrial action potential properties: insights from a mathematical model. Am J Physiol. 1998;275:H301–H321. [DOI] [PubMed] [Google Scholar]
- 17.O’Hara T, Virag L, Varro A, Rudy Y. Simulation of the undiseased human cardiac ventricular action potential: model formulation and experimental vaLidation. PLoS Comput Biol. 2011;7:e1002061. [DOI] [PMC free article] [PubMed] [Google Scholar]
- 18.Veeraraghavan R, Salama ME, Poelzing S. Interstitial voLume modulates the conduction velocity-gap junction relationship. Am J Physiol Heart Circ Physiol. 2012;302:H278–H286. [DOI] [PMC free article] [PubMed] [Google Scholar]
- 19.Campbell SE, Rakusan K, Gerdes AM. Change in cardiac myocyte size distribution in aortic-constricted neonatal rats. Basic Res Cardiol. 1989;84:247–258. [DOI] [PubMed] [Google Scholar]
- 20.Campbell SE, Gerdes AM. Regional changes in myocyte size during the reversal of thyroid-induced cardiac hypertrophy. J Mol Cell Cardiol. 1988;20:379–387. [DOI] [PubMed] [Google Scholar]
- 21.Campbell SE, Gerdes AM. Regional differences in cardiac myocyte dimensions and number in Sprague-Dawley rats from different suppliers. Proc Soc Exp Biol Med. 1987;186:211–217. [DOI] [PubMed] [Google Scholar]
- 22.Campbell SE, Gerdes AM, Smith TD. Comparison of regional differences in cardiac myocyte dimensions in rats, hamsters, and guinea pigs. Anat Rec. 1987;219:53–59. [DOI] [PubMed] [Google Scholar]
- 23.Schinner C, Vielmuth F, Rotzer V, et al. Adrenergic signaling strengthens cardiac myocyte cohesion. Circ Res. 2017;120:1305–1317. [DOI] [PubMed] [Google Scholar]
- 24.Leo-Macias A, Agullo-Pascual E, Sanchez-Alonso JL, et al. Nanoscale visualization of functional adhesion/excitability nodes at the intercalated disc. Nat Commun. 2016;7:10342. [DOI] [PMC free article] [PubMed] [Google Scholar]
- 25.Mezzano V, Pellman J, Sheikh F. Cell junctions in the specialized conduction system of the heart. Cell Commun Adhes. 2014;21:149–159. [DOI] [PMC free article] [PubMed] [Google Scholar]
- 26.Shimada T, Kawazato H, Yasuda A, Ono N, Sueda K. Cytoarchitecture and intercalated disks of the working myocardium and the conduction system in the mammalian heart. Anat Rec A Discov Mol Cell Evol Biol. 2004;280:940–951. [DOI] [PubMed] [Google Scholar]
- 27.Miyamoto T, Zhang L, Sekiguchi A, Hadama T, Shimada T. Structural differences in the cytoarchitecture and intercalated discs between the working myocardium and conduction system in the human heart. Heart Vessels. 2002;16:232–240. [DOI] [PubMed] [Google Scholar]
- 28.Zhang L, Ina K, Kitamura H, Campbell GR, Shimada T. The intercalated disc of monkey myocardial cells and Purkinje fibers as revealed by scanning electron microscopy. Arch Histol Cytol. 1996;59:453–454. [DOI] [PubMed] [Google Scholar]
- 29.Hoyt RH, Cohen ML, Saffitz JE. Distribution and three-dimensional structure of intercellular junctions in canine myocardium. Circ Res. 1989;64:563–574. [DOI] [PubMed] [Google Scholar]
- 30.Forbes MS, Sperelakis N. Intercalated discs of mammalian heart: a review of structure and function. Tissue Cell. 1985;17:605–648. [DOI] [PubMed] [Google Scholar]
- 31.Vanslembrouck B, Kremer A, Pavie B, van Roy F, Lippens S, van Hengel J. Three-dimensional reconstruction of the intercalated disc including the intercellular junctions by applying voLume scanning electron microscopy. Histochem Cell Biol. 2018;149:479–490. [DOI] [PubMed] [Google Scholar]
- 32.Lane JD, Montaigne D, Tinker A. Tissue-level cardiac electrophysiology studied in murine myocardium using a microelectrode array: autonomic and thermal modulation. J Membr Biol. 2017;250:471–481. [DOI] [PMC free article] [PubMed] [Google Scholar]
- 33.Raisch TB, Yanoff MS, Larsen TR, et al. Intercalated disk extracellular nanodomain expansion in patients with atrial fibrillation. Front Physiol.. 2018;9:398. [DOI] [PMC free article] [PubMed] [Google Scholar]
- 34.Rizzo S, Lodder EM, Verkerk AO, et al. Intercalated disc abnormalities, reduced Na(+) current density, and conduction slowing in desmoglein-2 mutant mice prior to cardiomyopathic changes. Cardiovasc Res. 2012;95:409–418. [DOI] [PubMed] [Google Scholar]
- 35.Basso C, Czarnowska E, Della Barbera M, et al. Ultrastructural evidence of intercalated disc remodelling in arrhythmogenic right ventricular cardiomyopathy: an electron microscopy investigation on endomyocardial biopsies. Eur Heart J. 2006;27:1847–1854. [DOI] [PubMed] [Google Scholar]
- 36.Kaplan SR, Gard JJ, Protonotarios N, et al. Remodeling of myocyte gap junctions in arrhyth-mogenic right ventricular cardiomyopathy caused by a deletion in plakoglobin (Naxos disease). Heart Rhythm. 2004;1:3–11. [DOI] [PubMed] [Google Scholar]
- 37.Severs NJ, Coppen SR, Dupont E, Yeh HI, Ko YS, Matsushita T. Gap junction alterations in human cardiac disease. Cardiovasc Res. 2004;62:368–377. [DOI] [PubMed] [Google Scholar]
- 38.Perriard JC, Hirschy A, Ehler E. Dilated cardiomyopathy: a disease of the intercalated disc? Trends Cardiovasc Med. 2003;13:30–38. [DOI] [PubMed] [Google Scholar]
- 39.Severs NJ. The cardiac gap junction and intercalated disc. Int J Cardiol. 1990;26:137–173. [DOI] [PubMed] [Google Scholar]
- 40.Vanslembrouck B, Kremer A, VANR F, Lippens S, VANH J. Unravelling the ultrastructural details of alphaT-catenin-deficient cell-cell contacts between heart muscle cells by the use of FIB-SEM. J Microsc. 2020;279:189–196. [DOI] [PubMed] [Google Scholar]
- 41.Wilson AJ, Schoenauer R, Ehler E, Agarkova I, Bennett PM. Cardiomyocyte growth and sarcomerogenesis at the intercalated disc. Cell Mol Life Sci. 2014;71:165–181. [DOI] [PMC free article] [PubMed] [Google Scholar]
- 42.Bennett PM, Maggs AM, Baines AJ, Pinder JC. The transitional junction: a new functional sub-cellular domain at the intercalated disc. Mol Biol Cell. 2006;17:2091–2100. [DOI] [PMC free article] [PubMed] [Google Scholar]
- 43.Gourdie RG, Green CR, Severs NJ. Gap junction distribution in adult mammalian myocardium revealed by an anti-peptide antibody and laser scanning confocal microscopy. J Cell Sci. 1991;99(Pt 1):41–55. [DOI] [PubMed] [Google Scholar]
- 44.Veeraraghavan R, Lin J, Hoeker GS, Keener JP, Gourdie RG, Poelzing S. Sodium channels in the Cx43 gap junction perinexus may constitute a cardiac ephapse: an experimental and modeling study. Pflugers Arch. 2015;467:2093–2105. [DOI] [PMC free article] [PubMed] [Google Scholar]
- 45.Makara MA, Curran J, Little SC, et al. Ankyrin-G coordinates intercalated disc signaling platform to regulate cardiac excitability in vivo. Circ Res. 2014;115:929–938. [DOI] [PMC free article] [PubMed] [Google Scholar]
- 46.Petitprez S, Zmoos AF, Ogrodnik J, et al. SAP97 and dystrophin macromolecular complexes determine two pools of cardiac sodium channels Nav1.5 in cardiomyocytes. Circ Res. 2011;108:294–304. [DOI] [PubMed] [Google Scholar]
- 47.Mohler PJ, Rivolta I, Napolitano C, et al. Nav1.5 E1053K mutation causing Brugada syndrome blocks binding to ankyrin-G and expression of Nav1.5 on the surface of cardiomyocytes. Proc Natl Acad Sci U S A. 2004;101:17533–17538. [DOI] [PMC free article] [PubMed] [Google Scholar]
- 48.Park SS, Ponce-Balbuena D, Kuick R, et al. Kir2.1 interactome mapping uncovers PKP4 as a modulator of the Kir2.1-regulated inward rectifier potassium currents. Mol Cell Proteomics. 2020;19:1436–1449. [DOI] [PMC free article] [PubMed] [Google Scholar]
- 49.Vaidyanathan R, Reilly L, Eckhardt LL. Caveolin-3 microdomain: arrhythmia implications for potassium inward rectifier and cardiac sodium channel. Front Physiol. 2018;9:1548. [DOI] [PMC free article] [PubMed] [Google Scholar]
- 50.Vaidyanathan R, Van Ert H, Haq KT, et al. Inward rectifier potassium channels (Kir2.x) and caveolin-3 domain-specific interaction: implications for purkinje cell-dependent ventricular arrhythmias. Circ Arrhythm Electrophysiol. 2018;11:e005800. [DOI] [PMC free article] [PubMed] [Google Scholar]
- 51.Veeraraghavan R, Lin J, Keener JP, Gourdie R, Poelzing S. Potassium channels in the Cx43 gap junction perinexus modulate ephaptic coupling: an experimental and modeling study. Pflugers Arch. 2016;468:1651–1661. [DOI] [PMC free article] [PubMed] [Google Scholar]
- 52.Gan WQ, Man SF, Postma DS, Camp P, Sin DD. Female smokers beyond the perimenopausal period are at increased risk of chronic obstructive pulmonary disease: a systematic review and meta-analysis. Respir Res. 2006;7:52. [DOI] [PMC free article] [PubMed] [Google Scholar]
- 53.Melnyk P, Zhang L, Shrier A, Nattel S. Differential distribution of Kir2.1 and Kir2.3 subunits in canine atrium and ventricle. Am J Physiol Heart Circ Physiol. 2002;283:H1123–H1133. [DOI] [PubMed] [Google Scholar]
- 54.Habeck M, Tokhtaeva E, Nadav Y, et al. Selective Assembly of Na,K-ATPase alpha2beta2 heterodimers in the heart: distinct functional properties and isoform-selective inhibitors. J Biol Chem. 2016;291:23159–23174. [DOI] [PMC free article] [PubMed] [Google Scholar]
- 55.Swift F, Tovsrud N, Enger UH, Sjaastad I, Sejersted OM. The Na+/K+-ATPase alpha2-isoform regulates cardiac contractility in rat cardiomyocytes. Cardiovasc Res. 2007;75:109–117. [DOI] [PubMed] [Google Scholar]
- 56.Liu L, Mohammadi K, Aynafshar B, et al. Role of caveolae in signal-transducing function of cardiac Na+/K+-ATPase. Am J Physiol Cell Physiol. 2003;284:C1550–C1560. [DOI] [PubMed] [Google Scholar]
- 57.Yang HQ, Perez-Hernandez M, Sanchez-Alonso J, et al. Ankyrin-G mediates targeting of both Na(+) and K(ATP) channels to the rat cardiac intercalated disc. Elife. 2020;9:e52373. 10.7554/eLife.52373 [DOI] [PMC free article] [PubMed] [Google Scholar]
- 58.Agullo-Pascual E, Lin X, Leo-Macias A, et al. Super-resolution imaging reveals that loss of the C-terminus of connexin43 limits microtubule plus-end capture and NaV1.5 localization at the intercalated disc. Cardiovasc Res. 2014;104:371–381. [DOI] [PMC free article] [PubMed] [Google Scholar]
- 59.S OB, Holmes AP, Johnson DM, et al. Increased atrial effectiveness of flecainide conferred by altered biophysical properties of sodium channels. J Mol Cell Cardiol. 2022;166:23–35. [DOI] [PMC free article] [PubMed] [Google Scholar]
- 60.Schrickel JW, Stockigt F, Krzyzak W, et al. Cardiac conduction disturbances and differential effects on atrial and ventricular electrophysiological properties in desmin deficient mice. J Interv Card Electrophysiol. 2010;28:71–80. [DOI] [PubMed] [Google Scholar]
- 61.Thomas SA, Schuessler RB, Berul CI, et al. Disparate effects of deficient expression of connexin43 on atrial and ventricular conduction: evidence for chamber-specific molecular determinants of conduction. Circulation. 1998;97:686–691. [DOI] [PubMed] [Google Scholar]
- 62.Lewis T, Meakins J, White PD. The excitatory process in the dog’s heart. Part I. The auricles. Philosophical Transactions of the Royal Society of London Series B. Containing Papers of a Biological Character. 1914;205:375–420. [Google Scholar]
- 63.Lewis T, Rothschild MAIV The excitatory process in the dog’s heart. Part II. The ventricles. Philosophical Transactions of the Royal Society of London Series B. Containing Papers of a Biological Character. 1915;206:181–226. [Google Scholar]
- 64.Ivanovic E, Kucera JP. Localization of Na(+) channel clusters in narrowed perinexi of gap junctions enhances cardiac impulse transmission via ephaptic coupling: a model study. J Physiol. 2021;599:4779–4811. [DOI] [PMC free article] [PubMed] [Google Scholar]
- 65.Kucera JP, Rohr S, Kleber AG. Microstructure, cell-to-cell coupling, and ion currents as determinants of electrical propagation and arrhythmogenesis. Circ Arrhythm Electrophysiol. 2017;10:e004665. 10.1161/CIRCEP.117.004665 [DOI] [PubMed] [Google Scholar]
- 66.Sacks D, Baxter B, Campbell BCV, et al. from the American Association of Neurological Surgeons (AANS), American Society of Neuroradiology (ASNR), Cardiovascular and Interventional Radiology Society of Europe (CIRSE), Canadian Interventional Radiology Association (CIRA), Congress of Neurological Surgeons (CNS), European Society of Minimally Invasive Neurological Therapy (ESMINT), European Society of Neuroradiology (ESNR), European Stroke Organization (ESO), Society for Cardiovascular Angiography and Interventions (SCAI), Society of Interventional Radiology (SIR), Society of NeuroInterventional Surgery (SNIS), and World Stroke Organization (WSO). Multisociety consensus quality improvement revised consensus statement for endovascular therapy of acute ischemic stroke. Int J Stroke. 2018;13:612–632.29786478 [Google Scholar]
Associated Data
This section collects any data citations, data availability statements, or supplementary materials included in this article.