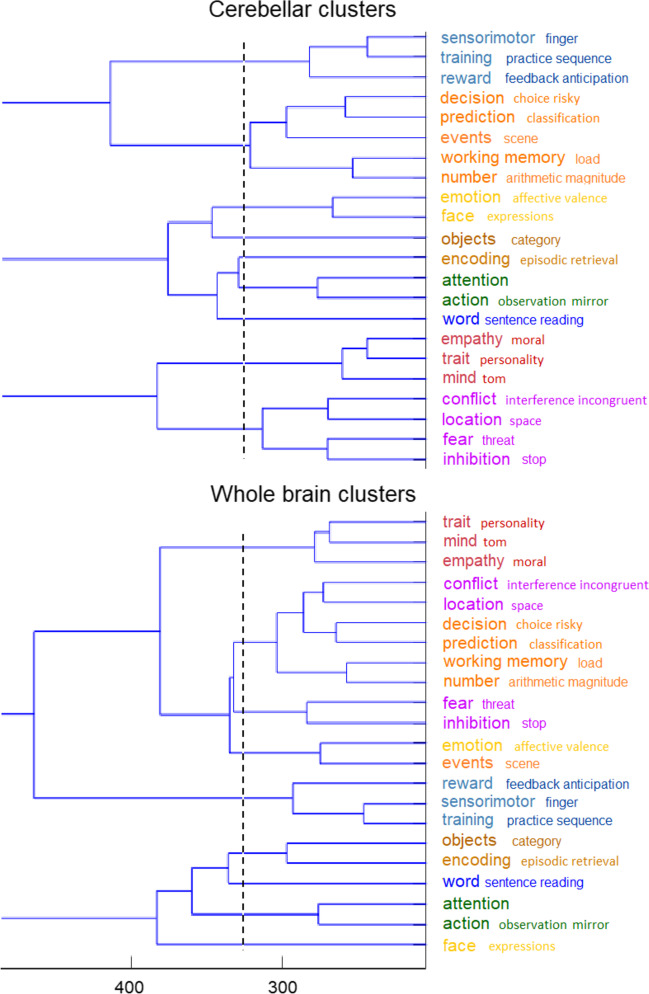
Fig. 1.
Functional cluster analysis of NeuroSynth activations. The analysis is based on the combined input of ALE z-scores on the 22 selected topics of the cerebellar and whole-brain (including cerebellar) MNI coordinates. The vertical broken line demarcates the solution for 9 clusters in each database, while the x-axis represents the distance between z-scores at which functional topics are clustered. By giving priority to cerebellar clusters (when equivalent whole-brain clusters were broken up), the analysis ended up with a final 10-cluster solution. To illustrate, the single “decision-prediction-events-working-number” cerebellar cluster yielded two whole brain clusters, which were relatively close to each other, and hence the single cluster was kept. Likewise for the single “conflict-location-fear-inhibition” cerebellar cluster. In contrast, the “emotion-face” cerebellar cluster yielded two very distant clusters in the whole brain, which were therefore separated. Colors refer to the spatial representation of the same clusters in Fig. 2

