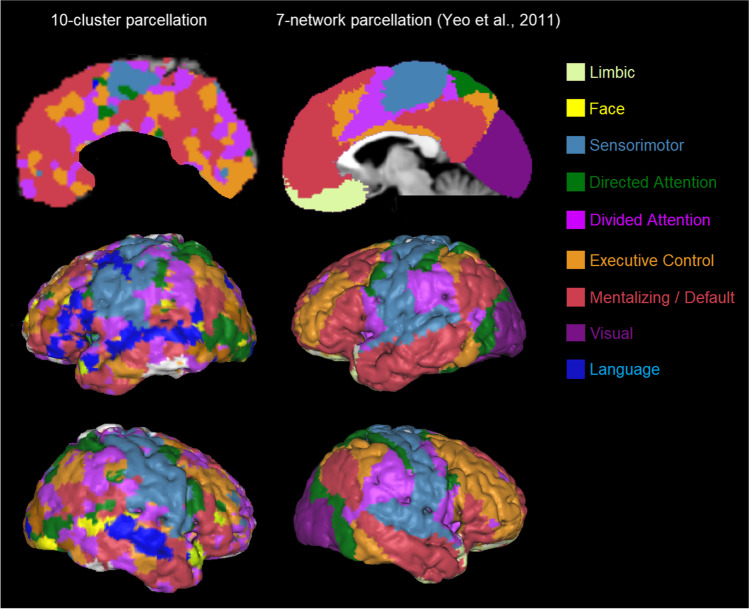
Fig. 6.
[Left] Functional connectivity between the cerebellum and the cerebral cortex. The “winning” clusters with the highest ALE z-values are displayed on the cerebral cortex. The clusters of the executive network are combined (brown color; as in Fig. 2). The networks are shown on a medial section and left and right hemispheres of the Colin brain using Mango, smoothed with a 3 isometric voxel box filter. [Right] The 7-network parcellation of the cerebral cortex by Yeo et al. [4]. Visual comparison shows that the present solution is close the 7-network solution by Yeo et al. [4], except that the present parcellation reveals a separate language network (since this was also identified in our cerebellar parcellation), and lacks a visual network (as it did not show up in our cerebellar parcellation) so that the occipital cortex is ‘erroneously’ substituted by other functions

