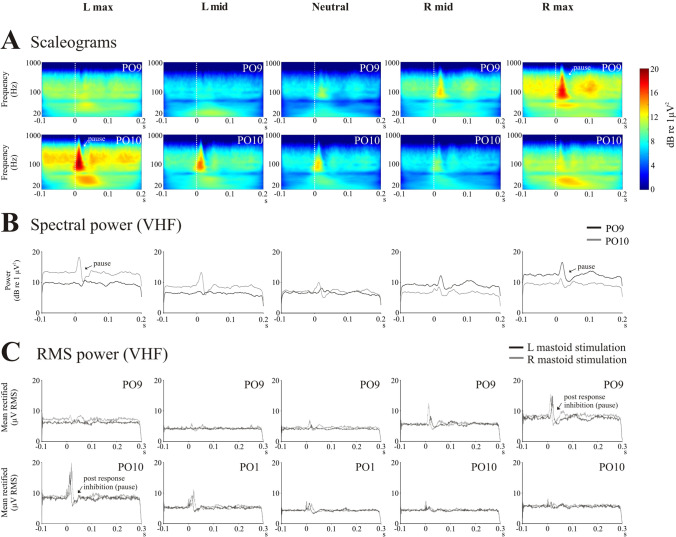
Fig. 3.
Scaleograms (A), spectral power (B) and RMS power (C) across the differing head positions for the PO9 and PO10 electrodes (n = 6). Scaleograms (top two rows) show the characteristic pausing in ECeG following the evoked response, and this became more prominent on the side opposite to the direction of maximal head rotation. This can also be seen in the extracted VHF power (middle row). Scaleograms and spectral power are shown for left mastoid stimulation. RMS averages showed the same pattern of modulation, with the post-response inhibition (pause) becoming larger on the side opposite to maximal head rotation (bottom two rows). The difference in latency for the two sides of stimulation is also evident in the RMS averages. Note some changes in tonic power occurring with head rotation. s, seconds

