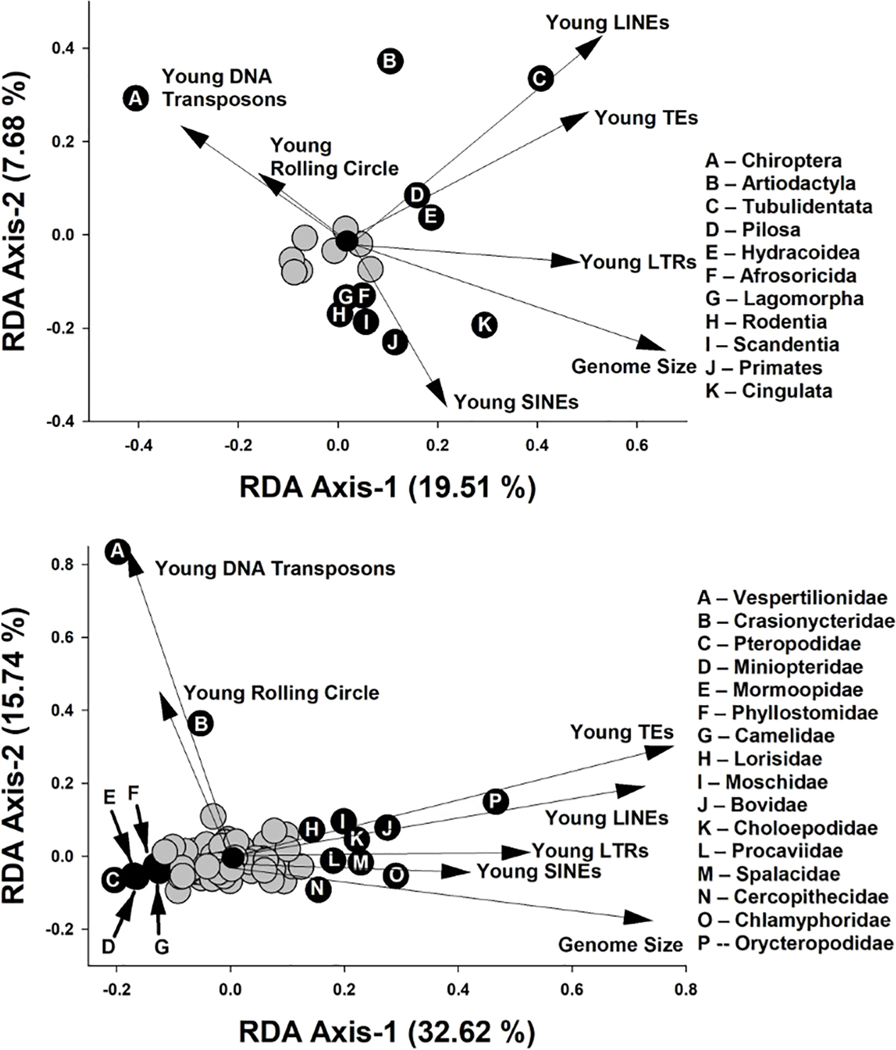
Fig. 3. Redundancy analyses examining major axes of variation in TE accumulation and genome size related to orders and families of mammals.
Arrows represent significant correlations of TE types with the first two RDA axes. Each axis reflects changes in TE composition related to ordinal (top) or familial (bottom) affiliation of taxa used in analyses. Gray circles represent orders or families that were not significantly correlated to at least one of the RDA axes, whereas black circles represent orders or families with significant correlations.

