

Abstract
In 2004, California became the first state to implement minimum-nurse-staffing ratios in acute care hospitals. We examined the wages of registered nurses (RNs) before and after the legislation was enacted. Using four data sets—the National Sample Survey of Registered Nurses, the Current Population Survey, the National Compensation Survey, and the Occupational Employment Statistics Survey—we found that from 2000 through 2006, RNs in California metropolitan areas experienced real wage growth as much as twelve percentage points higher than the growth in the wages of nurses employed in metropolitan areas outside of California.
In october 1999, after several failed attempts at legislating minimum-nurse-staffing standards in California, intense lobbying by nurses’ unions finally resulted in passage of California Assembly Bill (AB) 394. The bill required the California State Department of Health Services to establish unit-specific minimum staffing levels for licensed nurses (registered nurses [RNs] and licensed vocational nurses [LVNs]) working in acute care hospitals. The draft regulations were released in January 2002 and implemented in January 2004 after a lengthy period of highly contentious public comment. A variety of stakeholders proposed widely varying staffing levels. For example, the California Nurses Association (CNA) proposed a 1:3 ratio (one nurse for every three patients) for medical-surgical units, while the California Hospital Association (CHA) proposed a 1:10 ratio. The ratios finally selected were to be phased in. Beginning 1 January 2004, the minimum staffing ratio for medical-surgical areas was set at 1:6; in March 2005 it was enriched to 1:5.
In the debate, the potential impact of the regulations on RNs’ wages received relatively little attention. Two major studies of the potential impact of the staffing regulations estimated the cost of proposed staffing regulations assuming that RNs’ wages would be unaffected by the regulations, despite also forecasting fairly large increases in the number of licensed full-time-equivalents (FTEs) required to meet the staffing regulations.1
Estimates of the numbers of licensed nurse FTEs needed per hospital ranged from a low of 5.90 (CHA proposal) to a high of 46.89 (CNA proposal). The official government estimate for the ratios implemented in 2004 was close to 5,000 licensed nurses statewide, representing a 4–5 percent increase in licensed nurse employment.2 Because the staffing regulations apply to both RNs and LVNs, hospitals could satisfy their requirements by hiring more of either or both of these types of nurses, as long as LVN FTEs did not exceed 50 percent of licensed nurse FTEs. Hence, hospitals had the potential to substitute away from RNs to LVNs in response to increased wages for RNs. However, the scope of practice for LVNs is quite restricted in California, limiting labor substitution to satisfy the minimum-staffing regulations and meet patient care needs.3 Consequently, hospitals turned primarily to RNs to meet the ratio requirements.4
The increased demand for RNs resulting from the minimum-staffing legislation occurred in the midst of a shortage of RNs in California (and across the United States); California’s nurse shortage has been among the more severe in the United States. The combination of increased demand created by the legislation and the concurrent shortage of RNs in California would be expected to put upward pressure on wages. Although there is evidence that the long-run market supply of RNs grows as wages increase, the short-run supply is relatively inelastic—that is, relatively unresponsive to wage increases.5 Thus, the dynamics of a shortage and wage increases can persist for several years before the shortage potentially begins to improve.6 There is evidence, however, that individual hospitals have some market power in the short run: they face an upward-sloping short-run supply curve, so that they can command a larger share of available RNs by increasing wages.7 In the long run, other hospitals will match wages, so that the relative advantage for the wage-boosting hospital diminishes.
Thus, a strong economic argument can be made that the minimum-staffing regulations would raise wages. However, as policymakers and planners considered the regulations, the potential costs were likely underestimated, at least in the short run, because the potential effects on nurses’ wages were not considered.
We used data from four ongoing national surveys to estimate short-term changes in RNs’ wages in California metropolitan areas after implementation of the state’s minimum-nurse-staffing regulations; we compared those changes to changes occurring in urban regions in other states lacking such legislation. Each data source has strengths and limitations; the advantage of using multiple surveys lies in examining whether a change in nurses’ wages is consistently discernable across the four independent sources.
Study Data And Methods
We used the National Sample Survey of Registered Nurses (NSSRN), the Current Population Survey (CPS), the National Compensation Survey (NCS), and the Occupational Employment Statistics (OES) survey (see Exhibit 1 for important features of the surveys).8 We excluded rural nurses from the analysis because wage data were unavailable for them and because many rural hospitals received a waiver from the regulations from the California Department of Health Services.
EXHIBIT 1.
Sources Of Data On Nurses’ Wages Or Earnings In California, 2000–2006
| NSSRN | CPS | NCS | OES | |
|---|---|---|---|---|
| Number of metro areas in CA | 26a | 21b | 6c | 22d |
| Number of metro areas outside CA | 330 | 206 | 71 | 242 |
| Survey frequency | Quadrennial | Monthly | Annual | Annual |
|
| ||||
| Measures or directly infers wage | No | Yes | Yes | Yes |
|
| ||||
| Sampling unit | Individual | Individual | Metro area | Metro area |
| Sampling weights | Yes | Yes | –f | –f |
| Indication of union membership | Noe | Yes | –f | –f |
|
| ||||
| Includes only | ||||
| RNs without advanced degrees | Yes | Yes | –f | –f |
| RNs working in hospitals | Yes | Yes | –f | –f |
| RNs in units subject to regulationsg | Yes | No | –f | –f |
|
| ||||
| Number of RNs after exclusion | ||||
| 2000 | 10,382 | 842 | –f | –f |
| 2001 | –h | 830 | ||
| 2002 | –h | 898 | ||
| 2003 | –h | 933 | ||
| 2004 | 10,426 | 875 | ||
| 2005 | –h | 889 | ||
| 2006 | –h | 906 | ||
SOURCES: Four surveys; see text for details.
NOTES: NSSRN is National Sample Survey of Registered Nurses. CPS is Current Population Survey. NCS is National Compensation Survey. OES is Occupational Employment Statistics. RN is registered nurse.
Core-based statistical area (CBSA). See Bureau of the Census, “Current Lists of Metropolitan and Micropolitan Statistical Areas and Definitions,”15 September 2008, http://www.census.gov/population/www/estimates/metrodef.html (accessed 23 January 2009).
In May 2004 the CPS switched from identifying Metropolitan Statistical Areas (MSAs) and Primary MSAs (PMSAs) to identifying CBSAs. We compared MSA/PMSAs to CBSAs and combined them to form metropolitan areas defined consistently across the years 2000–2006.
MSA and Consolidated MSA.
In 2005 the OES switched from identifying MSA/PMSAs to identifying CBSAs. We compared MSA/PMSAs to CBSAs and combined them, calculating mean wage weighted by population where necessary, to form metropolitan areas defined consistently across the years 2000–2006.
The NSSRN included a question concerning union membership in 2004 but not in 2000.
Not applicable; the sampling unit is a metropolitan area, not an individual RN.
The 2004 NSSRN survey asked respondents to indicate the type of unit in which they “spend the majority of your patient care time,” while the 2000 survey asked respondents to indicate the type of unit in which they “work more than half” of their patient care time.
Not applicable; the NSSRN is a quadrennial survey.
NSSRN.
The quadrennial NSSRN, sponsored by the Bureau of Health Professions at the Health Resources and Services Administration (HRSA), is the most comprehensive source of statistics on RNs in the United States; we used information from the 2000 and 2004 surveys. Both surveys were distributed to RNs in March, so the 2004 survey closely followed the implementation of the California staffing regulations.
A strength of the NSSRN is that the data allowed us to include only RNs who work in hospitals delivering direct patient care on units subject to the staffing regulations. The other data sources did not allow us to differentiate so finely (Exhibit 1); because we could not identify nurses working on units subject to the regulations, we might have misestimated the short-run impact of the regulations on wages using data from the other sources.
A limitation of the NSSRN is that it asks respondents to provide their gross annual earnings in their principal nursing position, not their hourly wage. Hence, to draw conclusions about changes in nurses’ wages from the earnings data, we also analyzed changes in the number of hours in a particular workweek specified in the survey.
CPS.
The CPS, a national survey of labor-force participation and employment status of the U.S. population, is conducted by the Bureau of the Census. Each month approximately 60,000 households are surveyed. We used the “Outgoing Rotation Group” records: every month a respondent in households making up the outgoing 25 percent of the sample is asked about hours worked and hourly wages (or weekly earnings, from which hourly wages are inferred) for household members.
A limitation of the CPS is that it does not contain a large number of RNs. We obtained wage data for 830–933 RNs. However, the CPS is unique among the surveys in that it allowed us to identify RNs who were members of a union or employee association, thus allowing us to control for the potential impact of union membership on any increase in wages.
NCS.
The NCS, produced by the Bureau of Labor Statistics (BLS), is a survey of employers that provides several measures of earnings for 450 occupations in a limited number of metropolitan areas, as well as estimates for nine census divisions and a national summary. BLS employees visit establishments selected for the NCS sample and, in addition to obtaining information on hours and wages, obtain information on “work level” derived from the duties and responsibilities of the job. Hence, NCS data provide estimates of mean RN wages standardized for work level.
OES.
The OES is a cooperative program operated by the BLS and state workforce agencies. The OES is more general than the NCS in producing estimates of employment as well as wages, and for more occupations and metropolitan areas. Our sample of consistently defined metropolitan areas included twenty-two areas in California and 242 areas outside of California.
We expect that the OES estimates of average wages are less precise than the NCS estimates because there is no control for work level in the OES, and it uses a set of only twelve wage intervals, resulting in considerable loss of information. For example, twenty-fifth- and seventy-fifth-percentile values for 2006 RN wages in “San Francisco–Oakland–San Jose” ($41.16 and $48.43, respectively) reported in the NCS fall into a single wage interval ($39.25–$49.74) in the OES.
Statistical models.
We used a “difference-in-difference” (DD) estimator to evaluate the impact of the minimum-nurse-staffing regulations on RNs’ wages. DD estimation involves identifying a specific change (for example, the staffing regulation) and then comparing the difference in outcomes (for example, RNs’ wages) before and after implementation of the policy/legislation for groups affected by the policy (California nurses) with the before-after difference in groups unaffected by the policy. The parameters of interest are the difference in the growth rate of RNs’ wages, relative to wages in 2000, in metropolitan areas in California compared to metropolitan areas in other states in the years following implementation of the regulation (as well as allowing for the possibility of wage growth in anticipation of its implementation). For the DD estimator to represent the causal effect of the policy change in California, we must assume that conditional on the metropolitan area and other control variables, the growth rate of wages (absent random error) is the same both for areas not subject to the legislation and, counterfactually, for metropolitan areas in California had those areas not been subject to the minimum-staffing legislation.
We estimated two DD models. Model 1 is the “simple” DD model, in which we regressed the natural log of real (inflation-adjusted) hourly wages on indicator variables for each of the years 2001–2006 as well as on the interaction indicator variables for California metropolitan areas in 2001–2006. The coefficients for these interaction variables are the estimates of the key parameters: the difference in the growth rate of RNs’ wages, relative to wages in 2000, in metropolitan areas in California compared to metropolitan areas in other states during 2001–2006. Model 2 is identical except that we added as control variables the natural log of real per capita income in the metropolitan area, the natural log of population, and the Herfindahl-Hirschman index (a commonly accepted measure of hospital market concentration).9 As noted above, for the CPS we were also able to add an indicator variable for whether a nurse is a member of a union or employee association.
For the CPS, NCS, and OES, data necessary to estimate Model 1 were available through 2006, but data on per capita income and data to calculate the Herfindahl-Hirschman index were available only through 2005.
Study Findings
RN wages and changes in hours.
Using the NSSRN, we determined that earnings for full-time RNs in metropolitan areas in California grew 7.8 percentage points more between 2000 and 2004 than in metropolitan areas in other states (Exhibit 2). Emphasizing that this is the estimate of differential growth in California, we note that Model 1 suggests that the inflation-adjusted earnings of fulltime RNs employed in hospitals in metropolitan areas outside of California grew 15.4 percent between 2000 and 2004, while similarly employed RNs in California saw earnings grow an additional 7.8 percentage points.
EXHIBIT 2. Differential Growth In Registered Nurses’ (RNs’) Wages In California Metropolitan Areas Compared With Other U.S. Metropolitan Areas, 2004 (National Sample Survey Of Registered Nurses).
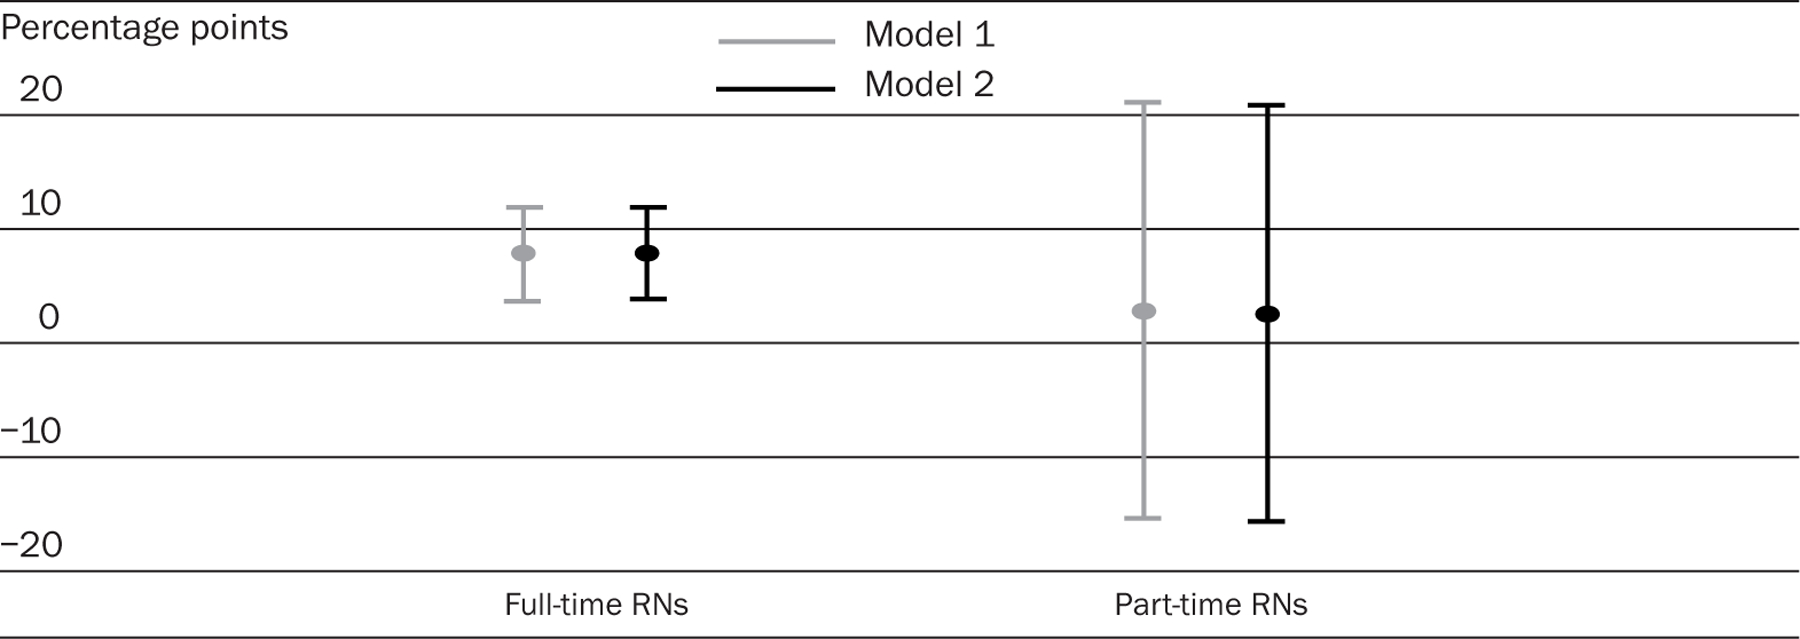
SOURCE: National Sample Survey of Registered Nurses, 2004.
NOTES: Model 1 estimates and 95 percent confidence intervals (CIs) (indicated by short horizontal bars) were calculated using difference-in-difference linear regression. Model 2 estimates and 95 percent CIs were calculated similarly but with the inclusion of the following control variables: natural log of real per capita income in metropolitan area, natural log of population, and Herfindahl-Hirschman index. Complete regression results are available in the online Appendix at http://content.healthaffairs.org/cgi/content/full/hlthaff.28.2.w326/DC2.
Exhibit 3 indicates, however, that the weekly hours of full-time RNs in California increased as well—by 1.4 hours, but with a confidence interval (CI) that includes zero. Hence, part of the differential growth in earnings of California full-time RNs might be attributable to an increase in hours, especially if the additional hours worked by full-time RNs generated an overtime-pay premium.
EXHIBIT 3. Differential Growth In Registered Nurses’ (RNs’) Hours In California Metropolitan Areas Compared With Other U.S. Metropolitan Areas, 2004 (National Sample Survey Of Registered Nurses).
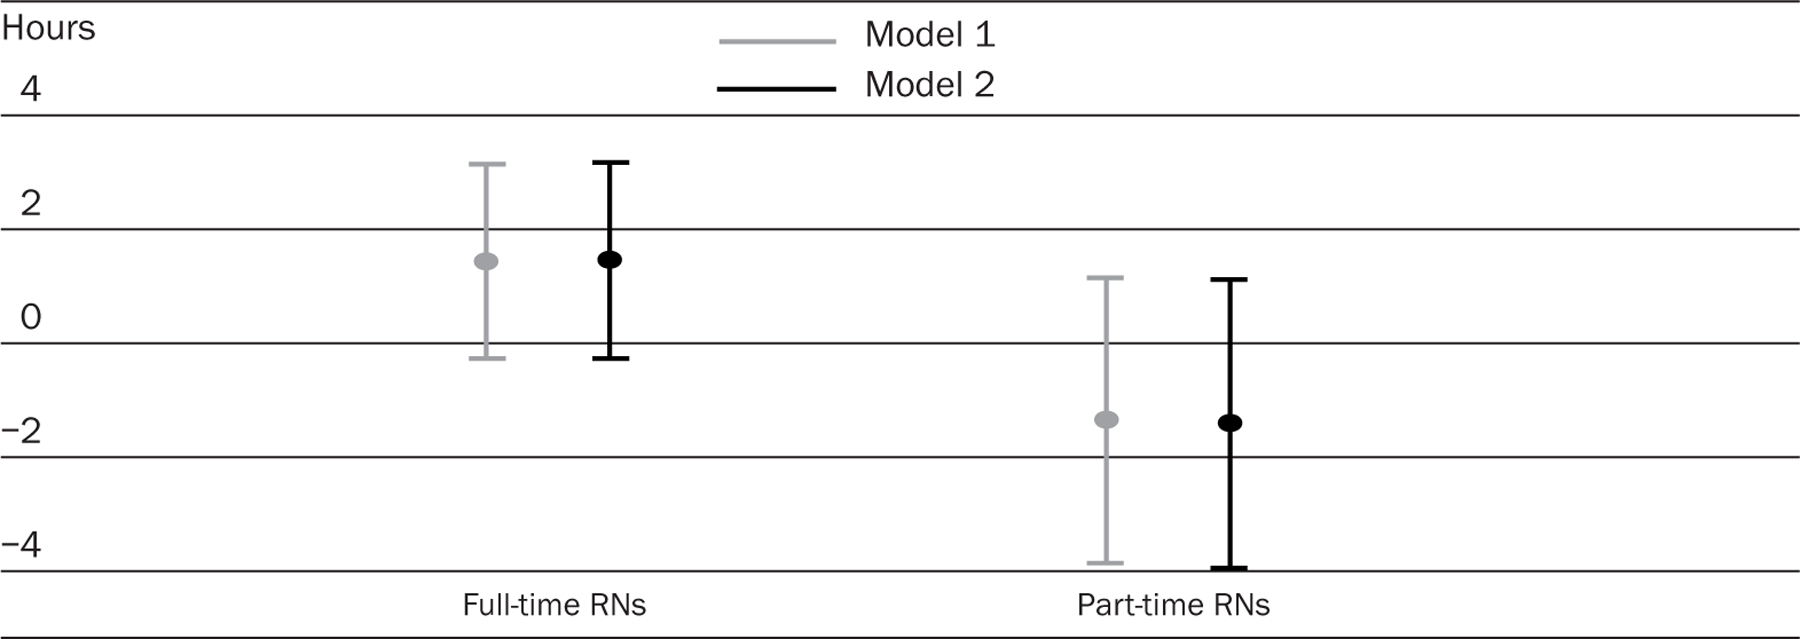
SOURCE: National Sample Survey of Registered Nurses, 2004.
NOTES: Model 1 estimates and 95 percent confidence intervals (CIs) (indicated by short horizontal bars) were calculated using difference-in-difference linear regression. Model 2 estimates and 95 percent CIs were calculated similarly but with the inclusion of the following control variables: natural log of real per capita income in metropolitan area, natural log of population, and Herfindahl-Hirschman index. Complete regression results are available in the online Appendix at http://content.healthaffairs.org/cgi/content/full/hlthaff.28.2.w326/DC2.
Differential wage growth.
We highlight three main conclusions about wage growth (more detailed analysis is available in an online Appendix).10 First, the estimates of differential growth in wages (earnings in the NSSRN) and the upper and lower limits of the 95 percent CIs are very similar for Model 1 and Model 2 (Exhibits 4–6).
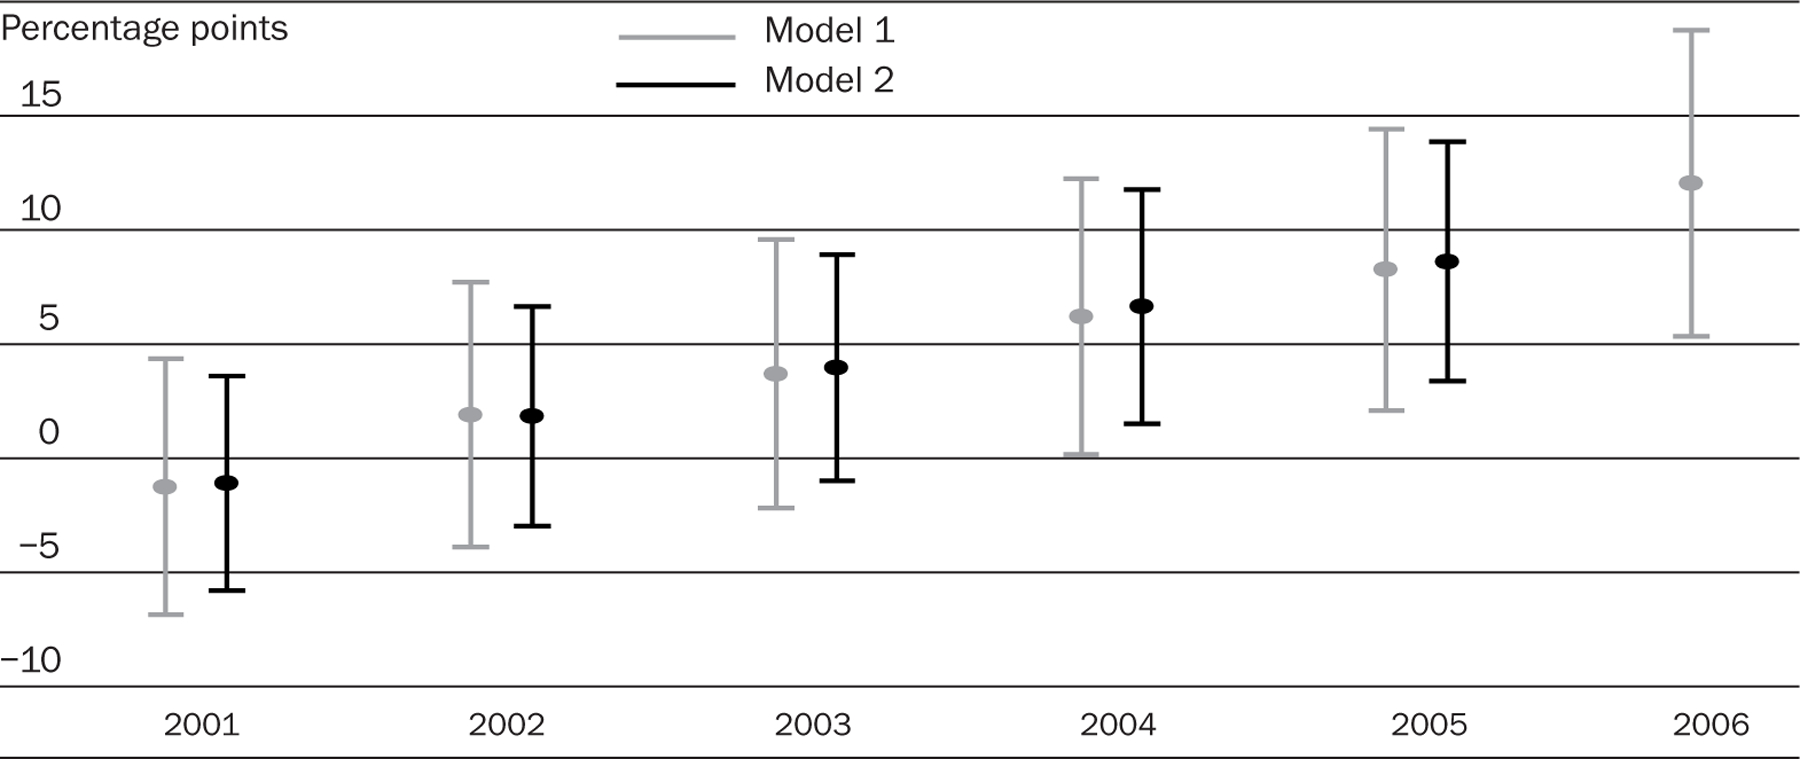
EXHIBIT 4. Differential Growth In Registered Nurses’ (RNs’) Wages In California Metropolitan Areas Compared With Other U.S. Metropolitan Areas, 2001–2006 (Current Population Survey).
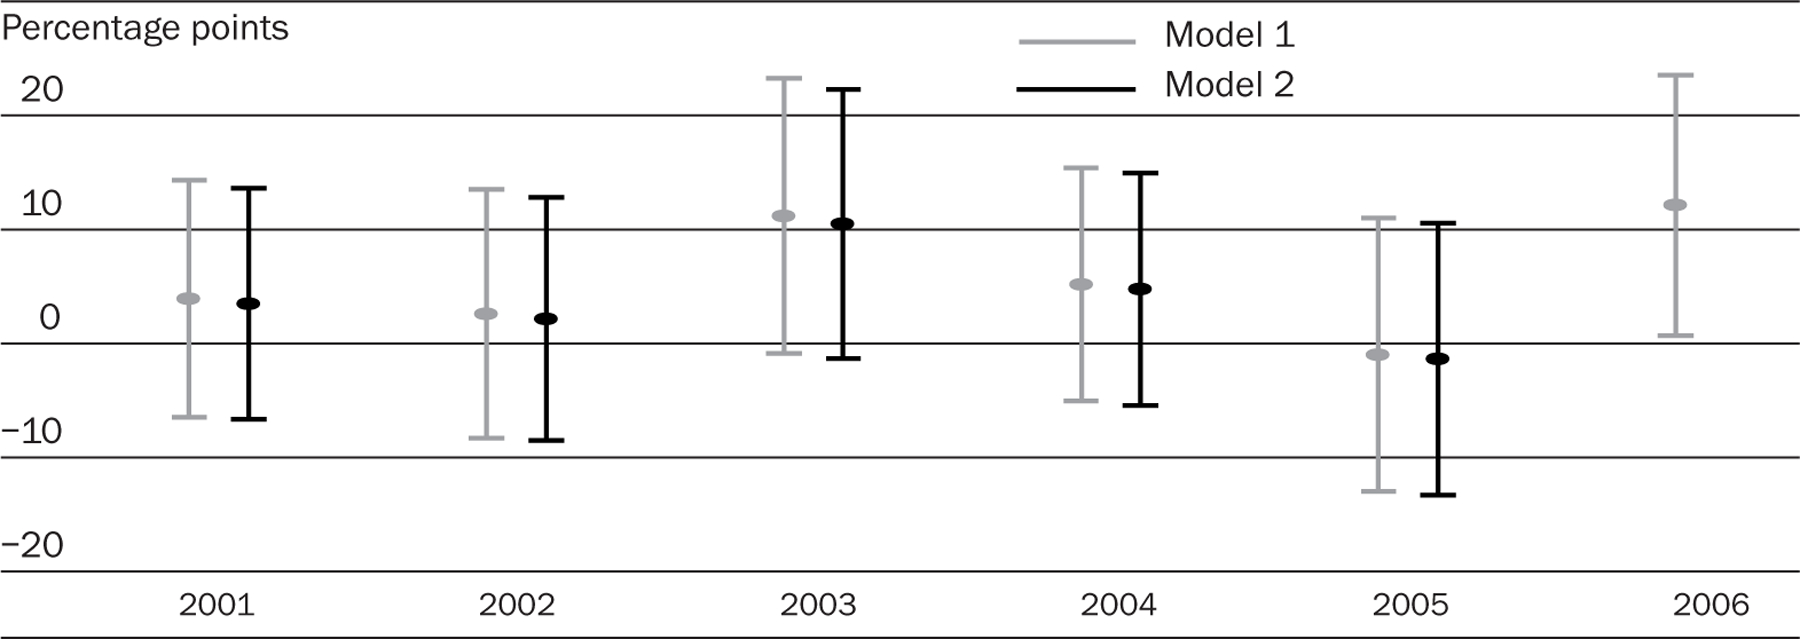
SOURCE: Current Population Surveys, 2001–2006.
NOTES: Model 1 estimates and 95 percent confidence intervals (CIs) (indicated by short horizontal bars) were calculated using difference-in-difference linear regression. Model 2 estimates and 95 percent CIs were calculated similarly but with the inclusion of the following control variables: natural log of real per capita income in metropolitan area, natural log of population, and Herfindahl-Hirschman index, and an indicator variable for whether the person was a member of a union or an employee association. Complete regression results are available in the online Appendix at http://content.healthaffairs.org/cgi/content/full/hlthaff.28.2.w326/DC2.
EXHIBIT 6. Differential Growth In Registered Nurses’ (RNs’) Wages In California Metropolitan Areas Compared With Other U.S. Metropolitan Areas, 2001–2006 (Occupational Employment Statistics Survey).
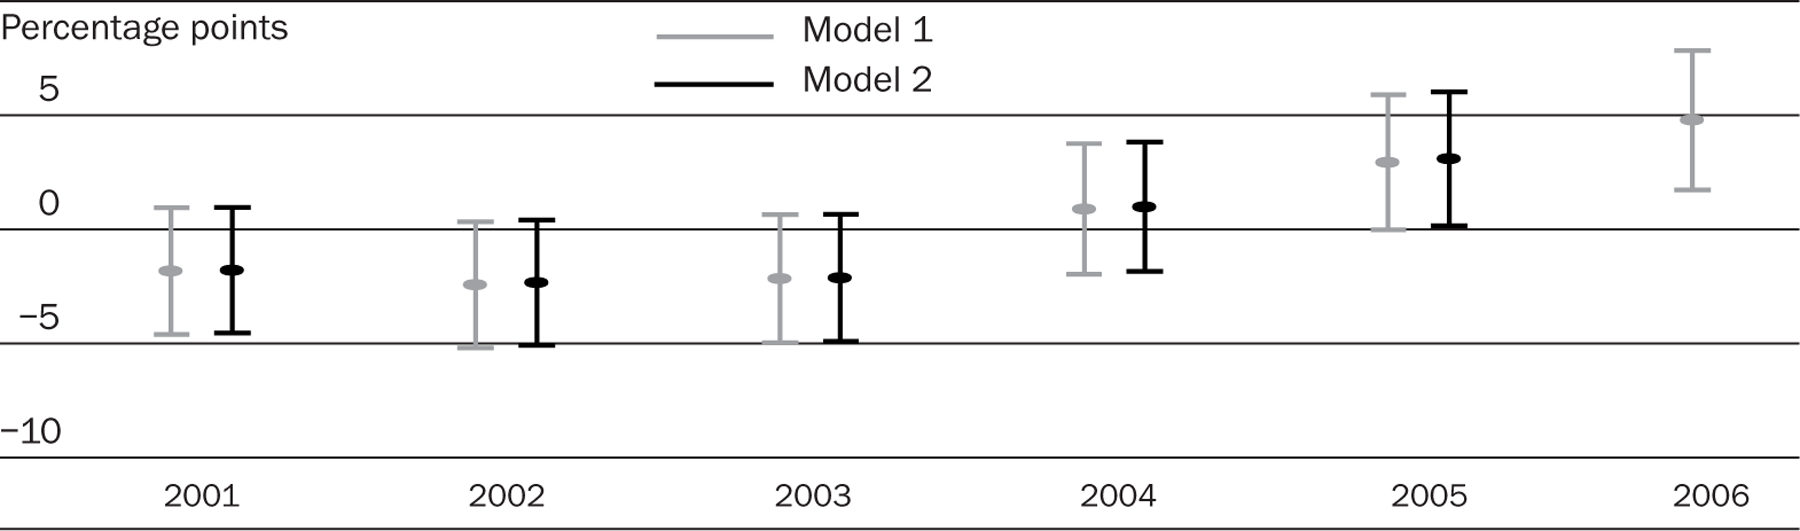
SOURCE: Occupational Employment Statistics Surveys, 2001–2006.
NOTES: Model 1 estimates and 95 percent confidence intervals (CIs) (indicated by short horizontal bars) were calculated using difference-in-difference linear regression. Model 2 estimates and 95 percent CIs were calculated similarly but with the inclusion of the following control variables: natural log of real per capita income in metropolitan area, natural log of population, and Herfindahl-Hirschman index. Complete regression results are available in the online Appendix at http://content.healthaffairs.org/cgi/content/full/hlthaff.28.2.w326/DC2.
Second, in Exhibits 4–6, using the data sources allowing for annual estimates of differential growth rates, there is no consistent pattern of wage growth in California relative to other U.S. metropolitan areas before the staffing regulations were implemented. This conclusion holds for each of the data sources in 2001 and 2002, but the evidence is mixed for 2003; data from the CPS (Exhibit 4) generate an approximately eleven-percentage-point differential in California RNs’ wages in 2003 compared to 2000. In 2003 and the other years, however, the estimates from the CPS are relatively imprecise; for example, in 2003, the 95 percent CI for differential growth rate stretches from one to twenty-three percentage points.
Third, the estimates from the four data sources provide reasonably consistent evidence of higher wage growth in California metropolitan areas after the staffing regulations were implemented. In 2004 the estimate of differential earnings growth in the NSSRN (7.8 percentage points) is similar to the estimate of RN wage growth in the CPS (5 percentage points) and the NCS (6.5 percentage points).
The magnitude of the estimate from the OES is different, but the evidence from the OES also suggests a distinct change in 2004. The OES estimates indicate that relative to 2000, RNs’ wages in California metropolitan areas during 2001–2003 grew at a rate approximately two percentage points less than in metropolitan areas in other states. In 2004, the situation reversed, with wages of California RNs growing one percentage point more than wages for RNs in other states. Although the differential growth compared to 2000 was not statistically significant, the 3.2-percentage-point change from 2003 was statistically significant.
Consistency of estimates.
The estimates from the different data sources are not wholly consistent. Although the estimates from the NCS and the OES show a steady increase in relative RN wages in California in 2005 and 2006, the CPS estimate of differential growth shrinks to approximately zero in 2005 and then increases to 12.1 percentage points in 2006. Additionally, the estimates of differential wage growth are smaller using the OES data. This difference in the magnitude of the OES estimates, particularly relative to those from the NCS, may be due to the lack of control for work level and to information loss resulting from wages’ being reported in just twelve intervals. Aside from differences in the size of the estimates in the OES, however, all of the surveys point to a consistent and sizable differential growth in RNs’ wages in California after the staffing regulations were implemented.
Discussion
We found that wage growth for RNs in California following the implementation of minimum-nurse-staffing legislation outstripped RN wage growth in other states not subject to such legislation. This result is consistent with the economic argument made earlier: that the minimum-staffing regulations increased demand for nurses, which contributed to an increase in RNs’ wages in California.
Database limitations.
However, several factors complicate the task of attributing the change in the growth of RNs’ wages to the minimum-staffing legislation. First, the databases we used have limitations. Only the CPS allows for control of the influence of union membership, but it contains a relatively small number of nurses; the NSSRN reports earnings, not wages; the OES wage reporting intervals are coarse; and only the NSSRN distinguishes RNs employed in inpatient versus outpatient hospital settings. Thus, although there is general agreement across the four data sources, uncertainty about the magnitude of the wage differential remains.
Competing financial pressures.
Second, California hospitals face a number of financial pressures that compete with personnel expenditures in hospital budgets. These include compliance with stringent seismic safety standards that are estimated to cost $110 billion by 2030, a sizable proportion of uninsured nonelderly patients, and negative operating margins.11 Given these demands, hospitals’ ability to increase wages to compete for RNs may be more limited than is the case in other states.
Impact of nurse shortage by itself.
Third, the magnitude of the nurse shortage in California hospitals has been severe. Thus, it is likely that wages would have had to rise to meet the increasing demand for RNs, even in the absence of the minimum-staffing legislation. Mitigating the upward pressure on wages, however, California also has a major influx of foreign-educated RNs every year—which steadily increased from 2000 through 2004 but has since leveled off.12
Relevant issues for other states.
Nevertheless, we find generally consistent evidence that RNs’ wages in California metropolitan areas rose much more than RNs’ wages in similar areas in other states. Our findings call into question the assumption by planners in California that the minimum-nurse-staffing regulations would not lead to unusually large wage increases for RNs, at least in the immediate postimplementation period.
In addition to these wage increases, policymakers and planners in other states considering such legislation need to reflect on several other relevant issues. First, local economic and labor forces may play out differently in other states. For example, the availability of alternative employment opportunities for RNs may either reduce or increase the supply of hospital RNs. In addition, because there is evidence that the demographics of the workforce (such as marital status, sex, minority status, number of children) also influence RNs’ decisions to work, the composition of the local nurse labor force may be important in evaluating the potential impact of such legislation.13
There are competing explanations for our findings; however, the large wage increases for California nurses are important to any assessment of the overall impact of California’s staffing legislation and need to be considered by planners and policymakers in other states who are considering the implementation of such ratios. Furthermore, there are as yet unanswered questions about whether the minimum-nurse-staffing legislation met the policy goal of improving quality of care. Ultimately, policymakers will need to balance the costs of potential wage increases resulting from such legislation and the societal benefit of potentially improved quality of care.
EXHIBIT 5. Differential Growth In Registered Nurses’ (RNs’) Wages In California Metropolitan Areas Compared With Other U.S. Metropolitan Areas, 2001–2006 (National Compensation Survey).
SOURCE: National Compensation Surveys, 2001–2006.
NOTES: Model 1 estimates and 95 percent confidence intervals (CIs) (indicated by short horizontal bars) were calculated using difference-in-difference linear regression. Model 2 estimates and 95 percent CIs were calculated similarly but with the inclusion of the following control variables: natural log of real per capita income in metropolitan area, natural log of population, and Herfindahl-Hirschman index. Complete regression results are available in the online Appendix at http://content.healthaffairs.org/cgi/content/full/hlthaff.28.2.w326/DC2.
Acknowledgments
This research was funded by Grant no. R01HS10153 from the Agency for Healthcare Research and Quality.
Contributor Information
Barbara Mark, School of Nursing at the University of North Carolina at Chapel Hill..
David W. Harless, Virginia Commonwealth University in Richmond..
Joanne Spetz, University of California, San Francisco..
NOTES
- 1.Kravitz RL et al. , Hospital Nursing Staff Ratios and Quality of Care: Final Report of Evidence, Administrative Data, an Expert Panel Process, and a Hospital Staffing Survey, 8 February 2002, http://repositories.cdlib.org/chsrpc/cdhs/Final_Report (accessed 16 August 2007); and [Google Scholar]; Spetz J et al. , “Minimum Nurse Staffing Ratios in California Acute Care Hospitals” (San Francisco: University of California, San Francisco, Center for the Health Professions, 2000). Joanne Spetz and colleagues assumed that the staffing regulation would be met by hiring RNs, while Richard Kravitz and colleagues assumed that the regulation would be met while keeping the same ratio of RNs to LVNs. [Google Scholar]
- 2.Kravitz et al. , Hospital Nursing Staff Ratios. [Google Scholar]
- 3.Spetz J et al. , “Hospital Demand for Licensed Practical Nurses,” Western Journal of Nursing Research 28, no. 6 (2006): 726–739. [DOI] [PubMed] [Google Scholar]
- 4.Burnes Bolton L et al. , “Mandated Nurse Staffing Ratios in California: A Comparison of Staffing and Nursing-Sensitive Outcome Pre- and Postregulation,” Policy, Politics, and Nursing Practice 8, no. 4 (2007): 238–250. [DOI] [PubMed] [Google Scholar]
- 5.Shields MA, “Addressing Nurse Shortages: What Can Policy Makers Learn from the Econometric Evidence on Nurse Labour Supply?” Economic Journal 114, no. 499 (2004): F464–F498. [Google Scholar]
- 6.Spetz et al. , Minimum Nurse Staffing Ratios; J. Spetz and R. Given, “The Future of the Nurse Shortage: Will Wage Increases Close the Gap?” Health Affairs 22, no. 6 (2003): 199–206; and [DOI] [PubMed] [Google Scholar]; Spetz J and Dyer W, “Forecasts of the Registered Nurse Workforce in California” (Sacramento: California Board of Registered Nursing, 2005). [Google Scholar]
- 7.Hirsch B and Schumacher E, “Classic or New Monopsony? Searching for Evidence in Nursing Labor Markets,” Journal of Health Economics 24, no. 5 (2005): 969–989. [DOI] [PubMed] [Google Scholar]
- 8.Additional information about the databases may be found in the Appendix, online at http://content.healthaffairs.org/cgi/content/full/hlthaff.28.2.w326/DC2.
- 9.Data on county per capita income are from the Bureau of Economic Analysis, U.S. Department of Commerce, “County Summary CA1–3 1969– 2005,” http://bea.gov/bea/regional/reis/ca1_3.cfm (
- 10.The online Appendix is at. http://content.healthaffairs.org/cgi/content/full/hlthaff.28.2.w326/DC2.
- 11.Meade C and Kulick J, SB1953 and the Challenge of Hospital Seismic Safety in California, January 2007, http://www.chcf.org/documents/hospitals/SB1953Report.pdf (accessed 16 December 2008);; Brown E et al. , “The State of Health Insurance in California: Findings from the 2005 California Health Interview Survey” (Los Angeles: UCLA Center for Health Policy Research, July 2007); and [Google Scholar]; PriceWaterhouseCoopers, “The Financial Health of California Hospitals” (Oakland: California HealthCare Foundation, June 2007). [Google Scholar]
- 12.Valim Alcidia, California Board of Registered Nursing, personal communication (with Joanne Spetz), 5 January 2005. and 30 May 2007. [Google Scholar]
- 13.Brewer CS et al. , “Factors Influencing Female Registered Nurses’ Work Behavior,” Health Services Research 41, no. 3, Part 1 (2006): 860–866; and [DOI] [PMC free article] [PubMed] [Google Scholar]; Brewer C et al. , “Predictors of RNs’ Intent to Work and Work Decisions One Year Later in a U.S. National Sample,” International Journal of Nursing Studies (forthcoming). [DOI] [PubMed] [Google Scholar]