

Summary
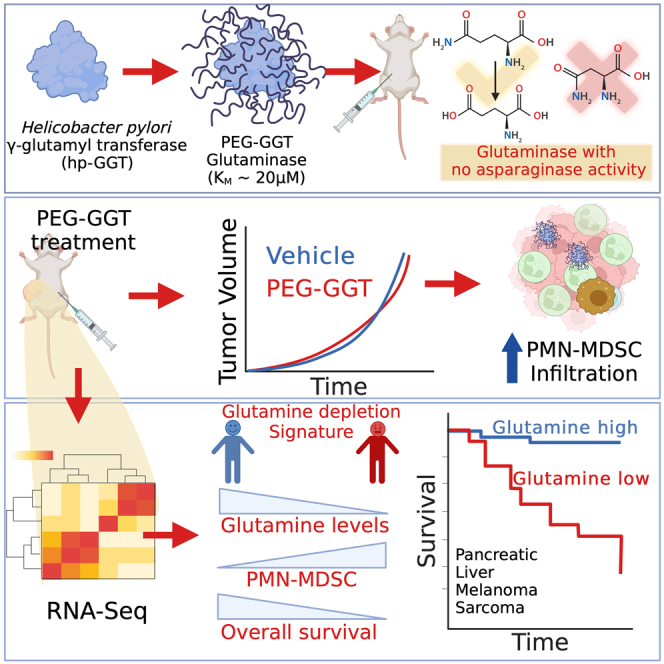
Although glutamine addiction in cancer cells is extensively reported, there is controversy on the impact of glutamine metabolism on the immune cells within the tumor microenvironment (TME). To address the role of extracellular glutamine, we enzymatically depleted circulating glutamine using PEGylated Helicobacter pylori gamma-glutamyl transferase (PEG-GGT) in syngeneic mouse models of breast and colon cancers. PEG-GGT treatment inhibits growth of cancer cells in vitro, but in vivo it increases myeloid-derived suppressor cells (MDSCs) and has no significant impact on tumor growth. By deriving a glutamine depletion signature, we analyze diverse human cancers within the TCGA and illustrate that glutamine depletion is not associated with favorable clinical outcomes and correlates with accumulation of MDSC. Broadly, our results help clarify the integrated impact of glutamine depletion within the TME and advance PEG-GGT as an enzymatic tool for the systemic and selective depletion (no asparaginase activity) of circulating glutamine in live animals.
Subject area: Molecular biology, Immunity, Cancer
Graphical abstract
Highlights
-
•
H. pylori γ-glutamyl transferase (GGT) depletes glutamine for up to 72 h in mice
-
•
PEG-GGT treatment increases infiltration of myeloid-derived suppressive cells in tumors
-
•
Across diverse cancers, TCGA analyses revealed glutamine depletion is not beneficial
Molecular biology; Immunity; Cancer
Introduction
Tumorigenesis requires cancer cells to adapt cellular metabolism to utilize scarce nutrients that can sustain cellular proliferation.1 One of the most frequently documented metabolic changes in proliferating cancer cells is their addiction to glutamine, the most abundant amino acid in circulation (500 μM).2 Glutamine is a carbon source by directly fueling the TCA cycle, and a nitrogen source by enabling nucleotide and protein synthesis.3,4,5 This metabolic adaptation of cancer cells to utilize glutamine has been extensively documented in several preclinical and clinical studies, and glutamine metabolism is an attractive therapeutic target since cancer cells are dependent on glutamine.6 Indeed, the extensive pathways involved in glutamine metabolism including glutamine transporters, glutaminases, and aminotransferases have all been targeted as anti-tumor therapeutics.7,8,9
Despite extensive in vitro data supporting the growth arrest of cancer cell lines in the absence of glutamine, the translation of drugs targeting glutamine metabolism has been largely unsuccessful. Small molecules used to prevent glutamine uptake by inhibiting the primary glutamine transporters, ASCT2, SNAT2, and SNAT1, have suffered from poor affinity, lack of specificity, and toxicity.10,11,12 For example, V-9302 was reported as a high-affinity inhibitor of ASCT2, but other studies suggest that it preferentially inhibits SNAT2 and LAT1, the latter being the primary transporter for essential amino acid uptake.13,14 The naturally occurring glutamine analog 6-diazo-5-oxo-L-norleucine (DON) inhibits multiple enzymes that utilize glutamine, including mitochondrial glutaminases, but has translated poorly as a therapeutic primarily due to a narrow therapeutic index leading to gastrointestinal toxicity.15 Although newer, safer prodrugs of DON like JHU-083 have been developed, their efficacy derives from not only an anti-proliferative effect directly on the tumor cells but also by inducing a strong anti-tumor immune response.16,17 An improved understanding of the role of the immune system and the remarkable success of immunotherapies18,19 has renewed focus on the role of extracellular glutamine within the tumor microenvironment (TME).20,21 Several studies have shown that targeting glutamine metabolism directly inhibits tumor growth and enhances the anti-tumor response mediated by CD8+ T cells.16,17,22,23 By contrast, other reports suggest that interfering with glutamine metabolism either directly impacts the effector function and proliferation of CD8+ T cells, or acts indirectly by upregulating PDL1 expression on cancer cells and functioning as a metabolic checkpoint that licenses the function of type 1 conventional dendritic cells in activating CD8+ T cells.24,25,26 A fundamental question that needs to be answered is what is the integrated impact of inhibiting glutamine metabolism of both the cancer cells and the immune system?
To answer this fundamental question about the pro and anti-tumor function of glutamine in vivo, here, we used an enzymatic approach since enzymes can facilitate the highly specific depletion of extracellular glutamine. We show that Helicobacter pylori gamma-glutamyl transferase (hp-GGT) as an enzyme has no asparaginase activity and that PEGylated-hp-GGT (PEG-GGT) can be used to efficiently deplete circulating glutamine while preserving asparagine in living animals. Using syngeneic models of breast and colon cancers, we show that depleting circulating glutamine does not inhibit tumor growth in vivo, and this is primarily due to the enrichment of myeloid-derived suppressive cells (MDSCs). Based on the RNA sequencing (RNA-seq) with PEG-GGT-treated cancers in mice, we derive a signature for glutamine depletion. Using this glutamine depletion score, we analyzed The Cancer Genome Atlas (TCGA) and demonstrated that glutamine depletion scores are not associated with increased survival benefit in diverse human cancers. Consistent with our animal studies, glutamine depletion is associated with a high frequency of MDSCs in human tumors.
Results
hp-GGT is a high-affinity glutaminase with no asparaginase activity
The glutaminases used to date for in vivo glutamine depletion have concomitant asparaginase activity,27,28 motivating our efforts to find a glutaminase with no asparaginase activity to uncouple the effects of asparagine depletion. Although bacterial glutaminases with no asparaginase activities exist, these enzymes have low catalytic efficiencies (kcat/KM ∼10−3 s−1/μM) because of their high KM (2–30 mM) and are inhibited by the product glutamate.29,30 To utilize more efficient enzymes that function efficiently at physiologically relevant glutamine concentrations (500 μM), we targeted the gamma-glutamyl transferase (GGT) class of enzymes. GGTs are a class of enzymes that can either transfer the γ-glutamyl moiety from a compound to an acceptor substrate or hydrolyze the γ-glutamyl moiety31,32 (Figure 1A). In contrast to the asparaginase-glutaminases which have similar kinetics for glutamine and asparagine hydrolysis, we did not find reports of GGT-mediated asparaginase activity in literature. We specifically focused on the hp-GGT to facilitate glutamine depletion (Figure 1B). As the reported KM of hp-GGT for glutamine hydrolysis is 12 ± 2 μM33 which is 40-fold lower than physiological glutamine concentration, it is a highly efficient glutaminase (kcat/KM = 1.8 ± 0.2 s−1/μM) and this activity is comparable to that of potent Acinetobacter glutaminasificans asparaginase-glutaminase (kcat/KM = 1.1 ± 0.2 s−1/μM).28 This glutaminase activity of hp-GGT is unlike mammalian membrane-bound GGTs which have a 100-fold higher reaction rate for transpeptidation over hydrolysis and function as transferases rather than hydrolases under physiological conditions.34
Figure 1.

H. pylori GGT is a high-affinity glutaminase with no asparaginase activity
(A) The chemical reactions catalyzed by GGTs.
(B) Crystal structure of wild-type H. pylori gamma-glutamyl transferase (hp-GGT). hp-GGT exists as αββα heterodimer. hp-GGT undergoes autocatalytic cleavage into two subunits and the N-terminus threonine of the smaller subunit acts as the nucleophile. The blue surface represents the catalytic center, and the yellow surface depicts the lid-loop structure. The hp-GGT crystal structure was obtained from PDB entry 2NQO35 and visualized in PyMOL.
(C) SDS-PAGE of hp-GGT (lane 2) and hp-GGT T380A mutant (lane 3) lacking autocatalytic cleavage.
(D) Schematic showing the conjugation of NHS-PEG-5000 chains to lysine residues of hp-GGT to produce PEG-GGT.
(E) SDS-PAGE of PEG-GGT (lane 2) and hp-GGT (lane 3).
(F) Michaelis-Menten kinetic characterization of hydrolysis reaction for hp-GGT and PEG-GGT using γ-glutamyl analog γGPNA.
(G) Plot showing relative hydrolysis rate of γGPNA by PEG-GGT in presence of equimolar amounts of glutamine (black) and asparagine (blue).
(H) Plot of final asparagine concentration after incubation of 2.5 mM asparagine with 0.1 and 0.2 mg/mL of PEG-GGT for 8 h.
In H, analysis was performed using a two-tailed student’s t test with Welsch’s correction. In F, G, and H, vertical bars show mean values with error bars representing SD (standard deviation). Student’s t test: ∗∗∗p < 0.001; ∗∗p < 0.01; ∗p < 0.05; ns: not significant.
To produce hp-GGT recombinantly, we expressed and purified the codon-optimized wild-type hp-GGT gene in E. coli Rosetta-2 cells with an N-terminal 6x-His tag as described previously (Figure 1C).33 Consistent with previous reports, the hp-GGT propeptide underwent autocatalytic cleavage, and we observed two distinct bands of 40 and 20 kDa33,36 (Figure 1B). To confirm that this fragmentation was due to autoproteolysis, we cloned, expressed, and purified the hp-GGT T380A mutant which lacks the autocatalytic cleavage capability because of the absence of nucleophilic threonine.35 The T380A mutant appeared as a single 60 kDa band on SDS-PAGE gel (Figure 1C). Since our motivation was to explore hp-GGT as a glutaminase in vivo, we conjugated polyethylene glycol (NHS-PEG-5000) to lysine residues of hp-GGT to prevent renal clearance, increase circulation persistence, and mask immunogenicity37 (Figure 1D). We used the standard NHS ester conjugation chemistry and confirmed the conjugation of PEG chains to hp-GGT using a standard SDS-PAGE gel (Figure 1E).
To verify that PEGylation did not significantly alter the catalytic efficiency of the enzyme for glutamine hydrolysis, we characterized kinetics using the chromogenic substrate, L-γ-glutamyl-para-nitroanilide (γGPNA). The Vmax [2.9 ± 0.2 μmol/(min.mg)] and KM (21 ± 5 μM) of hp-GGT at 37°C were consistent with the published values.33,36 PEG-GGT hydrolyzed γGPNA with similar kinetics with Vmax and KM values of 2.4 ± 0.2 μmol/(min.mg) and 23 ± 8 μM, respectively (Figure 1F). As glutamine is the most abundant physiologically relevant substrate for hp-GGT, the kinetics of glutamine hydrolysis by hp-GGT is well established and has been reported to be the same as γGPNA.33,36 To confirm that PEG-GGT showed similar kinetics for glutamine and γGPNA, we set up a competitive assay in which we added equimolar amounts of glutamine and γGPNA and monitored the release of the chromophore p-nitroaniline (PNA). At concentrations from 500 to 60 μM, the rate of release of PNA was approximately half when an equimolar amount of glutamine was present compared to no glutamine control (Figure 1G). Collectively, these results demonstrate that PEG-GGT has comparable kinetics to the unmodified GGT for the hydrolysis of glutamine. Furthermore, the glutaminase catalytic efficiency of PEG-GGT was comparable to published low KM glutaminases28 (Table S1).
We next tested whether PEG-GGT could hydrolyze asparagine. In the competitive assay with γGPNA, the PNA release rate was not reduced when asparagine was added at equimolar concentrations implying no competition for substrate binding (Figure 1G). To further bolster our finding that PEG-GGT had no asparaginase activity, we incubated 2.5 mM asparagine with 0.1 and 0.2 mg/mL PEG-GGT at 37°C and measured asparagine concentration after 8 h (Figure 1H). There was no reduction in asparagine concentration even at remarkably high concentrations of PEG-GGT and hence we concluded that PEG-GGT has the requisite enzymatic selectivity with no asparaginase activity.
PEG-GGT inhibits the growth of multiple cell lines in vitro
As glutamine is an anabolic substrate, and its absence in culture has been shown to halt the growth of multiple cell lines in vitro,38 we wanted to investigate the effect of glutamine depletion via PEG-GGT on cell growth kinetics. First, we tested the serum stability of PEG-GGT in culture media with 10% FBS. PEG-GGT in culture media retained 60% of its glutaminase activity after 48 h of incubation at 37°C (Figure S1A). We measured the growth rate of CT26 (colorectal carcinoma), 4T1 (mammary carcinoma), and MC38 (colon adenocarcinoma) cell lines in vitro in the presence and absence of glutamine using MTT assay (Figure 2A). The lack of glutamine abolished the growth of all three cell lines tested in vitro. At 72 h after media exchange, the relative number of cells in media supplemented with glutamine was significantly higher (CT26: p value = 0.02, 4T1: p value = 0.002, MC38: p value = 0.001, Figures 2B–2D). Adding PEG-GGT at 10 μg/mL to culture media containing 2 mM glutamine also inhibited the growth of all the tested cell lines (CT26: p value = 0.02, 4T1: p value = 0.003, MC38: p value = 0.006, Figures 2B–2D). To confirm that this arrest in growth could be ascribed to the enzymatic activity of PEG-GGT, we heat-inactivated the enzyme by incubating it at 70°C for 20 min. When heat-inactivated PEG-GGT was added at the same concentration to culture media containing 2 mM glutamine, we observed no impact on cell growth after 24 h confirming that enzymatic activity is important for the observed cell growth arrest upon addition of PEG-GGT (Figure S1B). Therefore, PEG-GGT abolishes the growth of multiple cell lines in vitro and its enzymatic activity is essential for this effect.
Figure 2.

PEG-GGT inhibits the growth of multiple cell lines in vitro
(A) Schematic of MTT assay to assess growth kinetics of cell lines in vitro upon PEG-GGT treatment.
(B–D) Relative growth of CT26 (B), 4T1 (C), and MC38 (D) cells in presence of glutamine (red), presence of glutamine and PEG-GGT (blue), and absence of glutamine (black) in vitro.
(E–G) Relative levels of intracellular glutamate (E), glutamine (F), and total glutathione (G) in CT26 cells upon PEG-GGT treatment for 48 h.
(H and I) Merged bright-field and GFP channel image of CT26 cells at 8, 16, and 24 h after treatment with MSO, PEG-GGT, and combination of PEG-GGT and MSO in vitro (H). Plot representing average number of sytox-positive cells per field of view (2 mm × 2 mm) at different time points (I). Scale bar, 300 μM.
See also Figure S1.
In B, C, D, E, F, G, and I, analysis was performed using two-tailed Student’s t test with Welsch’s correction and vertical bars show mean values with error bars representing SD. Student’s t test: ∗∗∗p < 0.001; ∗∗p < 0.01; ∗p < 0.05; ns, not significant.
Previous reports have suggested that cell lines overexpressing Myc are particularly sensitive to glutamine deprivation and hence we tested the CT26 cell line in which Myc is overexpressed.39 To assess the impact of extracellular glutamine hydrolysis on intracellular glutamine and glutamate pools, we cultured CT26 cells with 2 mM glutamine, treated the cells with PEG-GGT for 48 h, and extracted the metabolites (Figure S1C). When we measured the total glutamate and glutamine concentrations using an enzymatic assay, PEG-GGT-treated cells had 3-fold lower glutamate pool (no treatment: 3.1 ± 0.3, PEG-GGT: 1.0 ± 0.1 p value < 0.0001) (Figure 2E) and 4.7-fold lower glutamine pool (no treatment: 4.7 ± 1.7, PEG-GGT: 1.0 ± 0.8 p value = 0.002) (Figure 2F) compared to non-treated cells. Glutathione (GSH), which is synthesized intracellularly from glutamate, was also significantly reduced upon treatment with PEG-GGT (no treatment: 1.3 ± 0.1, PEG-GGT: 1.0 ± 0.2 p value = 0.03) (Figure 2G). In summary, intracellular glutamate, glutamine, and total GSH pools were reduced in CT26 cells upon PEG-GGT treatment.
Although PEG-GGT arrested the growth of cell lines, we wanted to investigate if it was cytotoxic. Upon depletion of glutamine, cells can adapt to low extracellular glutamine by synthesizing glutamine intracellularly via the enzyme glutamine synthetase (Glul) which is irreversibly inhibited by L-methionine sulfoximine (MSO).40 To test whether PEG-GGT was cytotoxic and if this cytotoxicity was synergistic with Glul inhibition, we treated cells in vitro with either MSO, PEG-GGT, or both and monitored cell death as a function of time using microscopy. MSO as a single agent (500 μM) was not toxic and did not inhibit cell growth (Figure 2H). PEG-GGT by itself at 10 μg/mL inhibited cell growth (Figure 2H) and was cytotoxic to 6% ± 1% (p value = 0.005) of cells after 24 h. Remarkably, the combination of PEG-GGT and MSO was cytotoxic to more than 90% ± 9% (p value = 0.0002) of cells after 24 h (Figures 2H and 2I). These combined results suggest that while glutamine depletion via PEG-GGT inhibits the growth of cell lines, simultaneous glutamine depletion and inhibition of Glul is cytotoxic to cells.
Enzymatic depletion of circulating glutamine does not inhibit tumor growth in vivo
We wanted to investigate whether PEG-GGT can be utilized to facilitate the enzymatic depletion of glutamine in vivo. First, we established the pharmacokinetics and pharmacodynamics of PEG-GGT in mice. We injected a single dose of 20 mg/kg PEG-GGT into mice intraperitoneally and measured glutaminase activity in serum collected at different time points for 72 h by directly monitoring the hydrolysis rate of the substrate γGPNA at saturating concentrations (500 μM) (Figure 3A). We detected glutaminase activity corresponding to 180 ± 20 μg/mL PEG-GGT in serum at 72 h (Figure 3B). Assuming first-order elimination kinetics, PEG-GGT has a half-life of 67 ± 8 h in serum. We also measured glutamine and glutamate concentration in serum and while glutamine was not detectable at 24/48 h, we detected 25 ± 5 μM glutamine at 72 h. As expected by the hydrolysis of glutamine to glutamate by PEG-GGT, we observed an increase of glutamate reaching up to 2.6 ± 0.1 mM in serum at 72 h (Figure 3C).
Figure 3.

Enzymatic depletion of circulating glutamine does not inhibit tumor growth in vivo
(A–C) Schematic of PEG-GGT administration to study pharmacokinetics and pharmacodynamics (A). Plot showing concentration of active PEG-GGT (B) and concentration of glutamine and glutamate (C) in mouse serum over time after PEG-GGT administration.
(D and G) Schematic of experimental design to study tumor growth dynamics upon PEG-GGT administration in vivo in CT26 (D) and 4T1 (G) tumor model.
(E and H) Plot of tumor growth over time in CT26 (E) and 4T1 (H) tumor models. (n = 5).
(F and I) Plot showing concentration of glutamine and glutamate in serum during PEG-GGT treatment in the CT26 (F) and 4T1 (I) tumor model.
(J and K) Bar plot showing relative levels of amino acids as measured by LC-MS in serum (J) and tumors (K) of PEG-GGT-treated CT26 tumors.
See also Figure S2.
In E, F, H, I, J, and K, analysis was performed using two tailed Student’s t test with Welsch’s correction and vertical bars show mean values with error bars representing SD. Student’s t test: ∗∗∗p < 0.001; ∗∗p < 0.01; ∗p < 0.05; ns, not significant.
As PEG-GGT persisted in circulation and efficiently depleted glutamine for at least 48 h in mice, we set out to test the effect of PEG-GGT on the growth of tumors in syngeneic mouse models. Since we wanted to study the integrated impact of glutamine depletion on cancer cells and immune cells in the TME, we chose the CT26 tumor model which is well characterized for high tumor immune infiltrates and T cell responses.39 We implanted CT26 subcutaneously in BALB/c mice, and after the tumor was palpable, we initiated treatment with PEG-GGT on a twice-weekly schedule (Figure 3D). PEG-GGT was well tolerated with no evident signs of toxicity and the kinetics of weight change were the same as the vehicle-treated group during the treatment (Figure S2A). There was no difference in the tumor growth rate of the PEG-GGT-treated and vehicle-treated group (Figure 3E) even though we did not detect any circulating glutamine (<50 nM) in serum during treatment (Figure 3F). To ensure that these results are generalizable across multiple tumor models, we implanted 4T1 breast cancer cells in mice and treated the animals with PEG-GGT using the same treatment schedule (Figure 3G). Consistent with the CT26 model, treatment of 4T1 tumors with PEG-GGT did not inhibit tumor growth in mice (Figure 3H) and changes in body weight were similar in treated and control groups (Figure S2B). We also confirmed that there was no circulating glutamine in the serum of PEG-GGT-treated tumor-bearing mice (Figure 3I). Collectively, these results demonstrate that while PEG-GGT treatment inhibits growth of cancer cells in vitro, it does not significantly impact tumor growth in vivo.
To map the impact of PEG-GGT on circulating metabolites and tumor metabolism, we measured the relative amounts of amino acids in serum and tumors of CT26 tumor-bearing mice treated either with PEG-GGT or vehicle using liquid chromatography-mass spectrometry (LC-MS) (Figure S2D). Consistent with our hypothesis that PEG-GGT does not hydrolyze asparagine, there was no significant difference in asparagine levels in serum of PEG-GGT and vehicle-treated mice (fold change [FC]: 0.9, p value = 0.45) (Figure 3J). We observed a significantly decreased concentration of GSH (FC: 0.03, p value = 0.0008) and an increased concentration of cysteine (FC: 1.2, p value = 0.01), cystine (FC: 3.9, p value = 0.0007), and glycine (FC: 1.8, p value = 0.005) in serum (Figure 3J). This observation is expected since PEG-GGT hydrolyses the GSH (reported concentration in serum ∼25 μM) to cysteinyl-glycine which can be further hydrolyzed to cysteine and glycine by membrane-bound dipeptidases.41,42 Mass spectrometry-based approaches for measuring amino acids, unfortunately, do not always resolve glutamine and lysine, which have the same molecular weight, especially when they have same retention time on liquid chromatography.43 Thus, while mass spectrometry reported only one-third reduction in glutamine/lysine concentration (Figure S2E), the direct enzymatic assay for quantifying glutamate/glutamine concentrations demonstrated a direct reduction in glutamine and a concomitant increase in glutamate (Figure 3F). In summary, PEG-GGT depletes circulating glutamine and GSH resulting in increased glutamate, cysteine/cystine, and glycine.
To map the metabolomic changes in the tumor tissue (which includes both interstitial/vascular and intracellular metabolites), we homogenized snap-frozen CT26 tumor tissue and performed LC-MS (Figure S2D). In the tumor tissue, we did not see a significant change in glutamate levels upon PEG-GGT treatment (FC: 0.9, p value = 0.26) (Figure 3K). Since the dominant contributor to the total glutamate is likely the intracellular glutamate,44 our results suggest that unlike in vitro treatment, PEG-GGT treatment did not significantly reduce intracellular glutamate. One hypothesis that can explain these results is that the other non-tumor cells in the tumor function as reservoirs of glutamate.45 Consistent with the serum and in vitro profiling, however, we observed a significant reduction in GSH (FC: 0.5, p value = 0.05) and an increase in cysteine (FC: 2.2, p value = 0.001) and cystine (FC: 5.3, p value = 0.05) levels in PEG-GGT-treated tumors (Figure 3K). Unexpectedly, proline concentrations were also decreased (FC: 0.7, p value = 0.02) in PEG-GGT-treated tumors (Figure 3K). Both GSH and proline are present at millimolar concentrations (GSH 5–10 mM, proline: 1–2 mM) inside the cell and need glutamate for their synthesis.44 Recent reports have shown that the inhibition of proline synthesis allowed proliferation of cancer cells in glutamine-limiting conditions.46 Because LC-MS could not distinguish lysine and glutamine, we used the enzymatic assay to measure glutamine in PEG-GGT- and vehicle-treated tumors but while there was an overall reduction in the glutamine concentrations, this was not significant in our small sample size (FC = 0.3, p value = 0.32) (Figure S2C). In summary, despite the extracellular increase in glutamate concentrations, intracellular concentrations of glutamate were not altered in the tumor wherein cells maintain their glutamate pool in glutamine-limited environments marked with downregulation of proline and GSH.
Since we observed an increase in cysteine/cystine concentrations in serum and tumor of PEG-GGT-treated mice, we wanted to test whether increased cysteine/cystine generated from hydrolysis of GSH could be responsible for difference in tumor cell proliferation in vitro and in vivo. We treated cells cultured in RPMI-1640 media containing 2 mM glutamine with 10 μg/mL PEG-GGT and supplemented the media with either 100 μM GSH or 100 μM N-acetyl cysteine (NAC). Supplementing the media with either GSH or NAC did not rescue the cell proliferation (Figures S1D and S1E). These results confirmed that unlike increase in cysteine/cystine from GSH/GSSG hydrolysis, the primary impact of PEG-GGT is glutamine depletion leading to arrest in cell proliferation.
Transcriptomics reveals adaptation pathways upon glutamine depletion
To understand how tumors adapt to low extracellular glutamine in vivo, we sequenced mRNA isolated from CT26 tumors treated either with PEG-GGT or vehicle (Figure 4A). 223 genes were differentially upregulated while 262 were downregulated (Log2FC > 0.3, false discovery rate (FDR)<0.1). As glutamine is indispensable for nucleotide synthesis, and nucleotide availability has a profound impact on the cell cycle,47 it is not surprising that several candidate genes associated with the cell cycle like Brca1, Polq, Cdc6, and Mcm family proteins were significantly upregulated in the PEG-GGT-treated tumors in comparison to the vehicle-treated tumors (Figure 4B). Since glutamine is a major substrate for amino acid synthesis, consistent with several reports of translation downregulation upon glutamine deprivation, we observed significant downregulation of eukaryotic translation initiation factors Eif4b and Eif2a and multiple ribosomal protein genes like Rpl28, Rps28, and Rps12.48,49
Figure 4.

Transcriptomics reveals adaptation pathways upon glutamine depletion
(A) Schematic of the study design for RNA-seq upon PEG-GGT treatment. (n = 3).
(B) Volcano plot showing differentially expressed genes in PEG-GGT-treated tumors compared to vehicle (PBS, 10% glycerol)-treated tumors.
(C) Plot showing differentially expressed hallmark gene sets (FDR<0.01) in PEG-GGT-treated tumors compared to vehicle-treated tumors.
(D) Visualization of differentially expressed (FDR Q value < 0.05) gene ontology biological processes (GOBP) clusters using Cystoscape. Each dot in a cluster represents a GOBP gene set, red color indicates enriched pathways while blue indicates downregulated pathways in the PEG-GGT-treated group. The thickness of the line connecting two dots represents shared genes in the GOBP datasets.
See also Figure S3.
To analyze the differentially expressed pathways, we performed gene set enrichment analysis (GSEA).50 Since glutamine depletion-mediated reduction of nucleotide pool leads to accumulation of single-stranded DNA which activates ATR kinase,47,51 we observed an upregulation of genes related to ATR kinase activation upon replication stress (Figure S3A). Consistent with the activation of the G2M checkpoint downstream of ATR signaling,52 we observed a strong upregulation of G2M checkpoint signaling upon glutamine depletion (Figure 4C). To adapt to increased replication stress, cells must synthesize DNA at a higher rate and since E2F transcription factors directly regulate the synthesis of S phase proteins for DNA synthesis, we observed an increase in E2F target transcripts including genes involved in DNA replication53 (Figures 4D and S3B). Finally, since glutamine deficiency induces DNA alkylation damage via inhibition of ALKBH enzymes, GSEA analyses identified several significantly enriched gene clusters related to DNA damage response54 (Figure 4D). To validate if these pathways were also relevant upon glutamine depletion in vitro, we used quantitative reverse-transcription PCR to quantify transcript abundances of some of the genes that were most significantly upregulated in our RNA-seq data. Transcripts of Brca1 which is associated with DNA repair, Polq which has DNA polymerase activity, and Cdc6 which assembles pre-replicative complex were all significantly upregulated in CT26 cells treated with PEG-GGT for five days in vitro (Figure S3G). In aggregate, these results demonstrate that glutamine makes an indispensable contribution to the nucleotide pool, and upon depletion of glutamine, cells upregulate pathways associated with DNA replication and DNA repair pathways to compensate for the replication stress.
Many reports support that Myc expression reinforces glutamine dependency in diverse cancer models.55 Since CT26 tumors overexpress Myc,39 we used the RNA-seq data to test the impact of glutamine depletion on Myc-overexpressing tumors. Unexpectedly, Myc target genes were upregulated upon glutamine depletion via PEG-GGT, suggesting a potential adaptive mechanism to maintain the nucleotide pool56 (Figures 4B, 4C, and S3D). Specifically, genes like Cad, Ppat, and Pfas, which directly use glutamine’s γ-nitrogen for nucleotide synthesis and have previously been demonstrated to be under the control of Myc, exhibited a significant upregulation in the PEG-GGT-treated group. Furthermore, there was a pronounced enrichment of gene sets pertaining to nucleotide biosynthesis and one-carbon metabolism (Figure 4D). Collectively, our RNA-seq data suggest that in vivo glutamine depletion leads to an elevation in the expression of downstream targets of Myc, including genes responsible for nucleotide synthesis.
To explore the mechanisms underlying cellular adaptation to the depletion of extracellular glutamine, we investigated if cells synthesize glutamine intracellularly. Accordingly, we focused on Glul which is the only enzyme capable of intracellular glutamine synthesis.57 Since the abundance of Glul protein is determined by post-translational modification via glutamine-dependent acetylation and subsequent proteasomal degradation,58 we did not observe an upregulation in Glul transcripts in PEG-GGT-treated tumors in comparison to the untreated tumors (Figure 4B). The mammalian target of rapamycin complex 1 (mTORC1) inhibits proteasomal degradation of Glul.59 We observed an increase in mTORC1 target transcripts (Figures 4C and S3C) suggesting that mTORC1 might function to stabilize Glul. To verify if mTORC1 activity is essential for cell growth under glutamine depletion, we treated CT26 cells either with PEG-GGT, mTORC1 inhibitor temsirolimus, or both.60 While 20 μg/mL temsirolimus in culture media containing glutamine did not affect cell growth, the combination of 10 μg/mL PEG-GGT and 20 μg/mL temsirolimus inhibited cell growth to a much greater extent than PEG-GGT alone (p value = 0.003, Figure S3H). Thus, upon glutamine depletion, there is an increase in mTORC1 signaling which when inhibited inhibits cell proliferation.
To investigate the impact of glutamine depletion on the immune system, we focused on immune-related pathways within our RNA-seq data. We observed a significant downregulation of interferon-alpha (IFN-α), interferon-gamma (IFN-γ), and tumor necrosis factor alpha (TNF-α) responses upon treatment with PEG-GGT (Figures 5A, 5B, and S3E). To investigate the changes in the immune cell composition upon glutamine depletion in vivo, we performed immune cell deconvolution using mouse immune cell gene signatures published in the ImmGen database.61,62 We observed that tumors treated with PEG-GGT were significantly enriched in macrophages (F4/80+ICAM2+) and deprived of dendritic cells (Cd11c+MHCII+Flt3+) (Figure 5C). As macrophages can either have a pro-inflammatory (M1) or anti-inflammatory (M2) phenotype, we investigated the M1 and M2 markers in our RNA-seq data and observed enrichment of bona fide M2 markers Mrc1(Cd206), Cd163, and F13a1. We also observed a reduction in Cd86, H2-Ab1(MHC-II), and Ido1 which are known markers of M1 macrophages63,64 (Figure 5D). Collectively, our RNA-seq data suggest that extracellular glutamine depletion compromises anti-tumor immunity which is marked by downregulation of IFN-α, IFN-γ, and TNF-α responses and an increased frequency of anti-inflammatory macrophages.
Figure 5.

Enzymatic depletion of circulating glutamine is immunosuppressive
(A and B) Enrichment plot (left) and heatmap (right) of genes involved in IFN-ɑ (A) and TNF-ɑ (B) response upon PEG-GGT treatment.
(C and D) Plot representing relative fraction of immune cells in PEG-GGT- and vehicle-treated mice calculated from the deconvolution of RNA-seq data (C). B, B cells; T, T cells; NK, NK cells; DC, dendritic cells; GN, granulocytes; MF, macrophages. Heatmap of M1 and M2 transcripts in PEG-GGT- and vehicle-treated mice (D).
(E) Violin plot of percentage of CD206high macrophages in the PEG-GGT- and vehicle-treated group. (vehicle: n = 6, PEG-GGT: n = 8).
(F–H) Violin plot of percentage of PMN-MDSCs and Cd11b+GR-1+ cells in PEG-GGT-treated tumors (F, H). Bar plot of relative mRNA expression of G-CSF and GM-CSF transcripts upon PEG-GGT treatment in CT26 cell line in vitro (G) (n = 4).
(I and J) Violin plot showing percentage of CD8 (I) and NK (J) cells in PEG-GGT- and vehicle-treated tumors.
See also Figure S4.
In C, E, F, G, H, I, and J, analysis was performed using two-tailed Student’s t test with Welsch’s correction. In C and G, vertical bars show mean values with error bars representing SD. In A, B, and D, the scale of the heatmaps represent Z score. Student’s t test: ∗∗∗p < 0.001; ∗∗p < 0.01; ∗p < 0.05; ns, not significant.
Enzymatic depletion of circulating glutamine is immunosuppressive
To validate our finding that depletion of extracellular glutamine is immunosuppressive, we used flow cytometry to phenotype the tumor-infiltrating myeloid and lymphoid immune populations (Figure S4A). We implanted CT26 tumors subcutaneously and utilized the same PEG-GGT treatment schedule as before (Figure 3D). To ensure that we harvested enough cells for myeloid and lymphoid phenotyping, we harvested the tumor when the average volume reached 300–400 mm3 (7th day after treatment). In accordance with our transcriptomic data, macrophages (Cd45+Cd11b+Ly6CloF4/80+) in PEG-GGT-treated tumors were skewed toward M2 phenotype as Cd206high macrophages were significantly enriched in PEG-GGT (40% ± 13%) vs. vehicle-treated mice (25% ± 8%, p value = 0.03) (Figure 5E). Furthermore, we observed a significant increase in the polymorphonuclear MDSC (PMN-MDSC) (Cd45+Cd11b+Ly6CloLy6G+) population upon PEG-GGT treatment (7% ± 3%) compared to vehicle (1% ± 1%, p value = 0.0003) (Figure 5F). As PMN-MDSC accumulation in tumors is associated with G-CSF and GM-CSF secretion, we observed 15 ± 3- (p value = 0.003) and 18 ± 2 (p value = 0.0003)-fold increase in transcript levels of these genes respectively in CT26 cells treated with PEG-GGT in vitro65,66 (Figure 5G). Cd11b+GR-1+ cells which form a major population of MDSCs were also enriched in PEG-GGT-treated tumors (PEG-GGT: 16% ± 2% vs. vehicle: 6% ± 1%, p value = 0.0008) (Figure 5H).67 Unlike PMN-MDSCs, the frequency of monocytic MDSCs (Cd45+Cd11b+Ly6ChighLy6G−) did not differ between the PEG-GGT- (5.3% ± 1.3%) and vehicle-treated (3.7% ± 0.6%, p value = 0.3) group (Figure S4F). The frequency of infiltrating CD8 T cells (PEG-GGT: 2.5% ± 0.8% vs. vehicle: 3.2% ± 0.7%, p value = 0.50) and natural killer cells (PEG-GGT: 0.7% ± 0.6% vs. vehicle: 2.4% ± 1.0%, p value = 0.09) did not change significantly after PEG-GGT treatment (Figures 5I and 5J). In summary, our flow cytometry data demonstrate that depletion of glutamine through PEG-GGT induces a state of immunosuppression, marked by a notable enrichment in populations of PMN-MDSCs and M2 macrophages.
Glutamine depletion is not associated with favorable outcomes in human cancers
To determine whether glutamine depletion could be of therapeutic benefit in human cancers and whether it was associated with immunosuppressive phenotype as seen in our tumor model, we derived a gene signature associated with glutamine depletion (Figure 6A). To ensure that our gene signature is broadly reflective of glutamine depletion, we used the differentially expressed genes (FDR<0.1) from our study and a recent study in which two pancreatic cancer cell lines (SUIT2 and 89388T) were adapted to grow in low glutamine media59 (Figure 6A). Based on the core set of genes common to all three datasets, we derived the glutamine depletion signature (Table S2).
Figure 6.

Glutamine depletion is not associated with favorable outcomes in human cancers
(A) Schematic representing the construction of gene signature associated with glutamine depletion in human cancers and workflow for TCGA analysis of this gene signature.
(B–D) Violin plot showing ssGSEA glutamine depletion score for breast cancer categorized by tumor size (B), molecular subtype (C), and stage (D).
(E, H, and J) Kaplan-Meier plot of five-year overall survival probability for glutamine depletion high and glutamine depletion low groups in breast (E), pancreatic (H), and liver (J) cancers.
(F) Heatmap of PMN-MDSC gene signature in PEG-GGT-treated tumors.
(G, I, and K) Violin plot of PMN-MDSC score for glutamine depletion high and glutamine depletion low groups in breast (G), pancreatic (I), and liver (K) cancers.
See also Figure S5.
In B, C, D, G, I, and K, analysis was performed using two-tailed Student’s t test with Welsch’s correction. In F, the scale of the heatmap represents a Z score. Student’s t test: ∗∗∗p < 0.001; ∗∗p < 0.01; ∗p < 0.05; ns: not significant. In E, H, and J, survival analysis was performed using the log rank test.
To investigate if our glutamine depletion signature had translational relevance, we took advantage of human tumors within the TCGA. We investigated combined transcriptomic and clinical/pathological annotations in nine human cancers. To quantify the enrichment of our glutamine depletion gene signature in patient transcriptomic data, we performed single-sample GSEA (ssGSEA).68 Samples in the first quartile with the highest expression of glutamine depletion signature were labeled “Gln depletion high” and those in the last quartile were labeled “Gln depletion low” (Figure 6A). A high glutamine depletion ssGSEA score was not associated with significantly favorable prognostic outcome in most cancers (Figures 6E, 6H, 6J, and S5). Consistent with our data showing no therapeutic benefit of glutamine depletion in 4T1 tumor model, the five-year overall survival (OS) did not differ for both groups in breast cancer (HR [hazard ratio]: 1.1, 95% CI: 0.7 to 1.8). The five-year OS for patients in the “Gln depletion high” group was significantly lower in liver hepatocellular carcinoma (HR: 2.9, 95% CI: 1.8 to 4.9) and pancreatic adenocarcinoma (HR: 3.1, 95% CI: 1.7 to 5.6). The five-year OS for the “Gln depletion high” group was significantly better only in stomach adenocarcinoma (HR: 0.6, 95% CI: 0.4 to 1) (Figure S5F). Thus, our data suggest that glutamine deprivation is not associated with better outcomes in multiple human cancers.
We next evaluated if glutamine depletion score differed in different pathological subcategories of breast cancer like tumor size, molecular subtype, and stage. We observed that the glutamine depletion ssGSEA score was significantly higher in larger tumors (T2) than smaller tumors (T1) (0.71 ± 0.15 vs. 0.64 ± 0.14, p value = 10−9) (Figure 6B). Among the different molecular subtypes of breast cancers, glutamine depletion ssGSEA score was significantly enriched in more aggressive cancers like luminal B, HER2+, and basal compared to normal and luminal A breast cancers (0.81 ± 0.11 vs. 0.60 ± 0.10, p value <10−16) (Figure 6C). Furthermore, glutamine depletion ssGSEA score was higher in advanced stage II and stage III tumors compared to stage I tumors (0.70 ± 0.15 vs. 0.65 ± 0.15, p value = 10−4) (Figure 6D). Taken together, glutamine deprivation is associated with increased tumor size and more aggressive phenotypes in human breast cancers.
As our data showed that low glutamine in TME was associated with increased infiltration of PMN-MDSCs, we wanted to test whether this was also consistent in human cancers. Because of their low transcriptional activity and close resemblance to neutrophils, we still lack a unifying gene signature for PMN-MDSCs.69 However, there have been several reports of the differences in the expression of PMN-MDSCs compared to other MDSCs and neutrophils.70,71 We derived a seven-gene signature (S100A8, S100A9, LYZ1, MMP8, MMP9, SLC27A2, and IL4R) for PMN-MDSCs based on several recent reports including single-cell RNA-seq from 33 glioma patients.70,71,72,73,74 We validated this signature with our mouse RNA-seq data and confirmed that these genes were indeed upregulated in PEG-GGT-treated tumors, consistent with our flow cytometry data on the same tumors (Figure 6F). To restrict our analysis to immune cells and remove bias from tumor cells in the TCGA RNA-seq data, we calculated the fraction of immune cells in the tumor using EPIC.75 We then normalized the expression of the signature genes based on immune cell infiltration and calculated “PMN-MDSC score” as the sum of Z scores of all the genes in the signature.76 When we tested this signature in the TCGA dataset, we found that the “Gln depletion high” group had significantly higher PMN-MDSC scores in breast (0.4 ± 0.2 vs. −0.4 ± 0.3, p value = 0.04), pancreatic (0.5 ± 0.7 vs. −1.8 ± 0.9, p value = 0.04), and liver cancer (1.0 ± 0.5 vs. −0.4 ± 0.4, p value = 0.02) (Figures 6G, 6I, and 6K). Taken together, these results demonstrate that glutamine depletion is likely associated with the accumulation of PMN-MDSCs in the TME and is not associated with a therapeutic benefit in human cancers.
Discussion
Glutamine contributes to major anabolic pathways and is consumed at a high rate during cell growth which often leads to its depletion in the tumor core.25 To investigate how depletion of glutamine alters the tumor and immunological landscape in vivo, we leveraged the high-affinity glutaminase activity (low KM) of hp-GGT and repurposed it as a potent in vivo glutaminase (with no asparaginase activity). We showed that PEG-GGT had a half-life of 67 ± 8 h in serum, and a dose of 20 mg/kg could efficiently eliminate circulating glutamine to undetectable levels without affecting asparagine for at least 48 h in BALB/c mice. Our approach is different from other studies that have utilized highly efficient glutaminases-asparaginases of bacterial origin to systemically deplete glutamine. As de novo asparagine synthesis is dependent on glutamine, asparagine becomes an essential amino acid when glutamine is absent.77 Furthermore, asparagine directly binds to LCK to promote its activity and enhance T cell activation.78 Since the bacterial glutaminase-asparaginases deplete glutamine and asparagine simultaneously, we hypothesized that depleting glutamine while preserving asparagine provides a specific tool to investigate the selective impact of glutamine depletion. But to our knowledge, there have been no reports of high-affinity glutaminases (KM in the micromolar range) with no concomitant asparaginase activity.
When extracellular glutamine is abundant, intracellular glutamine triggers acetylation-dependent proteasomal degradation of glutamine synthetase (Glul), the only protein capable of intracellular glutamine synthesis.57 As extracellular glutamine becomes limiting, Glul degradation is inhibited, and it synthesizes glutamine intracellularly by ligating ammonia and glutamate.57,58 Since Glul is degraded upon glutamine accumulation, intracellular glutamine concentration can reach only a particular threshold via Glul. Hence, glutamine flux is redirected toward nucleotide and DNA synthesis, while flux toward protein synthesis is reduced by global downregulation of translation. In our metabolomic studies, we observed decreased levels of proline and GSH upon depletion of extracellular glutamine. In multiple human cancer cell lines, reducing proline biosynthesis conserved glutamate and allowed cells to proliferate in glutamine-limiting conditions providing a potential mechanism to adapt to glutamine depletion.46 In pancreatic cancer models, cells adapted to grow at a low glutamine concentration (100 μM) had significantly increased Glul protein although changes in mRNA levels were not different.65 Metabolomic and transcriptomic analysis showed that adapted clones indeed had a low concentration of intracellular glutamine, a significant flux of glutamine toward nucleotide synthesis, and increased mTORC1 signaling to avoid Glul degradation. Our metabolomics and transcriptomic results align well with this model.
As glutamine is indispensable for hexosamine biosynthesis, depletion of glutamine induces endoplasmic reticulum (ER) stress which increases G-CSF and GM-CSF secretion from tumors via Ire1α-Jnk pathway.65 Consistent with increased ER stress, genes related to unfolded protein response were upregulated in tumors upon PEG-GGT treatment. Treatment with PEG-GGT also significantly increased G-CSF and GM-CSF transcripts in CT26 cells in vitro. In mice, G-CSF and GM-CSF mobilize myeloid precursors from the bone marrow to the tumor, where they differentiate into PMN-MDSCs.65,66 Our flow cytometry data on PEG-GGT-treated tumors showed pronounced infiltration of PMN-MDSCs into the tumors.
Polarization of M0 macrophages to M1 or M2 macrophages is influenced by the ratio of α-ketoglutarate (α-KG) to succinate.79 Increased α-KG demethylates repressive H3K27Me3 M2 promoters via Jmjd3 while succinate inhibits Jmjd3 and promotes M1 phenotype by stabilizing HIF1ɑ.80 In cell culture, contradictory results have been reported. While one study reported that glutamine deprivation impaired the expression of M2 markers which was restored by treatment with cell-permeable dimethyl-α-KG,79 another study reported that depriving M0 macrophages of glutamine promoted M2 phenotype without any cytokines by increased expression of Glul, which reduced the GABA shunt-mediated flux of glutamate toward succinate.81 We observed an increase in M2 macrophages in PEG-GGT-treated tumors. While our data support the latter observation, we cannot rule out the possibility of the former. Since macrophages have been shown to uptake glutamate via SLC1A2,81,82 which is abundant in circulation upon glutamine hydrolysis, these cells might be able to maintain their α-KG pool.
To investigate whether glutamine depletion could be a viable strategy in human cancers, we developed a gene signature associated with glutamine depletion in cancers. We discovered that high glutamine depletion signature was not associated with favorable outcomes in most cancers, rather it was significantly unfavorable for pancreatic, liver, and skin cancers. Glutamine depletion signature was positively correlated with tumor size, stage, and aggressiveness in breast cancers. Moreover, a high glutamine depletion score was associated with increased infiltration of PMN-MDSC in breast, pancreatic, and liver cancers. Since glutamine is often depleted in the core of the TME,25 attempts to reinstate glutamine levels in the core might lift the immunological barriers created by tumor cells in the TME.
Multiple studies have tried to target the glutamine metabolism of tumors for therapeutic benefit. Enzymatic depletion of circulating glutamine via Pseudomonas 7A and Acinetobacter asparaginase glutaminase had no significant effect on the growth of syngeneic solid tumor models including non-metastatic breast cancer (EO771) and metastatic melanoma (B16). These studies however documented severe lymphodepletion and splenic weight loss in treated animals.27 It is to be noted that both these enzymes deplete both circulating glutamine and asparagine. In our studies utilizing PEG-GGT, we did not observe splenic weight loss compared to untreated mice and hence these differences in toxicity might be attributable to the simultaneous depletion (or lack thereof) of both amino acids. Nonetheless, consistent with the other two enzymes, PEG-GGT did not have an anti-tumor effect in the models we tested. Taken together, these observations suggest that enzymatic extracellular depletion of glutamine does not have an anti-tumor effect. Contrary to the immunosuppression induced by extracellular glutamine depletion, pan-inhibition of glutamine-utilizing enzymes in the TME via a prodrug of DON promoted anti-tumor immunity with decreased infiltration of MDSCs, polarization of macrophages to M1 phenotype, and reduced GM-CSF secretion in the TME.16,17 While a complete understanding of this complete opposite shift in immunological landscape upon DON treatment compared to PEG-GGT treatment is lacking, we acknowledge that these two modalities of targeting glutamine metabolism are fundamentally different as DON treatment inhibits glutamine metabolism and leads to accumulation of glutamine in the TME, while PEG-GGT depletes glutamine in the TME but does not inhibit intracellular glutamine metabolism. Moreover, effects of DON are concentration dependent which further complicates direct comparison. For example, treatment of 4T1 cells with 1 μM DON leads to reduced secretion of G-CSF and GM-CSF, while treatment with 50 μM DON leads to significantly increased secretion of G-CSF and GM-CSF.17,65 More studies are required on the role of different glutamine-utilizing pathways in different cell types in the TME to further understand the integrated impact of glutamine metabolism in tumors.
Since we have shown that PEG-GGT is a potent glutaminase with no asparaginase activity, we envision other applications of PEG-GGT as a molecular tool to deplete glutamine in live animals. For example, bacterial asparaginases are standard treatment for acute lymphoblastic leukemia, and there is considerable debate on the importance of glutaminase activity for therapeutic efficacy,83,84 PEG-GGT could be used to independently study the roles of glutamine and asparagine metabolism in these cancers. PEG-GGT can thus be used as a selective and efficient tool for glutamine depletion in diverse disease contexts including rheumatoid arthritis,85 acute respiratory distress syndrome,86 cancer cachexia,87 and cystic fibrosis.88
In conclusion, we show that enzymatic depletion of glutamine is immunosuppressive and does not inhibit tumor growth in vivo. We developed a glutamine depletion gene signature and showed that glutamine depletion is not associated with favorable clinical outcomes in human cancers. Our data suggest that glutamine-replete TME is required for optimal anti-tumor immune responses.
Limitations of the study
Our objective in this report was to document the impact of depleting extracellular glutamine in tumor models and understanding the impact of glutamine depletion on tumor growth. For this purpose, we engineered an enzyme designed to selectively deplete circulating glutamine while preserving asparagine. While our enzyme did not deplete circulating asparagine, it resulted in an elevation of plasma cysteine/cystine and glycine levels, the implications of which require further exploration. While we have demonstrated that glutamine depletion is not anti-tumor in the models we have studied, a more detailed investigation of the impact of glutamine depletion and metabolic fluxes upon glutamine depletion can be undertaken using metabolomics/mass spectrometry. Second, it would be important to extend our findings on immune cell infiltration with the CT26 model to other tumor models in mice. We ensure the generalizability of our results by deriving a glutamine depletion signature that we used to test the impact of glutamine depletion in human tumors. Our results illustrate that glutamine depletion is not associated with clinical benefit in diverse human tumors. Although we derived a signature for PMN-MDSC to investigate if these immunosuppressive cells are increased in glutamine-depleted tumors, we acknowledge that this signature is not ideal and that a better molecular signature for PMN-MDSC will be needed. Nonetheless, our work presents a tool for systemic depletion of glutamine without depleting asparagine in live animals and proposes that extracellular glutamine depletion will not be an effective anti-cancer therapeutic strategy.
STAR★Methods
Key resources table
| REAGENT or RESOURCE | SOURCE | IDENTIFIER |
|---|---|---|
| Antibodies | ||
| Anti-Mouse CD16/CD32 | BD Biosciences | #553142; RRID: AB_394657 |
| Anti-Mouse CD45-BUV395 | BD Biosciences | #564279; RRID: AB_2651134 |
| Anti-Mouse CD11b-BV421 | Biolegend | #101235; RRID: AB_10897942 |
| Anti-Mouse CD11c-BV785 | Biolegend | #117335; RRID:AB_11219204 |
| Anti-Mouse F4/80-APC/Cy7 | Biolegend | #123117; RRID: AB_893489 |
| Anti-Mouse Ly6C-PE | Biolegend | #128007; RRID: AB_1186133 |
| Anti-Mouse Ly6G-PerCP/Cy5.5 | Biolegend | #127615; RRID: AB_1877272 |
| Anti-Mouse CD206-AF488 | Biolegend | #141709; RRID: AB_10933252 |
| Anti-Mouse CD86-AF700 | Biolegend | #105023; RRID: AB_493720 |
| Anti-Mouse CD3-APC | Biolegend | #100235; RRID: AB_2561455 |
| Anti-Mouse CD4-AF594 | Biolegend | #100446; RRID: AB_2563182 |
| Anti-Mouse CD8-PerCP/Cy5 | Biolegend | #100731;RRID: AB_893427 |
| Anti-Mouse NKp45-e450 | Invitrogen | #48-3351-82 |
| Anti-Mouse CD19-APC-Cy7 | Biolegend | #115519; RRID:_AB_313654 |
| Anti-Mouse FOXP3-AF488 | Biolegend | #126405;RRID: AB_1089114 |
| Bacterial and virus strains | ||
| E. coli Rosetta-2 | Novagen | #71402 |
| E. coli MC1061 | ThermoFisher | #C66303 |
| Chemicals, peptides, and recombinant proteins | ||
| Chloramphenicol | Sigma | #C0738 |
| Kanamycin | Sigma | #K1377 |
| isopropyl β-D-thiogalactopyranoside (IPTG) | FisherScientific | #BP1755-10 |
| Imidazole | Sigma | #I0250 |
| Universal nuclease | Thermofisher | #88700 |
| Protease inhibitor cocktail | Sigma | #P8849 |
| Triton X-114 | Sigma | #X114 |
| Methoxy-PEG-CH2COO-NHS, Mw 5,000 | Sunbright | #ME-050AS |
| γ -(p-nitroanilide) (γGPNA) | Sigma | #G1135 |
| Ninhydrin reagent | Sigma | #151173 |
| RPMI-1640 | Corning | #10-040-CV |
| Dialyzed Fetal bovine serum (dFBS) | Sigma | #F0392 |
| Fetal bovine serum (FBS) | RnD Biosystems | #S11150 |
| 3-(4,5-Dimethylthiazol-2-yl)-2,5-diphenyltetrazolium bromide (MTT) | VWR | #97062-376 |
| Temsirolimus | Selleckchem | #S1044 |
| Sytox green | ThermoFisher | #S7020 |
| Collagenase D | Roche | #11088858001 |
| DNAse | Sigma | #DN25 |
| Live/dead aqua die | ThermoFisher | #L34957 |
| L-Methionine-sulfoximine (MSO) | Sigma | #M5379 |
| Critical commercial assays | ||
| bicinchoninic acid (BCA) assay | ThermoFisher | #23225 |
| chromogenic endotoxin detection kit | ThermoFisher | #A39552S |
| Promega Glutamine/Glutamate Glo kit | Promega | #J8021 |
| Total glutathione assay kit | Cayman | #703002 |
| RNeasy kit | Qiagen | #74104) |
| cDNA reverse transcription kit | Invitrogen | #4368813 |
| SsoFastTM EvaGreen® Supermix with Low ROX | Bio-Rad | # 1725211 |
| Deposited data | ||
| Raw and analyzed RNA-seq data | This Paper | GEO: GSE247472 |
| Raw data | Tsai et al.59 | GEO: GSE144833 |
| The Cancer Genome Atlas | National Cancer Institute (NCI) and National Broad Institute Human Genome Research Institute (NHGRI) | www.firebrowse.org |
| Experimental models: Cell lines | ||
| CT26 | ATCC | #CRL-2638 |
| 4T1 | ATCC | #CRL-2539 |
| MC38 | Sigma-Aldrich | #SCC172 |
| Experimental models: Organisms/strains | ||
| Mouse: BALB/c | Charles River Laboratories | BALB/cAnNCrl |
| Recombinant DNA | ||
| hpGGT gene sequence | IDT | N/A |
| pET-28a | Novagen | # 69864 |
| Software and algorithms | ||
| GraphPad Prism | GraphPad | V9.0 |
| STAR alignment | Dobin et al.89 | https://github.com/alexdobin/STAR |
| R (v 4.0.1) | R | r-project.org |
| DESeq2 | Love et al.90 | https://bioconductor.org/packages/release/bioc/html/DESeq2.html |
| GSEA | UC San Diego and Broad Institute | gsea-msigdb.org |
| ssGSEA | Barbie et al.68 | https://github.com/broadinstitute/ssGSEA2.0 |
| Cytoscape | Shannon et al.91 | https://cytoscape.org |
| RSEM | Li et al.92 | https://github.com/deweylab/RSEM |
| CIBERSORTx | Newman et al.62 | https://cibersortx.stanford.edu |
| AriaMX | Agilent | Version 2.1 |
| EPIC | Racle et al.75 | https://github.com/GfellerLab/EPIC |
| Biorender | Biorender | www.biorender.com |
| FlowJo | BD Biosciences | FlowJo v10 |
| Other | ||
| 10 kDa NMWCO centrifugal filters | Sartorius | #VS2002 |
Lead contact
Further information and requests about this study should be directed to and will be fulfilled by the lead contact, Navin Varadarajan (nvaradar@central.uh.edu).
Materials availability
This study did not generate new unique reagents.
Data and code availability
RNA-seq data has been deposited at GEO (GSE247472) and are publicly available as of the date of publication. Accession numbers are listed in the key resources table.
This paper does not report original code.
Any additional information required to reanalyze the data reported in this paper is available from the lead contact upon request.
Experimental model and study participant details
Cell lines
All studies using animal experiments were reviewed and approved by the University of Houston (UH) IACUC (Institutional Animal Care and Use Committee). We bought CT26 and 4T1 cell lines from ATCC. MC38 cell line was provided by Dr. Wei Peng (UH). All cell lines were cultured in RPMI-1640 media supplemented with 10% fetal bovine serum (FBS), 2 mM L-Glutamine, 10 mM HEPES buffer and 1% penicillin-streptomycin maintained at 5% CO2, 80% relative humidity and 37°C. We routinely tested all cell lines for mycoplasma using RT-PCR.
Bacterial strains
We used E. coli MC1061 strain for plasmid transformation and propagation. For protein expression, we used E. coli Rosetta-2 strain. We used 2xYT media to culture bacterial strains.
Animals
All studies using animal experiments were reviewed and approved by the University of Houston (UH) IACUC (Institutional Animal Care and Use Committee) under protocol PROTO202000039. We purchased the female, 6–8-week-old BALB/c mice from Charles River Laboratories. Sex/gender as a variable was not tested.
Method details
Generation of hp-GGT expression constructs
We expressed hp-GGT as described in a previous study.33 The gene encoding GGT in H. pylori has been sequenced and is available on the KEGG database (entry HP1118). Codon optimized 1.7 kb fragment corresponding to hp-GGT sequence excluding the 26 amino acid periplasmic signal peptide sequence was provided by Integrated DNA Technologies and was PCR amplified with overhang primers containing NdeI and XhoI sites. We cloned this fragment in the pET28a (Novagen) vector using NdeI and XhoI restriction sites by Gibson Assembly. The use of the NdeI site in pET-28a allowed us to include a thrombin cleavable His-tag at the N-terminal of the expressed hp-GGT. We sequenced the construct between the T7 promoter and stop codon through Sanger sequencing (Genewiz) and protein sequence was identical to the HP1118 protein sequence excluding the signal peptide. To introduce the T380A mutation in the construct expressing hp-GGT, we generated two overlapping PCR fragments using appropriate primers to introduce the desired mutation in the overlapping region and assembled the fragments using Gibson Assembly. We propagated the plasmid in E. coli MC1061 strain.
Expression and purification of hp-GGT and synthesis of PEG-GGT
We transformed hp-GGT containing pET28a plasmid in Escherichia. coli strain Rosetta 2(DE3) (Novagen) and allowed the bacteria to grow on kanamycin and chloramphenicol-resistant lb-agar plates. We picked a single colony and inoculated it in 2xYT medium containing 34 μg/mL chloramphenicol (Sigma, #C0738) and 50 μg/mL kanamycin (Sigma, #K1377) and grew the culture overnight at 37°C and 250 rotations per minute (rpm). We used this starter culture to inoculate fresh 2xYT media with kanamycin and chloramphenicol concentrations same as for the starter culture. We kept the OD (Culture absorbance at 600 nm) at the start of the culture at 0.01. We allowed this culture to grow at 37°C with shaking at 250 rpm till the OD reached 0.5–0.6. At this point, we induced GGT expression by adding isopropyl β-D-thiogalactopyranoside (IPTG) (FisherScientific, #BP1755-10) to a final concentration of 500 μM and grew the culture further for 8 h. We then centrifuged the culture at 6000 ×g for 20 min, decanted the supernatant, and harvested the cells. We resuspended the bacterial pellet in lysis buffer containing (50 mM NaH2PO4, 300 mM NaCl, 10 mM Imidazole (Sigma, #I0250), 0.05% Tween 20, pH = 8), universal nuclease (Thermofisher, #88700) and protease inhibitor cocktail (Sigma, #P8849). We then lysed the cells by sonication and centrifuged the lysate at 21000 ×g for 10 min at 4°C. We extracted GGT from the supernatant by affinity chromatography using Nickel chelating columns. We first equilibrated the column with binding buffer (20 mM NaH2PO4, 500 mM NaCl, 10 mM imidazole, pH = 7.4). We then passed the bacterial supernatant through the column followed by a wash with the binding buffer. To remove the endotoxins, we washed the column with 200 column volumes of sterile ice-cold 0.1% Triton X-114 (Sigma, #X114) in PBS overnight. We washed the column further with 20 column volumes of sterile PBS to wash the Triton X-114. Finally, we eluted the protein in the elution buffer (20 mM NaH2PO4, 500 mM NaCl, 500 mM imidazole, pH = 7.4). We then buffer exchanged the eluted recombinant hp-GGT with PBS using 10 kDa NMWCO centrifugal filters (Sartorius) and stored the protein at 4°C. We then incubated the purified enzyme at 37°C for 6 h for complete maturation of the enzyme. We determined the protein concentration by bicinchoninic acid (BCA) assay.
To make PEG-GGT, we concentrated hp-GGT in PBS to 5 mg/mL using 10 kDa NMWCO centrifugal filters and added Methoxy-PEG-5000 (methoxy-PEG-CH2COO-NHS, Mw 5,000) (Sunbright, #ME-050AS) powder to the solution at a molar ratio of 100:1 (100 molecules of PEG per molecule of hp-GGT) and mixed gently for 1 h at 4°C. We removed excess PEG by buffer exchange with PBS using 10 kDa NMWCO centrifugal filters. We concentrated PEG-GGT to 5 mg/mL in 10% glycerol, sterile filtered using 0.22 μM filter, and stored PEG-GGT at −80°C. We tested PEG-GGT for endotoxins using a chromogenic LAL-based detection assay (ThermoFisher, #A39552S).
Kinetic characterization of hp-GGT and PEG-GGT
We investigated the kinetic parameters for hydrolysis of γ-glutamyl compounds using substrate analog L-Glutamic acid γ-(p-nitroanilide) (γGPNA) (Sigma, #G1135). The hydrolysis of GNA produces 4-nitroaniline whose release can be continuously measured at 412 nm. We made serial dilutions of γGPNA in 100 mM Tris-HCl (pH = 6.5) to obtain concentrations ranging from 1000 μM to 3.9 μM. We added 10 μL of GGT (40 μg/mL, 100 mM Tris, pH = 6.5) to 190 μL substrate γGPNA in a flat transparent 96-well plate to get a final concentration of 2 μg/mL GGT. For each γGPNA substrate concentration, the corresponding control with no enzyme was also set up to determine the non-enzymatic rate of hydrolysis. We continuously recorded the absorbance of the samples at 412 nm and 37°C immediately after the addition of the enzyme using a plate reader (Infinite 200 Pro-Tecan Life Sciences). We obtained a standard curve relating to 4-nitroanaline concentration and absorbance and calculated the extinction coefficient. We determined the kinetic constants Vmax and KM from the Lineweaver Burk plot and direct fit to Michaelis Menten equation. For determining the asparaginase activity of PEG-GGT, we added 0.1 and 0.2 mg/mL PEG-GGT to 2.5 mM asparagine in 100 mM Tris-HCl, pH = 8, and measured asparagine concentration after 8 h. For determining asparagine concentration after PEG-GGT incubation, we used a colorimetric method as described previously using ninhydrin reagent (Sigma, #151173).93
Cell culture and cell viability assays
We studied the effects of glutamine depletion on 4T1, CT26, and MC38 cell lines. MC38 cell line was provided by Dr. Wei Peng (UH). We bought 4T1 and CT26 cells from ATCC. For each cell line, we seeded 5x10⁴ cells in 500 μL RPMI-1640 (Corning) media supplemented with L-glutamine (2 mM) and 10% FBS (RnD Biosystems, S11150) in a 24-well plate. We incubated the cells at 37°C and 5% CO2. After 24 h, we removed the media and washed the cells with 500 μL PBS. In the first group, we added 750 μL RPMI-1640 medium without L-glutamine supplemented with 10% dialyzed FBS (dFBS) (Sigma, #F0392) and 2 mM L-glutamine to each well. In the second group, we added PEG-GGT at 10 μg/mL in addition to the media added in group 1. In the third group, we added 750 μL RPMI-1640 media without L–glutamine but supplemented with 10% dialyzed FBS (dFBS). After every 24 h, we measured the cell viability of 3 wells from each group using MTT assay. For studying the combined effect of PEG-GGT and mTORC1 inhibition on cell growth, we performed a similar assay with regular RPMI-1640 media, and either PEG-GGT (10 μg/mL) or Temsirolimus (20 μg/mL) (Selleckchem, #S1044) or both were added to the wells.
We used a standard MTT assay to determine the viability of cells under different media conditions. We dissolved MTT powder (VWR, #97062-376) in PBS (pH = 7.4) to 5 mg/mL. We prepared a solubilization solution by dissolving 40% v/v dimethylformamide (DMF) in 2% v/v glacial acetic acid and further dissolving 16% w/v sodium dodecyl sulfate (SDS) into this solution (pH = 4.7). For measuring the cell viability, we added 75 μL MTT solution to 750 μL media to achieve a final concentration of 0.45 mg/mL of MTT. We incubated the culture at 37°C and 5% CO2. After 3 h, we removed the media with MTT and added 500 μL solubilization solution to dissolve the formazan crystals formed. The absorbance of this solution at 570 nm is directly proportional to the number of viable cells.
For the fluorescence-based cytotoxicity assay, we seeded 104 cells in a transparent 96-well plate and grew them in RPMI-1640 media. After 24 h, we replenished the media with RPMI-1640 media containing L-glutamine and 100 nM Sytox green (ThermoFisher, #S7020) and added either PEG-GGT (10 μg/mL), MSO (Sigma, #M5379) (0.5 mM) or both to the wells. We then incubated the cells at 37°C and 5% CO2 and imaged 4 fields of view under brightfield and GFP channel (488 nm) in each well every hour for 24 h at 10× magnification (BioTek Cytation). We labeled the dead cells as fluorescence-positive cells in the 488 nm channel and counted them using ImageJ. For studying the impact of GSH, GSSG and NAC on proliferation of cells in presence of PEG-GGT, we made 10 mM GSH, GSSG and NAC solution in ultrapure water and adjusted the pH to 7.4. We added GSH, GSSG and NAC at final concentration of 100 μM.
Cell culture metabolite assays
We cultured CT26 cells in 24 well plates to 60% confluency in RPMI-1640 media with 10% FBS. We then washed the cells and replaced the media with RPMI-1640 media without glutamine and 10% dialyzed FBS (dFBS) supplemented with either 2 mM glutamine or 2 mM glutamine and 10 μg/mL PEG-GGT. After 48 h, we washed the cells twice with PBS. We added 200 μL of 80% methanol solution stored at −80°C to the wells and kept the plate in −80°C for 10 min. We then scraped off the cells and vortexed the solution at 4°C for 5 min. We then sonicated (40 kHz) the cells at 4°C for 15 min. Finally, we centrifuged the mixture at 20000 g at 40°C for 10 min. We vacuum evaporated the methanol-water solution and reconstituted the metabolites in 20 μL PBS. We determined the glutamine and glutamate levels in serum by enzymatic assay detection kit according to the manufacturer’s protocol (Promega Glutamine/Glutamate Glo kit). We assayed the total glutathione by an enzymatic assay kit according to manufactures protocol (Cayman total glutathione assay kit: #703002).
PEG-GGT in vivo pharmacokinetics and pharmacodynamics
All studies using animal experiments were reviewed and approved by the University of Houston (UH) IACUC (Institutional Animal Care and Use Committee). We purchased the female 6 to 8-week-old BALB/c mice from Charles River Laboratories. 8 mice were administered PEG-GGT at a dose of 20 mg/kg body weight (b.w). We collected mouse serum at 8, 24, 48, and 72 h. To determine the PEG-GGT concentration in serum, we first prepared a standard curve in which we compared the rate of γGPNA hydrolysis by adding 5 μL of PEG-GGT at different concentrations to 200 μL of 0.5 mM γGPNA in PBS spiked with 5 μL of serum from untreated tumor-bearing mice. We also confirmed that serum from non-treated tumor-bearing mice had no γGPNA hydrolysis activity. To find the concentration of PEG-GGT in the serum of treated mice, we incubated 5 μL of serum in 200 μL of 0.5 mM GPNA in PBS and measured the rate of γGPNA hydrolysis. We determined the concentration of PEG-GGT from the standard curve generated as mentioned above. We determined the circulating glutamine and glutamate levels in serum by enzymatic assay detection kit according to the manufacturer’s protocol (Promega Glutamine/Glutamate Glo kit).
In vivo tumor models
For studying tumor growth kinetics in vivo, we injected 6–8-week-old BALB/c mice subcutaneously either with a single cell suspension of 100K CT26 (right flank) cells or 50K 4T1 (fourth mammary fat pad) cells suspended in RPMI-1640 media. We tested and confirmed that all cell lines were negative for mycoplasma contamination by qPCR. After the average tumor volumes reached 100 mm3, we administered either 20 mg/kg PEG-GGT IP to the treatment group every three days or the vehicle (PBS,10% glycerol) to the control group. We measured tumor dimensions with Vernier calipers and tumor volume was approximated as L∗H∗H/2. We measured the tumor volume and mice weight every three days.
In vivo metabolite measurements
We injected 6–8-week-old BALB/c mice subcutaneously with a single cell suspension of 100,000 CT26 cells in the right flank. Once the tumor volume reached 100 mm3, we started treating the mice either with 20 mg/kg PEG-GGT or vehicle on a biweekly basis. On the 7th day after treatment initiation (3 PEG-GGT doses) we euthanized the mice. We isolated and washed small sections of tumors (20 mg) in phosphate buffer saline (PBS) and then splash-froze them in liquid nitrogen. We collected the mouse blood from cardiac puncture and left the blood to coagulate at room temperature for 10 min. We then centrifuged the blood at 2000g for 10 min, isolated the serum and froze it in −80°C. The amino acids were extracted from mouse tissue and serum using the liquid-liquid extraction method as explained earlier.94,95 Pooled samples were used as quality control samples during MS acquisition. Agilent 6495 triple quadrupole MS coupled to Infinity 1290 LC was used for data acquisition via multiple reaction monitoring (MRM) mode through Agilent Mass Hunter Data Acquisition Software (ver. 10.1) as described previously.96 Peak integration and data analysis were performed using Agilent Mass Hunter Quantitative Analysis Software. Peak areas were normalized with Tryptophan-15N2 spike internal standard.
Flow cytometry of tumor-infiltrating immune cells
We cut the tumors from PEG-GGT treated or control groups into 1–10 mm3 pieces. To dissociate the tumor, we incubated the cut pieces with 0.1% w/v collagenase D (Roche #11088858001) and 0.01% w/v DNAse (Sigma #DN25) at 37°C for 1 h in RPMI-1640. We obtained a single-cell suspension by passing through a 70 μm cell strainer. After obtaining a single cell suspension, we washed the cells twice with PBS and labeled them with Live/dead aqua die (ThermoFisher, #L34957) in PBS for 20 min at room temperature (RT). The live/dead staining was stopped by adding 5 volumes of 4% FACS buffer. We then washed the cells twice with a 4% FACS buffer. We blocked the FC receptors by CD16/CD32 (clone 2.4G2; BD Biosciences) antibody in 4% FACS buffer for 20 min. For myeloid panel, we incubated the cells with an antibody cocktail of CD45-BUV395 (BD, #564279), CD11b-BV421 (Biolegend, #101235), CD11c-BV785 (Biolegend, #117335), F4/80-APC/Cy7 (Biolegend, #123117), Ly6C-PE (Biolegend, #128007), Ly6G-PerCP/Cy5.5 (Biolegend, #127615), CD206-AF488 (Biolegend, #141709) and CD86-AF700 (Biolegend, #105023). For lymphoid panel, we incubated the cells with an antibody cocktail of CD45-BUV395 (BD, #564279), CD3-APC (Biolegend, #100235), CD4-AF594 (Biolegend, #100446), CD8-PerCP/Cy5 (Biolegend, #100731), NKp45-e450 (Invitrogen, #48-3351-82), and CD19-APC-Cy7 (Biolegend, #115519). We fixed the cells with BD CytoFix/Perm and washed them with BD Perm/Wash solution. For FoxP3 staining in the lymphoid panel, we labeled the cells with anti-mouse FOXP3-AF488 (Biolegend; #126405) prepared in BD Perm/Wash solution and then washed with FACS buffer. We acquired the data on a BD LSRFortessa X-20 flow cytometer apparatus and analyzed it using FlowJo software (BD Biosciences).
mRNA isolation, sequencing, and analysis
We injected 6–8-week-old BALB/c mice subcutaneously with a single cell suspension of 100K CT26 cells in the right flank. Once the tumor volume reached 100 mm3, we started treating the mice either with 20 mg/kg PEG-GGT or vehicle on a biweekly basis. On the 7th day after treatment initiation (3 PEG-GGT doses) we euthanized the mice. We isolated and washed small sections of tumors (20 mg) in PBS and then splash-froze them in liquid nitrogen. We lysed the tissue in RNeasy lysis buffer (RLT) and a single stainless steel bead using tissue lyser (Qiagen, Hilden, Germany). We extracted total RNA using the RNeasy kit (Qiagen, #74104), DNAse treated the RNA (Invitrogen, #AM1906), and sent the RNA for sequencing to Novogene. Novogene processed the RNA to enrich mRNA and prepared the cDNA library. They sequenced the cDNA on Illumina HiSeq 2500 in paired-end mode. We checked the quality of sequencing data by FastQC, and the results showed good quality of reads and no further need for trimming. We aligned the sequencing data to the BALB/c reference genome (Ensembl v1.108) using STAR aligner and quantified the transcript abundance.89 We performed differential expression between treated and non-treated groups using the package DESeq2.90 The raw RNA-Seq data and normalized gene-count data has been submitted to Gene Expression Omnibus (GEO) (Accession code: GSE247472). We performed Gene set enrichment analysis (GSEA) using GSEA software and visualized the enriched clusters in Cytoscape.91 To perform infiltrating immune cell deconvolution from RNA-Seq data, we first obtained the TPM counts for our RNA-Seq data using RSEM.92 We then made the signature matrix of immune infiltrates using immgen database61 in CibersortX.62 We calculated the percentage of infiltrating immune cells using CibersortX.
In vitro RT-qPCR
We treated CT26 cells with either PEG-GGT or left them untreated for 120 h in RPMI-1640 media in 24 well plates. We aspirated the media and lyzed the cells with RLT buffer. We extracted the RNA using the RNeasy kit (Qiagen, #74104). We further treated the extracted RNA with DNAse treatment kit to remove genomic DNA (Invitrogen, #AM1906) and synthesized cDNA using cDNA reverse transcription kit (Invitrogen, #4368813). We performed RT-qPCR reaction using SsoFastTM EvaGreen Supermix with Low ROX (Bio-Rad, # 1725211) on AriaMx Real-time PCR System (Agilent Technologies, Santa Clara, CA). We normalized the results to Actin or GAPDH (glyceraldehyde-3- phosphate dehydrogenase). To determine the fold change, we used the 2-ΔΔCt method by comparing PEG-GGT treated cells to non-treated controls. See Table S3 for the list of primer sequences used in this study.
Glutamine depletion signature and TCGA analysis
To construct the glutamine depletion signature, we downloaded the raw counts for cells adapted to grow in low glutamine from GEO series accession number GSE144883.65 We performed differential analysis on the adapted cell lines and filtered the genes with FDR<0.1. We chose the coordinatively upregulated or downregulated gene from our dataset and this dataset to build the glutamine depletion signature. To perform ssGSEA77 of our signature on human cancers, we downloaded the TCGA data for different cancers. We performed the ssGSEA on different human cancers and stratified the top 25% ssGSEA scores as “Gln depletion high” and bottom 25% as “Gln depletion low”. We then performed overall survival analysis using clinical data in the TCGA database. For the PMN-MDSC score calculation for each patient, we first calculated the percentage of immune infiltrates from bulk RNA-Seq data using EPIC to remove the bias from non-immune cells in the data.85 We then divided the raw RSEM counts of genes in the PMN-MDSC signature with the fraction of immune cells predicted by EPIC. We then log transformed the RSEM counts, and Z-normalized the expression of PMN-MDSC related genes across the TCGA dataset. PMN-MDSC score was the sum of Z-scores for all the genes in the PMN-MDSC signature.86
Quantification and statistical analysis
Statistical significance was assigned when p values were <0.05 using GraphPad Prism (v6.07 and v9.0). Tests, number of animals (n), mean values, and statistical comparison groups are indicated in the Figure legends.
Acknowledgments
This publication was supported by the NIH (R01GM143243). We thank Dr. Patrick Cirino for providing us with access to their lab for bacterial culture and Dr. Yuri Tanno from Dr. George Georgiou’s lab at UT Austin for their inputs in protein synthesis. The Baylor College of Medicine metabolomics core was supported by the CPRIT Core Facility Support Award RP210227 “Proteomic and Metabolomic Core Facility,” NCI Cancer Center Support Grant P30CA125123, and NIH/NCI R01CA220297 and NIH/NCI R01CA216426 intramural funds from the Dan L. Duncan Cancer Center (DLDCC). Parts of the figures were created using BioRender (BioRender.com).
Author contributions
N.V. and M.K. designed the study, analyzed the data, and prepared the manuscript. M.K., A.L., R.K., M.M.-P., K.M.S.R.S., and S.N. performed the experiments. S.N. helped in protein purification. A.L., R.K., M.M.-P., and K.M.S.R.S. helped in mice experiments. M.K. did the bioinformatic analyses. All authors edited and approved the manuscript.
Declaration of interests
N.V. is a co-founder of CellChorus and AuraVax. None of these conflicts of interest influenced any part of the study design or results. University of Houston (UH) has filed a disclosure based on some of the findings in this study.
Published: April 26, 2024
Footnotes
Supplemental information can be found online at https://doi.org/10.1016/j.isci.2024.109817.
Supplemental information
References
- 1.Pavlova N.N., Thompson C.B. The Emerging Hallmarks of Cancer Metabolism. Cell Metab. 2016;23:27–47. doi: 10.1016/j.cmet.2015.12.006. [DOI] [PMC free article] [PubMed] [Google Scholar]
- 2.Altman B.J., Stine Z.E., Dang C.V. From Krebs to clinic: glutamine metabolism to cancer therapy. Nat. Rev. Cancer. 2016;16:619–634. doi: 10.1038/nrc.2016.71. [DOI] [PMC free article] [PubMed] [Google Scholar]
- 3.Ahluwalia G.S., Grem J.L., Hao Z., Cooney D.A. Metabolism and action of amino acid analog anti-cancer agents. Pharmacol. Ther. 1990;46:243–271. doi: 10.1016/0163-7258(90)90094-I. [DOI] [PubMed] [Google Scholar]
- 4.Moreadith R.W., Lehninger A.L. The pathways of glutamate and glutamine oxidation by tumor cell mitochondria. Role of mitochondrial NAD(P)+-dependent malic enzyme. J. Biol. Chem. 1984;259:6215–6221. doi: 10.1016/S0021-9258(20)82128-0. [DOI] [PubMed] [Google Scholar]
- 5.Young V.R., Ajami A.M. Glutamine: The Emperor or His Clothes? J. Nutr. 2001;131:2449S–2459S. doi: 10.1093/jn/131.9.2449S. [DOI] [PubMed] [Google Scholar]
- 6.Ovejera A.A., Houchens D.P., Catane R., Sheridan M.A., Muggia F.M. Efficacy of 6-Diazo-5-oxo-l-norleucine and N-[N-γ-Glutamyl-6-diazo-5-oxo-norleucinyl]-6-diazo-5-oxo-norleucine against Experimental Tumors in Conventional and Nude Mice1. Cancer Res. 1979;39:3220–3224. [PubMed] [Google Scholar]
- 7.Esslinger C.S., Cybulski K.A., Rhoderick J.F. Nγ-Aryl glutamine analogues as probes of the ASCT2 neutral amino acid transporter binding site. Bioorg. Med. Chem. 2005;13:1111–1118. doi: 10.1016/j.bmc.2004.11.028. [DOI] [PubMed] [Google Scholar]
- 8.Gross M.I., Demo S.D., Dennison J.B., Chen L., Chernov-Rogan T., Goyal B., Janes J.R., Laidig G.J., Lewis E.R., Li J., et al. Antitumor Activity of the Glutaminase Inhibitor CB-839 in Triple-Negative Breast Cancer. Mol. Cancer Ther. 2014;13:890–901. doi: 10.1158/1535-7163.MCT-13-0870. [DOI] [PubMed] [Google Scholar]
- 9.Poster D.S., Bruno S., Penta J., Neil G.L., McGovren J.P. Acivicin. An antitumor antibiotic. Cancer Clin. Trials. 1981;4:327–330. [PubMed] [Google Scholar]
- 10.Ma H., Wu J., Zhou M., Wu J., Wu Z., Lin L., Huang N., Liao W., Sun L. Inhibition of Glutamine Uptake Improves the Efficacy of Cetuximab on Gastric Cancer. Integr. Cancer Ther. 2021;20 doi: 10.1177/15347354211045349. [DOI] [PMC free article] [PubMed] [Google Scholar]
- 11.Van Geldermalsen M., Quek L.-E., Turner N., Freidman N., Pang A., Guan Y.F., Krycer J.R., Ryan R., Wang Q., Holst J. Benzylserine inhibits breast cancer cell growth by disrupting intracellular amino acid homeostasis and triggering amino acid response pathways. BMC Cancer. 2018;18:689. doi: 10.1186/s12885-018-4599-8. [DOI] [PMC free article] [PubMed] [Google Scholar]
- 12.Hassanein M., Hoeksema M.D., Shiota M., Qian J., Harris B.K., Chen H., Clark J.E., Alborn W.E., Eisenberg R., Massion P.P. SLC1A5 mediates glutamine transport required for lung cancer cell growth and survival. Clin. Cancer Res. 2013;19:560–570. doi: 10.1158/1078-0432.CCR-12-2334. [DOI] [PMC free article] [PubMed] [Google Scholar]
- 13.Schulte M.L., Fu A., Zhao P., Li J., Geng L., Smith S.T., Kondo J., Coffey R.J., Johnson M.O., Rathmell J.C., et al. Pharmacological blockade of ASCT2-dependent glutamine transport leads to antitumor efficacy in preclinical models. Nat. Med. 2018;24:194–202. doi: 10.1038/nm.4464. [DOI] [PMC free article] [PubMed] [Google Scholar]
- 14.Bröer A., Fairweather S., Bröer S. Disruption of Amino Acid Homeostasis by Novel ASCT2 Inhibitors Involves Multiple Targets. Front. Pharmacol. 2018;9:785. doi: 10.3389/fphar.2018.00785. [DOI] [PMC free article] [PubMed] [Google Scholar]
- 15.Magill G.B., Myers W.P., Reilly H.C., Putnam R.C., Magill J.W., Sykes M.P., Escher G.C., Karnofsky D.A., Burchenal J.H. Pharmacological and initial therapeutic observations on 6-diazo-5-oxo-1-norleucine (DON) in human neoplastic disease. Cancer. 1957;10:1138–1150. doi: 10.1002/1097-0142(195711/12)10:6<1138::aid-cncr2820100608>3.0.co;2-k. [DOI] [PubMed] [Google Scholar]
- 16.Leone R.D., Zhao L., Englert J.M., Sun I.-M., Oh M.-H., Sun I.-H., Arwood M.L., Bettencourt I.A., Patel C.H., Wen J., et al. Glutamine blockade induces divergent metabolic programs to overcome tumor immune evasion. Science. 2019;366:1013–1021. doi: 10.1126/science.aav2588. [DOI] [PMC free article] [PubMed] [Google Scholar]
- 17.Oh M.-H., Sun I.-H., Zhao L., Leone R.D., Sun I.-M., Xu W., Collins S.L., Tam A.J., Blosser R.L., Patel C.H., et al. Targeting glutamine metabolism enhances tumor-specific immunity by modulating suppressive myeloid cells. J. Clin. Invest. 2020;130:3865–3884. doi: 10.1172/JCI131859. [DOI] [PMC free article] [PubMed] [Google Scholar]
- 18.Ishida Y., Agata Y., Shibahara K., Honjo T. Induced expression of PD-1, a novel member of the immunoglobulin gene superfamily, upon programmed cell death. EMBO J. 1992;11:3887–3895. doi: 10.1002/j.1460-2075.1992.tb05481.x. [DOI] [PMC free article] [PubMed] [Google Scholar]
- 19.Leach D.R., Krummel M.F., Allison J.P. Enhancement of antitumor immunity by CTLA-4 blockade. Science. 1996;271:1734–1736. doi: 10.1126/science.271.5256.1734. [DOI] [PubMed] [Google Scholar]
- 20.Reinfeld B.I., Madden M.Z., Wolf M.M., Chytil A., Bader J.E., Patterson A.R., Sugiura A., Cohen A.S., Ali A., Do B.T., et al. Cell-programmed nutrient partitioning in the tumour microenvironment. Nature. 2021;593:282–288. doi: 10.1038/s41586-021-03442-1. [DOI] [PMC free article] [PubMed] [Google Scholar]
- 21.Ma G., Zhang Z., Li P., Zhang Z., Zeng M., Liang Z., Li D., Wang L., Chen Y., Liang Y., Niu H. Reprogramming of glutamine metabolism and its impact on immune response in the tumor microenvironment. Cell Commun. Signal. 2022;20:114. doi: 10.1186/s12964-022-00909-0. [DOI] [PMC free article] [PubMed] [Google Scholar]
- 22.Varghese S., Pramanik S., Williams L.J., Hodges H.R., Hudgens C.W., Fischer G.M., Luo C.K., Knighton B., Tan L., Lorenzi P.L., et al. The Glutaminase Inhibitor CB-839 (Telaglenastat) Enhances the Antimelanoma Activity of T-Cell-Mediated Immunotherapies. Mol. Cancer Ther. 2021;20:500–511. doi: 10.1158/1535-7163.MCT-20-0430. [DOI] [PMC free article] [PubMed] [Google Scholar]
- 23.Nabe S., Yamada T., Suzuki J., Toriyama K., Yasuoka T., Kuwahara M., Shiraishi A., Takenaka K., Yasukawa M., Yamashita M. Reinforce the antitumor activity of CD8+ T cells via glutamine restriction. Cancer Sci. 2018;109:3737–3750. doi: 10.1111/cas.13827. [DOI] [PMC free article] [PubMed] [Google Scholar]
- 24.Carr E.L., Kelman A., Wu G.S., Gopaul R., Senkevitch E., Aghvanyan A., Turay A.M., Frauwirth K.A. Glutamine Uptake and Metabolism Are Coordinately Regulated by ERK/MAPK during T Lymphocyte Activation. J. Immunol. 2010;185:1037–1044. doi: 10.4049/jimmunol.0903586. [DOI] [PMC free article] [PubMed] [Google Scholar]
- 25.Byun J.-K., Park M., Lee S., Yun J.W., Lee J., Kim J.S., Cho S.J., Jeon H.-J., Lee I.-K., Choi Y.-K., Park K.-G. Inhibition of Glutamine Utilization Synergizes with Immune Checkpoint Inhibitor to Promote Antitumor Immunity. Mol. Cell. 2020;80:592–606.e8. doi: 10.1016/j.molcel.2020.10.015. [DOI] [PubMed] [Google Scholar]
- 26.Guo C., You Z., Shi H., Sun Y., Du X., Palacios G., Guy C., Yuan S., Chapman N.M., Lim S.A., et al. SLC38A2 and glutamine signalling in cDC1s dictate anti-tumour immunity. Nature. 2023;620:200–208. doi: 10.1038/s41586-023-06299-8. [DOI] [PMC free article] [PubMed] [Google Scholar]
- 27.Schmid F.A., Roberts J. Antineoplastic and toxic effects of Acinetobacter and Pseudomonas glutaminase-asparaginases. Cancer Chemother. Rep. 1974;58:829–840. [PubMed] [Google Scholar]
- 28.Covini D., Tardito S., Bussolati O., Chiarelli L.R., Pasquetto M.V., Digilio R., Valentini G., Scotti C. Expanding Targets for a Metabolic Therapy of Cancer: L-Asparaginase. Recent Pat. Anti-Cancer Drug Discov. 2012;7:4–13. doi: 10.2174/157489212798358001. [DOI] [PubMed] [Google Scholar]
- 29.Brown G., Singer A., Proudfoot M., Skarina T., Kim Y., Chang C., Dementieva I., Kuznetsova E., Gonzalez C.F., Joachimiak A., et al. Functional and Structural Characterization of Four Glutaminases from Escherichia coli and Bacillus subtilis. Biochemistry. 2008;47:5724–5735. doi: 10.1021/bi800097h. [DOI] [PMC free article] [PubMed] [Google Scholar]
- 30.Hartman S.C. Glutaminase of Escherichia coli. J. Biol. Chem. 1968;243:853–863. doi: 10.1016/S0021-9258(18)93595-7. [DOI] [PubMed] [Google Scholar]
- 31.Okada T., Suzuki H., Wada K., Kumagai H., Fukuyama K. Crystal structures of γ-glutamyltranspeptidase from Escherichia coli , a key enzyme in glutathione metabolism, and its reaction intermediate. Proc. Natl. Acad. Sci. USA. 2006;103:6471–6476. doi: 10.1073/pnas.0511020103. [DOI] [PMC free article] [PubMed] [Google Scholar]
- 32.Orlowski M., Meister A. The gamma-glutamyl cycle: a possible transport system for amino acids. Proc. Natl. Acad. Sci. USA. 1970;67:1248–1255. doi: 10.1073/pnas.67.3.1248. [DOI] [PMC free article] [PubMed] [Google Scholar]
- 33.Boanca G., Sand A., Barycki J.J. Uncoupling the Enzymatic and Autoprocessing Activities of Helicobacter pylori γ-Glutamyltranspeptidase. J. Biol. Chem. 2006;281:19029–19037. doi: 10.1074/jbc.M603381200. [DOI] [PubMed] [Google Scholar]
- 34.West M.B., Chen Y., Wickham S., Heroux A., Cahill K., Hanigan M.H., Mooers B.H.M. Novel Insights into Eukaryotic γ-Glutamyltranspeptidase 1 from the Crystal Structure of the Glutamate-bound Human Enzyme. J. Biol. Chem. 2013;288:31902–31913. doi: 10.1074/jbc.M113.498139. [DOI] [PMC free article] [PubMed] [Google Scholar]
- 35.Boanca G., Sand A., Okada T., Suzuki H., Kumagai H., Fukuyama K., Barycki J.J. Autoprocessing of Helicobacter pylori γ-Glutamyltranspeptidase Leads to the Formation of a Threonine-Threonine Catalytic Dyad. J. Biol. Chem. 2007;282:534–541. doi: 10.1074/jbc.M607694200. [DOI] [PubMed] [Google Scholar]
- 36.Shibayama K., Wachino J.i., Arakawa Y., Saidijam M., Rutherford N.G., Henderson P.J.F. Metabolism of glutamine and glutathione via γ-glutamyltranspeptidase and glutamate transport in Helicobacter pylori : possible significance in the pathophysiology of the organism. Mol. Microbiol. 2007;64:396–406. doi: 10.1111/j.1365-2958.2007.05661.x. [DOI] [PubMed] [Google Scholar]
- 37.Gupta V., Bhavanasi S., Quadir M., Singh K., Ghosh G., Vasamreddy K., Ghosh A., Siahaan T.J., Banerjee S., Banerjee S.K. Protein PEGylation for cancer therapy: bench to bedside. J. Cell Commun. Signal. 2019;13:319–330. doi: 10.1007/s12079-018-0492-0. [DOI] [PMC free article] [PubMed] [Google Scholar]
- 38.Eagle H., Oyama V.I., Levy M., Horton C.L., Fleischman R. The growth response of mammalian cells in tissue culture to L-glutamine and L-glutamic acid. J. Biol. Chem. 1956;218:607–616. [PubMed] [Google Scholar]
- 39.Castle J.C., Loewer M., Boegel S., de Graaf J., Bender C., Tadmor A.D., Boisguerin V., Bukur T., Sorn P., Paret C., et al. Immunomic, genomic and transcriptomic characterization of CT26 colorectal carcinoma. BMC Genom. 2014;15:190. doi: 10.1186/1471-2164-15-190. [DOI] [PMC free article] [PubMed] [Google Scholar]
- 40.Rowe W.B., Ronzio R.A., Meister A. Inhibition of glutamine synthetase by methionine sulfoximine. Studies on methionine sulfoximine phosphate. Biochemistry. 1969;8:2674–2680. doi: 10.1021/bi00834a065. [DOI] [PubMed] [Google Scholar]
- 41.Olson C.K., Binkley F. Metabolism of glutathione. III. Enzymatic hydrolysis of cysteinylglycine. J. Biol. Chem. 1950;186:731–735. [PubMed] [Google Scholar]
- 42.Anderson M.E., Meister A. Dynamic state of glutathione in blood plasma. J. Biol. Chem. 1980;255:9530–9533. [PubMed] [Google Scholar]
- 43.Zhang P., Chan W., Ang I.L., Wei R., Lam M.M.T., Lei K.M.K., Poon T.C.W. Revisiting Fragmentation Reactions of Protonated α-Amino Acids by High-Resolution Electrospray Ionization Tandem Mass Spectrometry with Collision-Induced Dissociation. Sci. Rep. 2019;9:6453. doi: 10.1038/s41598-019-42777-8. [DOI] [PMC free article] [PubMed] [Google Scholar]
- 44.Chen W.W., Freinkman E., Wang T., Birsoy K., Sabatini D.M. Absolute Quantification of Matrix Metabolites Reveals the Dynamics of Mitochondrial Metabolism. Cell. 2016;166:1324–1337.e11. doi: 10.1016/j.cell.2016.07.040. [DOI] [PMC free article] [PubMed] [Google Scholar]
- 45.Yang L., Achreja A., Yeung T.L., Mangala L.S., Jiang D., Han C., Baddour J., Marini J.C., Ni J., Nakahara R., et al. Targeting Stromal Glutamine Synthetase in Tumors Disrupts Tumor Microenvironment-Regulated Cancer Cell Growth. Cell Metab. 2016;24:685–700. doi: 10.1016/j.cmet.2016.10.011. [DOI] [PMC free article] [PubMed] [Google Scholar]
- 46.Linder S.J., Bernasocchi T., Martínez-Pastor B., Sullivan K.D., Galbraith M.D., Lewis C.A., Ferrer C.M., Boon R., Silveira G.G., Cho H.M., et al. Inhibition of the proline metabolism rate-limiting enzyme P5CS allows proliferation of glutamine-restricted cancer cells. Nat. Metab. 2023;5:2131–2147. doi: 10.1038/s42255-023-00919-3. [DOI] [PMC free article] [PubMed] [Google Scholar]
- 47.Diehl F.F., Miettinen T.P., Elbashir R., Nabel C.S., Darnell A.M., Do B.T., Manalis S.R., Lewis C.A., Vander Heiden M.G. Nucleotide imbalance decouples cell growth from cell proliferation. Nat. Cell Biol. 2022;24:1252–1264. doi: 10.1038/s41556-022-00965-1. [DOI] [PMC free article] [PubMed] [Google Scholar]
- 48.Papež M., Jiménez Lancho V., Eisenhut P., Motheramgari K., Borth N. SLAM-seq reveals early transcriptomic response mechanisms upon glutamine deprivation in Chinese hamster ovary cells. Biotechnol. Bioeng. 2023;120:970–986. doi: 10.1002/bit.28320. [DOI] [PubMed] [Google Scholar]
- 49.Gameiro P.A., Struhl K. Nutrient Deprivation Elicits a Transcriptional and Translational Inflammatory Response Coupled to Decreased Protein Synthesis. Cell Rep. 2018;24:1415–1424. doi: 10.1016/j.celrep.2018.07.021. [DOI] [PMC free article] [PubMed] [Google Scholar]
- 50.Subramanian A., Tamayo P., Mootha V.K., Mukherjee S., Ebert B.L., Gillette M.A., Paulovich A., Pomeroy S.L., Golub T.R., Lander E.S., Mesirov J.P. Gene set enrichment analysis: a knowledge-based approach for interpreting genome-wide expression profiles. Proc. Natl. Acad. Sci. USA. 2005;102:15545–15550. doi: 10.1073/pnas.0506580102. [DOI] [PMC free article] [PubMed] [Google Scholar]
- 51.Bester A.C., Roniger M., Oren Y.S., Im M.M., Sarni D., Chaoat M., Bensimon A., Zamir G., Shewach D.S., Kerem B. Nucleotide Deficiency Promotes Genomic Instability in Early Stages of Cancer Development. Cell. 2011;145:435–446. doi: 10.1016/j.cell.2011.03.044. [DOI] [PMC free article] [PubMed] [Google Scholar]
- 52.Lin J.J., Dutta A. ATR Pathway Is the Primary Pathway for Activating G2/M Checkpoint Induction After Re-replication. J. Biol. Chem. 2007;282:30357–30362. doi: 10.1074/jbc.M705178200. [DOI] [PubMed] [Google Scholar]
- 53.Gaglio D., Soldati C., Vanoni M., Alberghina L., Chiaradonna F. Glutamine Deprivation Induces Abortive S-Phase Rescued by Deoxyribonucleotides in K-Ras Transformed Fibroblasts. PLoS One. 2009;4 doi: 10.1371/journal.pone.0004715. [DOI] [PMC free article] [PubMed] [Google Scholar]
- 54.Tran T.Q., Ishak Gabra M.B., Lowman X.H., Yang Y., Reid M.A., Pan M., O’Connor T.R., Kong M. Glutamine deficiency induces DNA alkylation damage and sensitizes cancer cells to alkylating agents through inhibition of ALKBH enzymes. PLoS Biol. 2017;15 doi: 10.1371/journal.pbio.2002810. [DOI] [PMC free article] [PubMed] [Google Scholar]
- 55.Yuneva M., Zamboni N., Oefner P., Sachidanandam R., Lazebnik Y. Deficiency in glutamine but not glucose induces MYC-dependent apoptosis in human cells. J. Cell Biol. 2007;178:93–105. doi: 10.1083/jcb.200703099. [DOI] [PMC free article] [PubMed] [Google Scholar]
- 56.Liu Y.-C., Li F., Handler J., Huang C.R.L., Xiang Y., Neretti N., Sedivy J.M., Zeller K.I., Dang C.V. Global Regulation of Nucleotide Biosynthetic Genes by c-Myc. PLoS One. 2008;3 doi: 10.1371/journal.pone.0002722. [DOI] [PMC free article] [PubMed] [Google Scholar]
- 57.Tardito S., Oudin A., Ahmed S.U., Fack F., Keunen O., Zheng L., Miletic H., Sakariassen P.Ø., Weinstock A., Wagner A., et al. Glutamine synthetase activity fuels nucleotide biosynthesis and supports growth of glutamine-restricted glioblastoma. Nat. Cell Biol. 2015;17:1556–1568. doi: 10.1038/ncb3272. [DOI] [PMC free article] [PubMed] [Google Scholar]
- 58.Nguyen T.V., Lee J.E., Sweredoski M.J., Yang S.-J., Jeon S.-J., Harrison J.S., Yim J.-H., Lee S.G., Handa H., Kuhlman B., et al. Glutamine Triggers Acetylation-Dependent Degradation of Glutamine Synthetase via the Thalidomide Receptor Cereblon. Mol. Cell. 2016;61:809–820. doi: 10.1016/j.molcel.2016.02.032. [DOI] [PMC free article] [PubMed] [Google Scholar]
- 59.Tsai P.-Y., Lee M.-S., Jadhav U., Naqvi I., Madha S., Adler A., Mistry M., Naumenko S., Lewis C.A., Hitchcock D.S., et al. Adaptation of pancreatic cancer cells to nutrient deprivation is reversible and requires glutamine synthetase stabilization by mTORC1. Proc. Natl. Acad. Sci. USA. 2021;118 doi: 10.1073/pnas.2003014118. [DOI] [PMC free article] [PubMed] [Google Scholar]
- 60.Shor B., Zhang W.-G., Toral-Barza L., Lucas J., Abraham R.T., Gibbons J.J., Yu K. A New Pharmacologic Action of CCI-779 Involves FKBP12-Independent Inhibition of mTOR Kinase Activity and Profound Repression of Global Protein Synthesis. Cancer Res. 2008;68:2934–2943. doi: 10.1158/0008-5472.CAN-07-6487. [DOI] [PubMed] [Google Scholar]
- 61.Yoshida H., Lareau C.A., Ramirez R.N., Rose S.A., Maier B., Wroblewska A., Desland F., Chudnovskiy A., Mortha A., Dominguez C., et al. The cis-Regulatory Atlas of the Mouse Immune System. Cell. 2019;176:897–912.e20. doi: 10.1016/j.cell.2018.12.036. [DOI] [PMC free article] [PubMed] [Google Scholar]
- 62.Newman A.M., Steen C.B., Liu C.L., Gentles A.J., Chaudhuri A.A., Scherer F., Khodadoust M.S., Esfahani M.S., Luca B.A., Steiner D., et al. Determining cell type abundance and expression from bulk tissues with digital cytometry. Nat. Biotechnol. 2019;37:773–782. doi: 10.1038/s41587-019-0114-2. [DOI] [PMC free article] [PubMed] [Google Scholar]
- 63.Mosser D.M., Edwards J.P. Exploring the full spectrum of macrophage activation. Nat. Rev. Immunol. 2008;8:958–969. doi: 10.1038/nri2448. [DOI] [PMC free article] [PubMed] [Google Scholar]
- 64.Biswas S.K., Mantovani A. Macrophage plasticity and interaction with lymphocyte subsets: cancer as a paradigm. Nat. Immunol. 2010;11:889–896. doi: 10.1038/ni.1937. [DOI] [PubMed] [Google Scholar]
- 65.Sun H.-W., Wu W.-C., Chen H.-T., Xu Y.-T., Yang Y.-Y., Chen J., Yu X.-J., Wang Z., Shuang Z.-Y., Zheng L. Glutamine Deprivation Promotes the Generation and Mobilization of MDSCs by Enhancing Expression of G-CSF and GM-CSF. Front. Immunol. 2020;11 doi: 10.3389/fimmu.2020.616367. [DOI] [PMC free article] [PubMed] [Google Scholar]
- 66.Ruffolo L.I., Jackson K.M., Kuhlers P.C., Dale B.S., Figueroa Guilliani N.M., Ullman N.A., Burchard P.R., Qin S.S., Juviler P.G., Keilson J.M., et al. GM-CSF drives myelopoiesis, recruitment and polarisation of tumour-associated macrophages in cholangiocarcinoma and systemic blockade facilitates antitumour immunity. Gut. 2022;71:1386–1398. doi: 10.1136/gutjnl-2021-324109. [DOI] [PMC free article] [PubMed] [Google Scholar]
- 67.Gabrilovich D.I., Velders M.P., Sotomayor E.M., Kast W.M. Mechanism of immune dysfunction in cancer mediated by immature Gr-1+ myeloid cells. J. Immunol. 2001;166:5398–5406. doi: 10.4049/jimmunol.166.9.5398. [DOI] [PubMed] [Google Scholar]
- 68.Barbie D.A., Tamayo P., Boehm J.S., Kim S.Y., Moody S.E., Dunn I.F., Schinzel A.C., Sandy P., Meylan E., Scholl C., et al. Systematic RNA interference reveals that oncogenic KRAS-driven cancers require TBK1. Nature. 2009;462:108–112. doi: 10.1038/nature08460. [DOI] [PMC free article] [PubMed] [Google Scholar]
- 69.Veglia F., Sanseviero E., Gabrilovich D.I. Myeloid-derived suppressor cells in the era of increasing myeloid cell diversity. Nat. Rev. Immunol. 2021;21:485–498. doi: 10.1038/s41577-020-00490-y. [DOI] [PMC free article] [PubMed] [Google Scholar]
- 70.Perez C., Botta C., Zabaleta A., Puig N., Cedena M.-T., Goicoechea I., Alameda D., San José-Eneriz E., Merino J., Rodríguez-Otero P., et al. Immunogenomic identification and characterization of granulocytic myeloid-derived suppressor cells in multiple myeloma. Blood. 2020;136:199–209. doi: 10.1182/blood.2019004537. [DOI] [PubMed] [Google Scholar]
- 71.Ouzounova M., Lee E., Piranlioglu R., El Andaloussi A., Kolhe R., Demirci M.F., Marasco D., Asm I., Chadli A., Hassan K.A., et al. Monocytic and granulocytic myeloid derived suppressor cells differentially regulate spatiotemporal tumour plasticity during metastatic cascade. Nat. Commun. 2017;8 doi: 10.1038/ncomms14979. [DOI] [PMC free article] [PubMed] [Google Scholar]
- 72.Jackson C., Cherry C., Bom S., Dykema A.G., Thompson E., Zheng M., Ji Z., Hou W., Li R., Zhang H., et al. Distinct Myeloid Derived Suppressor Cell Populations Promote Tumor Aggression in Glioblastoma. Immunology. 2023 doi: 10.1101/2023.03.26.534192. Preprint at. [DOI] [Google Scholar]
- 73.Spiegel A., Brooks M.W., Houshyar S., Reinhardt F., Ardolino M., Fessler E., Chen M.B., Krall J.A., DeCock J., Zervantonakis I.K., et al. Neutrophils Suppress Intraluminal NK Cell–Mediated Tumor Cell Clearance and Enhance Extravasation of Disseminated Carcinoma Cells. Cancer Discov. 2016;6:630–649. doi: 10.1158/2159-8290.CD-15-1157. [DOI] [PMC free article] [PubMed] [Google Scholar]
- 74.Veglia F., Tyurin V.A., Blasi M., De Leo A., Kossenkov A.V., Donthireddy L., To T.K.J., Schug Z., Basu S., Wang F., et al. Fatty acid transport protein 2 reprograms neutrophils in cancer. Nature. 2019;569:73–78. doi: 10.1038/s41586-019-1118-2. [DOI] [PMC free article] [PubMed] [Google Scholar]
- 75.Racle J., De Jonge K., Baumgaertner P., Speiser D.E., Gfeller D. Simultaneous enumeration of cancer and immune cell types from bulk tumor gene expression data. Elife. 2017;6 doi: 10.7554/eLife.26476. [DOI] [PMC free article] [PubMed] [Google Scholar]
- 76.Ebi H., Tomida S., Takeuchi T., Arima C., Sato T., Mitsudomi T., Yatabe Y., Osada H., Takahashi T. Relationship of Deregulated Signaling Converging onto mTOR with Prognosis and Classification of Lung Adenocarcinoma Shown by Two Independent In silico Analyses. Cancer Res. 2009;69:4027–4035. doi: 10.1158/0008-5472.CAN-08-3403. [DOI] [PubMed] [Google Scholar]
- 77.Pavlova N.N., Hui S., Ghergurovich J.M., Fan J., Intlekofer A.M., White R.M., Rabinowitz J.D., Thompson C.B., Zhang J. As Extracellular Glutamine Levels Decline, Asparagine Becomes an Essential Amino Acid. Cell Metab. 2018;27:428–438.e5. doi: 10.1016/j.cmet.2017.12.006. [DOI] [PMC free article] [PubMed] [Google Scholar]
- 78.Wu J., Li G., Li L., Li D., Dong Z., Jiang P. Asparagine enhances LCK signalling to potentiate CD8+ T-cell activation and anti-tumour responses. Nat. Cell Biol. 2021;23:75–86. doi: 10.1038/s41556-020-00615-4. [DOI] [PubMed] [Google Scholar]
- 79.Liu P.-S., Wang H., Li X., Chao T., Teav T., Christen S., Di Conza G., Cheng W.-C., Chou C.-H., Vavakova M., et al. α-ketoglutarate orchestrates macrophage activation through metabolic and epigenetic reprogramming. Nat. Immunol. 2017;18:985–994. doi: 10.1038/ni.3796. [DOI] [PubMed] [Google Scholar]
- 80.Tannahill G.M., Curtis A.M., Adamik J., Palsson-McDermott E.M., McGettrick A.F., Goel G., Frezza C., Bernard N.J., Kelly B., Foley N.H., et al. Succinate is an inflammatory signal that induces IL-1β through HIF-1α. Nature. 2013;496:238–242. doi: 10.1038/nature11986. [DOI] [PMC free article] [PubMed] [Google Scholar]
- 81.Palmieri E.M., Menga A., Martín-Pérez R., Quinto A., Riera-Domingo C., De Tullio G., Hooper D.C., Lamers W.H., Ghesquière B., McVicar D.W., et al. Pharmacologic or Genetic Targeting of Glutamine Synthetase Skews Macrophages toward an M1-like Phenotype and Inhibits Tumor Metastasis. Cell Rep. 2017;20:1654–1666. doi: 10.1016/j.celrep.2017.07.054. [DOI] [PMC free article] [PubMed] [Google Scholar]
- 82.Berger U.V., Hediger M.A. Distribution of the glutamate transporters GLT-1 (SLC1A2) and GLAST (SLC1A3) in peripheral organs. Anat. Embryol. 2006;211:595–606. doi: 10.1007/s00429-006-0109-x. [DOI] [PubMed] [Google Scholar]
- 83.Chan W.K., Lorenzi P.L., Anishkin A., Purwaha P., Rogers D.M., Sukharev S., Rempe S.B., Weinstein J.N. The glutaminase activity of l-asparaginase is not required for anticancer activity against ASNS-negative cells. Blood. 2014;123:3596–3606. doi: 10.1182/blood-2013-10-535112. [DOI] [PMC free article] [PubMed] [Google Scholar]
- 84.Chan W.-K., Horvath T.D., Tan L., Link T., Harutyunyan K.G., Pontikos M.A., Anishkin A., Du D., Martin L.A., Yin E., et al. Glutaminase Activity of L-Asparaginase Contributes to Durable Preclinical Activity against Acute Lymphoblastic Leukemia. Mol. Cancer Ther. 2019;18:1587–1592. doi: 10.1158/1535-7163.MCT-18-1329. [DOI] [PMC free article] [PubMed] [Google Scholar]
- 85.Chimenti M.S., Triggianese P., Conigliaro P., Candi E., Melino G., Perricone R. The interplay between inflammation and metabolism in rheumatoid arthritis. Cell Death Dis. 2015;6:e1887. doi: 10.1038/cddis.2015.246. [DOI] [PMC free article] [PubMed] [Google Scholar]
- 86.Oliveira G.P., de Abreu M.G., Pelosi P., Rocco P.R.M. Exogenous Glutamine in Respiratory Diseases: Myth or Reality? Nutrients. 2016;8:76. doi: 10.3390/nu8020076. [DOI] [PMC free article] [PubMed] [Google Scholar]
- 87.Baazim H., Antonio-Herrera L., Bergthaler A. The interplay of immunology and cachexia in infection and cancer. Nat. Rev. Immunol. 2022;22:309–321. doi: 10.1038/s41577-021-00624-w. [DOI] [PMC free article] [PubMed] [Google Scholar]
- 88.Hamanaka R.B., O'Leary E.M., Witt L.J., Tian Y., Gökalp G.A., Meliton A.Y., Dulin N.O., Mutlu G.M. Glutamine Metabolism Is Required for Collagen Protein Synthesis in Lung Fibroblasts. Am. J. Respir. Cell Mol. Biol. 2019;61:597–606. doi: 10.1165/rcmb.2019-0008OC. [DOI] [PMC free article] [PubMed] [Google Scholar]
- 89.Dobin A., Davis C.A., Schlesinger F., Drenkow J., Zaleski C., Jha S., Batut P., Chaisson M., Gingeras T.R. STAR: ultrafast universal RNA-seq aligner. Bioinformatics. 2013;29:15–21. doi: 10.1093/bioinformatics/bts635. [DOI] [PMC free article] [PubMed] [Google Scholar]
- 90.Love M.I., Huber W., Anders S. Moderated estimation of fold change and dispersion for RNA-seq data with DESeq2. Genome Biol. 2014;15:550. doi: 10.1186/s13059-014-0550-8. [DOI] [PMC free article] [PubMed] [Google Scholar]
- 91.Shannon P., Markiel A., Ozier O., Baliga N.S., Wang J.T., Ramage D., Amin N., Schwikowski B., Ideker T. Cytoscape: a software environment for integrated models of biomolecular interaction networks. Genome Res. 2003;13:2498–2504. doi: 10.1101/gr.1239303. [DOI] [PMC free article] [PubMed] [Google Scholar]
- 92.Li B., Dewey C.N. RSEM: accurate transcript quantification from RNA-Seq data with or without a reference genome. BMC Bioinf. 2011;12:323. doi: 10.1186/1471-2105-12-323. [DOI] [PMC free article] [PubMed] [Google Scholar]
- 93.Sheng S., Kraft J.J., Schuster S.M. A Specific Quantitative Colorimetric Assay for L-Asparagine. Anal. Biochem. 1993;211:242–249. doi: 10.1006/abio.1993.1264. [DOI] [PubMed] [Google Scholar]
- 94.Putluri N., Shojaie A., Vasu V.T., Vareed S.K., Nalluri S., Putluri V., Thangjam G.S., Panzitt K., Tallman C.T., Butler C., et al. Metabolomic profiling reveals potential markers and bioprocesses altered in bladder cancer progression. Cancer Res. 2011;71:7376–7386. doi: 10.1158/0008-5472.CAN-11-1154. [DOI] [PMC free article] [PubMed] [Google Scholar]
- 95.Vantaku V., Donepudi S.R., Piyarathna D.W.B., Amara C.S., Ambati C.R., Tang W., Putluri V., Chandrashekar D.S., Varambally S., Terris M.K., et al. Large-scale profiling of serum metabolites in African American and European American patients with bladder cancer reveals metabolic pathways associated with patient survival. Cancer. 2019;125:921–932. doi: 10.1002/cncr.31890. [DOI] [PMC free article] [PubMed] [Google Scholar]
- 96.Arunachalam A.R., Samuel S.S., Mani A., Maynard J.P., Stayer K.M., Dybbro E., Narayanan S., Biswas A., Pathan S., Soni K., et al. P2Y2 purinergic receptor gene deletion protects mice from bacterial endotoxin and sepsis-associated liver injury and mortality. Am. J. Physiol. Gastrointest. Liver Physiol. 2023;325:G471–G491. doi: 10.1152/ajpgi.00090.2023. [DOI] [PMC free article] [PubMed] [Google Scholar]
Associated Data
This section collects any data citations, data availability statements, or supplementary materials included in this article.
Supplementary Materials
Data Availability Statement
RNA-seq data has been deposited at GEO (GSE247472) and are publicly available as of the date of publication. Accession numbers are listed in the key resources table.
This paper does not report original code.
Any additional information required to reanalyze the data reported in this paper is available from the lead contact upon request.