

Abstract
Two-dimensional (2D) hybrid organic–inorganic perovskite (HOIP) crystals show promise as scintillating materials for wide-energy radiation detection, outperforming their three-dimensional counterparts. In this study, we synthesized single crystals of (PEA2–xBZAx)PbBr4 (x ranging from 0.1 to 2), utilizing phenethylammonium (C6H5CH2CH2NH3+) and benzylammonium (C6H5CH2NH3+) cations. These materials exhibit favorable optical and scintillation properties, rendering them suitable for high light yield (LY) and fast-response scintillators. Our investigation, employing various techniques such as X-ray diffraction (XRD), photoluminescence (PL), time-resolved (TR) PL, Raman spectroscopy, radioluminescence (RL), thermoluminescence (TL), and scintillation measurements, unveiled lattice strain induced by dual-organic cations in powder X-ray diffraction. Density functional theory analysis demonstrated a maximal 0.13 eV increase in the band gap with the addition of BZA cation addition. Notably, the largest Stokes shift of 0.06 eV was observed in (BZA)2PbBr4. The dual-organic cation crystals displayed >80% fast component scintillation decay time, which is advantageous for the scintillating process. Furthermore, we observed a dual-organic cations-induced enhancement of electron–hole transfer efficiency by up to 60%, with a contribution of >70% to the fast component of scintillation decay. The crystal with the lowest BZA concentration, (PEA1.9BZA0.1)PbBr4, demonstrated the highest LYs of 14.9 ± 1.5 ph/keV at room temperature. Despite a 55–70% decrease in LY for BZA concentrations >5%, simultaneous reductions in scintillation decay time (12–32%) may work for time-of-flight positron emission tomography and photon-counting computed tomography. Our work underscores the crucial role of dual-organic cations in advancing our understanding of 2D-HOIP crystals for materials science and radiation detection applications.
Keywords: hybrid perovskites, dual-organic cation, luminescence, lys, scintillators
Introduction
Hybrid organic–inorganic perovskite (HOIP) scintillators with diverse dimensions play a pivotal role in detecting ionizing radiation due to their fast and high light yield, making them particularly well-suited for applications such as imaging, spectroscopy, and timing.1−5 Two-dimensional (2D) HOIP crystals are promising scintillating materials for energy detection over a wide range of energies due to their exceptional luminescence efficiency, excellent photoabsorption capability,6 high exciton binding energy,7 and environmental stability.8,9 Particularly noteworthy is the superior tunability and unique optoelectronic properties of 2D-HOIP, which make them highly desirable for scintillation applications.10,11 Furthermore, their multiple quantum well-layered structure12 facilitates electron confinement effects, thereby limiting electron mobility between organic and inorganic components to a certain extent.13 This orderly and controlled process enhances their effectiveness as scintillators for X-ray detection.14
Currently, research on phenethylammonium (PEA)-, butylammonium (BA)-, and benzylammonium (BZA)-based lead halide perovskites (A2BX4; A = PEA, BA, BZA; B = Pb, Sn, Cu, Mn; X = Cl, Br, I)14 is of great interest to the scientific community. PEA2PbX4 crystals have a high light yield (LY) (∼10 photons/keV)15 and slow PL decay (∼56 ns).16 On the other hand, (BZA)2PbX4 crystals have a low LY (<6 photons/keV).13,17 Furthermore, growing large crystals of (BZA)2PbX4 is challenging, because of its crystal structure. The PL decay is faster (<3 ns)13 compared to PEA or BA cation-based HOIP.16 To solve this issue, solvent engineering, halide exchange, and dual-organic cation perovskites are potential candidates. Of all building blocks, dual-cation HOIP single crystals are considered the most optimal platform for fundamental research. Seok et al. prepared iodide-based perovskite thin films to get a tunable band gap and a stable structure by combining the sizable FA cation with the compact MA cation.18 Zhu et al. synthesized similar iodide-based perovskite thin films by mixing Cs instead of MA, which provided an improvement in thermal stability.19 Recently, Jin et al. published an article in which they utilized mixed organic PEA and inorganic Cs cations, varying the number of layers in lead bromide perovskites and characterized their properties for optoelectronic applications.20 Among the numerous reported mixed-organic cation perovskites-based optoelectronic devices, most are based on solar cells.21−24 Wu et al. studied the effects of mixed organic cations on the structure and properties of three-dimensional lead halide perovskites.25 However, there have been hitherto no reports available on dual-organic cation A2PbBr4 materials being utilized as scintillators. Furthermore, the precise role of organic cations in perovskites and their impact on material properties remains unclear. To gain a more profound understanding of these material properties, dual-organic cation perovskites would be a suitable candidate.
In this work, we incorporated PEA (C6H5CH2CH2NH3+) and BZA (C6H5CH2NH3+) to the A site of the A2PbBr4 perovskite structure to explore the influence of dual-organic cations on structure, optical characteristics, and scintillation properties. The ratio of the cations in the precursor was varied from x = 0.1 to x = 2.0 in the structure of (PEA2–xBZAx)PbBr4 to tune the stability of the crystal and optical band gap of the materials. We conducted X-ray diffraction (XRD) experiment for the characterization of the crystal structure, and we confirmed the presence of dual-organic cation inclusion with Raman spectroscopy. We then performed Rietveld refinement of the XRD data and used density functional theory (DFT) to compute the electronic band structure and density of states (DOS). Further on, we observed the effects of dual-organic cations through measurements of absorption and photoluminescence spectra. We also conducted radioluminescence (RL) measurements in a broad range of temperatures to explore the effects of dual-cations on scintillation properties and the afterglow of the perovskite. Also, thermoluminescence (TL) measurements were conducted to study the trap characteristics of 2D-HOIP crystals. Finally, we investigated the effect of dual-cation on the LY of the crystals as we measured the γ-ray pulse height spectra (PHS) with a 241Am (Eγ = 59.5 keV) source. From the obtained results, we observe contraction of the lattice cells for (PEA1.5BZA0.5)PbBr4 and (PEABZA)PbBr4 crystals as compared to (PEA)2PbBr4 crystals. The lattice contraction leads to larger values of the band gaps for the 2D-HOIP crystals with an increase of 0.06 and 0.08 eV for (PEA1.5BZA0.5)PbBr4 and (PEABZA)PbBr4, respectively, compared to (PEA)2PbBr4. Additionally, dual-cation HOIPs also show narrower PL spectra and enhance the efficiency of electron–hole transfer. This study gives better insight on how the dual-cation inclusion results in lattice contraction and narrowing of the band gap, which leads to an increase in scintillation decay time. The comparable LY and faster scintillation decay present dual-cation 2D-HOIP crystals as very promising for improving the scintillation performance of 2D-HOIPs in radiation detection applications.
Results and Discussion
Figure 1 depicts the appearance of crystals, blue emission under 405 nm laser excitation, crystal structure, and corresponding XRD pattern. The samples in Figure 1a have an approximate size of 5.0 × 3.7 × 1.0 mm3 and 7.8 × 4.5 × 0.3 mm3 for (PEA)2PbBr4 and (PEABZA)PbBr4, respectively. The materials comprise colorless platelike crystals that emit blue light when excited with a 405 nm wavelength excitation, as shown in the bottom of Figure 1a. In addition, the emission of the samples is shifted to a shorter wavelength in comparison with (PEA)2PbBr4. The chemical structures of PEA and BZA are shown in Figure 1b (left), which are widely used for 2D HOIP synthesis. One of the dual-organic cation layered crystal structures of (PEABZA)PbBr4 in this study is represented in Figure 1b (right). The PEA ligand is substituted by the BZA ligand in the crystal phase as indicated in the red dotted circle for (PEABZA)PbBr4. (PEA)2PbBr4 crystals contain a total of 12 organic PEA ligands, while (BZA)2PbBr4 crystals have 8 organic BZA ligands. Upon transformation into (PEA1.5BZA0.5)PbBr4, there are 8 PEA and 4 BZA ligands. The crystal of (PEABZA)PbBr4 is formed by combining 6 PEA ligands from (PEA)2PbBr4 with 4 BZA ligands from (BZA)2PbBr4. Powder XRD measurements were employed to ascertain the concurrent intercalation of the PEA and BZA cations, as depicted in Figure 1c; their Rietveld refinement with crystal structure using FullProf software was done with the previous models of (PEA)2PbBr416 and (BZA)2PbBr426 and the results are shown in Figure S1. Significant peak shifts to higher angles were detected in mixed samples, indicating that incorporating BZA organic cations into the PEA organic cation in the perovskite structure causes structural changes. On the one hand, the triclinic phase can be found with the P1® space group for (PEA)2PbBr4, (PEA1.5BZA0.5)PbBr4, and (PEABZA)PbBr4. This phase remains within the broader category of A2PbX4 (X = I, Br, Cl and A = organic cations, PEA or BZA) HOIP crystals. It comprises a stack of perovskite inorganic layers oriented along the 100 direction, forming a 2D network of Pb-X octahedra,11 alternating with the organic sheets of C6H5(CH2)2NH3+ or and C6H5CH2NH3+ cations. On the other hand, orthorhombic phase with the Cmc21 space group27 can be found for (BZA)2PbBr4 and the Rietveld refinement lattice parameters for all samples are summarized in Table S1. In our studies, the lattice parameters of (BZA)2PbBr4 (a = 33.4243 Å, b = 8.1558 Å, c = 8.1472 Å), the volume of 2220.94 Å3, and the calculated density (ρ) of 2.23 g/cm3 are similar to the reported lattice parameters (a = 33.4062 Å, b = 8.1528 Å, c = 8.1385 Å), the volume of 2216.63 Å3, and the calculated density (ρ) of 2.23 g/cm3 in ref (26) (BZA)2PbBr4 consisted of inorganic layers of corner-sharing PbBr6 octahedra, with each separated by two monovalent (BZA) organic cations, as observed in Figure S1 (d). The intense diffraction peaks at 5.3, 10.6, 15.9, 21.3, 26.7, 32.2, and 37.7° were observed, and as the BZA content increased, the diffraction peak shifted toward larger angles, aligning with observations on smaller BZA cations. This shift can be elucidated using the Bragg equation. Given that the size of the BZA cation is smaller than that of the PEA cation, the perovskite lattice size gradually decreases with an increasing BZA proportion. According to the equation 2d sin θ = nλ, where d represents lattice spacing, θ is the diffraction angle, n is an integer, and λ is the wavelength, and the diffraction angle increases as the perovskite lattice size decreases.26 The experimental results are consistent with theoretical predictions, indicating the formation of a mixed phase of (PEA2–xBZAx)PbBr4, in which both cations are incorporated within the same lattice framework. This is evidenced by the shift in the diffraction angle; rather than the emergence of two distinct peaks of varying intensities at x = 1. At x = 0.5, a mixed phase of (PEA1.5BZA0.5)PbBr4 was formed with the addition of several small peaks of different intensities, due to the presence of impurities, including (PEA)2PbBr4, (PEABZA)PbBr4, (BZA)2PbBr4, and a nonstoichiometric form of (PEA1.5BZA0.5)PbBr4. Raman spectra in Figure 1d show the shifts in the vibrational bands of the PEA structure influenced by the BZA cation. Multiple Raman bands were identified within the range of 38 to 1200 cm–1 (0.005–0.148 eV), with characteristics dependent on the type of organic cation, temperature, and the linear polarization direction of the incident light.28 At RT, two prominent Raman bands (labeled as M1 and M5) are observable in the spectrum, accompanied by a band appearing as a broad shoulder (M2) and some weak bands at their high-frequency side (M3, M4, and M6). A clear Raman shift was observed in the vibrational band, and such shifts in M3, M4, and M6 bands may indicate that the BZA cation may replace the PEA cation sites in the organic ligand. We also notice that (PEA1.5BZA0.5)PbBr4 exhibits two abnormal peaks at ∼290 and 410 cm–1 most likely arising from local structural distortions of the bulk crystal structure, probably occurring at the surface of the crystal, possibly due to the presence of impurities or strain.
Figure 1.

(a) Photographs of (PEA)2PbBr4 and (PEABZA)PbBr4 crystals (top) and blue emission images under 405 nm laser excitation (bottom), (b) chemical structure of PEA (top), BZA (bottom) organic ligands, and crystal structure of (PEABZA)PbBr4. The red dotted circle represents the BZA ligand chain, (c) X-ray diffraction pattern of the crystals, and (d) Raman spectra of the samples recorded at room temperature (RT) under laser excitation at 532 nm within the range from 38 to 1200 cm–1. The vibrational bands M1–M6 are indicated by the transparent colored rectangles.
We conducted DFT computations utilizing the cell structure parameters obtained from our XRD measurements outlined in Table S1. The findings of the DFT computations, including both the band structure and the DOS, are depicted in Figure 2. The calculated band gaps (Egcal) are presented in Table S1 for reference. The shift of the band gaps from the calculations for (PEA)2PbBr4 to (BZA)2PbBr4 is 0.13 eV and approximately the same with the experimental fitting value of 0.12 eV. Over all, the band gaps obtained from calculations are slightly lower than experimental values, which is reasonable due to self-interaction errors arising from the inherent contribution of density functional parameters.29,30 We observe that the lattice contraction and the rise in the band gap provide additional support for the substitution of PEA with BZA in the organic A site. Raman spectroscopy measurements (Figure 1d) additionally indicate a Raman shift in vibrational modes consistent with the substitution of PEA cations with BZA cations in the organic ligand.
Figure 2.

Results of DFT calculations: electronic band structure, total (black), along with projected DOS (indicated by color), are illustrated for (a) (PEA)2PbBr4, (b) (PEA1.5BZA0.5)PbBr4, (c) (PEABZA)PbBr4, and (d) (BZA)2PbBr4 crystals. In these representations, the Pb p, Br p, N p, C p, and H s orbitals are depicted by red, green, blue, magenta, and orange lines, respectively.
We performed UV–vis absorption spectroscopy analysis to ascertain the absorption range and band gap of the dual-cation lead bromide perovskites (PEA2-xBZAx)PbBr4, as shown in Figure 3a. The band gap was estimated from the absorption spectra using Elliot’s method for fitting curves, as shown in Figure S2. The experimental band gap from absorption spectra were estimated to be 2.96, 3.02, 3.04, and 3.09 eV for (PEA)2PbBr4, (PEA1.5BZA0.5)PbBr4, (PEABZA)PbBr4, and (BZA)2PbBr4, respectively, and showed good promise for scintillating materials due to their small values.31 By replacing PEA with BZA, we have the capability to fine-tune the band gap of perovskite materials, thereby narrowing the spectral response range while reducing the absorption intensity.
Figure 3.

(a) Absorption spectra at RT using white light source, (b) photoluminescence (PL) spectra of (PEA)2PbBr4, (PEA1.5BZA0.5)PbBr4, (PEABZA)PbBr4, and (BZA)2PbBr4 recorded at RT and using a laser source excited at 375 nm, and TR-PL decay fitting curves (c,d) excited at 375 nm monitoring the ∼412 nm emission of (PEA1.5BZA0.5)PbBr4 and (PEABZA)PbBr4, respectively.
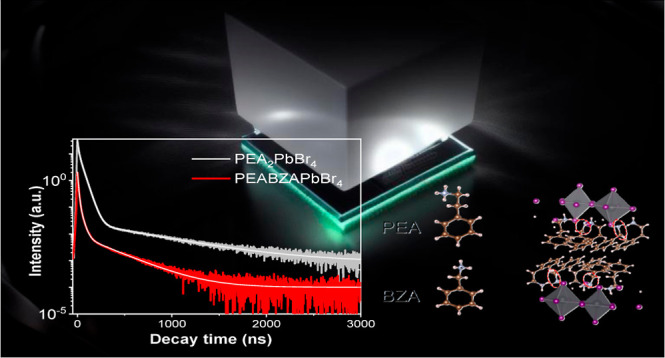
The source of the emitting states in the spectrum was identified through PL and time-resolved PL spectroscopy. PL measurements were performed on bulk crystals with the excitation of a 375 nm laser source and plotted with a logarithmic scale of the y-axis recorded at RT, as shown in Figure 3b. The luminescence property of the materials, which is linked with the lattice distortion of the inorganic layer26 is characterized using PL measurements. All of the samples displayed blue emission at 412–418 nm wavelengths with an excitation wavelength of 375 nm. A maximum full-width half-maximum (fwhm) value of 14.8 nm (0.26 eV) was observed for (PEA)2PbBr4 compared to 13.0 nm (0.23 meV), 14.2 nm (0.25 eV), and 11.9 nm (0.21 eV) for (PEA1.5BZA0.5)PbBr4, (PEABZA)PbBr4, and (BZA)2PbBr4 samples, respectively, as shown in Table 1. With the content of BZA increasing, the peak emission shifts toward a shorter wavelength from 418 to 412 nm, due to the lattice contraction, which is consistent with the XRD result. A substantial Stokes shift of 0.06 eV was noted in the case of (BZA)2PbBr4, whereas a comparatively smaller Stokes shift of 0.01 eV was observed for (PEA1.5BZA0.5)PbBr4. The significant Stokes shift in (BZA)2PbBr4 can be attributed to its lower degree of self-absorption.5 Also due to the experimental configuration with precise excitation beam focusing, the collected emission signal comes in majority from the perovskite crystal surface. Thus we regard the measured PL spectra with only a minor contribution from the self-absorption effect. PL decay curves were fitted with the exponential decay model for (PEA1.5BZA0.5)PbBr4 and (PEABZA)PbBr4, as shown in Figure 3c,d. Table S2 displays the calculated average lifetime (tavg), which considers both time constants and their respective weightings to assess the overall lifetime of the crystals and the parameters derived from the fitting. By the introduction of BZA cation in a pure (PEA)2PbBr4 perovskite structure, the average decay times for (PEA1.5BZA0.5)PbBr4 and (PEABZA)PbBr4 are approximately 4.9 and 3.6 times faster than that for pure (PEA)2PbBr4,5 respectively. Additionally, the (PEA1.5BZA0.5)PbBr4 crystal has a similar decay time (1.3 ns) compared to (PEABZA)PbBr4 crystal (1.8 ns) due to the low content of BZA being introduced into both crystal lattices. Moreover, we noted a high percentage of the fast decay component for dual-organic cation crystals compared to single-cation crystals, which is advantageous for the scintillating process as it directly correlates with the recombination rate of excitons within the inorganic layers.32,33
Table 1. Summary of Optical Properties, where Egabs and Egcal are the Band Gaps Acquired through Elliot Fitting, as Illustrated in Figure S2, and DFT Calculation, as Depicted in Figure 2, Respectively.
| compounds | Egcal (eV) | Egabs (eV) | maximum PL peak (eV) | Stokes shift (Egabs ∼ Max.PL), (eV) | fwhm (eV) |
|---|---|---|---|---|---|
| (PEA)2PbBr4 | 2.92 | 2.96 | 3.00 | 0.04 | 0.26 |
| (PEA1.5BZA0.5)PbBr4 | 2.97 | 3.02 | 3.01 | 0.01 | 0.23 |
| (PEABZA)PbBr4 | 3.00 | 3.04 | 3.01 | 0.03 | 0.25 |
| (BZA)2PbBr4 | 3.05 | 3.09 | 3.03 | 0.06 | 0.21 |
RL spectra at 300 K are shown in Figure 4a. A consistent peak was observed across all samples, with variations in intensity among them and both show a fwhm ≈ 28 nm, which is approximately double the PL peaks. There is <4 nm RL peak shift observed with increases in BZA content, while a blue shift was observed in PL emission, as depicted in Figure S3. The intensity of the peaks was normalized to clarify the peak shift. The primary peak signifies the presence of free excitons within the sample, which broadens at high temperatures due to self-absorption.34−36 The self-absorption is usually more significant in the case of RL measurements than PL measurements because of the bulk nature of the RL signal.11 Because of that the emission peaks are red-shifted by ∼20 nm in the RL spectra as compared to PL. The emission peak linked with free excitation was shifted from 431 to 435 nm as the BZA content was raised. Furthermore, RL spectra mapping of the samples, measured from 10 to 350 K, are illustrated in Figure 4b–d. As the temperature rises, all samples exhibit increased RL intensity, suggesting negative thermal quenching (NTQ) behavior.37,38 However, a peak broadening could be observed in (PEA)2PbBr4, suggesting that some unconventional recombination took place relatively over RT. However, as mixed PEA and BZA were used as organic ligands for the (PEABZA)PbBr4 sample, the RL spectra were primarily present at elevated temperatures, resembling RL spectra that were observed for PEA or BZA ligand. This is a remarkable finding since (PEABZA)PbBr4 hybrid perovskites that contain both phenethylammonium and benzylammonium groups exhibited maximum peaks at RT.
Figure 4.

Radioluminescence (RL) spectra (a) at 300 K and mapping spectra at different temperatures from 10 to 350 K for (b) (PEA)2PbBr4, (c) (PEABZA)PbBr4, and (d) (BZA)2PbBr4 crystals.
To investigate the effects of inserting dual-organic cations into the 2D-HOIP structure, we conducted afterglow and TL measurements. We confirmed our findings by using TL measurements, which revealed the presence of trap states within the 2D-HOIP crystals in all samples. The fittings results of the TL curves are displayed in Figure S4, and the parameters of these fittings are displayed in Table S3. (PEA)2PbBr4 features a trap at the maximum of the peak at 44 K with a trap depth and trap concentration of 0.11 eV and 60 arbitrary units (au), respectively. Several traps at 0.12, 0.14, 0.27, and 0.34 eV are observed for (PEA1.5BZA0.5)PbBr4. However, (PEABZA)PbBr4 features less pronounced traps with a small trap width of 0.021 eV and the lowest trap concentration of 30 au compared to the other samples. After exposing our 2D-HOIP crystals to X-rays, we evaluated the residual scintillation response. This exposure occurred in the saturated regime of the scintillation response, and it lasted for 10 min at a temperature of 10 K, aligning with the plateau identified in Figure S5. The parameters governing the exponential decay of the afterglow are detailed in Table S4. With the effect of dual-cations of the 2D-HOIP crystals, the afterglow decay time is observed to increase for both (PEA1.5BZA0.5)PbBr4 and (PEABZA)PbBr4. (PEA)2PbBr4 and (PEABZA)PbBr4 feature biexponential decays of the afterglow with average decay times of 22.3 ± 2.2 and 22.8 ± 2.3 s, respectively. (PEA1.5BZA0.5)PbBr4 and (PEA)2PbBr4, on the other hand, exhibit triexponential decays with average decay times of 58.2 ± 5.8 and 50.1 ± 5.0 s, respectively. (PEA1.5BZA0.5)PbBr4 also shows a prolonged afterglow, with an average fastest decay component lasting for 53.6 ± 5.4 s. Therefore, it is evident that the incorporation of BZA with PEA results in two significant effects: a decrease in decay times and the emergence of a more intricate decay pattern. The augmentation in decay time and the appearance of an extra exponential component can likely be attributed to the introduction of shallow energy traps for the charge carriers, which are induced by the presence of BZA. These shallow traps serve a dual purpose: they either facilitate radiative recombination of the charge carriers or, due to their shallow nature, can be influenced by thermal phonons, potentially leading to charge carrier detrapping. Consequently, this phenomenon contributes to the deceleration of recombination processes within the 2D-HOIP crystals.16 This effect is more significant in (PEA1.5BZA0.5)PbBr4, suggesting that BZA introduces more shallow traps.
Figure 5 shows the γ-ray scintillation decay curves of the 2D-HOIP crystals. The fittings of the exponential decay curves are presented in Table S5. Similarly as in the case of PL decay curves, also at high γ-ray energies, the introduction of BZA to PEA results in faster scintillation decay. Both dual-cation samples show faster average decay times compared to single-cation samples. On the other hand, (BZA)2PbBr4 shows the fastest first component compared to other samples. The average decay times are 43.6 ± 4.4 and 33.4 ± 3.3 ns for (PEA1.5BZA0.5)PbBr4 and (PEABZA)PbBr4, respectively. The average decay times for (PEA1.5BZA0.5)PbBr4 and (PEABZA)PbBr4 are thus 34 and 49% faster compared to those of (PEA)2PbBr4 and 12 and 19% faster compared to those of (BZA)2PbBr4, respectively. The effect of the BZA induces shortening of the scintillation decay times, which is less than the corresponding effect of the TR-PL decay times due to the increase of the trap numbers with high-energy excitation, which is also confirmed by TL measurements, as shown in Figure S4.
Figure 5.

Scintillation decay curves excited by γ-rays at 662 keV and RT with their fitting curves with three exponential decay models for (PEA)2PbBr4, (PEA1.5BZA0.5)PbBr4, (PEABZA)PbBr4, and (BZA)2PbBr4. The white solid line indicates the fitting of the decay curves.
Figure 6a shows the pulse height spectra (PHS) for all measured samples using 59.5 keV (241Am) γ-ray sources. The LYs of PEA-and BZA-based HOIPs are 14.2 ± 1.4 and 10.6 ± 1.1 ph/keV, respectively; the mix (PEA2-xBZAx)PbBr4 (from x = 0.1 to x = 2) samples have comparatively lower (<10 ph/keV) LYs. The highest LY of 14.9 ± 1.5 ph/keV is observed for 5% BZA concentration, which is 5% higher than that for (PEA)2PbBr4, and the measured LY values for all samples are summarized in Table S6. The LY gradually decreases from 5% as the BZA concentration increases, and the minimum LY is observed at 50% BZA concentration, as shown in Figure 6b. In this study, the LY of (BZA)2PbBr4 (10.6 ± 1.1 photons/keV) is approximately 43% larger than in the previous reported value of 6 photons/keV.13 The enhancement in LY could be associated with an enhancement in the crystallinity of the (BZA)2PbBr4 sample, resulting in better resistivity against moisture. An additional PHS measured with 662 keV (137Cs) γ-ray source for (BZA)2PbBr4 sample shows the best energy resolution, as shown in Figure S6.
Figure 6.
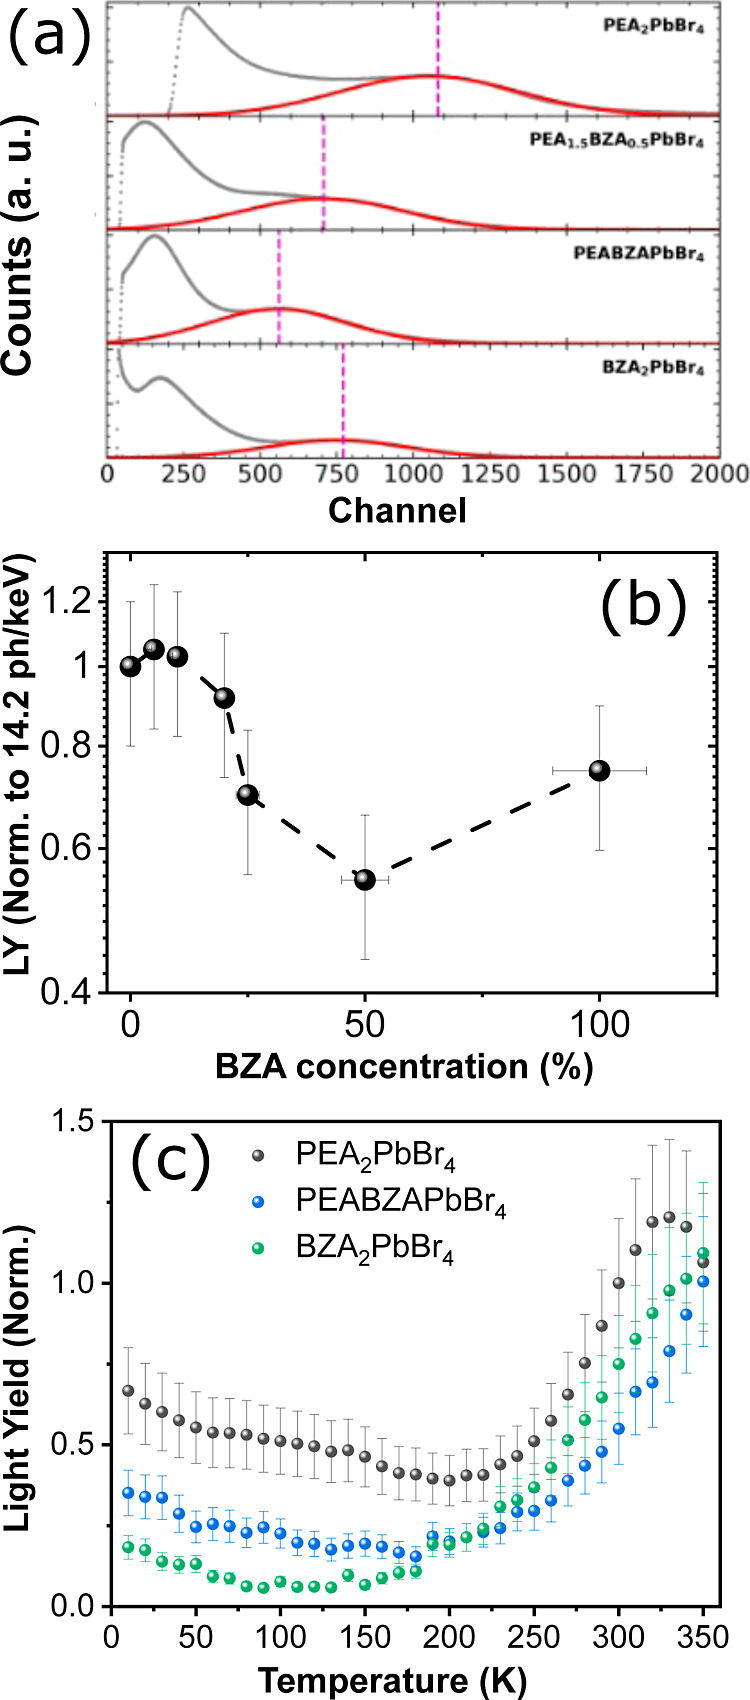
(a) Pulse height spectra (PHS) with 59.5 keV (241Am) γ-ray sources for (PEA)2PbBr4, (PEA1.5BZA0.5)PbBr4, (PEABZA)PbBr4, and (BZA)2PbBr4. The dotted line indicates the positions of the full-energy peak, and the red line shows the related Gaussian fits, (b) BZA concentration vs LY, normalized to the LY of (PEA)2PbBr4, and (c) temperature-dependent LY changes, normalized to the LY of (PEA)2PbBr4 at 300 K obtained with PHS and then derived using integrated RL intensities under 45 keV X-ray excitation for (PEA)2PbBr4, (PEA1.5BZA0.5)PbBr4, (PEABZA)PbBr4, and (BZA)2PbBr4 at 300 K.
To discuss in detail the decrease of LY at high BZA concentrations, we relate the LY with the optical properties obtained in the early investigation.26 As the band gap increases with BZA content, the LY decreases according to the equation, LYcalc ≈ S·QY/Eg, where Eg is the band gap, S is the charge transport parameter, QY is the quantum yield derived from the absorbance, refractive index, and PL spectra recorded with the integrating sphere of crystals, as shown in Figure S7.31,39 Those parameters and the experimental LY values (LYexp) are compiled in Table 2. Yet, in practical applications, the increase in LY may not show linear behavior with the band gap decrease, as cations could influence the quantum yield and charge transport within the material.26 For QY, the decrease occurs in tandem with the increase in BZA concentration, and this effect can be anticipated due to the reduction in refractive index;40 see Table S7. Using the QYs, it is noted that the highest LYcalc value in ph/keV range surpasses its LYexp, a pattern consistently observed in other studies on scintillation.13 Despite having a relatively lower QY compared to the other samples, the highest S was observed at (60.77 ± 6.08). The trend of a more efficient S in contrast to a less efficient QY suggests that defects play a crucial role in inducing transport.41−43
Table 2. Quantum Yield (QY)a at RT, Calculated LY (LYcalc), Experimental LY (LYexp) Measured at 300 K, and Electron–Hole Transfer Efficiency (S).
| compounds | QY (%) | LYcalc (S = 1) (ph/keV) | LYexp (ph/keV) | S (%) |
|---|---|---|---|---|
| (PEA)2PbBr4 | 38.2 ± 3.8 | 56.1 ± 5.6 | 14.2 ± 1.4 | 27.51 ± 2.75 |
| (PEA1.5BZA0.5)PbBr4 | 12.3 ± 1.2 | 17.7 ± 1.8 | 9.9 ± 1.0 | 60.77 ± 6.08 |
| (PEABZA)PbBr4 | 10.7 ± 1.1 | 15.3 ± 1.5 | 7.8 ± 0.8 | 55.09 ± 5.51 |
| (BZA)2PbBr4 | 19.3 ± 1.9 | 27.2 ± 2.7 | 10.6 ± 1.1 | 42.29 ± 4.23 |
Moreover, we measured PHS to obtain the LYexp derived from integrated RL intensities as a function of temperature, as shown in Figure 6c. We chose RT PHS data to assess the temperature dependence of the RL light yield, taking into account considerations of realism, practicality, applicability to diverse fields, and convenience of experimentation. Based on our measurements, we note a slight decline in LY from 10 K, reaching a nadir between 100 and 190 K, followed by an increase, which persists up to the highest temperature recorded. A similar trend is observed for (PEA)2PbBr4, with a decrease from 10 K to a minimum of about 190 K, then increases, continuing to rise to a maximum at 330 K, and then the LY starts to decrease again. Nevertheless, whereas the majority of materials exhibiting NTQ typically achieve their peak LY within the range of 100–200 K, our measured samples demonstrate their maximum LY at significantly higher temperatures. This characteristic renders this 2D-HOIP device particularly appealing for applications requiring operation at RT and elevated temperatures. We fitted the temperature-dependent LY using an analytical Shibata model37 for (PEA)2PbBr4, (PEABZA)PbBr4, and (BZA)2PbBr4, as shown in Figure S8. The fitting procedures are elaborated upon in the Supporting Information, and the fitting parameters are summarized in Table S8. We note that (PEABZA)PbBr4 leads to a decrease in the typical thermal quenching activation energies, as shown in the proposed mechanism energy diagram in Figure S9. In (BZA)2PbBr4, we observe that the negative thermal quenching activation energies decrease, while the typical thermal quenching activation energy increases significantly. This results in a significant alteration in the NTQ behavior, with the minimum LY shifting toward lower temperatures.
Finally, X-ray imaging measurements were conducted and determined the modulation transfer function (MTF) of the measured samples. Figure S10a shows the photographs of the films prepared for X-ray imaging measurement (details of the preparation of the films are discussed in Supporting Information). Figure S10b shows the X-ray imaging of the best (PEA1.9BZA0.1)PbBr4 sample, and the inset graph represents the normalized counts of Fourier transform of the line spread function vs BZA concentration. The thickness (∼200 μm thick) remains nearly consistent across all samples to mitigate the influence of varying multiple light scattering.44 The luminescence (blue emission) was obtained under UV-light for all measured samples, as shown in Figure S10c. To achieve a more objective quantification of the imaging capabilities of our samples, we carried out MTF measurements of our samples, as shown in Figure S10d, and compared them to CsPbBr3 nanocrystal and commercial Gadox (Gd2O2S:Tb) layer samples; see Table S9. There is a similar trend among the light yield, the intensity of the X-ray imaging, and the resolution of all measured samples. The best resolution is obtained from PEA1.9BZA0.1PbBr4, 5.78 lp/mm at 0.2 MTF, which is similar to that of CsPbBr3 quantum dots nanocrystals and commercial Gadox samples.45 So, our measured samples showcase promising potential for imaging applications, with the MTF closely resembling that of the commercial Gadox scintillator.45
Conclusions
In summary, we have investigated the effect of PEA and BZA cations on the crystal structure and optical and scintillation properties of (PEA2-xBZAx)PbBr4 (from x = 0.1 to x = 2). (BZA)2PbBr4 exhibits the largest Stokes shift of 0.06 eV among all samples accompanied by a faster PL decay time of 0.9 ns, and a competitive high LY of 10.6 ± 1.1 ph/keV compared to the highest reported value of 6 ph/keV at RT. However, (PEABZA)PbBr4 exhibits a fast scintillation decay time of 33.4 ± 3.3 ns, the lowest typical thermal quenching activation energy of >1 meV, which implies that a comparatively lower amount of energy is needed to induce luminescence. We observed a majority of the fast component scintillation decay time (>70%) for dual-organic cation crystals compared to single-cation PEA or BZA crystals (<20%), which is beneficial for the scintillating process. Temperature-dependent RL measurements conducted across all samples indicate a reduction in scintillation emission attributed to thermal quenching. In addition, dual-cation HOIPs enhance the efficiency of electron–hole transfer by up to 60%. The highest LY of 14.9 ± 1.5 ph/keV is observed for 5% BZA concentration, and the minimum LY is observed at 50% BZA concentration. However, such a 5% concentration trend is similarly reported for Li- and Rb-doped (PEA)2PbBr4 crystals.16,46 We can expand this study further into different cations, while the strategy described in this work can be expected to facilitate the advancement of dual-organic-cation HOIP scintillators for radiation detection applications.
Materials and Methods
Materials
Dimethyl sulfoxide (DMSO, anhydrous), phenethylammonium bromide ((PEA)Br, ≥98%), benzylammonium bromide ((BZA)Br, ≥98%), and lead bromide (PbBr2, ≥98%) were purchased from Sigma-Aldrich. Diethyl ether (99.5%) was purchased from POCH BASIC. All of these chemicals were used without any further purification.
Synthesis of Crystals
Single or mixed dual-cation crystals of A2PbBr4 (A = PEA or BZA) were synthesized using a modified version of the previously reported method.12,46,47 A precursor solution with 3 M concentration was prepared by dissolving (BZA)Br or (PEA)Br and PbBr2 in stoichiometric amounts in DMSO under stirring at 100 °C for 2 h. Crystals were obtained by slowly evaporating DMSO from a 3 M precursor solution in an ambient environment; this process could take a few weeks. Subsequently, the crystal precipitate was washed with diethyl ether and dried under vacuum at 40 °C for 24 h. The obtained perovskite crystals were kept in a glovebox under an inert atmosphere for future characterization.
X-ray Diffraction
A Bruker D8 Advance AXS diffractometer was used for acquiring the powder X-ray diffraction (XRD) spectra of the synthesized compounds. The device used Cu Kα radiation with a 1.5418 Å wavelength. Measurements were conducted at RT, under Bragg–Brentano geometry, a 5 s/step scanning velocity, and a 0.02° step size. FullProf Suite software was then used to analyze the acquired data. The diffraction patterns were recorded after aligning the crystal in the range of 3 to 65°.
PL, TRPL, and Absorption
For PL measurements, the samples were excited with the use of a picosecond laser diode with the repetition rate of 30 MHz and a 375 nm wavelength. A microscopic objective facilitated excitation focusing and signal collection. The filtered PL signal was captured by using a high-sensitivity visible light spectrometer. In TRPL measurements, the repetition rate was lowered to 10 MHz, and the emission signal, filtered through a band-pass filter of 532 ± 25 nm, was directed to a single-photon avalanche photodiode (APD). Time-correlated single-photon counting electronics was used to analyze the timing response. A Tungsten Halogen light source (Ocean Optics LS-1) and the same visible light spectrometer as for the PL experiments were used to measure the absorption spectra of the samples in transmission mode. All measurements were conducted at RT, and instruments setup was the same as previously reported.11
RL, TL, and Afterglow Curves
The details of the RL, TL, and afterglow measurements setup and the measurement parameters are reported in a previous study.11 TL glow curves were measured from 10 to 350 K by increasing the temperature, with a 0.14 K/s heating rate. Finally, the RL signal was measured from 350 to 10 K by cooling the sample. Measurement started from the highest temperature to avoid the thermal release of charge carriers that could possibly contribute to the emission yield.
Pulse Height and Scintillation Decay Measurements
The details of the pulse height and scintillation decay measurements were previously reported.16 In the pulse height spectrum, the location of the full-energy peak was juxtaposed with the mean value position of the single-electron response to determine the photoelectron yield. The actual LY for the radiation conversion, expressed in photons per MeV, was derived by accounting for the spectral alignment of the sample luminescence with the characteristics of the photomultiplier tube. Scintillation decay measurements were conducted using the delayed coincidence single photon counting method.10 No Viscasil grease was used during the measurements to prevent the deterioration of the samples.
DFT Calculations
The first-principles DFT calculations were conducted using the Vienna ab initio simulation package48 that uses the projector augmented wave type of pseudopotential for describing the interaction between valence electrons and ion cores.49 We employed the generalized gradient approximation (GGA) based on the Perdew–Burke–Ernzerhof (PBE) functional to account for the exchange–correlation interactions among the electrons.50 A Hubbard U parameter of 2 eV was introduced to consider the partially filled p-orbitals of the Pb atoms.51 The wave functions were expanded using a plane wave basis set with a cutoff energy of 500 eV. A convergence criterion of 1 × 10⁻⁶ eV was applied between successive SCF steps for electronic convergence. Full relaxation of the structures is permitted until the force exerted on each atom falls below 0.01 eV/Å between any two successive ionic steps. The Γ-centered k-point grids of 1 × 5 × 5 and 3 × 3 × 3 are used for the integration of Brillouin zones for the BA2PbBr4 and (PEA)2PbBr4 structures, respectively. The van der Waals corrections are included by the DFT-D3 method.52
Acknowledgments
F.M. and C.D. acknowledge financial support from the Ministry of Education (Singapore), under its AcRF Tier 2 grant (MOET2EP50121-0012). T.D.R. acknowledges support from the National Science Foundation CAREER award under Grant No 2044842. This research were funded by the National Science Center, Poland, under grant MINIATURA no. 2022/06/X/ST5/00369 and OPUS-24 no. 2022/47/B/ST5/01966.
Glossary
Abbreviations
- HOIP
hybrid organic–inorganic perovskites
- 2D
two-dimensional
- PEA
phenethylamine
- BZA
benzylamine
- RT
room temperature
- XRD
X-ray diffraction
- DOS
density of states
- DFT
density functional theory
- PL
photoluminescence
- TRPL
time-resolved PL
- RL
radioluminescence
- NTQ
negative thermal quenching
- TL
thermoluminescence
Supporting Information Available
The Supporting Information is available free of charge at https://pubs.acs.org/doi/10.1021/acsami.4c01741.
Rietveld refinements of crystal XRD, crystal parameters and properties, absorption spectra with Elliot fits, afterglow curves, glow curve fits, pulse height spectra at 662 keV (137Cs) γ-ray sources for (BZA)2PbBr4, PL spectra recorded with integrating sphere of crystals, calculated QY, and scintillation decay parameters at 661.7 keV (137Cs) (PDF)
Crystal structure of (PEA)2PbBr4 (CIF)
Crystal structure of (PEA1.5BZA0.5)PbBr4 (CIF)
Crystal structure of (PEABZA)PbBr4 (CIF)
Crystal structure of (BZA)2PbBr4 (CIF)
Author Contributions
M.A.K.S.: Methodology, formal analysis, investigation, conceptualization, writing-original draft, and writing-review and editing; D.K., M.M., S.M., F.M., R.J., R.B., T.D.R., M.E.W., K.J.D., W.D., C.D.: Formal analysis, investigation, and writing-review and editing; M.D.B.: Conceptualization, supervision, resources, writing-review and editing, project administration, and funding acquisition. All authors have read and agreed to the published version of the manuscript.
The authors declare no competing financial interest.
Supplementary Material
References
- Su B.; Jin J.; Han K.; Xia Z. Ceramic wafer scintillation screen by utilizing near-unity blue-emitting lead-free metal halide (C8H20N)2Cu2Br4. Adv. Funct. Mater. 2023, 33 (5), 2210735. 10.1002/adfm.202210735. [DOI] [Google Scholar]
- Han K.; Sakhatskyi K.; Jin J.; Zhang Q.; Kovalenko M. V.; Xia Z. Seed-crystal-induced cold sintering toward metal halide transparent ceramic scintillators. Adv. Mater. 2022, 34 (17), 2110420. 10.1002/adma.202110420. [DOI] [PubMed] [Google Scholar]
- Wibowo A.; Sheikh M. A. K.; Diguna L. J.; Ananda M. B.; Marsudi M. A.; Arramel A.; Zeng S.; Wong L. J.; Birowosuto M. D. Development and challenges in perovskite scintillators for high-resolution imaging and timing applications. Commun. Mater. 2023, 4 (1), 21. 10.1038/s43246-023-00348-5. [DOI] [Google Scholar]
- Ye W.; Yong Z.; Go M.; Kowal D.; Maddalena F.; Tjahjana L.; Wang H.; Arramel A.; Dujardin C.; Birowosuto M. D.. The nanoplasmonic purcell effect in ultrafast and high-light-yield perovskite scintillators Adv. Mater., Published Online: Jan 18, 2024, [Online early access] 10.1002/adma.202309410 [DOI] [PubMed]
- Subagyo R.; Maulida Y. D.; Kowal D.; Hartati S.; Muslimawati R. M.; Zetra Y.; Diguna L. J.; Akhlus S.; Mahyuddin M. H.; Zhang L.; et al. Spectroscopic evidence of localized small polarons in low-dimensional ionic liquid lead-free hybrid perovskites. ACS Appl. Mater. Interfaces 2023, 15 (47), 54677–54691. 10.1021/acsami.3c12889. [DOI] [PubMed] [Google Scholar]
- Blancon J.-C.; Stier A. V.; Tsai H.; Nie W.; Stoumpos C. C.; Traoré B.; Pedesseau L.; Kepenekian M.; Katsutani F.; et al. Scaling law for excitons in 2D perovskite quantum wells. Nat. Commun. 2018, 9 (1), 2254. 10.1038/s41467-018-04659-x. [DOI] [PMC free article] [PubMed] [Google Scholar]
- Bokdam M.; Sander T.; Stroppa A.; Picozzi S.; Sarma D. D.; Franchini C.; Kresse G. Role of polar phonons in the photo excited state of metal halide perovskites. Sci. Rep. 2016, 6, 28618. 10.1038/srep28618. [DOI] [PMC free article] [PubMed] [Google Scholar]
- Chen X.; Zhou H.; Wang H. 2D/3D halide perovskites for optoelectronic devices. Front. Chem. 2021, 9, 715157. 10.3389/fchem.2021.715157. [DOI] [PMC free article] [PubMed] [Google Scholar]
- Yang Y.; Gao F.; Gao S.; Wei S.-H. Origin of the stability of two-dimensional perovskites: a first-principles study. J. Mater. Chem. A 2018, 6, 14949–14955. 10.1039/C8TA01496E. [DOI] [Google Scholar]
- Xie A.; Maddalena F.; Witkowski M. E.; Makowski M.; Mahler B.; Drozdowski W.; Springham S. V.; Coquet P.; Dujardin C.; Birowosuto M. D.; et al. Library of two-dimensional hybrid lead halide perovskite scintillator crystals. Chem. Mater. 2020, 32 (19), 8530–8539. 10.1021/acs.chemmater.0c02789. [DOI] [Google Scholar]
- Kowal D.; Makowski M.; Witkowski M.; Cala’ R.; Kuddus Sheikh M.; Mahyuddin M. H.; Auffray E.; Drozdowski W.; Cortecchia D.; Birowosuto M. D. PEA2PbI4: Fast two-dimensional lead iodide perovskite scintillator with green and red emission. Mater. Today Chem. 2023, 29, 101455. 10.1016/j.mtchem.2023.101455. [DOI] [Google Scholar]
- Sheikh M. A. K.; Kowal D.; Mahyuddin M. H.; Cala’ R.; Auffray E.; Witkowski M. E.; Makowski M.; Drozdowski W.; Wang H.; Dujardin C.; et al. A2Bn-1PbnI3n+1 (A = BA, PEA; B = MA, n = 1, 2): Engineering quantum-well crystals for high mass density and fast scintillators. J. Phys. Chem. C 2023, 127 (22), 10737–10747. 10.1021/acs.jpcc.3c00824. [DOI] [PMC free article] [PubMed] [Google Scholar]
- Maulida P. Y. D.; Hartati S.; Kowal D.; Diguna L. J.; Kuddus Sheikh M. A.; Mahyuddin M. H.; Mulyani I.; Onggo D.; Maddalena F.; Bachiri A.; et al. Organic chain length effect on trap states of lead halide perovskite scintillators. ACS Appl. Energy Mater. 2023, 6 (11), 5912–5922. 10.1021/acsaem.3c00340. [DOI] [Google Scholar]
- Diguna L. J.; Jonathan L.; Mahyuddin M. H.; Arramel; Maddalena F.; Mulyani I.; Onggo D.; Bachiri A.; Witkowski M. E.; Makowski M.; et al. BA2XBr4 (X = Pb, Cu, Sn): from lead to lead-free halide perovskite scintillators. Mater. Adv. 2022, 3 (12), 5087–5095. 10.1039/D2MA00258B. [DOI] [Google Scholar]
- Sheikh M. A. K.; Kowal D.; Mahyuddin M. H.; Onggo D.; Maddalena F.; Dang C.; Cala’ R.; Auffray E.; Witkowski M. E.; Makowski M.; et al. Solution-processable A2XY4 (A = PEA, BA; X= Pb, Sn, Cu, Mn; Y = Cl, Br, I) crystals for high light yield and ultrafast scintillators. IEEE Trans. Nucl. Sci. 2023, 70 (7), 1384–1391. 10.1109/TNS.2023.3267636. [DOI] [Google Scholar]
- Maddalena F.; Mahyuddin M. H.; Kowal D.; Witkowski M. E.; Makowski M.; Kuddus Sheikh M. A.; Mahato S.; Jȩdrzejewski R.; Drozdowski W.; Dujardin C.; Dang C.; Birowosuto M. D. Lattice expansion in Rb-doped hybrid organic-inorganic perovskite crystals resulting in smaller band-gap and higher light-yield scintillators. Inorg. Chem. 2023, 62 (23), 8892–8902. 10.1021/acs.inorgchem.3c00270. [DOI] [PMC free article] [PubMed] [Google Scholar]
- van Blaaderen J. J.; van der Sar S.; Onggo D.; Sheikh M. A. K.; Schaart D. R.; Birowosuto M. D.; Dorenbos P. (BZA)2PbBr4: A potential scintillator for photon-counting computed tomography detectors. J. Lumin. 2023, 263, 120012. 10.1016/j.jlumin.2023.120012. [DOI] [Google Scholar]
- Jeon N. J.; Noh J. H.; Yang W. S.; Kim Y. C.; Ryu S.; Seo J.; Seok S. I. Compositional engineering of perovskite materials for high-performance solar cells. Nature 2015, 517, 476–480. 10.1038/nature14133. [DOI] [PubMed] [Google Scholar]
- Li Z.; Yang M.; Park J.-S.; Wei S.-H.; Berry J. J.; Zhu K. Stabilizing perovskite structures by tuning tolerance factor: formation of formamidinium and cesium lead iodide solid-state alloys. Chem. Mater. 2016, 28 (1), 284–292. 10.1021/acs.chemmater.5b04107. [DOI] [Google Scholar]
- Forlano K. M.; Roy C. R.; Mihalyi-Koch W.; Hossain T.; Sanders K.; Guzei I.; Graham K. R.; Wright J. C.; Jin S. High layer number (n = 1–6) 2D Ruddlesden-Popper lead bromide perovskites: nanosheets, crystal structure, and optoelectronic properties. ACS Mater. Lett. 2023, 5, 2913–2921. 10.1021/acsmaterialslett.3c00809. [DOI] [Google Scholar]
- Xiao M.; Zhao L.; Wei S.; Li Y.; Dong B.; Xu Z.; Wan L.; Wang S. Application of mixed-organic-cation for high performance hole conductor-free perovskite solar cells. J. Colloid Interface Sci. 2018, 510, 118–126. 10.1016/j.jcis.2017.09.056. [DOI] [PubMed] [Google Scholar]
- Choi W.-G.; Na S.; Park C.-G.; Moon T. Organic-cation-mixed (FA,MA)PbI3 through sequential vapor growth for planar perovskite solar cells. Sol. Energy 2019, 178, 56–60. 10.1016/j.solener.2018.11.061. [DOI] [Google Scholar]
- Chen J.; Xu J.; Xiao L.; Zhang B.; Dai S.; Yao J. Mixed-organic-cation (FA)x(MA)1-xPbI3 planar perovskite solar cells with 16.48% efficiency via a low-pressure vapor-assisted solution process. ACS Appl. Mater. Interfaces 2017, 9, 2449–2458. 10.1021/acsami.6b13410. [DOI] [PubMed] [Google Scholar]
- Qiu F.-Z.; Li M.-H.; Wang S.; Sun J.-Y.; Jiang Y.; Qi J.-J.; Hu J.-S. Regulating the crystalline phase of intermediate films enables FA1-xMAxPbI3 perovskite solar cells with efficiency over 22%. J. Mater. Chem. A 2021, 9, 24064–24070. 10.1039/D1TA06410J. [DOI] [Google Scholar]
- Wu C.; Guo D.; Li P.; Wang S.; Liu A.; Wu F. A study on the effects of mixed organic cations on the structure and properties in lead halide perovskites. Phys. Chem. Chem. Phys. 2020, 22, 3105–3111. 10.1039/C9CP06182G. [DOI] [PubMed] [Google Scholar]
- Jung M.-H. White-light emission from the structural distortion induced by control of halide composition of two-dimensional perovskites ((C6H5CH2nH3)2PbBr4-xclx). Inorg. Chem. 2019, 58, 6748–6757. 10.1021/acs.inorgchem.9b00145. [DOI] [PubMed] [Google Scholar]
- Du K.-Z.; Tu Q.; Zhang X.; Han Q.; Liu J.; Zauscher S.; Mitzi D. B. Two-dimensional lead(ii) halide-based hybrid perovskites templated by acene alkylamines: crystal structures, optical properties, and piezoelectricity. Inorg. Chem. 2017, 56, 9291–9302. 10.1021/acs.inorgchem.7b01094. [DOI] [PubMed] [Google Scholar]
- Dhanabalan B.; Leng Y.-C.; Biffi G.; Lin M.-L.; Tan P.-H.; Infante I.; Manna L.; Arciniegas M. P.; Krahne R. Directional anisotropy of the vibrational modes in 2D-layered perovskites. ACS Nano 2020, 14, 4689–4697. 10.1021/acsnano.0c00435. [DOI] [PMC free article] [PubMed] [Google Scholar]
- Grüning M.; Marini A.; Rubio A. Density functionals from many-body perturbation theory: the band gap for semiconductors and insulators. J. Chem. Phys. 2006, 124 (15), 154108. 10.1063/1.2189226. [DOI] [PubMed] [Google Scholar]
- Mori-Sánchez P.; Cohen A. J.; Yang W. Localization and delocalization errors in density functional theory and implications for band-gap prediction. Phys. Rev. Lett. 2008, 100 (14), 146401. 10.1103/PhysRevLett.100.146401. [DOI] [PubMed] [Google Scholar]
- Maddalena F.; Tjahjana L.; Xie A.; Arramel; Zeng S.; Wang H.; Coquet P.; Drozdowski W.; Dujardin C.; et al. Inorganic, organic, and perovskite halides with nanotechnology for high-light yield X- and γ-ray scintillators. Crystals 2019, 9 (2), 88. 10.3390/cryst9020088. [DOI] [Google Scholar]
- Kawano N.; Koshimizu M.; Okada G.; Fujimoto Y.; Kawaguchi N.; Yanagida T.; Asai K. Scintillating organic-inorganic layered perovskite-type compounds and the gamma-ray detection capabilities. Sci. Rep. 2017, 7 (1), 14754. 10.1038/s41598-017-15268-x. [DOI] [PMC free article] [PubMed] [Google Scholar]
- Kawano N.; Koshimizu M.; Horiai A.; Nishikido F.; Haruki R.; Kishimoto S.; Shibuya K.; Fujimoto Y.; Yanagida T.; Asai K. Effect of organic moieties on the scintillation properties of organic-inorganic layered perovskite-type compounds. Jpn. J. Appl. Phys. 2016, 55, 110309. 10.7567/JJAP.55.110309. [DOI] [Google Scholar]
- Zhou Y.; Chen J.; Bakr O. M.; Mohammed O. F. Metal halide perovskites for X-ray imaging scintillators and detectors. ACS Energy Lett. 2021, 6 (2), 739–768. 10.1021/acsenergylett.0c02430. [DOI] [Google Scholar]
- Gandini M.; Villa I.; Beretta M.; Gotti C.; Imran M.; Carulli F.; Fantuzzi E.; Sassi M.; Zaffalon M.; Brofferio C.; et al. Efficient, fast and reabsorption-free perovskite nanocrystal-based sensitized plastic scintillators. Nat. Nanotechnol. 2020, 15 (6), 462–468. 10.1038/s41565-020-0683-8. [DOI] [PubMed] [Google Scholar]
- Lian L.; Zheng M.; Zhang W.; Yin L.; Du X.; Zhang P.; Zhang X.; Gao J.; Zhang D.; Gao L.; et al. Efficient and reabsorption-free radioluminescence in Cs3Cu2I5 nanocrystals with self-trapped excitons. Adv. Sci. 2020, 7 (11), 2000195. 10.1002/advs.202000195. [DOI] [PMC free article] [PubMed] [Google Scholar]
- Shibata H. Negative thermal quenching curves in photoluminescence of solids. Jpn. J. Appl. Phys. 1998, 37, 550. 10.1143/JJAP.37.550. [DOI] [Google Scholar]
- Zhai W.; Ge C.; Fang X.; Zhang K.; Tian C.; Yuan K.; Sun S.; Li Y.; Chen W.; Ran G. Acetone vapour-assisted growth of 2D single-crystalline organic lead halide perovskite microplates and their temperature-enhanced photoluminescence. RSC Adv. 2018, 8, 14527–14531. 10.1039/C8RA00583D. [DOI] [PMC free article] [PubMed] [Google Scholar]
- Birowosuto M. D.; Cortecchia D.; Drozdowski W.; Brylew K.; Lachmanski W.; Bruno A.; Soci C. X-ray scintillation in lead halide perovskite crystals. Sci. Rep. 2016, 6 (1), 37254. 10.1038/srep37254. [DOI] [PMC free article] [PubMed] [Google Scholar]
- Ali M. L.; Khan M.; Al Asad M. A.; Rahaman M. Z. Highly efficient and stable lead-free cesium copper halide perovskites for optoelectronic applications: A DFT based study. Heliyon 2023, 9, e18816 10.1016/j.heliyon.2023.e18816. [DOI] [PMC free article] [PubMed] [Google Scholar]
- Yao Q.; Li J.; Li X.; Zheng X.; Wang Z.; Tao X. High-quality Cs3Cu2I5 single-crystal is a fast-decaying scintillator. Adv. Opt. Mater. 2022, 10, 2201161. 10.1002/adom.202201161. [DOI] [Google Scholar]
- Liu B.; Sun Y.; Chen L.; Liao B.; Ruan J.; Zhou L.; Li Y.; Ouyang X. Cryogenic scintillation properties of lead-free Cs3Cu2I5 single crystals. Inorg. Chem. 2022, 61 (40), 16141–16147. 10.1021/acs.inorgchem.2c02582. [DOI] [PubMed] [Google Scholar]
- Birowosuto M. D.; Dorenbos P. Novel γ- and X-ray scintillator research: on the emission wavelength, light yield and time response of Ce3+ doped halide scintillators. Phys. Status Solidi A 2009, 206 (1), 9–20. 10.1002/pssa.200723669. [DOI] [Google Scholar]
- Cremer J. T.Radiation Imaging Systems and Performance. Neutron and X-ray Optics, 1st ed.; Elsevier, 2013; pp 1015–1052. [Google Scholar]
- Maddalena F.; Witkowski M. E.; Makowski M.; Bachiri A.; Mahler B.; Wong Y.-C.; Chua C. Y. E.; Lee J. X.; Drozdowski W.; Springham S. V.; et al. Stable and bright commercial CsPbBr3 quantum dot-resin layers for apparent X-ray imaging screen. ACS Appl. Mater. Interfaces 2021, 13 (49), 59450–59459. 10.1021/acsami.1c16171. [DOI] [PubMed] [Google Scholar]
- Maddalena F.; Xie A.; Arramel; Witkowski M. E.; Makowski M.; Mahler B.; Drozdowski W.; Mariyappan T.; Springham S. V.; Coquet P.; et al. Effect of commensurate lithium doping on the scintillation of two-dimensional perovskite crystals. J. Mater. Chem. C 2021, 9, 2504–2512. 10.1039/D0TC05647B. [DOI] [Google Scholar]
- Xie A.; Hettiarachchi C.; Maddalena F.; Witkowski M. E.; Makowski M.; Drozdowski W.; Arramel A.; Wee A. T. S.; Springham S. V.; Vuong P. Q.; et al. Lithium-doped two-dimensional perovskite scintillator for wide-range radiation detection. Commun. Mater. 2020, 1 (1), 37. 10.1038/s43246-020-0038-x. [DOI] [Google Scholar]
- Kresse G.; Furthmüller J. Efficient iterative schemes for ab initio total-energy calculations using a plane-wave basis set. Phys. Rev. B 1996, 54 (16), 11169–11186. 10.1103/PhysRevB.54.11169. [DOI] [PubMed] [Google Scholar]
- Blöchl P. E. Projector augmented-wave method. Phys. Rev. B 1994, 50 (24), 17953–17979. 10.1103/PhysRevB.50.17953. [DOI] [PubMed] [Google Scholar]
- Perdew J. P.; Ruzsinszky A.; Csonka G. I.; Vydrov O. A.; Scuseria G. E.; Constantin L. A.; Zhou X.; Burke K. Restoring the density-gradient expansion for exchange in solids and surfaces. Phys. Rev. Lett. 2008, 100 (13), 136406. 10.1103/PhysRevLett.100.136406. [DOI] [PubMed] [Google Scholar]
- Dudarev S. L.; Botton G. A.; Savrasov S. Y.; Humphreys C. J.; Sutton A. P. Electron-energy-loss spectra and the structural stability of nickel oxide: an LSDA+U study. Phys. Rev. B 1998, 57 (3), 1505–1509. 10.1103/PhysRevB.57.1505. [DOI] [Google Scholar]
- Grimme S.; Antony J.; Ehrlich S.; Krieg H. A consistent and accurate ab initio parametrization of density functional dispersion correction (DFT-D) for the 94 elements H-Pu. J. Chem. Phys. 2010, 132 (15), 154104. 10.1063/1.3382344. [DOI] [PubMed] [Google Scholar]
Associated Data
This section collects any data citations, data availability statements, or supplementary materials included in this article.